Angleton, TX Map & Demographics
Angleton Map
Angleton Overview
$39,040
PER CAPITA INCOME
$91,629
AVG FAMILY INCOME
$77,235
AVG HOUSEHOLD INCOME
34.9%
WAGE / INCOME GAP [ % ]
65.1¢/ $1
WAGE / INCOME GAP [ $ ]
$14,281
FAMILY INCOME DEFICIT
0.41
INEQUALITY / GINI INDEX
19,452
TOTAL POPULATION
9,310
MALE POPULATION
10,142
FEMALE POPULATION
91.80
MALES / 100 FEMALES
108.94
FEMALES / 100 MALES
37.4
MEDIAN AGE
3.0
AVG FAMILY SIZE
2.5
AVG HOUSEHOLD SIZE
9,562
LABOR FORCE [ PEOPLE ]
61.7%
PERCENT IN LABOR FORCE
2.4%
UNEMPLOYMENT RATE
Angleton Zip Codes
Angleton Area Codes
Income in Angleton
Income Overview in Angleton
Per Capita Income in Angleton is $39,040, while median incomes of families and households are $91,629 and $77,235 respectively.
| Characteristic | Number | Measure |
| Per Capita Income | 19,452 | $39,040 |
| Median Family Income | 5,181 | $91,629 |
| Mean Family Income | 5,181 | $107,691 |
| Median Household Income | 7,681 | $77,235 |
| Mean Household Income | 7,681 | $98,881 |
| Income Deficit | 5,181 | $14,281 |
| Wage / Income Gap (%) | 19,452 | 34.87% |
| Wage / Income Gap ($) | 19,452 | 65.13¢ per $1 |
| Gini / Inequality Index | 19,452 | 0.41 |
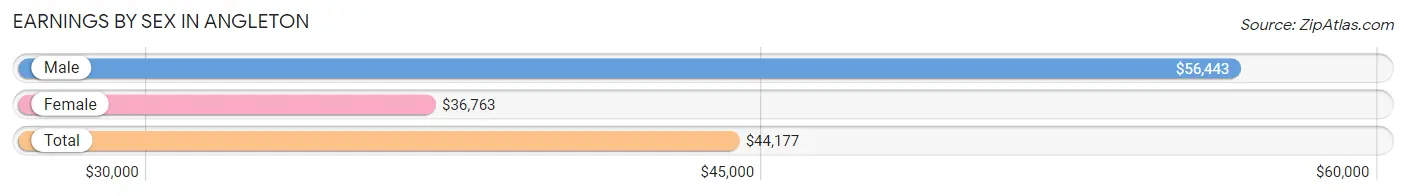
Earnings by Sex in Angleton
Average Earnings in Angleton are $44,177, $56,443 for men and $36,763 for women, a difference of 34.9%.
| Sex | Number | Average Earnings |
| Male | 5,265 (53.2%) | $56,443 |
| Female | 4,623 (46.8%) | $36,763 |
| Total | 9,888 (100.0%) | $44,177 |
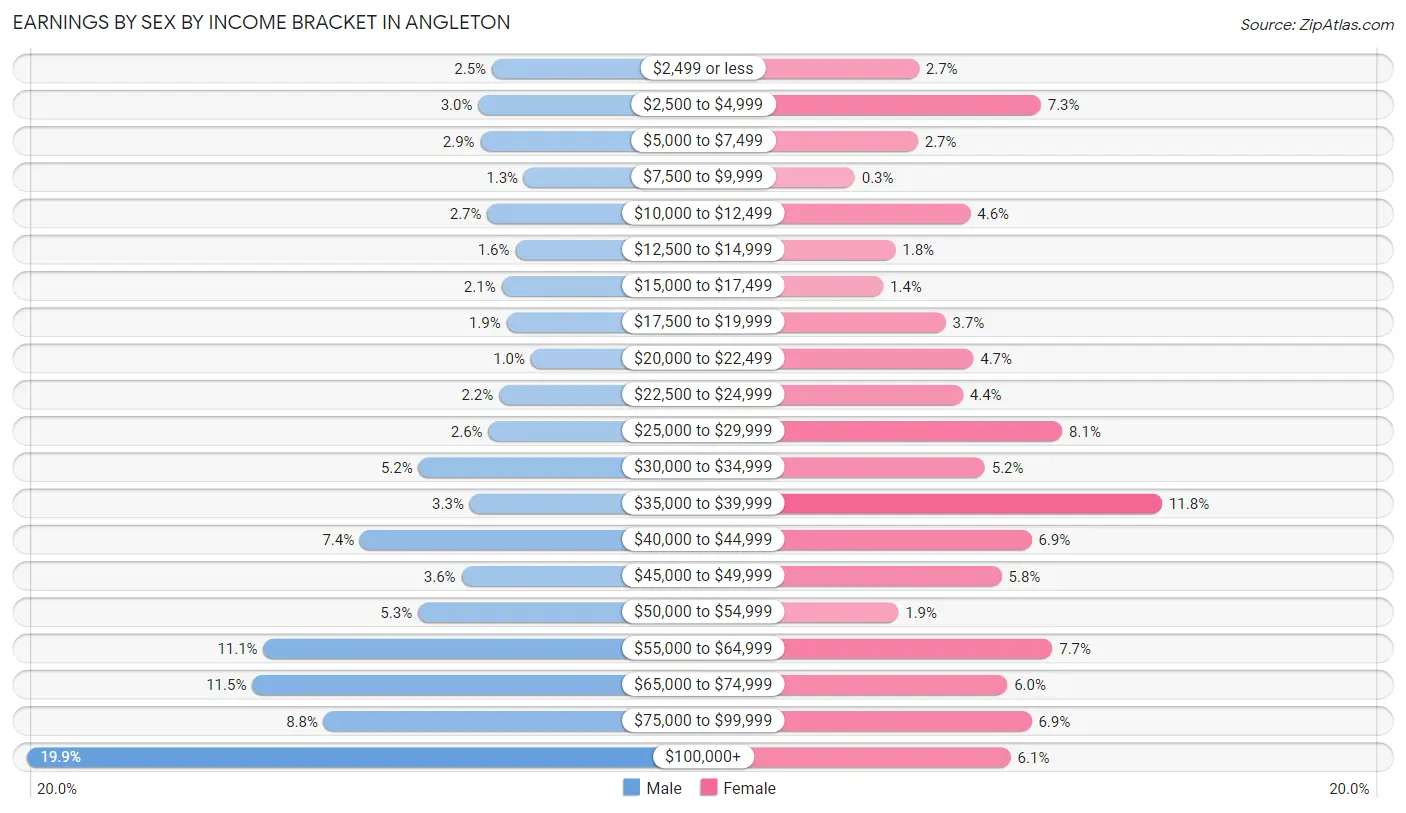
Earnings by Sex by Income Bracket in Angleton
The most common earnings brackets in Angleton are $100,000+ for men (1,047 | 19.9%) and $35,000 to $39,999 for women (546 | 11.8%).
| Income | Male | Female |
| $2,499 or less | 131 (2.5%) | 125 (2.7%) |
| $2,500 to $4,999 | 158 (3.0%) | 336 (7.3%) |
| $5,000 to $7,499 | 154 (2.9%) | 123 (2.7%) |
| $7,500 to $9,999 | 68 (1.3%) | 14 (0.3%) |
| $10,000 to $12,499 | 140 (2.7%) | 214 (4.6%) |
| $12,500 to $14,999 | 85 (1.6%) | 84 (1.8%) |
| $15,000 to $17,499 | 112 (2.1%) | 63 (1.4%) |
| $17,500 to $19,999 | 102 (1.9%) | 171 (3.7%) |
| $20,000 to $22,499 | 54 (1.0%) | 219 (4.7%) |
| $22,500 to $24,999 | 117 (2.2%) | 201 (4.3%) |
| $25,000 to $29,999 | 138 (2.6%) | 373 (8.1%) |
| $30,000 to $34,999 | 276 (5.2%) | 239 (5.2%) |
| $35,000 to $39,999 | 175 (3.3%) | 546 (11.8%) |
| $40,000 to $44,999 | 391 (7.4%) | 320 (6.9%) |
| $45,000 to $49,999 | 191 (3.6%) | 268 (5.8%) |
| $50,000 to $54,999 | 277 (5.3%) | 89 (1.9%) |
| $55,000 to $64,999 | 582 (11.1%) | 356 (7.7%) |
| $65,000 to $74,999 | 604 (11.5%) | 278 (6.0%) |
| $75,000 to $99,999 | 463 (8.8%) | 320 (6.9%) |
| $100,000+ | 1,047 (19.9%) | 284 (6.1%) |
| Total | 5,265 (100.0%) | 4,623 (100.0%) |
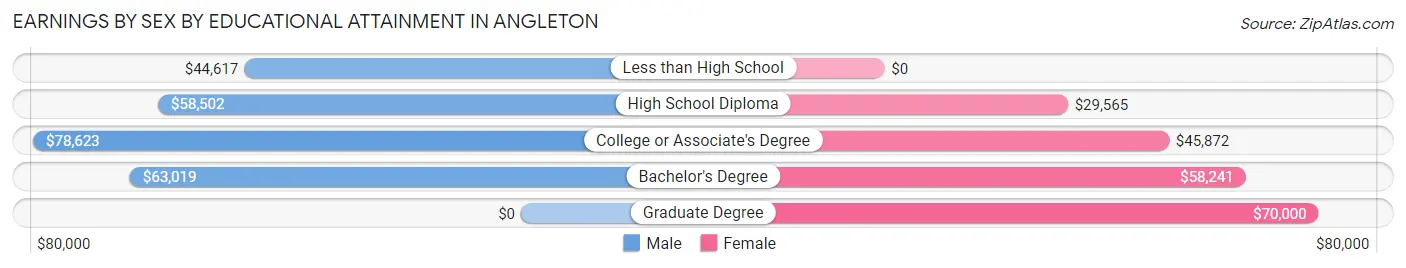
Earnings by Sex by Educational Attainment in Angleton
Average earnings in Angleton are $64,397 for men and $38,578 for women, a difference of 40.1%. Men with an educational attainment of college or associate's degree enjoy the highest average annual earnings of $78,623, while those with less than high school education earn the least with $44,617. Women with an educational attainment of graduate degree earn the most with the average annual earnings of $70,000, while those with high school diploma education have the smallest earnings of $29,565.
| Educational Attainment | Male Income | Female Income |
| Less than High School | $44,617 | $0 |
| High School Diploma | $58,502 | $29,565 |
| College or Associate's Degree | $78,623 | $45,872 |
| Bachelor's Degree | $63,019 | $58,241 |
| Graduate Degree | - | - |
| Total | $64,397 | $38,578 |
Family Income in Angleton
Family Income Brackets in Angleton
According to the Angleton family income data, there are 1,228 families falling into the $100,000 to $149,999 income range, which is the most common income bracket and makes up 23.7% of all families. Conversely, the $10,000 to $14,999 income bracket is the least frequent group with only 88 families (1.7%) belonging to this category.
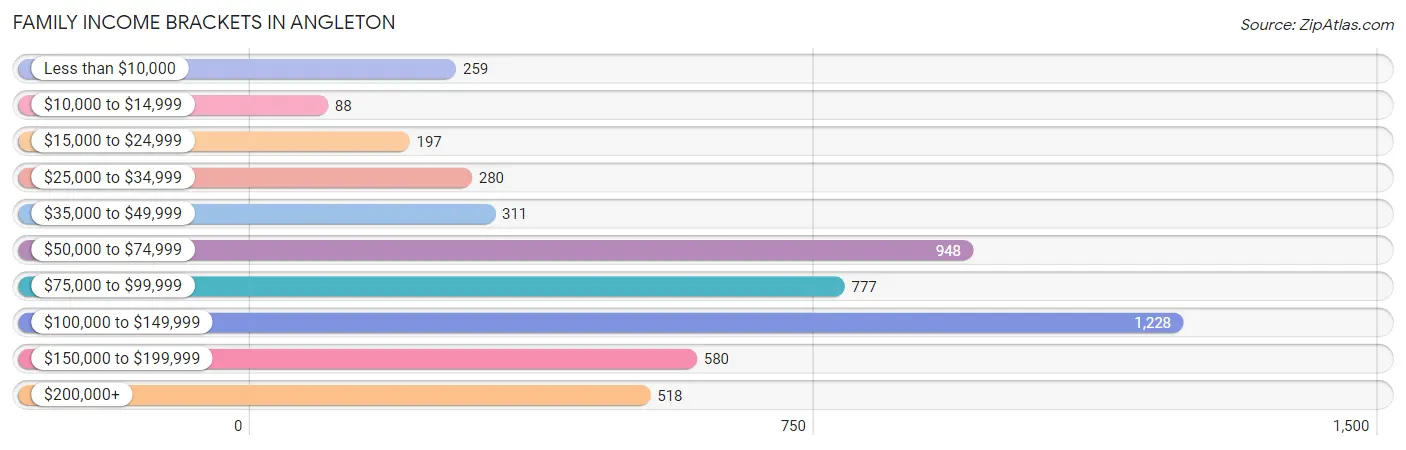
| Income Bracket | # Families | % Families |
| Less than $10,000 | 259 | 5.0% |
| $10,000 to $14,999 | 88 | 1.7% |
| $15,000 to $24,999 | 197 | 3.8% |
| $25,000 to $34,999 | 280 | 5.4% |
| $35,000 to $49,999 | 311 | 6.0% |
| $50,000 to $74,999 | 948 | 18.3% |
| $75,000 to $99,999 | 777 | 15.0% |
| $100,000 to $149,999 | 1,228 | 23.7% |
| $150,000 to $199,999 | 580 | 11.2% |
| $200,000+ | 518 | 10.0% |
Family Income by Famaliy Size in Angleton
6-person families (127 | 2.5%) account for the highest median family income in Angleton with $165,347 per family, while 2-person families (2,314 | 44.7%) have the highest median income of $42,090 per family member.
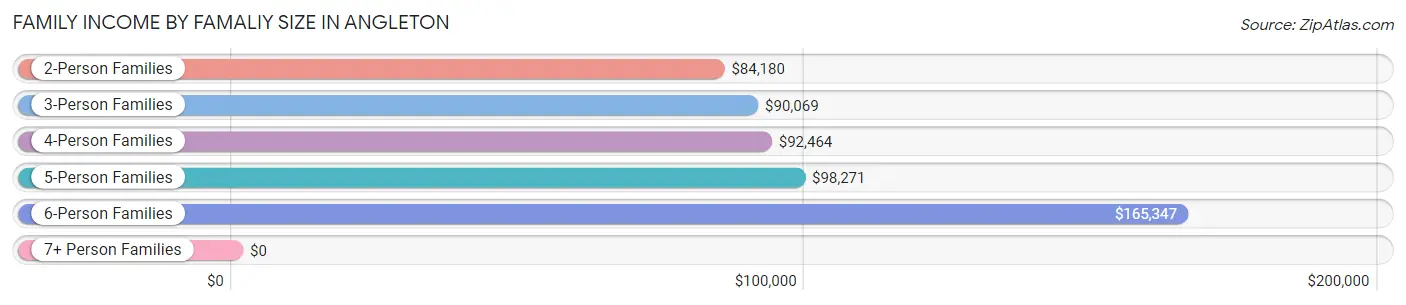
| Income Bracket | # Families | Median Income |
| 2-Person Families | 2,314 (44.7%) | $84,180 |
| 3-Person Families | 1,506 (29.1%) | $90,069 |
| 4-Person Families | 801 (15.5%) | $92,464 |
| 5-Person Families | 409 (7.9%) | $98,271 |
| 6-Person Families | 127 (2.5%) | $165,347 |
| 7+ Person Families | 24 (0.5%) | $0 |
| Total | 5,181 (100.0%) | $91,629 |
Family Income by Number of Earners in Angleton
The median family income in Angleton is $91,629, with families comprising 3+ earners (438) having the highest median family income of $154,531, while families with no earners (1,028) have the lowest median family income of $66,000, accounting for 8.5% and 19.8% of families, respectively.
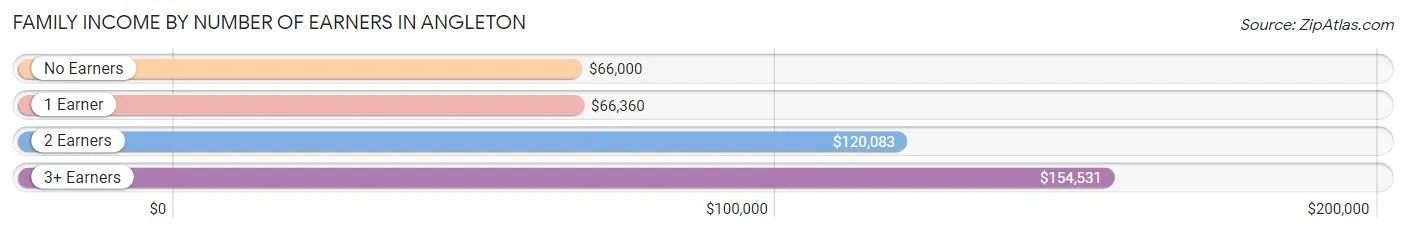
| Number of Earners | # Families | Median Income |
| No Earners | 1,028 (19.8%) | $66,000 |
| 1 Earner | 1,692 (32.7%) | $66,360 |
| 2 Earners | 2,023 (39.1%) | $120,083 |
| 3+ Earners | 438 (8.5%) | $154,531 |
| Total | 5,181 (100.0%) | $91,629 |
Household Income in Angleton
Household Income Brackets in Angleton
With 1,759 households falling in the category, the $100,000 to $149,999 income range is the most frequent in Angleton, accounting for 22.9% of all households. In contrast, only 223 households (2.9%) fall into the $10,000 to $14,999 income bracket, making it the least populous group.
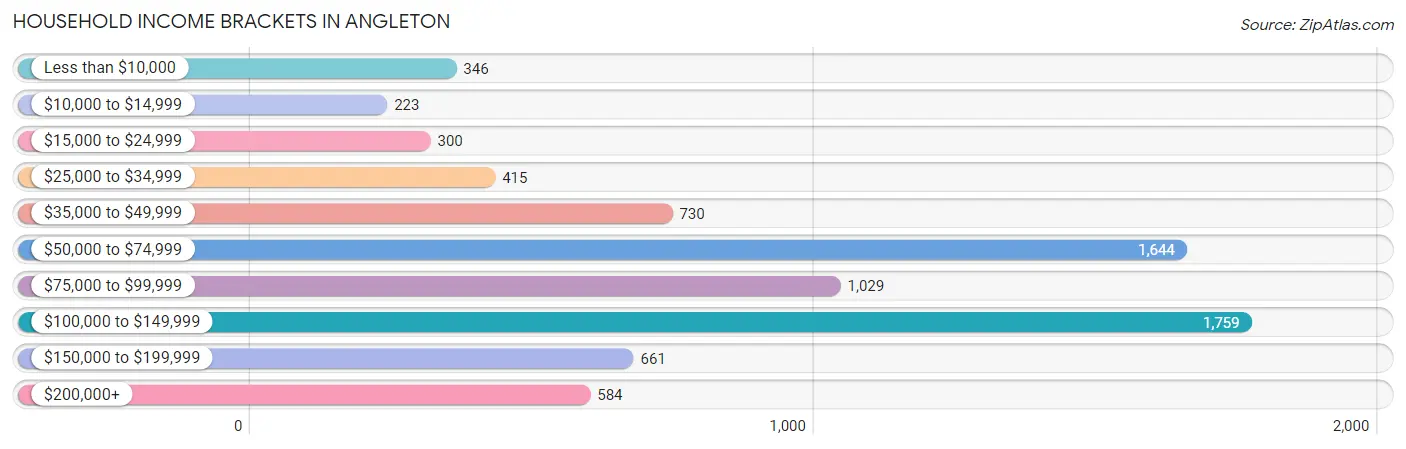
| Income Bracket | # Households | % Households |
| Less than $10,000 | 346 | 4.5% |
| $10,000 to $14,999 | 223 | 2.9% |
| $15,000 to $24,999 | 300 | 3.9% |
| $25,000 to $34,999 | 415 | 5.4% |
| $35,000 to $49,999 | 730 | 9.5% |
| $50,000 to $74,999 | 1,644 | 21.4% |
| $75,000 to $99,999 | 1,029 | 13.4% |
| $100,000 to $149,999 | 1,759 | 22.9% |
| $150,000 to $199,999 | 661 | 8.6% |
| $200,000+ | 584 | 7.6% |
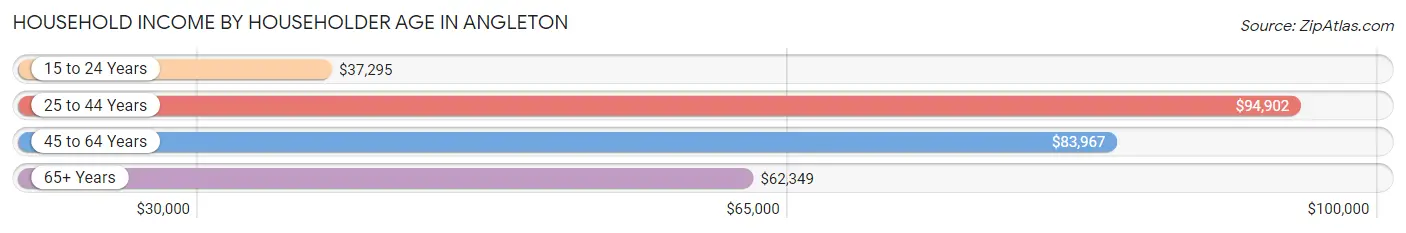
Household Income by Householder Age in Angleton
The median household income in Angleton is $77,235, with the highest median household income of $94,902 found in the 25 to 44 years age bracket for the primary householder. A total of 2,649 households (34.5%) fall into this category. Meanwhile, the 15 to 24 years age bracket for the primary householder has the lowest median household income of $37,295, with 494 households (6.4%) in this group.
| Income Bracket | # Households | Median Income |
| 15 to 24 Years | 494 (6.4%) | $37,295 |
| 25 to 44 Years | 2,649 (34.5%) | $94,902 |
| 45 to 64 Years | 2,471 (32.2%) | $83,967 |
| 65+ Years | 2,067 (26.9%) | $62,349 |
| Total | 7,681 (100.0%) | $77,235 |
Poverty in Angleton
Income Below Poverty by Sex and Age in Angleton
With 10.1% poverty level for males and 13.8% for females among the residents of Angleton, 12 to 14 year old males and under 5 year old females are the most vulnerable to poverty, with 111 males (30.8%) and 162 females (27.4%) in their respective age groups living below the poverty level.
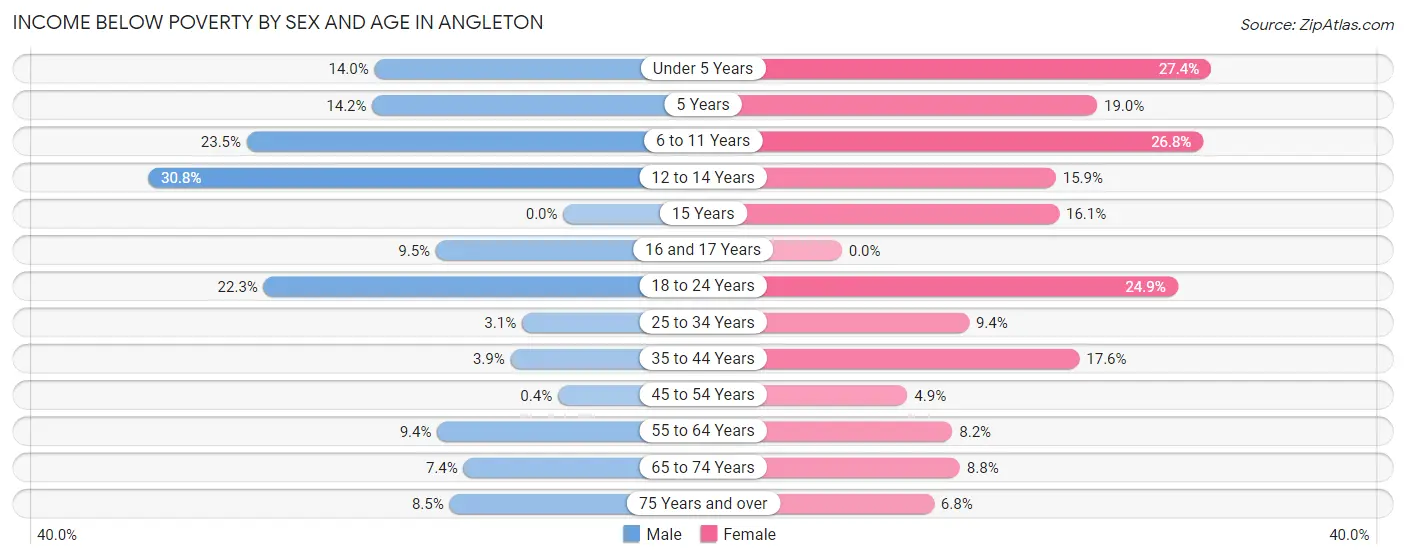
| Age Bracket | Male | Female |
| Under 5 Years | 89 (14.0%) | 162 (27.4%) |
| 5 Years | 20 (14.2%) | 36 (19.0%) |
| 6 to 11 Years | 169 (23.5%) | 187 (26.8%) |
| 12 to 14 Years | 111 (30.8%) | 72 (15.9%) |
| 15 Years | 0 (0.0%) | 15 (16.1%) |
| 16 and 17 Years | 14 (9.5%) | 0 (0.0%) |
| 18 to 24 Years | 214 (22.3%) | 248 (24.9%) |
| 25 to 34 Years | 37 (3.1%) | 143 (9.4%) |
| 35 to 44 Years | 59 (3.9%) | 223 (17.6%) |
| 45 to 54 Years | 4 (0.4%) | 38 (4.9%) |
| 55 to 64 Years | 105 (9.4%) | 134 (8.2%) |
| 65 to 74 Years | 71 (7.4%) | 87 (8.8%) |
| 75 Years and over | 35 (8.5%) | 43 (6.8%) |
| Total | 928 (10.1%) | 1,388 (13.8%) |
Income Above Poverty by Sex and Age in Angleton
According to the poverty statistics in Angleton, males aged 15 years and females aged 16 and 17 years are the age groups that are most secure financially, with 100.0% of males and 100.0% of females in these age groups living above the poverty line.
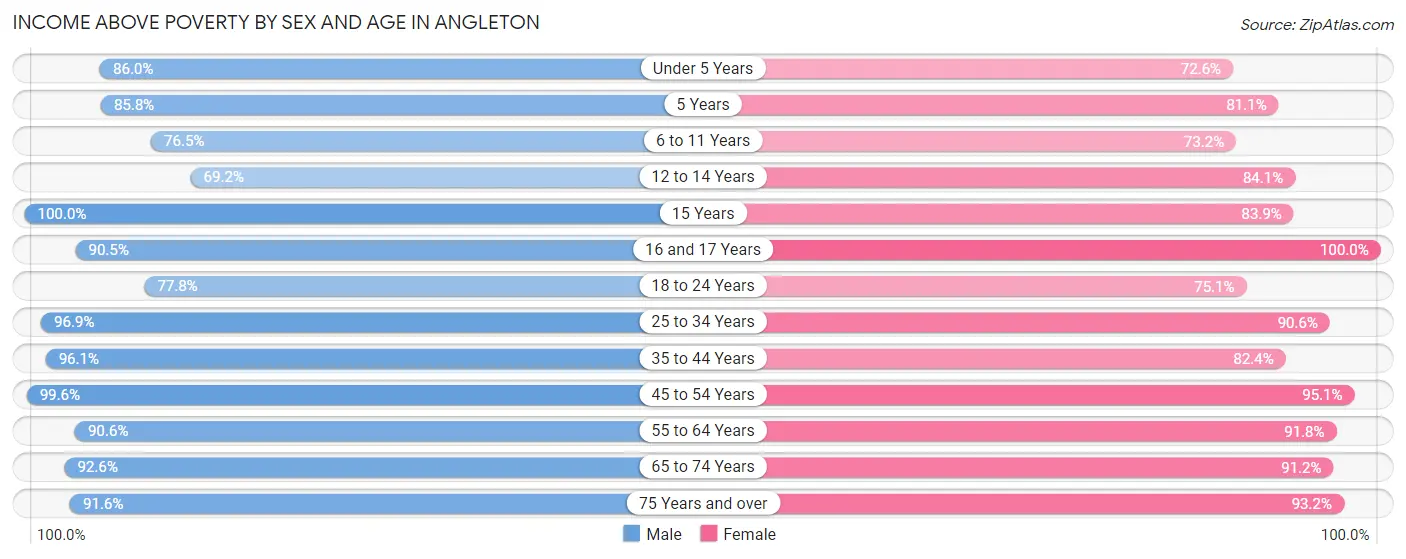
| Age Bracket | Male | Female |
| Under 5 Years | 546 (86.0%) | 429 (72.6%) |
| 5 Years | 121 (85.8%) | 154 (81.0%) |
| 6 to 11 Years | 550 (76.5%) | 510 (73.2%) |
| 12 to 14 Years | 249 (69.2%) | 381 (84.1%) |
| 15 Years | 75 (100.0%) | 78 (83.9%) |
| 16 and 17 Years | 134 (90.5%) | 232 (100.0%) |
| 18 to 24 Years | 748 (77.7%) | 747 (75.1%) |
| 25 to 34 Years | 1,169 (96.9%) | 1,372 (90.6%) |
| 35 to 44 Years | 1,446 (96.1%) | 1,041 (82.4%) |
| 45 to 54 Years | 987 (99.6%) | 742 (95.1%) |
| 55 to 64 Years | 1,017 (90.6%) | 1,499 (91.8%) |
| 65 to 74 Years | 887 (92.6%) | 905 (91.2%) |
| 75 Years and over | 379 (91.5%) | 586 (93.2%) |
| Total | 8,308 (89.9%) | 8,676 (86.2%) |
Income Below Poverty Among Married-Couple Families in Angleton
The poverty statistics for married-couple families in Angleton show that 2.9% or 99 of the total 3,351 families live below the poverty line. Families with 3 or 4 children have the highest poverty rate of 5.3%, comprising of 14 families. On the other hand, families with no children have the lowest poverty rate of 2.6%, which includes 51 families.
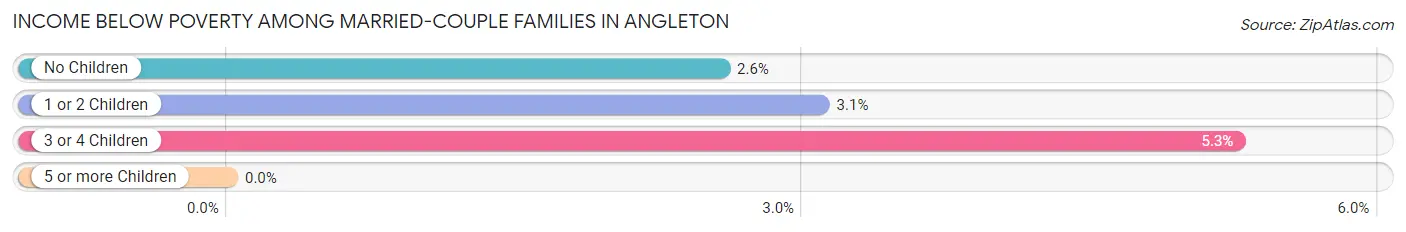
| Children | Above Poverty | Below Poverty |
| No Children | 1,934 (97.4%) | 51 (2.6%) |
| 1 or 2 Children | 1,066 (96.9%) | 34 (3.1%) |
| 3 or 4 Children | 252 (94.7%) | 14 (5.3%) |
| 5 or more Children | 0 (0.0%) | 0 (0.0%) |
| Total | 3,252 (97.1%) | 99 (2.9%) |
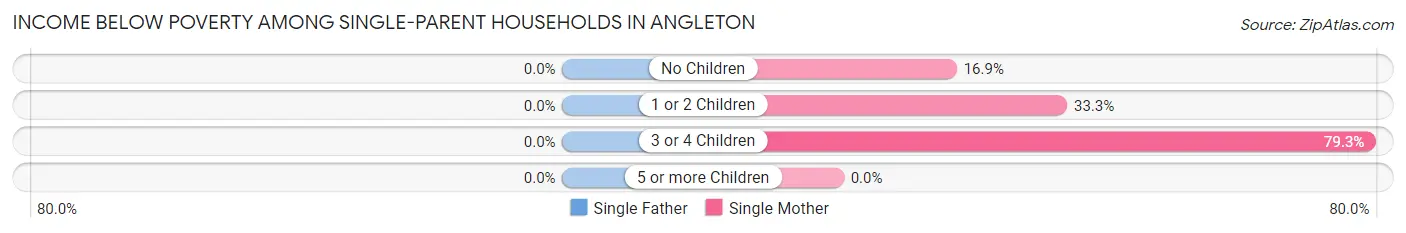
Income Below Poverty Among Single-Parent Households in Angleton
| Children | Single Father | Single Mother |
| No Children | 0 (0.0%) | 60 (16.9%) |
| 1 or 2 Children | 0 (0.0%) | 246 (33.3%) |
| 3 or 4 Children | 0 (0.0%) | 96 (79.3%) |
| 5 or more Children | 0 (0.0%) | 0 (0.0%) |
| Total | 0 (0.0%) | 402 (33.1%) |
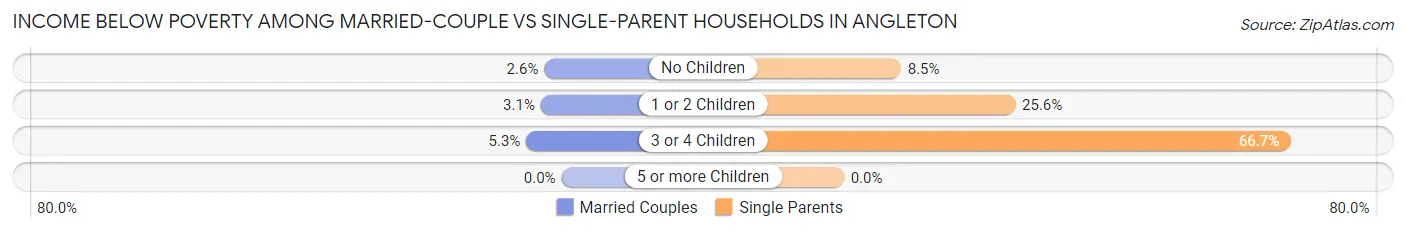
Income Below Poverty Among Married-Couple vs Single-Parent Households in Angleton
The poverty data for Angleton shows that 99 of the married-couple family households (2.9%) and 402 of the single-parent households (22.0%) are living below the poverty level. Within the married-couple family households, those with 3 or 4 children have the highest poverty rate, with 14 households (5.3%) falling below the poverty line. Among the single-parent households, those with 3 or 4 children have the highest poverty rate, with 96 household (66.7%) living below poverty.
| Children | Married-Couple Families | Single-Parent Households |
| No Children | 51 (2.6%) | 60 (8.5%) |
| 1 or 2 Children | 34 (3.1%) | 246 (25.6%) |
| 3 or 4 Children | 14 (5.3%) | 96 (66.7%) |
| 5 or more Children | 0 (0.0%) | 0 (0.0%) |
| Total | 99 (2.9%) | 402 (22.0%) |
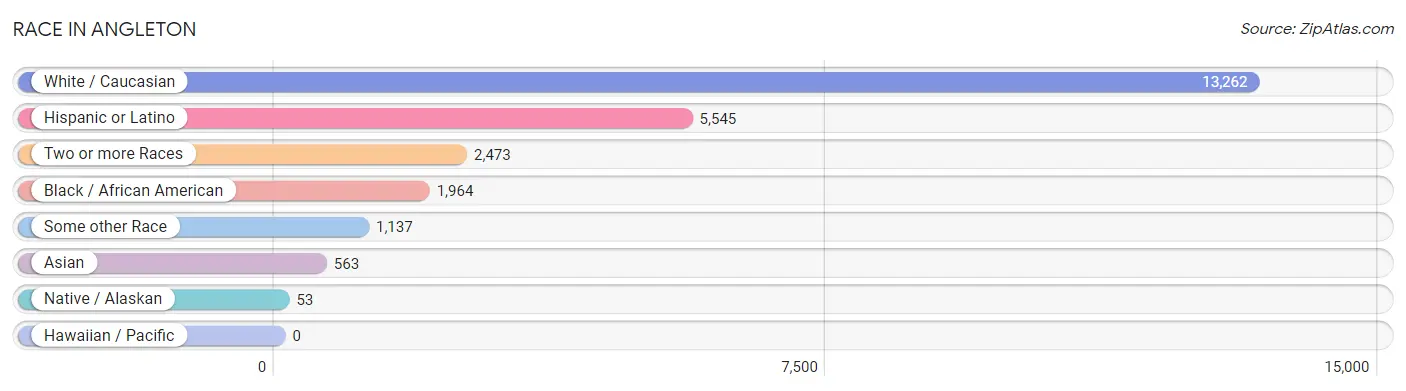
Race in Angleton
The most populous races in Angleton are White / Caucasian (13,262 | 68.2%), Hispanic or Latino (5,545 | 28.5%), and Two or more Races (2,473 | 12.7%).
| Race | # Population | % Population |
| Asian | 563 | 2.9% |
| Black / African American | 1,964 | 10.1% |
| Hawaiian / Pacific | 0 | 0.0% |
| Hispanic or Latino | 5,545 | 28.5% |
| Native / Alaskan | 53 | 0.3% |
| White / Caucasian | 13,262 | 68.2% |
| Two or more Races | 2,473 | 12.7% |
| Some other Race | 1,137 | 5.9% |
| Total | 19,452 | 100.0% |
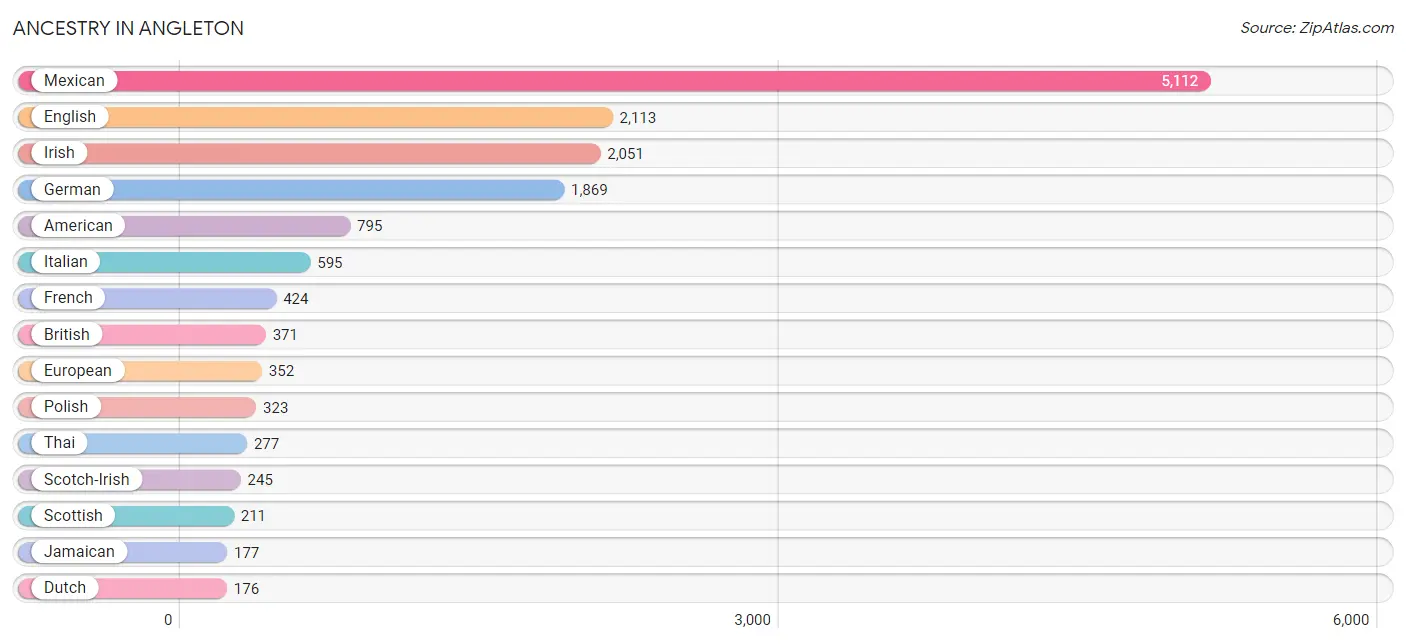
Ancestry in Angleton
The most populous ancestries reported in Angleton are Mexican (5,112 | 26.3%), English (2,113 | 10.9%), Irish (2,051 | 10.5%), German (1,869 | 9.6%), and American (795 | 4.1%), together accounting for 61.4% of all Angleton residents.
| Ancestry | # Population | % Population |
| American | 795 | 4.1% |
| Arab | 40 | 0.2% |
| Austrian | 101 | 0.5% |
| Bhutanese | 28 | 0.1% |
| British | 371 | 1.9% |
| Burmese | 101 | 0.5% |
| Central American | 97 | 0.5% |
| Central American Indian | 29 | 0.2% |
| Cherokee | 66 | 0.3% |
| Colombian | 20 | 0.1% |
| Czech | 173 | 0.9% |
| Czechoslovakian | 60 | 0.3% |
| Danish | 7 | 0.0% |
| Dutch | 176 | 0.9% |
| English | 2,113 | 10.9% |
| European | 352 | 1.8% |
| Filipino | 31 | 0.2% |
| French | 424 | 2.2% |
| French Canadian | 54 | 0.3% |
| German | 1,869 | 9.6% |
| Greek | 133 | 0.7% |
| Guatemalan | 97 | 0.5% |
| Hungarian | 109 | 0.6% |
| Indian (Asian) | 166 | 0.9% |
| Irish | 2,051 | 10.5% |
| Italian | 595 | 3.1% |
| Jamaican | 177 | 0.9% |
| Lithuanian | 13 | 0.1% |
| Mexican | 5,112 | 26.3% |
| Northern European | 85 | 0.4% |
| Norwegian | 41 | 0.2% |
| Pakistani | 12 | 0.1% |
| Pennsylvania German | 8 | 0.0% |
| Polish | 323 | 1.7% |
| Portuguese | 23 | 0.1% |
| Potawatomi | 13 | 0.1% |
| Puerto Rican | 105 | 0.5% |
| Russian | 17 | 0.1% |
| Scandinavian | 59 | 0.3% |
| Scotch-Irish | 245 | 1.3% |
| Scottish | 211 | 1.1% |
| South American | 20 | 0.1% |
| Spaniard | 30 | 0.2% |
| Sri Lankan | 129 | 0.7% |
| Subsaharan African | 64 | 0.3% |
| Swedish | 27 | 0.1% |
| Swiss | 10 | 0.1% |
| Syrian | 40 | 0.2% |
| Thai | 277 | 1.4% |
| Welsh | 41 | 0.2% | View All 50 Rows |
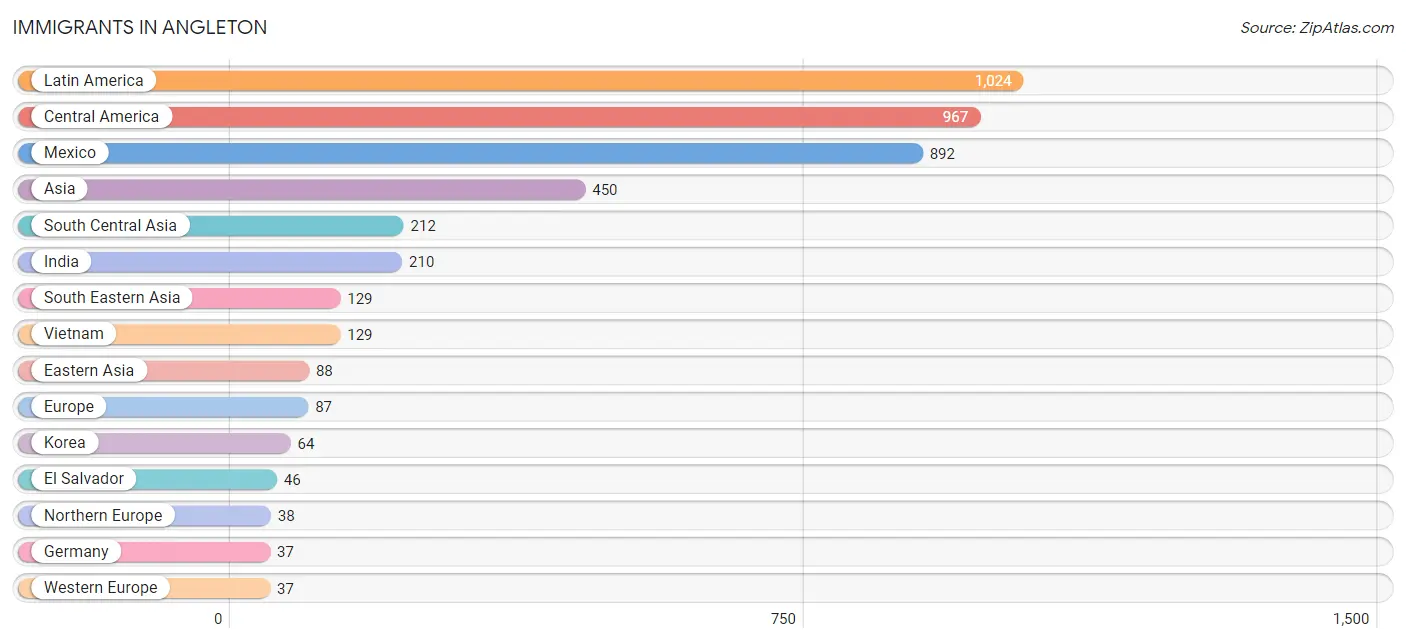
Immigrants in Angleton
The most numerous immigrant groups reported in Angleton came from Latin America (1,024 | 5.3%), Central America (967 | 5.0%), Mexico (892 | 4.6%), Asia (450 | 2.3%), and South Central Asia (212 | 1.1%), together accounting for 18.2% of all Angleton residents.
| Immigration Origin | # Population | % Population |
| Africa | 33 | 0.2% |
| Asia | 450 | 2.3% |
| Cameroon | 33 | 0.2% |
| Canada | 10 | 0.1% |
| Caribbean | 29 | 0.2% |
| Central America | 967 | 5.0% |
| Colombia | 6 | 0.0% |
| Eastern Asia | 88 | 0.4% |
| El Salvador | 46 | 0.2% |
| England | 30 | 0.2% |
| Europe | 87 | 0.4% |
| Germany | 37 | 0.2% |
| Guatemala | 29 | 0.2% |
| Guyana | 22 | 0.1% |
| India | 210 | 1.1% |
| Italy | 12 | 0.1% |
| Jamaica | 29 | 0.2% |
| Japan | 24 | 0.1% |
| Korea | 64 | 0.3% |
| Latin America | 1,024 | 5.3% |
| Mexico | 892 | 4.6% |
| Middle Africa | 33 | 0.2% |
| Northern Europe | 38 | 0.2% |
| Pakistan | 2 | 0.0% |
| Scotland | 8 | 0.0% |
| South America | 28 | 0.1% |
| South Central Asia | 212 | 1.1% |
| South Eastern Asia | 129 | 0.7% |
| Southern Europe | 12 | 0.1% |
| Syria | 21 | 0.1% |
| Vietnam | 129 | 0.7% |
| Western Asia | 21 | 0.1% |
| Western Europe | 37 | 0.2% | View All 33 Rows |
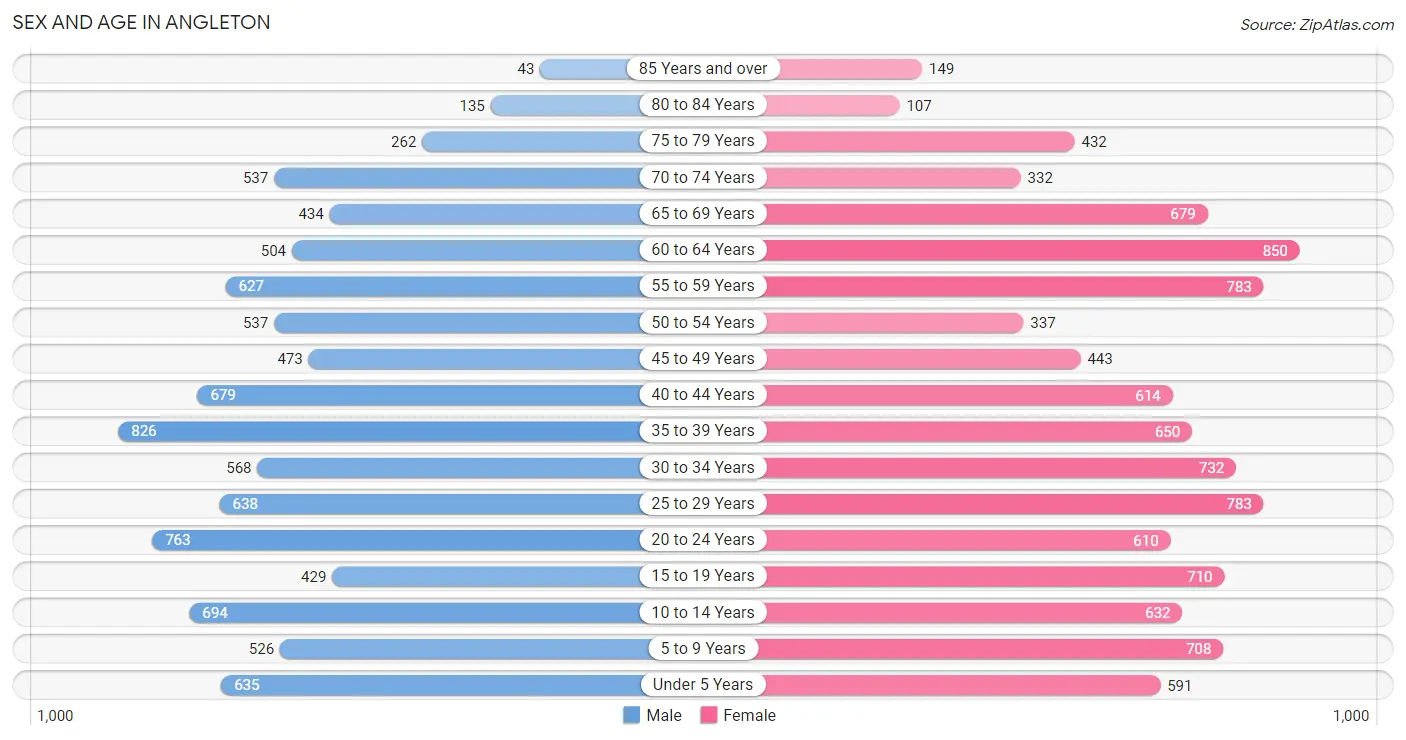
Sex and Age in Angleton
Sex and Age in Angleton
The most populous age groups in Angleton are 35 to 39 Years (826 | 8.9%) for men and 60 to 64 Years (850 | 8.4%) for women.
| Age Bracket | Male | Female |
| Under 5 Years | 635 (6.8%) | 591 (5.8%) |
| 5 to 9 Years | 526 (5.7%) | 708 (7.0%) |
| 10 to 14 Years | 694 (7.4%) | 632 (6.2%) |
| 15 to 19 Years | 429 (4.6%) | 710 (7.0%) |
| 20 to 24 Years | 763 (8.2%) | 610 (6.0%) |
| 25 to 29 Years | 638 (6.9%) | 783 (7.7%) |
| 30 to 34 Years | 568 (6.1%) | 732 (7.2%) |
| 35 to 39 Years | 826 (8.9%) | 650 (6.4%) |
| 40 to 44 Years | 679 (7.3%) | 614 (6.0%) |
| 45 to 49 Years | 473 (5.1%) | 443 (4.4%) |
| 50 to 54 Years | 537 (5.8%) | 337 (3.3%) |
| 55 to 59 Years | 627 (6.7%) | 783 (7.7%) |
| 60 to 64 Years | 504 (5.4%) | 850 (8.4%) |
| 65 to 69 Years | 434 (4.7%) | 679 (6.7%) |
| 70 to 74 Years | 537 (5.8%) | 332 (3.3%) |
| 75 to 79 Years | 262 (2.8%) | 432 (4.3%) |
| 80 to 84 Years | 135 (1.5%) | 107 (1.1%) |
| 85 Years and over | 43 (0.5%) | 149 (1.5%) |
| Total | 9,310 (100.0%) | 10,142 (100.0%) |
Families and Households in Angleton
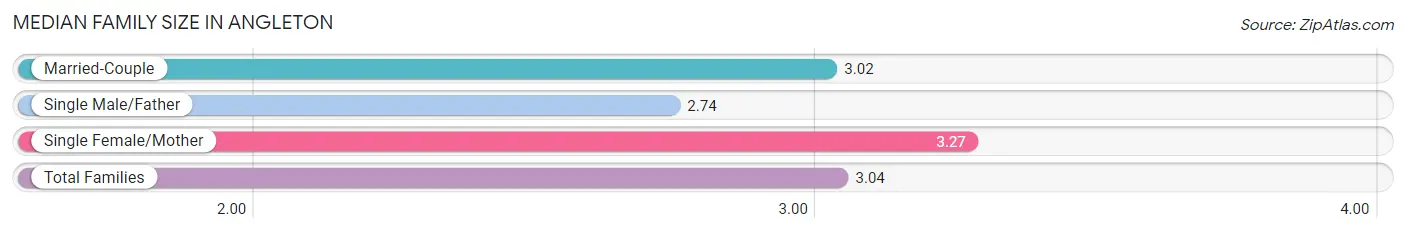
Median Family Size in Angleton
The median family size in Angleton is 3.04 persons per family, with single female/mother families (1,216 | 23.5%) accounting for the largest median family size of 3.27 persons per family. On the other hand, single male/father families (614 | 11.8%) represent the smallest median family size with 2.74 persons per family.
| Family Type | # Families | Family Size |
| Married-Couple | 3,351 (64.7%) | 3.02 |
| Single Male/Father | 614 (11.8%) | 2.74 |
| Single Female/Mother | 1,216 (23.5%) | 3.27 |
| Total Families | 5,181 (100.0%) | 3.04 |
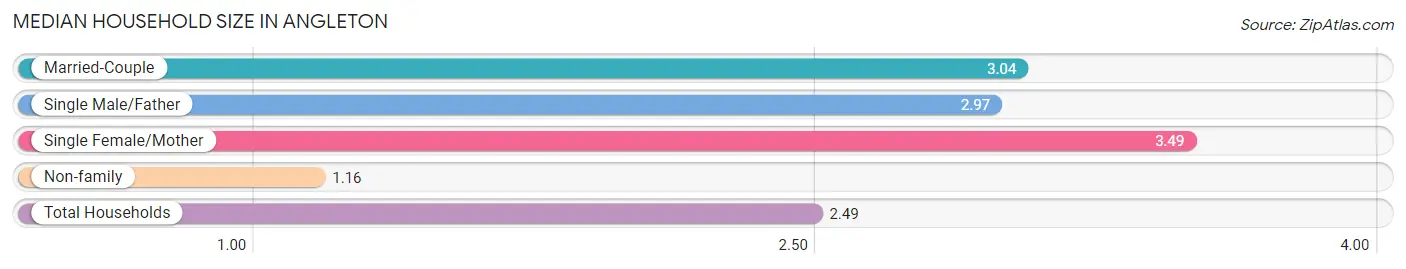
Median Household Size in Angleton
The median household size in Angleton is 2.49 persons per household, with single female/mother households (1,216 | 15.8%) accounting for the largest median household size of 3.49 persons per household. non-family households (2,500 | 32.6%) represent the smallest median household size with 1.16 persons per household.
| Household Type | # Households | Household Size |
| Married-Couple | 3,351 (43.6%) | 3.04 |
| Single Male/Father | 614 (8.0%) | 2.97 |
| Single Female/Mother | 1,216 (15.8%) | 3.49 |
| Non-family | 2,500 (32.6%) | 1.16 |
| Total Households | 7,681 (100.0%) | 2.49 |
Household Size by Marriage Status in Angleton
Out of a total of 7,681 households in Angleton, 5,181 (67.4%) are family households, while 2,500 (32.6%) are nonfamily households. The most numerous type of family households are 2-person households, comprising 2,103, and the most common type of nonfamily households are 1-person households, comprising 2,171.
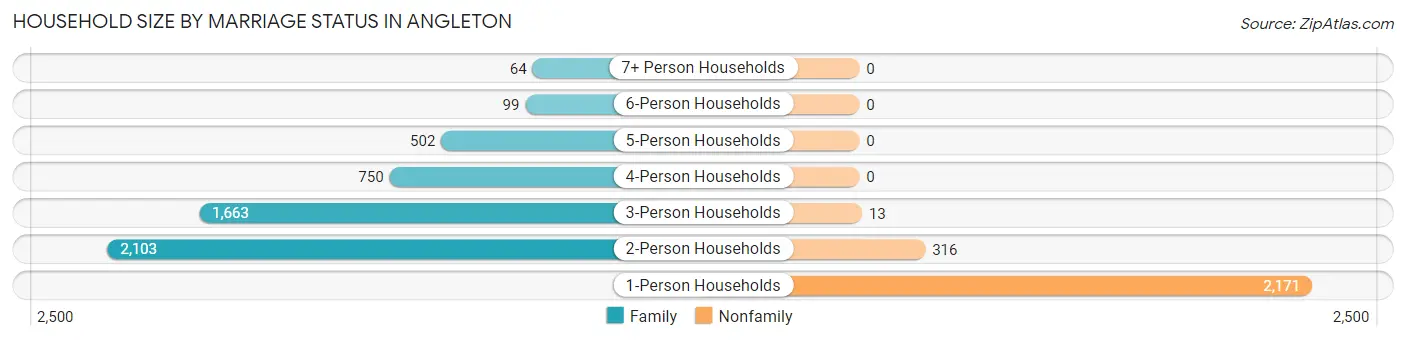
| Household Size | Family Households | Nonfamily Households |
| 1-Person Households | - | 2,171 (28.3%) |
| 2-Person Households | 2,103 (27.4%) | 316 (4.1%) |
| 3-Person Households | 1,663 (21.6%) | 13 (0.2%) |
| 4-Person Households | 750 (9.8%) | 0 (0.0%) |
| 5-Person Households | 502 (6.5%) | 0 (0.0%) |
| 6-Person Households | 99 (1.3%) | 0 (0.0%) |
| 7+ Person Households | 64 (0.8%) | 0 (0.0%) |
| Total | 5,181 (67.4%) | 2,500 (32.6%) |
Female Fertility in Angleton
Fertility by Age in Angleton
Average fertility rate in Angleton is 29.0 births per 1,000 women. Women in the age bracket of 20 to 34 years have the highest fertility rate with 57.0 births per 1,000 women. Women in the age bracket of 20 to 34 years acount for 89.7% of all women with births.
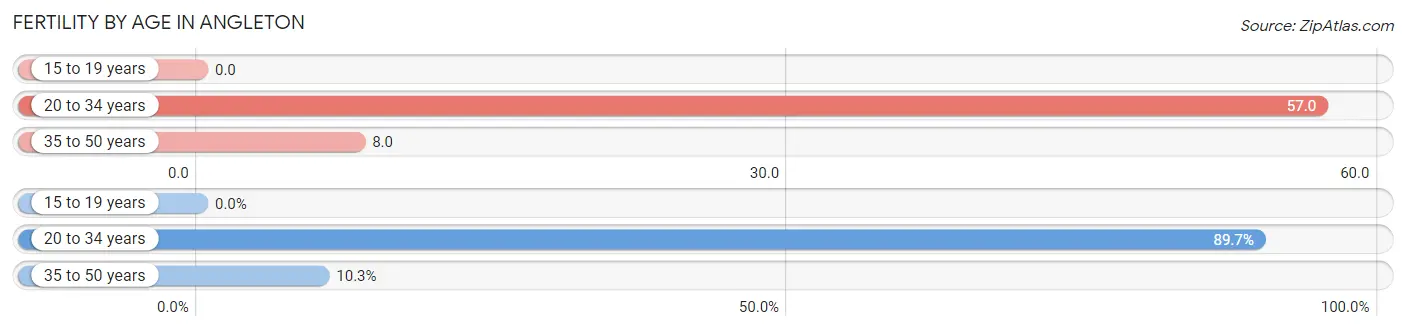
| Age Bracket | Women with Births | Births / 1,000 Women |
| 15 to 19 years | 0 (0.0%) | 0.0 |
| 20 to 34 years | 122 (89.7%) | 57.0 |
| 35 to 50 years | 14 (10.3%) | 8.0 |
| Total | 136 (100.0%) | 29.0 |
Fertility by Age by Marriage Status in Angleton
16.9% of women with births (136) in Angleton are married. The highest percentage of unmarried women with births falls into 35 to 50 years age bracket with 100.0% of them unmarried at the time of birth, while the lowest percentage of unmarried women with births belong to 20 to 34 years age bracket with 81.1% of them unmarried.
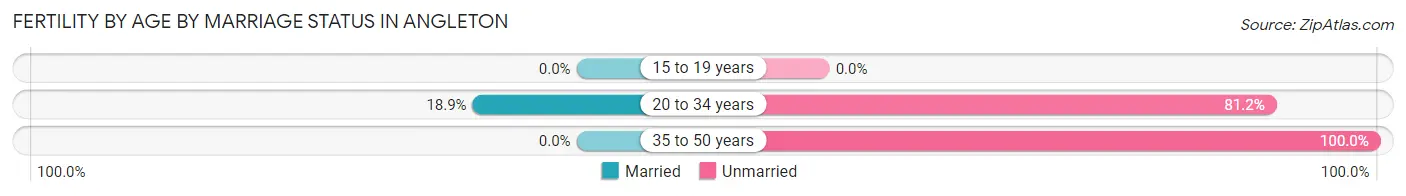
| Age Bracket | Married | Unmarried |
| 15 to 19 years | 0 (0.0%) | 0 (0.0%) |
| 20 to 34 years | 23 (18.9%) | 99 (81.1%) |
| 35 to 50 years | 0 (0.0%) | 14 (100.0%) |
| Total | 23 (16.9%) | 113 (83.1%) |
Fertility by Education in Angleton
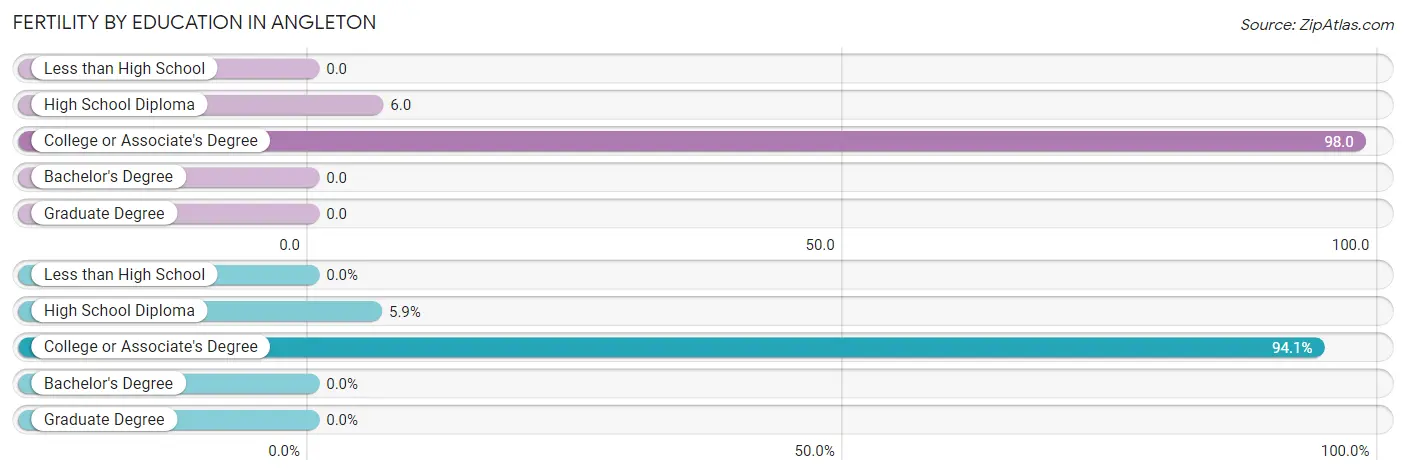
| Educational Attainment | Women with Births | Births / 1,000 Women |
| Less than High School | 0 (0.0%) | 0.0 |
| High School Diploma | 8 (5.9%) | 6.0 |
| College or Associate's Degree | 128 (94.1%) | 98.0 |
| Bachelor's Degree | 0 (0.0%) | 0.0 |
| Graduate Degree | 0 (0.0%) | 0.0 |
| Total | 136 (100.0%) | 29.0 |
Fertility by Education by Marriage Status in Angleton
83.1% of women with births in Angleton are unmarried. Women with the educational attainment of high school diploma are most likely to be married with 100.0% of them married at childbirth, while women with the educational attainment of college or associate's degree are least likely to be married with 88.3% of them unmarried at childbirth.
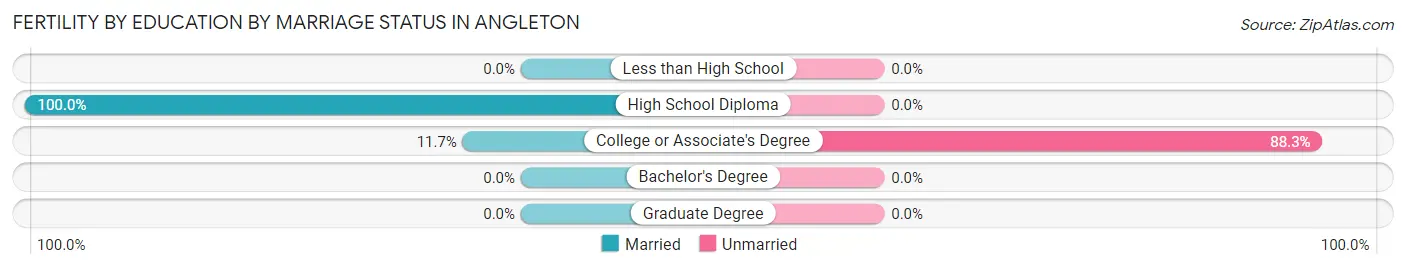
| Educational Attainment | Married | Unmarried |
| Less than High School | 0 (0.0%) | 0 (0.0%) |
| High School Diploma | 8 (100.0%) | 0 (0.0%) |
| College or Associate's Degree | 15 (11.7%) | 113 (88.3%) |
| Bachelor's Degree | 0 (0.0%) | 0 (0.0%) |
| Graduate Degree | 0 (0.0%) | 0 (0.0%) |
| Total | 23 (16.9%) | 113 (83.1%) |
Employment Characteristics in Angleton
Employment by Class of Employer in Angleton
Among the 9,176 employed individuals in Angleton, private company employees (6,250 | 68.1%), local government employees (947 | 10.3%), and state government employees (588 | 6.4%) make up the most common classes of employment.
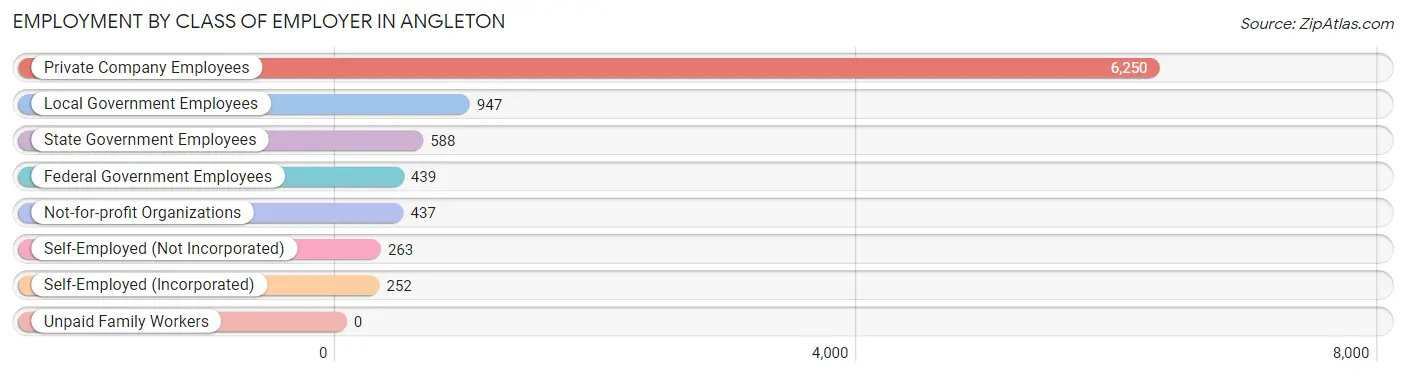
| Employer Class | # Employees | % Employees |
| Private Company Employees | 6,250 | 68.1% |
| Self-Employed (Incorporated) | 252 | 2.8% |
| Self-Employed (Not Incorporated) | 263 | 2.9% |
| Not-for-profit Organizations | 437 | 4.8% |
| Local Government Employees | 947 | 10.3% |
| State Government Employees | 588 | 6.4% |
| Federal Government Employees | 439 | 4.8% |
| Unpaid Family Workers | 0 | 0.0% |
| Total | 9,176 | 100.0% |
Employment Status by Age in Angleton
According to the labor force statistics for Angleton, out of the total population over 16 years of age (15,498), 61.7% or 9,562 individuals are in the labor force, with 2.4% or 229 of them unemployed. The age group with the highest labor force participation rate is 30 to 34 years, with 86.8% or 1,128 individuals in the labor force. Within the labor force, the 30 to 34 years age range has the highest percentage of unemployed individuals, with 5.7% or 64 of them being unemployed.
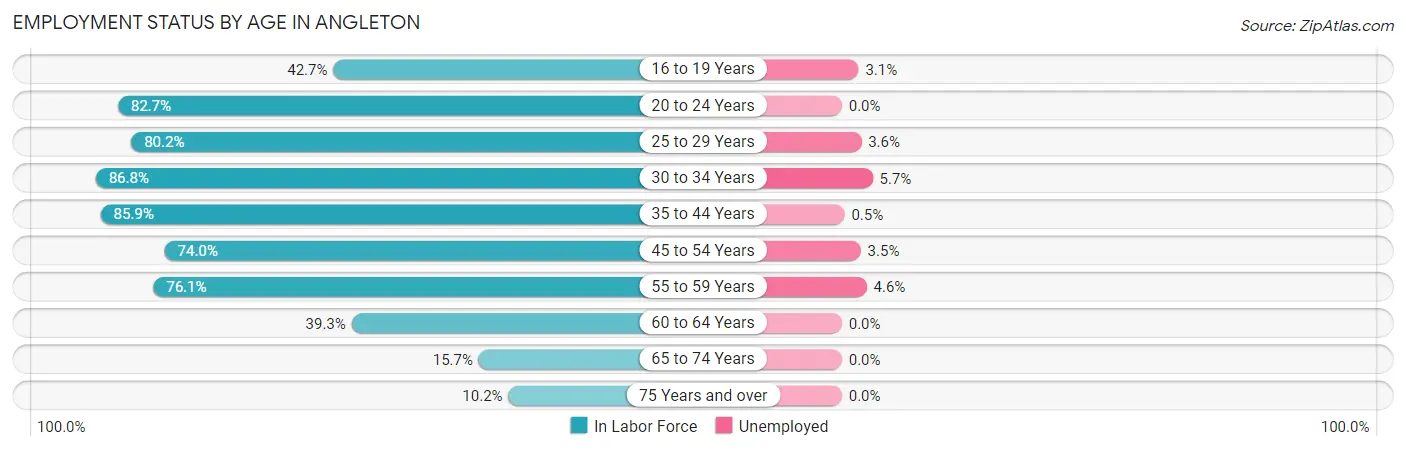
| Age Bracket | In Labor Force | Unemployed |
| 16 to 19 Years | 415 (42.7%) | 13 (3.1%) |
| 20 to 24 Years | 1,135 (82.7%) | 0 (0.0%) |
| 25 to 29 Years | 1,140 (80.2%) | 41 (3.6%) |
| 30 to 34 Years | 1,128 (86.8%) | 64 (5.7%) |
| 35 to 44 Years | 2,379 (85.9%) | 12 (0.5%) |
| 45 to 54 Years | 1,325 (74.0%) | 46 (3.5%) |
| 55 to 59 Years | 1,073 (76.1%) | 49 (4.6%) |
| 60 to 64 Years | 532 (39.3%) | 0 (0.0%) |
| 65 to 74 Years | 311 (15.7%) | 0 (0.0%) |
| 75 Years and over | 115 (10.2%) | 0 (0.0%) |
| Total | 9,562 (61.7%) | 229 (2.4%) |
Employment Status by Educational Attainment in Angleton
According to labor force statistics for Angleton, 75.4% of individuals (7,573) out of the total population between 25 and 64 years of age (10,044) are in the labor force, with 2.8% or 212 of them being unemployed. The group with the highest labor force participation rate are those with the educational attainment of bachelor's degree or higher, with 95.1% or 1,815 individuals in the labor force. Within the labor force, individuals with less than high school education have the highest percentage of unemployment, with 5.4% or 30 of them being unemployed.
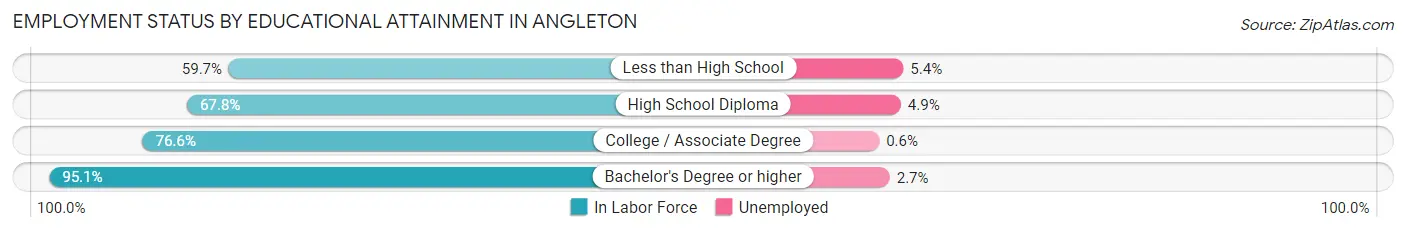
| Educational Attainment | In Labor Force | Unemployed |
| Less than High School | 554 (59.7%) | 50 (5.4%) |
| High School Diploma | 2,422 (67.8%) | 175 (4.9%) |
| College / Associate Degree | 2,785 (76.6%) | 22 (0.6%) |
| Bachelor's Degree or higher | 1,815 (95.1%) | 52 (2.7%) |
| Total | 7,573 (75.4%) | 281 (2.8%) |
Employment Occupations by Sex in Angleton
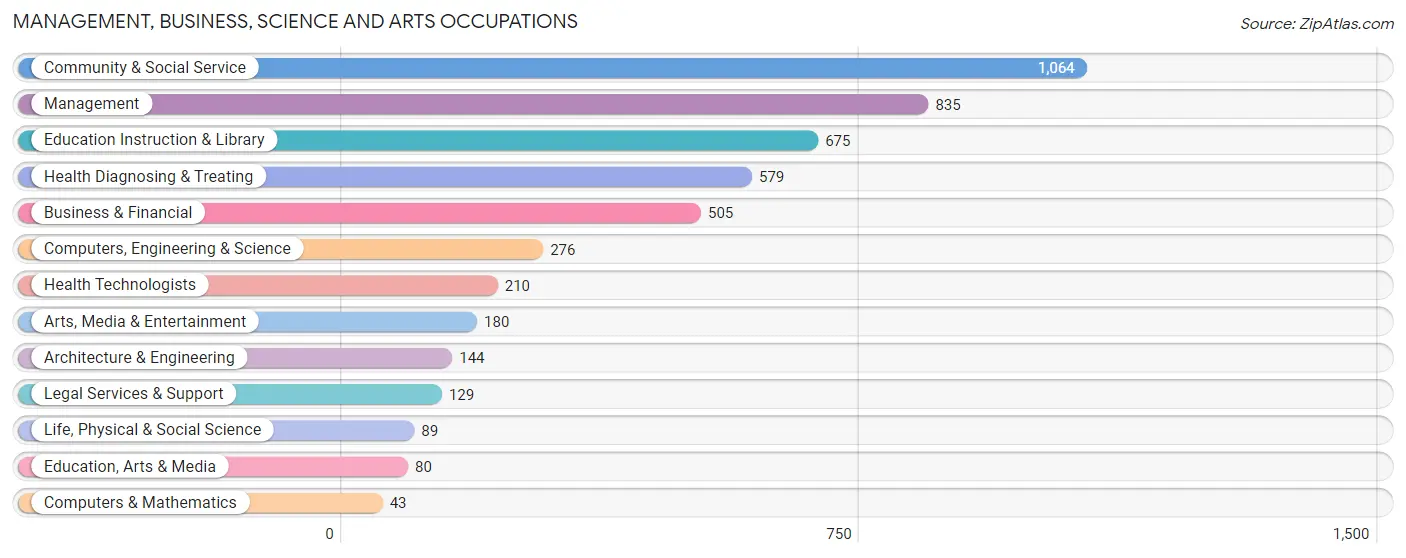
Management, Business, Science and Arts Occupations
The most common Management, Business, Science and Arts occupations in Angleton are Community & Social Service (1,064 | 11.4%), Management (835 | 8.9%), Education Instruction & Library (675 | 7.2%), Health Diagnosing & Treating (579 | 6.2%), and Business & Financial (505 | 5.4%).
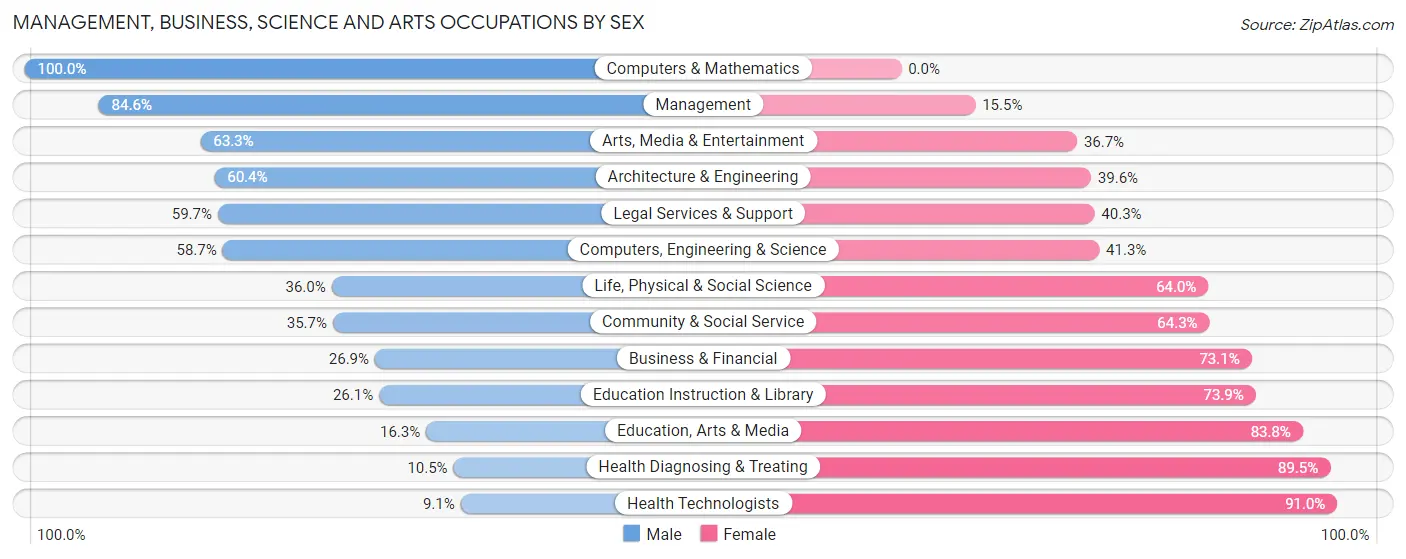
Management, Business, Science and Arts Occupations by Sex
Within the Management, Business, Science and Arts occupations in Angleton, the most male-oriented occupations are Computers & Mathematics (100.0%), Management (84.6%), and Arts, Media & Entertainment (63.3%), while the most female-oriented occupations are Health Technologists (90.9%), Health Diagnosing & Treating (89.5%), and Education, Arts & Media (83.8%).
| Occupation | Male | Female |
| Management | 706 (84.6%) | 129 (15.4%) |
| Business & Financial | 136 (26.9%) | 369 (73.1%) |
| Computers, Engineering & Science | 162 (58.7%) | 114 (41.3%) |
| Computers & Mathematics | 43 (100.0%) | 0 (0.0%) |
| Architecture & Engineering | 87 (60.4%) | 57 (39.6%) |
| Life, Physical & Social Science | 32 (36.0%) | 57 (64.0%) |
| Community & Social Service | 380 (35.7%) | 684 (64.3%) |
| Education, Arts & Media | 13 (16.3%) | 67 (83.8%) |
| Legal Services & Support | 77 (59.7%) | 52 (40.3%) |
| Education Instruction & Library | 176 (26.1%) | 499 (73.9%) |
| Arts, Media & Entertainment | 114 (63.3%) | 66 (36.7%) |
| Health Diagnosing & Treating | 61 (10.5%) | 518 (89.5%) |
| Health Technologists | 19 (9.0%) | 191 (90.9%) |
| Total (Category) | 1,445 (44.3%) | 1,814 (55.7%) |
| Total (Overall) | 4,951 (53.1%) | 4,378 (46.9%) |
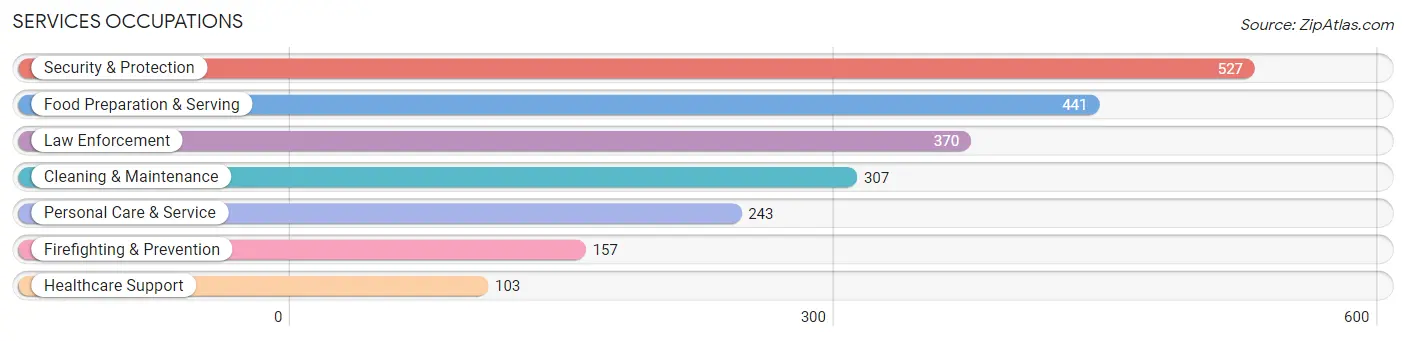
Services Occupations
The most common Services occupations in Angleton are Security & Protection (527 | 5.7%), Food Preparation & Serving (441 | 4.7%), Law Enforcement (370 | 4.0%), Cleaning & Maintenance (307 | 3.3%), and Personal Care & Service (243 | 2.6%).
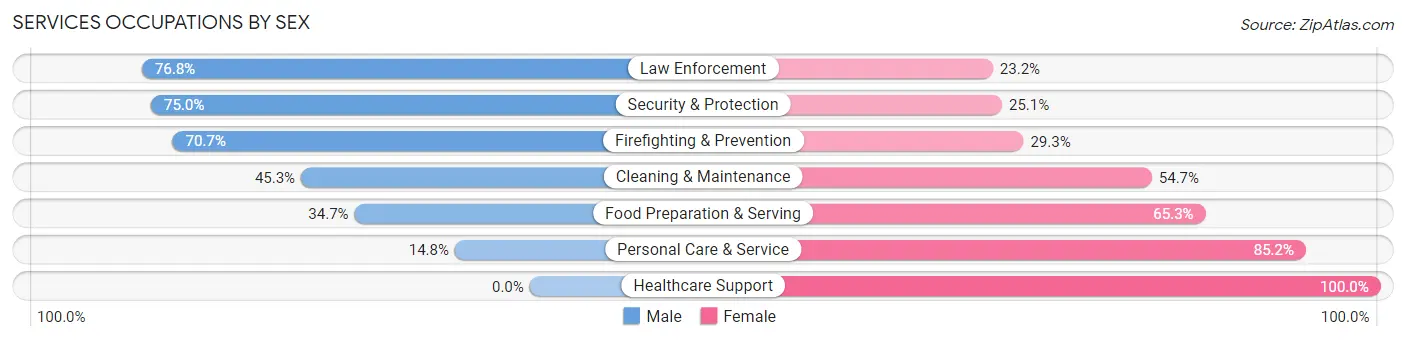
Services Occupations by Sex
Within the Services occupations in Angleton, the most male-oriented occupations are Law Enforcement (76.8%), Security & Protection (75.0%), and Firefighting & Prevention (70.7%), while the most female-oriented occupations are Healthcare Support (100.0%), Personal Care & Service (85.2%), and Food Preparation & Serving (65.3%).
| Occupation | Male | Female |
| Healthcare Support | 0 (0.0%) | 103 (100.0%) |
| Security & Protection | 395 (75.0%) | 132 (25.1%) |
| Firefighting & Prevention | 111 (70.7%) | 46 (29.3%) |
| Law Enforcement | 284 (76.8%) | 86 (23.2%) |
| Food Preparation & Serving | 153 (34.7%) | 288 (65.3%) |
| Cleaning & Maintenance | 139 (45.3%) | 168 (54.7%) |
| Personal Care & Service | 36 (14.8%) | 207 (85.2%) |
| Total (Category) | 723 (44.6%) | 898 (55.4%) |
| Total (Overall) | 4,951 (53.1%) | 4,378 (46.9%) |
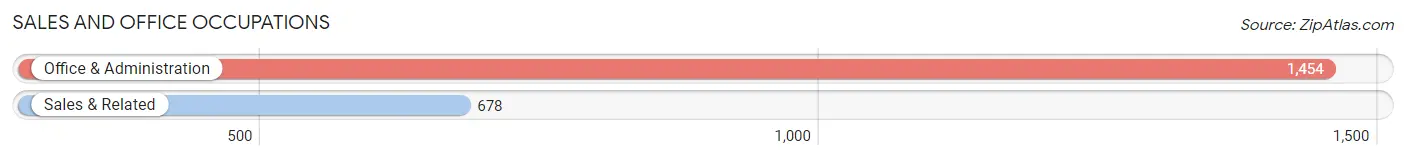
Sales and Office Occupations
The most common Sales and Office occupations in Angleton are Office & Administration (1,454 | 15.6%), and Sales & Related (678 | 7.3%).
Sales and Office Occupations by Sex
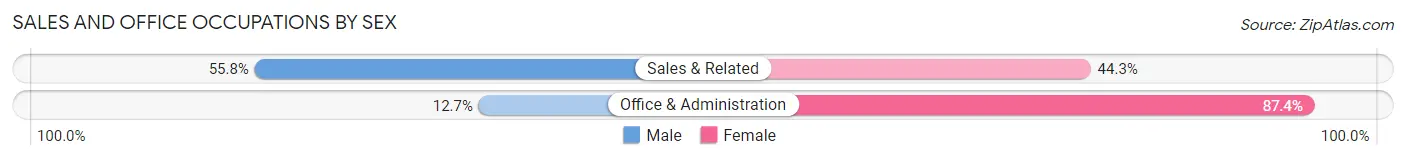
| Occupation | Male | Female |
| Sales & Related | 378 (55.7%) | 300 (44.3%) |
| Office & Administration | 184 (12.7%) | 1,270 (87.4%) |
| Total (Category) | 562 (26.4%) | 1,570 (73.6%) |
| Total (Overall) | 4,951 (53.1%) | 4,378 (46.9%) |
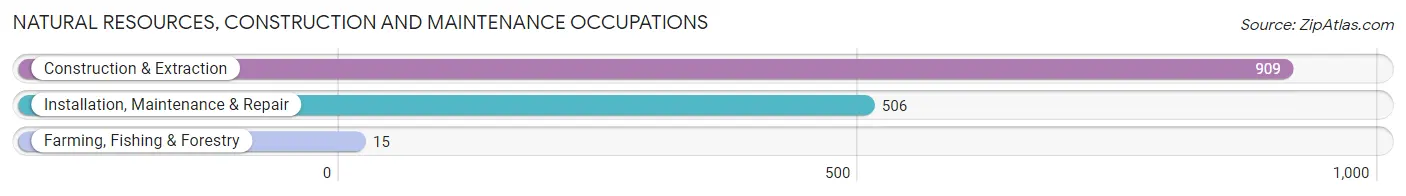
Natural Resources, Construction and Maintenance Occupations
The most common Natural Resources, Construction and Maintenance occupations in Angleton are Construction & Extraction (909 | 9.7%), Installation, Maintenance & Repair (506 | 5.4%), and Farming, Fishing & Forestry (15 | 0.2%).
Natural Resources, Construction and Maintenance Occupations by Sex
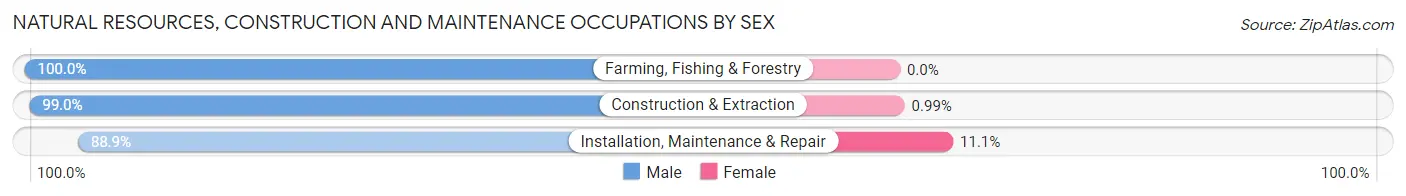
| Occupation | Male | Female |
| Farming, Fishing & Forestry | 15 (100.0%) | 0 (0.0%) |
| Construction & Extraction | 900 (99.0%) | 9 (1.0%) |
| Installation, Maintenance & Repair | 450 (88.9%) | 56 (11.1%) |
| Total (Category) | 1,365 (95.5%) | 65 (4.5%) |
| Total (Overall) | 4,951 (53.1%) | 4,378 (46.9%) |
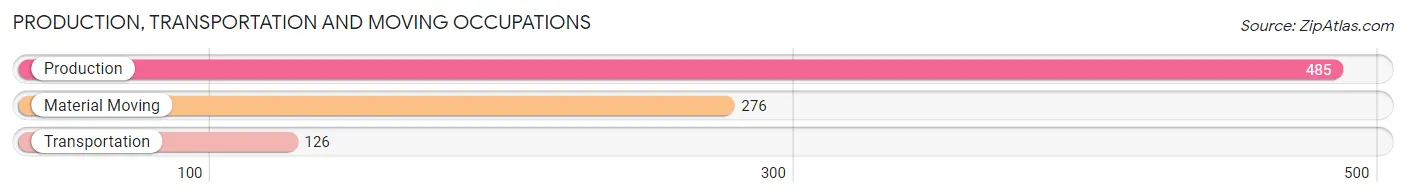
Production, Transportation and Moving Occupations
The most common Production, Transportation and Moving occupations in Angleton are Production (485 | 5.2%), Material Moving (276 | 3.0%), and Transportation (126 | 1.3%).
Production, Transportation and Moving Occupations by Sex
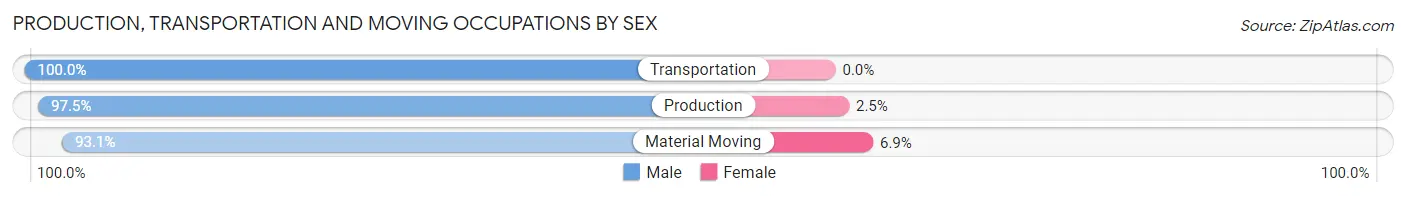
| Occupation | Male | Female |
| Production | 473 (97.5%) | 12 (2.5%) |
| Transportation | 126 (100.0%) | 0 (0.0%) |
| Material Moving | 257 (93.1%) | 19 (6.9%) |
| Total (Category) | 856 (96.5%) | 31 (3.5%) |
| Total (Overall) | 4,951 (53.1%) | 4,378 (46.9%) |
Employment Industries by Sex in Angleton
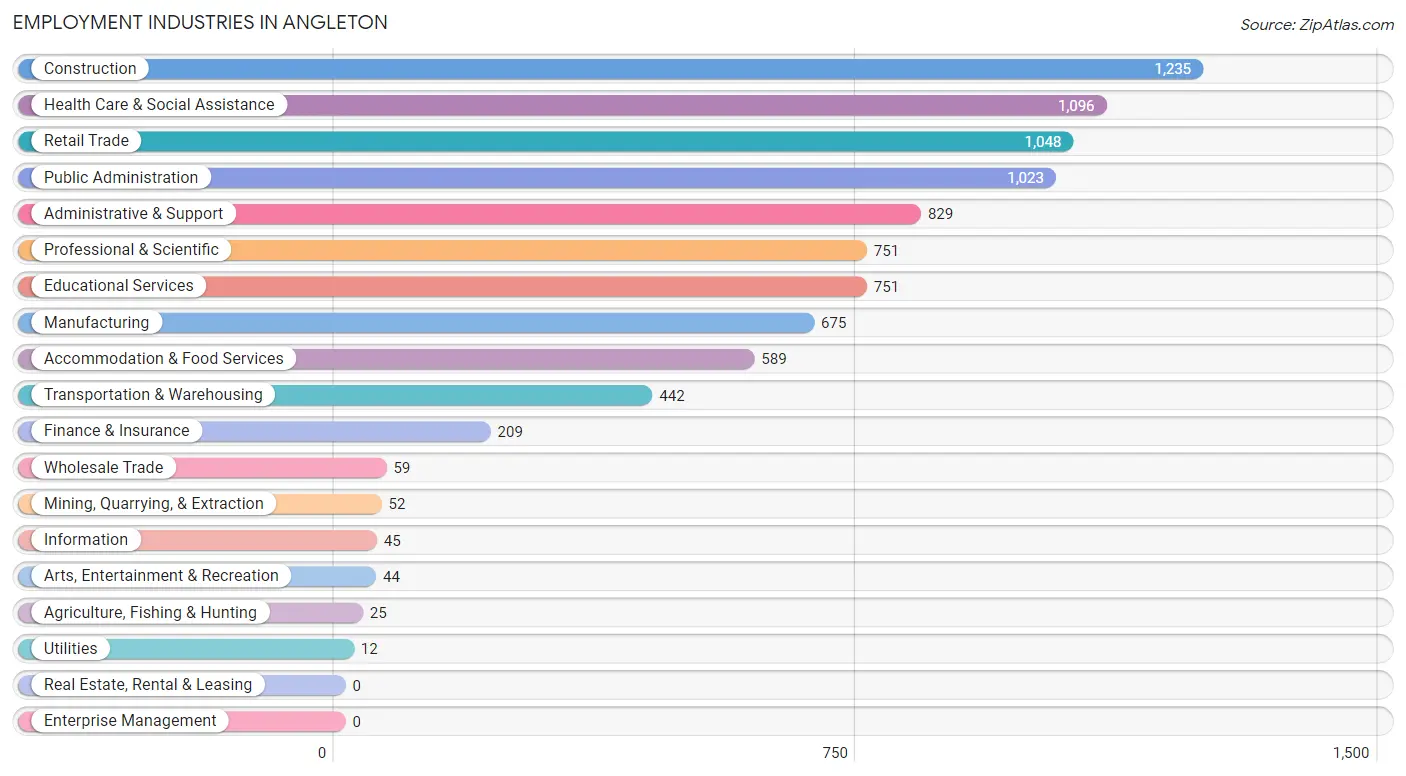
Employment Industries in Angleton
The major employment industries in Angleton include Construction (1,235 | 13.2%), Health Care & Social Assistance (1,096 | 11.7%), Retail Trade (1,048 | 11.2%), Public Administration (1,023 | 11.0%), and Administrative & Support (829 | 8.9%).
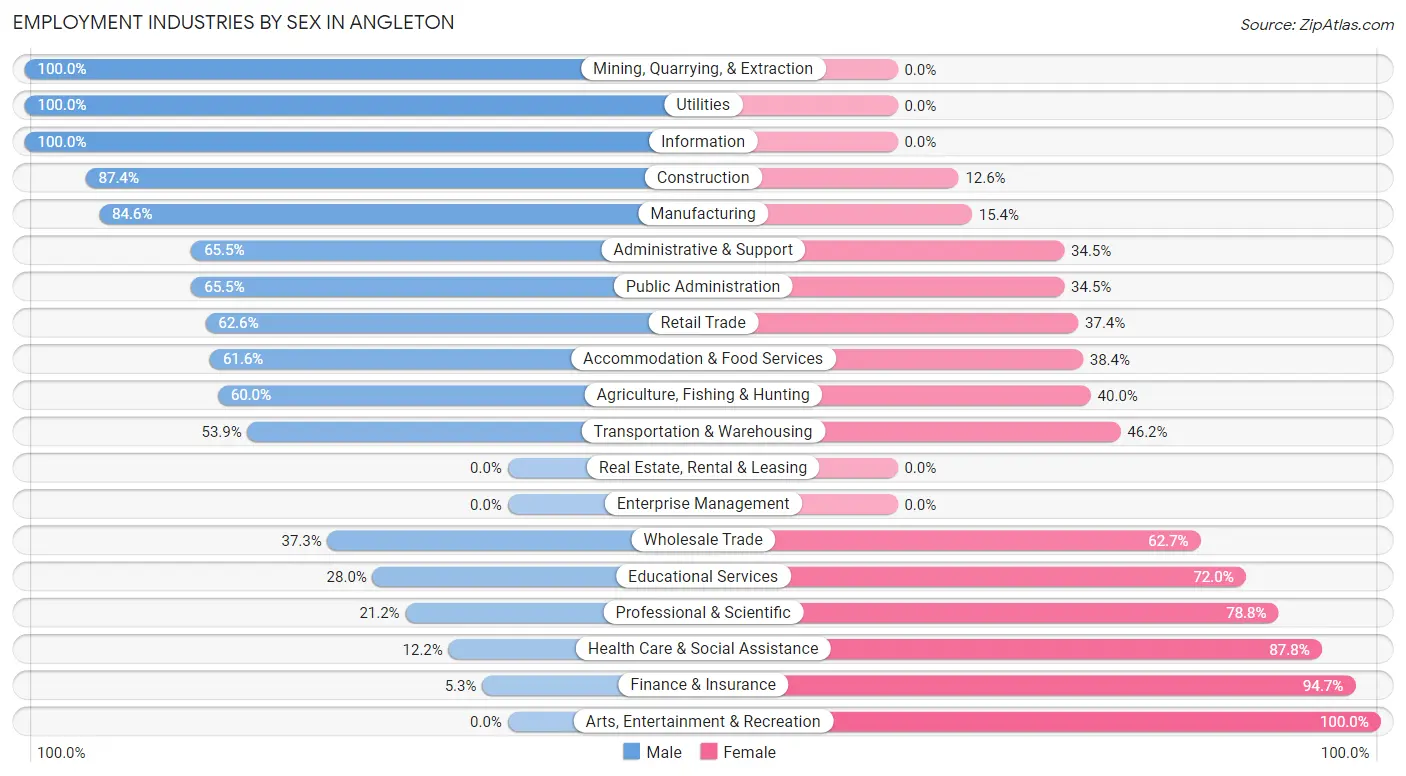
Employment Industries by Sex in Angleton
The Angleton industries that see more men than women are Mining, Quarrying, & Extraction (100.0%), Utilities (100.0%), and Information (100.0%), whereas the industries that tend to have a higher number of women are Arts, Entertainment & Recreation (100.0%), Finance & Insurance (94.7%), and Health Care & Social Assistance (87.8%).
| Industry | Male | Female |
| Agriculture, Fishing & Hunting | 15 (60.0%) | 10 (40.0%) |
| Mining, Quarrying, & Extraction | 52 (100.0%) | 0 (0.0%) |
| Construction | 1,079 (87.4%) | 156 (12.6%) |
| Manufacturing | 571 (84.6%) | 104 (15.4%) |
| Wholesale Trade | 22 (37.3%) | 37 (62.7%) |
| Retail Trade | 656 (62.6%) | 392 (37.4%) |
| Transportation & Warehousing | 238 (53.8%) | 204 (46.2%) |
| Utilities | 12 (100.0%) | 0 (0.0%) |
| Information | 45 (100.0%) | 0 (0.0%) |
| Finance & Insurance | 11 (5.3%) | 198 (94.7%) |
| Real Estate, Rental & Leasing | 0 (0.0%) | 0 (0.0%) |
| Professional & Scientific | 159 (21.2%) | 592 (78.8%) |
| Enterprise Management | 0 (0.0%) | 0 (0.0%) |
| Administrative & Support | 543 (65.5%) | 286 (34.5%) |
| Educational Services | 210 (28.0%) | 541 (72.0%) |
| Health Care & Social Assistance | 134 (12.2%) | 962 (87.8%) |
| Arts, Entertainment & Recreation | 0 (0.0%) | 44 (100.0%) |
| Accommodation & Food Services | 363 (61.6%) | 226 (38.4%) |
| Public Administration | 670 (65.5%) | 353 (34.5%) |
| Total | 4,951 (53.1%) | 4,378 (46.9%) |
Education in Angleton
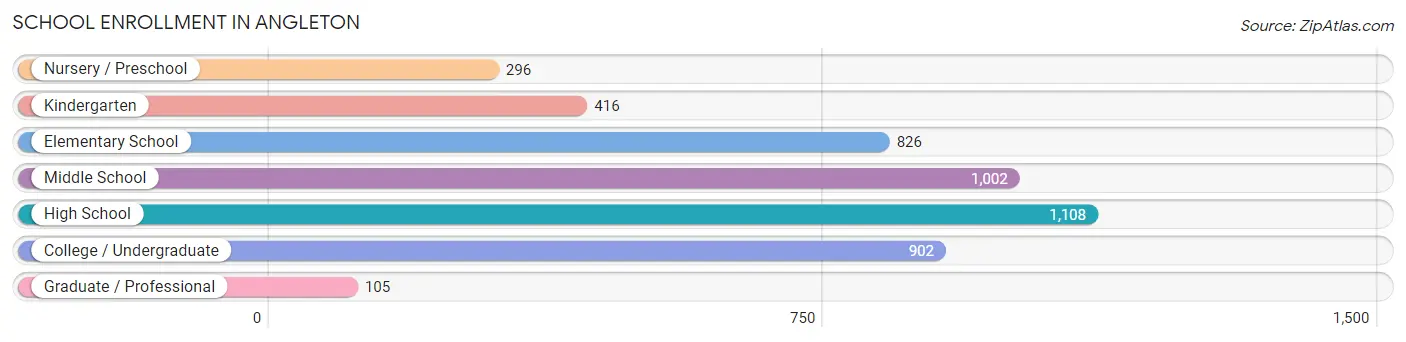
School Enrollment in Angleton
The most common levels of schooling among the 4,655 students in Angleton are high school (1,108 | 23.8%), middle school (1,002 | 21.5%), and college / undergraduate (902 | 19.4%).
| School Level | # Students | % Students |
| Nursery / Preschool | 296 | 6.4% |
| Kindergarten | 416 | 8.9% |
| Elementary School | 826 | 17.7% |
| Middle School | 1,002 | 21.5% |
| High School | 1,108 | 23.8% |
| College / Undergraduate | 902 | 19.4% |
| Graduate / Professional | 105 | 2.3% |
| Total | 4,655 | 100.0% |
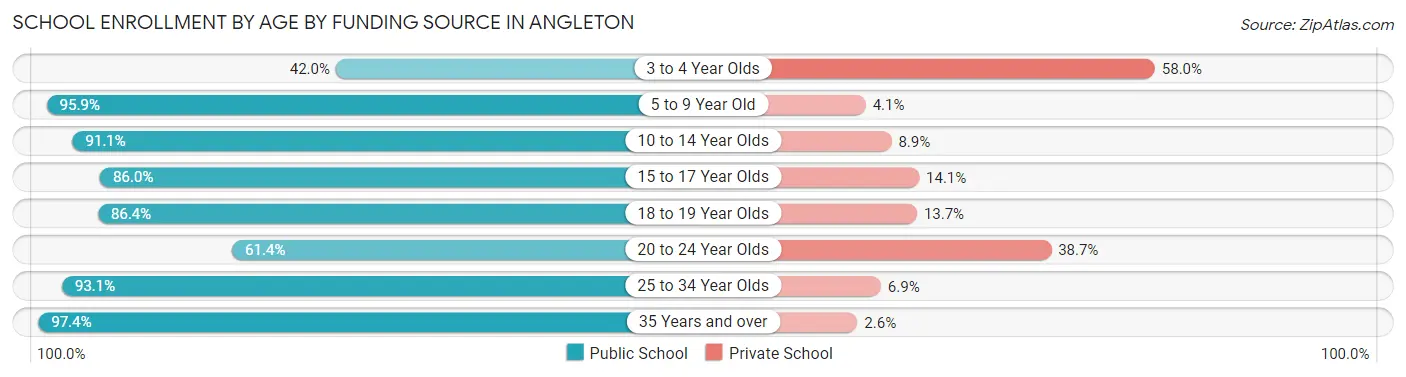
School Enrollment by Age by Funding Source in Angleton
Out of a total of 4,655 students who are enrolled in schools in Angleton, 591 (12.7%) attend a private institution, while the remaining 4,064 (87.3%) are enrolled in public schools. The age group of 3 to 4 year olds has the highest likelihood of being enrolled in private schools, with 91 (58.0% in the age bracket) enrolled. Conversely, the age group of 35 years and over has the lowest likelihood of being enrolled in a private school, with 343 (97.4% in the age bracket) attending a public institution.
| Age Bracket | Public School | Private School |
| 3 to 4 Year Olds | 66 (42.0%) | 91 (58.0%) |
| 5 to 9 Year Old | 1,166 (95.9%) | 50 (4.1%) |
| 10 to 14 Year Olds | 1,208 (91.1%) | 118 (8.9%) |
| 15 to 17 Year Olds | 471 (86.0%) | 77 (14.1%) |
| 18 to 19 Year Olds | 367 (86.4%) | 58 (13.7%) |
| 20 to 24 Year Olds | 281 (61.4%) | 177 (38.7%) |
| 25 to 34 Year Olds | 161 (93.1%) | 12 (6.9%) |
| 35 Years and over | 343 (97.4%) | 9 (2.6%) |
| Total | 4,064 (87.3%) | 591 (12.7%) |
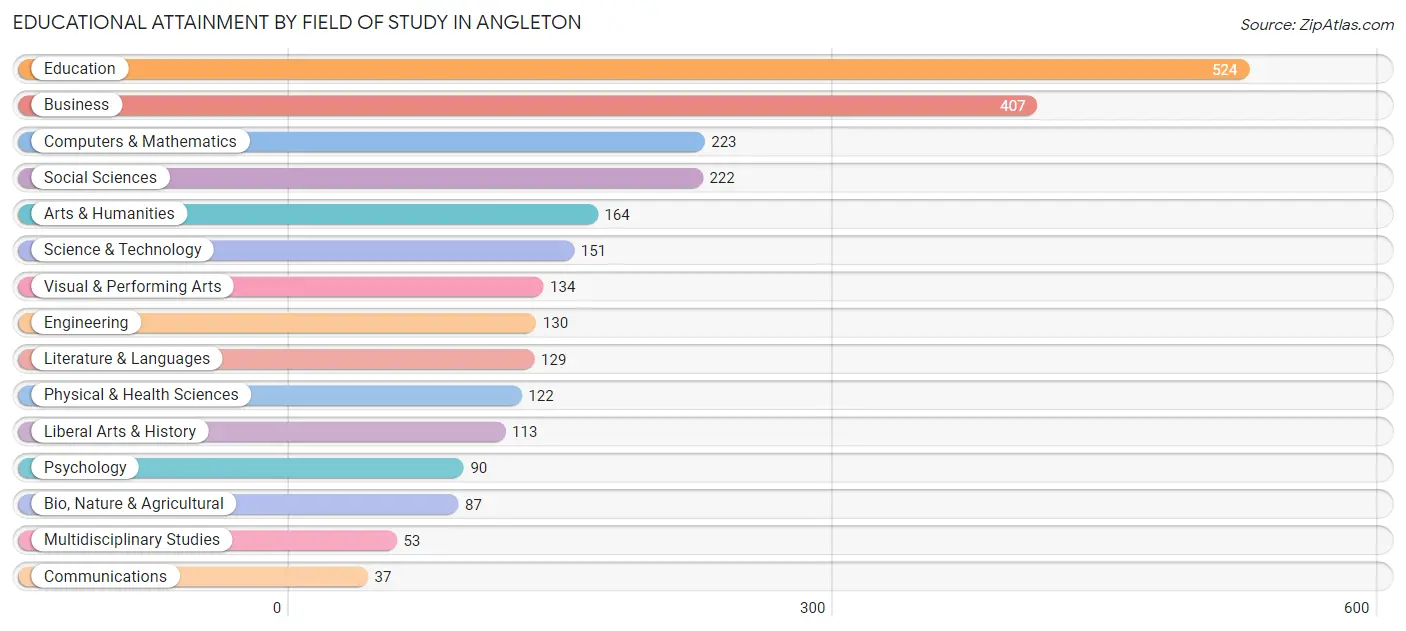
Educational Attainment by Field of Study in Angleton
Education (524 | 20.3%), business (407 | 15.7%), computers & mathematics (223 | 8.6%), social sciences (222 | 8.6%), and arts & humanities (164 | 6.3%) are the most common fields of study among 2,586 individuals in Angleton who have obtained a bachelor's degree or higher.
| Field of Study | # Graduates | % Graduates |
| Computers & Mathematics | 223 | 8.6% |
| Bio, Nature & Agricultural | 87 | 3.4% |
| Physical & Health Sciences | 122 | 4.7% |
| Psychology | 90 | 3.5% |
| Social Sciences | 222 | 8.6% |
| Engineering | 130 | 5.0% |
| Multidisciplinary Studies | 53 | 2.1% |
| Science & Technology | 151 | 5.8% |
| Business | 407 | 15.7% |
| Education | 524 | 20.3% |
| Literature & Languages | 129 | 5.0% |
| Liberal Arts & History | 113 | 4.4% |
| Visual & Performing Arts | 134 | 5.2% |
| Communications | 37 | 1.4% |
| Arts & Humanities | 164 | 6.3% |
| Total | 2,586 | 100.0% |
Transportation & Commute in Angleton
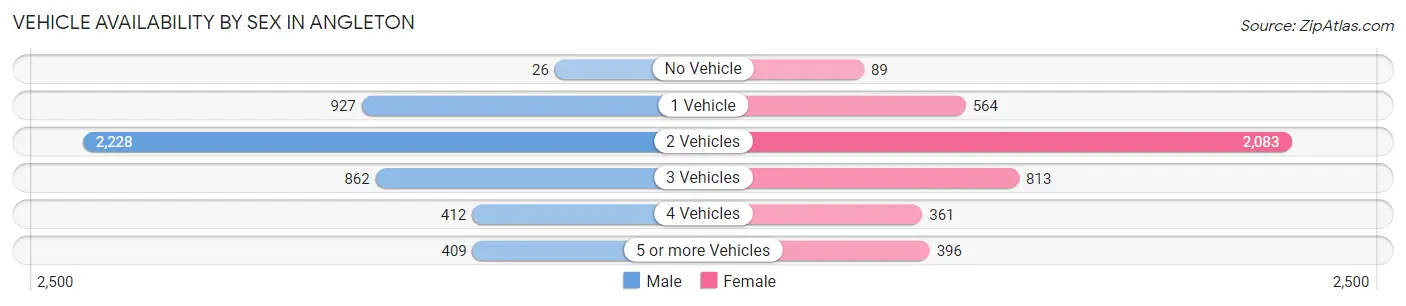
Vehicle Availability by Sex in Angleton
The most prevalent vehicle ownership categories in Angleton are males with 2 vehicles (2,228, accounting for 45.8%) and females with 2 vehicles (2,083, making up 51.7%).
| Vehicles Available | Male | Female |
| No Vehicle | 26 (0.5%) | 89 (2.1%) |
| 1 Vehicle | 927 (19.1%) | 564 (13.1%) |
| 2 Vehicles | 2,228 (45.8%) | 2,083 (48.4%) |
| 3 Vehicles | 862 (17.7%) | 813 (18.9%) |
| 4 Vehicles | 412 (8.5%) | 361 (8.4%) |
| 5 or more Vehicles | 409 (8.4%) | 396 (9.2%) |
| Total | 4,864 (100.0%) | 4,306 (100.0%) |
Commute Time in Angleton
The most frequently occuring commute durations in Angleton are 30 to 34 minutes (1,410 commuters, 16.2%), 20 to 24 minutes (1,252 commuters, 14.4%), and 10 to 14 minutes (1,145 commuters, 13.2%).
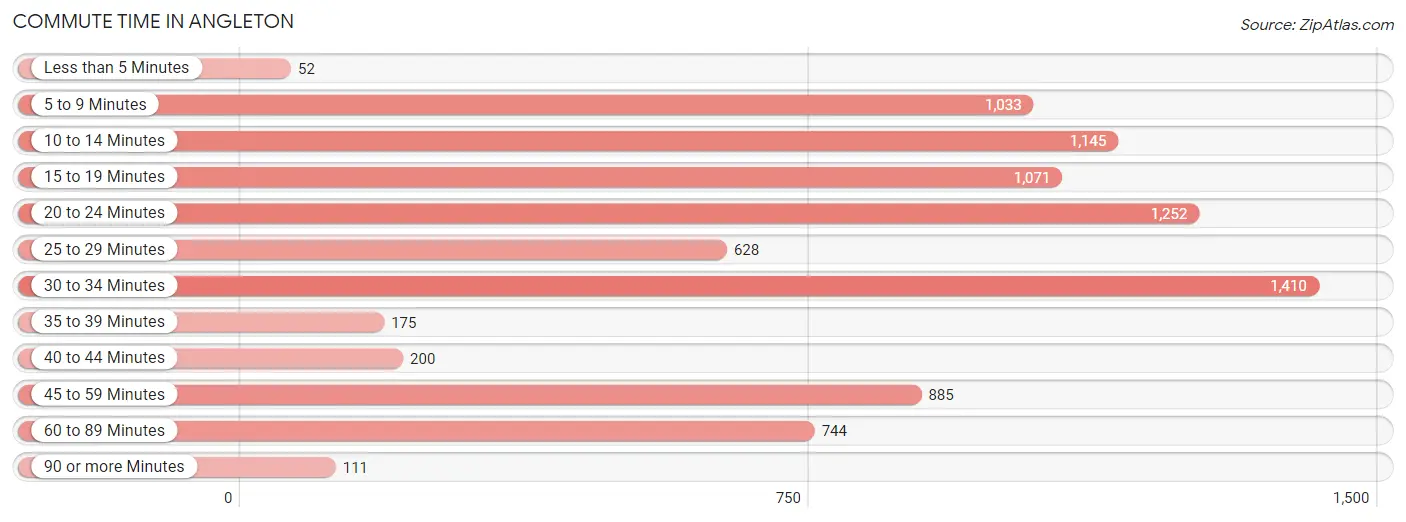
| Commute Time | # Commuters | % Commuters |
| Less than 5 Minutes | 52 | 0.6% |
| 5 to 9 Minutes | 1,033 | 11.9% |
| 10 to 14 Minutes | 1,145 | 13.2% |
| 15 to 19 Minutes | 1,071 | 12.3% |
| 20 to 24 Minutes | 1,252 | 14.4% |
| 25 to 29 Minutes | 628 | 7.2% |
| 30 to 34 Minutes | 1,410 | 16.2% |
| 35 to 39 Minutes | 175 | 2.0% |
| 40 to 44 Minutes | 200 | 2.3% |
| 45 to 59 Minutes | 885 | 10.2% |
| 60 to 89 Minutes | 744 | 8.6% |
| 90 or more Minutes | 111 | 1.3% |
Commute Time by Sex in Angleton
The most common commute times in Angleton are 30 to 34 minutes (1,040 commuters, 22.5%) for males and 10 to 14 minutes (732 commuters, 17.9%) for females.
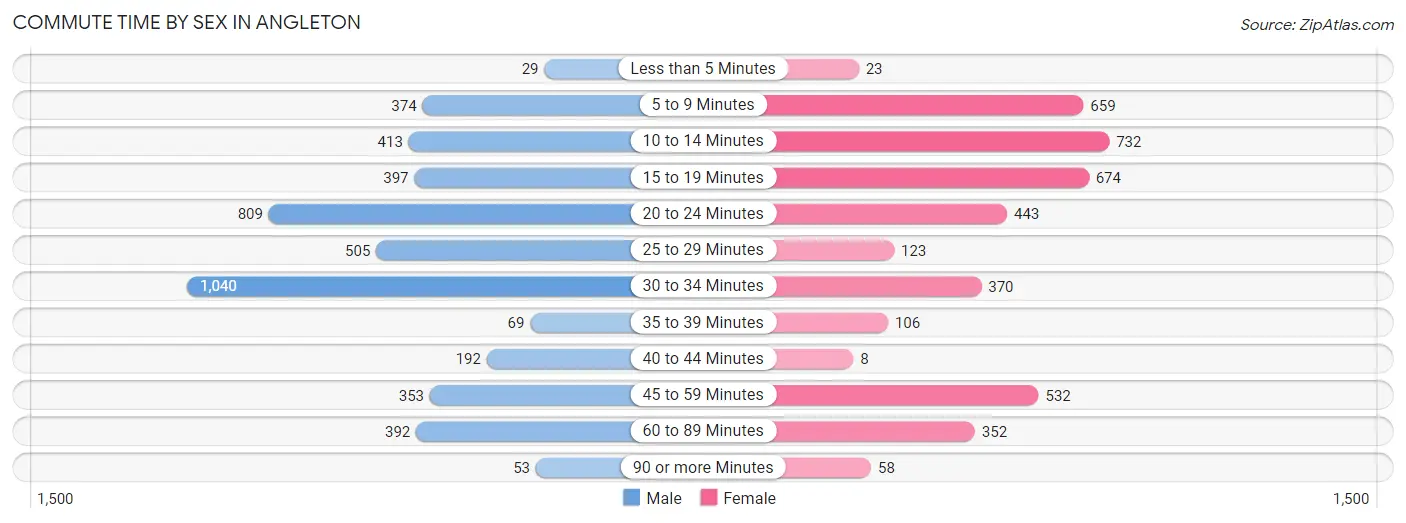
| Commute Time | Male | Female |
| Less than 5 Minutes | 29 (0.6%) | 23 (0.6%) |
| 5 to 9 Minutes | 374 (8.1%) | 659 (16.2%) |
| 10 to 14 Minutes | 413 (8.9%) | 732 (17.9%) |
| 15 to 19 Minutes | 397 (8.6%) | 674 (16.5%) |
| 20 to 24 Minutes | 809 (17.5%) | 443 (10.9%) |
| 25 to 29 Minutes | 505 (10.9%) | 123 (3.0%) |
| 30 to 34 Minutes | 1,040 (22.5%) | 370 (9.1%) |
| 35 to 39 Minutes | 69 (1.5%) | 106 (2.6%) |
| 40 to 44 Minutes | 192 (4.2%) | 8 (0.2%) |
| 45 to 59 Minutes | 353 (7.6%) | 532 (13.0%) |
| 60 to 89 Minutes | 392 (8.5%) | 352 (8.6%) |
| 90 or more Minutes | 53 (1.1%) | 58 (1.4%) |
Time of Departure to Work by Sex in Angleton
The most frequent times of departure to work in Angleton are 6:30 AM to 6:59 AM (684, 14.8%) for males and 7:00 AM to 7:29 AM (1,134, 27.8%) for females.
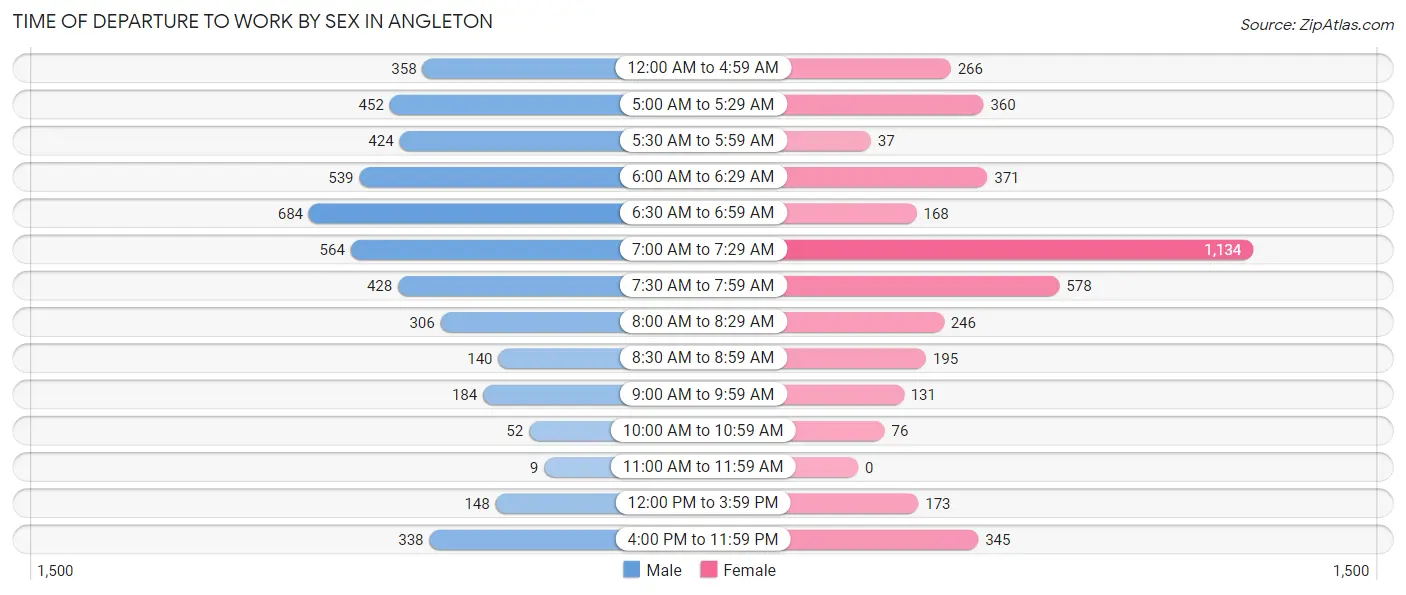
| Time of Departure | Male | Female |
| 12:00 AM to 4:59 AM | 358 (7.7%) | 266 (6.5%) |
| 5:00 AM to 5:29 AM | 452 (9.8%) | 360 (8.8%) |
| 5:30 AM to 5:59 AM | 424 (9.2%) | 37 (0.9%) |
| 6:00 AM to 6:29 AM | 539 (11.7%) | 371 (9.1%) |
| 6:30 AM to 6:59 AM | 684 (14.8%) | 168 (4.1%) |
| 7:00 AM to 7:29 AM | 564 (12.2%) | 1,134 (27.8%) |
| 7:30 AM to 7:59 AM | 428 (9.2%) | 578 (14.2%) |
| 8:00 AM to 8:29 AM | 306 (6.6%) | 246 (6.0%) |
| 8:30 AM to 8:59 AM | 140 (3.0%) | 195 (4.8%) |
| 9:00 AM to 9:59 AM | 184 (4.0%) | 131 (3.2%) |
| 10:00 AM to 10:59 AM | 52 (1.1%) | 76 (1.9%) |
| 11:00 AM to 11:59 AM | 9 (0.2%) | 0 (0.0%) |
| 12:00 PM to 3:59 PM | 148 (3.2%) | 173 (4.2%) |
| 4:00 PM to 11:59 PM | 338 (7.3%) | 345 (8.5%) |
| Total | 4,626 (100.0%) | 4,080 (100.0%) |
Housing Occupancy in Angleton
Occupancy by Ownership in Angleton
Of the total 7,681 dwellings in Angleton, owner-occupied units account for 4,951 (64.5%), while renter-occupied units make up 2,730 (35.5%).
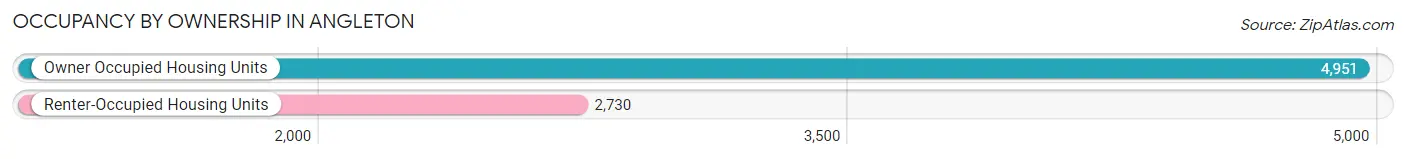
| Occupancy | # Housing Units | % Housing Units |
| Owner Occupied Housing Units | 4,951 | 64.5% |
| Renter-Occupied Housing Units | 2,730 | 35.5% |
| Total Occupied Housing Units | 7,681 | 100.0% |
Occupancy by Household Size in Angleton
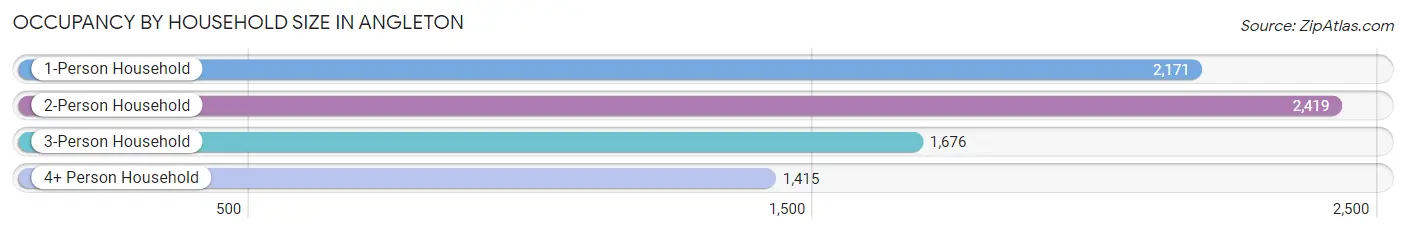
| Household Size | # Housing Units | % Housing Units |
| 1-Person Household | 2,171 | 28.3% |
| 2-Person Household | 2,419 | 31.5% |
| 3-Person Household | 1,676 | 21.8% |
| 4+ Person Household | 1,415 | 18.4% |
| Total Housing Units | 7,681 | 100.0% |
Occupancy by Ownership by Household Size in Angleton
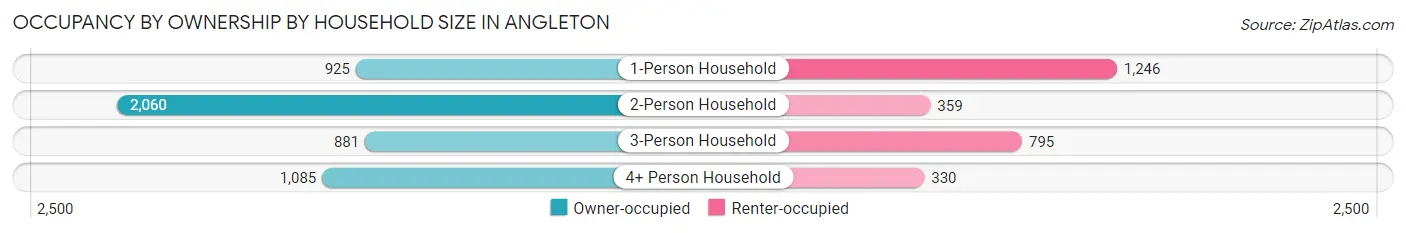
| Household Size | Owner-occupied | Renter-occupied |
| 1-Person Household | 925 (42.6%) | 1,246 (57.4%) |
| 2-Person Household | 2,060 (85.2%) | 359 (14.8%) |
| 3-Person Household | 881 (52.6%) | 795 (47.4%) |
| 4+ Person Household | 1,085 (76.7%) | 330 (23.3%) |
| Total Housing Units | 4,951 (64.5%) | 2,730 (35.5%) |
Occupancy by Educational Attainment in Angleton
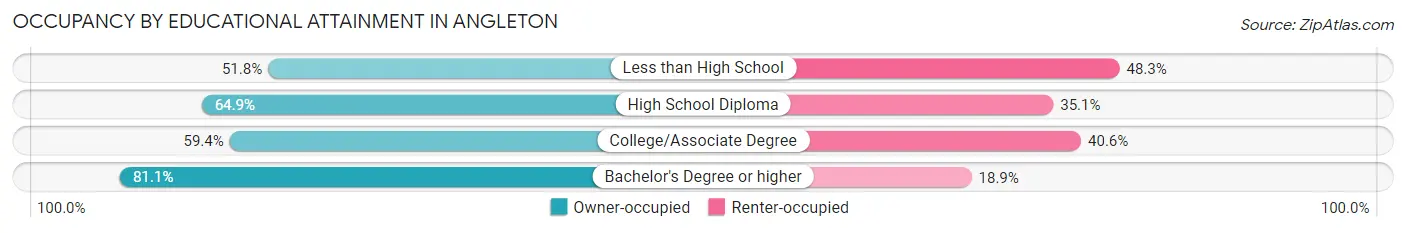
| Household Size | Owner-occupied | Renter-occupied |
| Less than High School | 355 (51.7%) | 331 (48.2%) |
| High School Diploma | 1,515 (64.9%) | 820 (35.1%) |
| College/Associate Degree | 1,907 (59.4%) | 1,305 (40.6%) |
| Bachelor's Degree or higher | 1,174 (81.1%) | 274 (18.9%) |
Occupancy by Age of Householder in Angleton
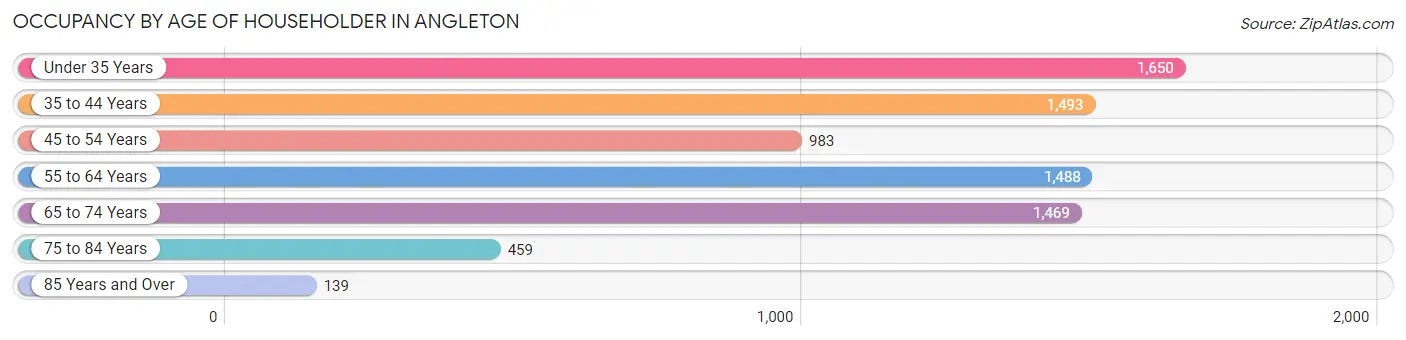
| Age Bracket | # Households | % Households |
| Under 35 Years | 1,650 | 21.5% |
| 35 to 44 Years | 1,493 | 19.4% |
| 45 to 54 Years | 983 | 12.8% |
| 55 to 64 Years | 1,488 | 19.4% |
| 65 to 74 Years | 1,469 | 19.1% |
| 75 to 84 Years | 459 | 6.0% |
| 85 Years and Over | 139 | 1.8% |
| Total | 7,681 | 100.0% |
Housing Finances in Angleton
Median Income by Occupancy in Angleton
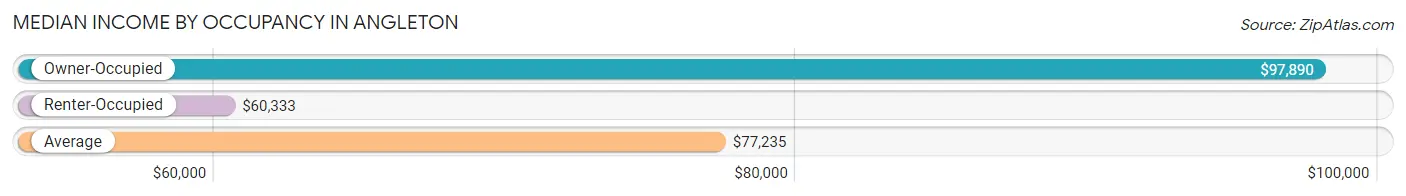
| Occupancy Type | # Households | Median Income |
| Owner-Occupied | 4,951 (64.5%) | $97,890 |
| Renter-Occupied | 2,730 (35.5%) | $60,333 |
| Average | 7,681 (100.0%) | $77,235 |
Occupancy by Householder Income Bracket in Angleton
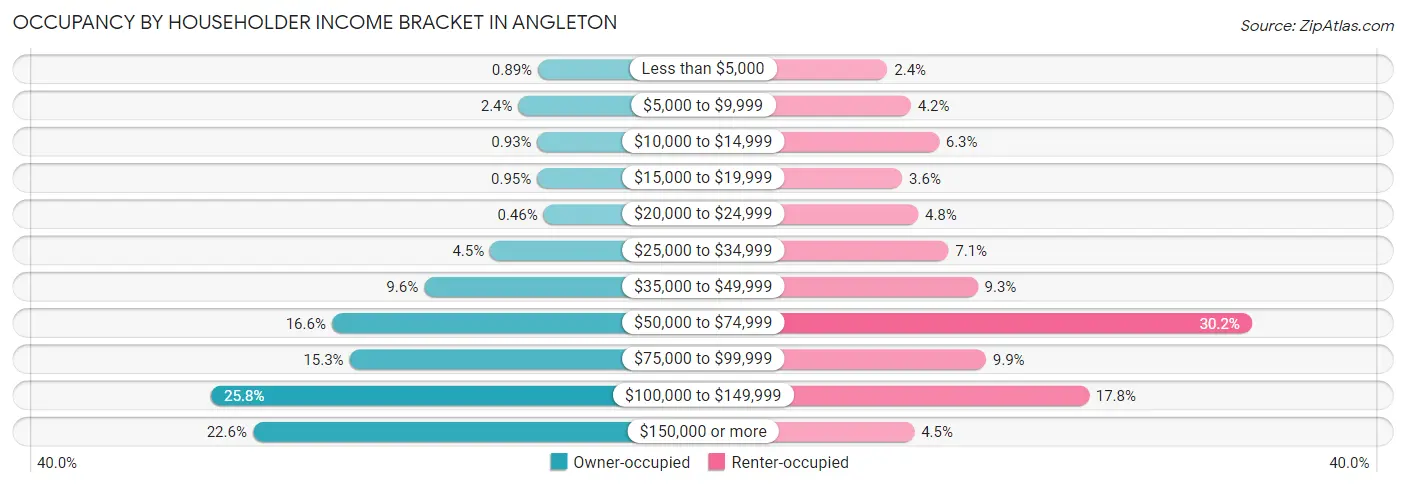
| Income Bracket | Owner-occupied | Renter-occupied |
| Less than $5,000 | 44 (0.9%) | 66 (2.4%) |
| $5,000 to $9,999 | 118 (2.4%) | 115 (4.2%) |
| $10,000 to $14,999 | 46 (0.9%) | 173 (6.3%) |
| $15,000 to $19,999 | 47 (0.9%) | 97 (3.5%) |
| $20,000 to $24,999 | 23 (0.5%) | 130 (4.8%) |
| $25,000 to $34,999 | 225 (4.5%) | 193 (7.1%) |
| $35,000 to $49,999 | 474 (9.6%) | 254 (9.3%) |
| $50,000 to $74,999 | 822 (16.6%) | 824 (30.2%) |
| $75,000 to $99,999 | 755 (15.2%) | 271 (9.9%) |
| $100,000 to $149,999 | 1,277 (25.8%) | 485 (17.8%) |
| $150,000 or more | 1,120 (22.6%) | 122 (4.5%) |
| Total | 4,951 (100.0%) | 2,730 (100.0%) |
Monthly Housing Cost Tiers in Angleton
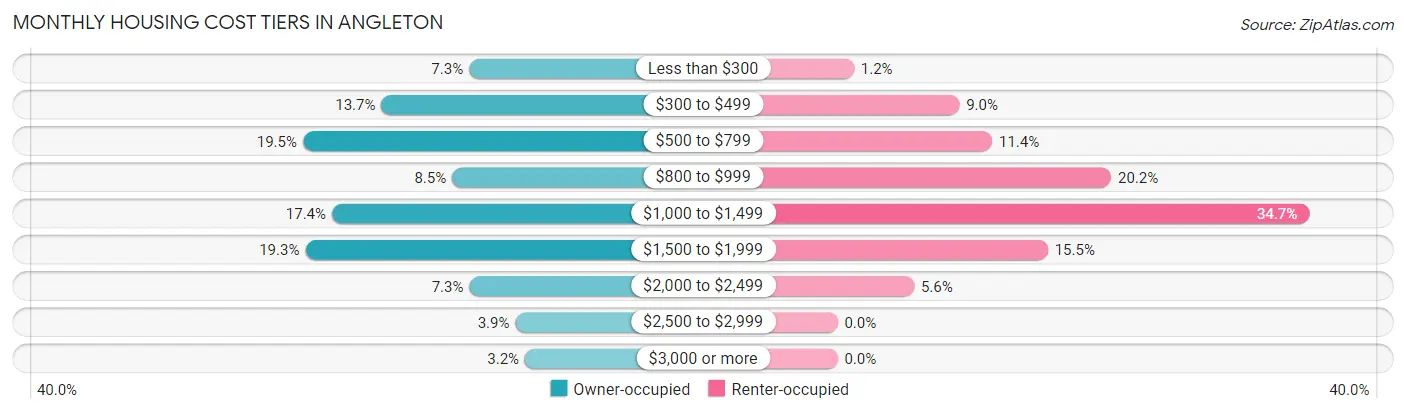
| Monthly Cost | Owner-occupied | Renter-occupied |
| Less than $300 | 360 (7.3%) | 33 (1.2%) |
| $300 to $499 | 680 (13.7%) | 245 (9.0%) |
| $500 to $799 | 966 (19.5%) | 311 (11.4%) |
| $800 to $999 | 422 (8.5%) | 550 (20.2%) |
| $1,000 to $1,499 | 860 (17.4%) | 948 (34.7%) |
| $1,500 to $1,999 | 957 (19.3%) | 423 (15.5%) |
| $2,000 to $2,499 | 359 (7.2%) | 154 (5.6%) |
| $2,500 to $2,999 | 191 (3.9%) | 0 (0.0%) |
| $3,000 or more | 156 (3.2%) | 0 (0.0%) |
| Total | 4,951 (100.0%) | 2,730 (100.0%) |
Physical Housing Characteristics in Angleton
Housing Structures in Angleton
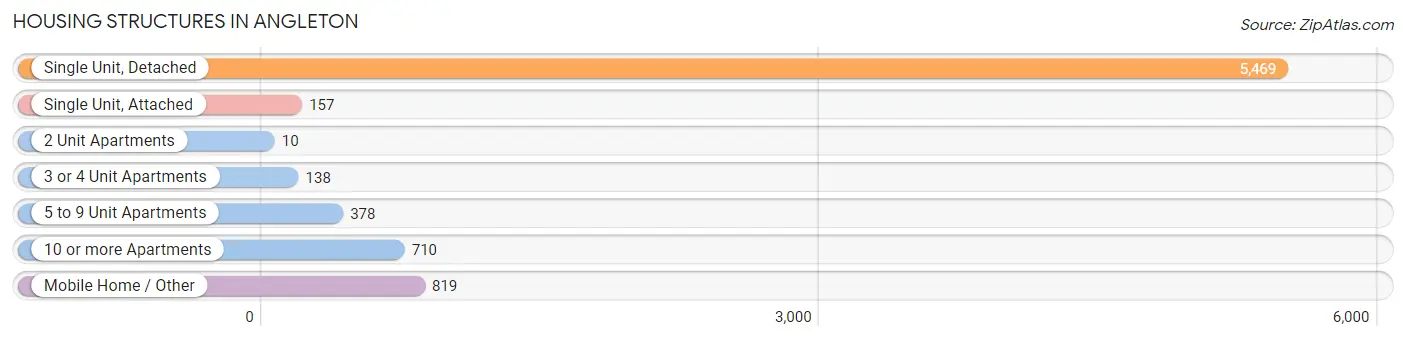
| Structure Type | # Housing Units | % Housing Units |
| Single Unit, Detached | 5,469 | 71.2% |
| Single Unit, Attached | 157 | 2.0% |
| 2 Unit Apartments | 10 | 0.1% |
| 3 or 4 Unit Apartments | 138 | 1.8% |
| 5 to 9 Unit Apartments | 378 | 4.9% |
| 10 or more Apartments | 710 | 9.2% |
| Mobile Home / Other | 819 | 10.7% |
| Total | 7,681 | 100.0% |
Housing Structures by Occupancy in Angleton
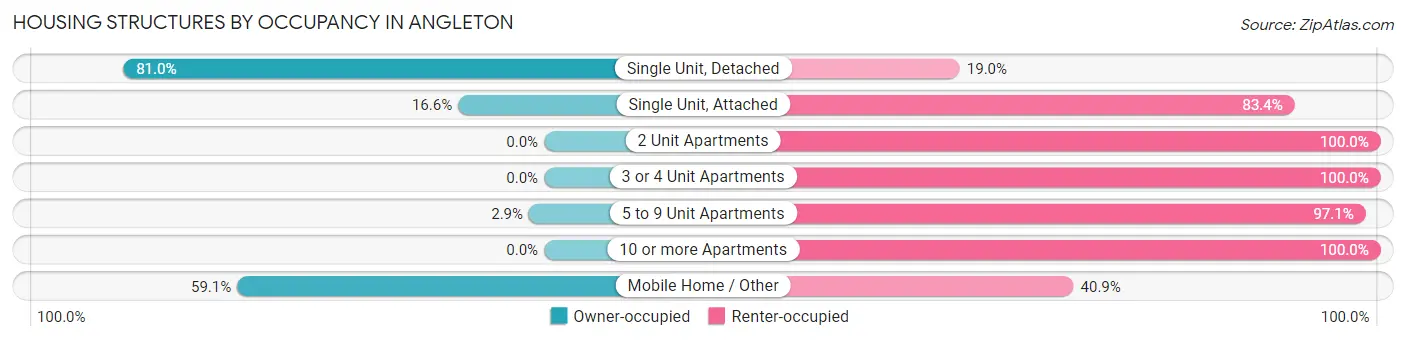
| Structure Type | Owner-occupied | Renter-occupied |
| Single Unit, Detached | 4,430 (81.0%) | 1,039 (19.0%) |
| Single Unit, Attached | 26 (16.6%) | 131 (83.4%) |
| 2 Unit Apartments | 0 (0.0%) | 10 (100.0%) |
| 3 or 4 Unit Apartments | 0 (0.0%) | 138 (100.0%) |
| 5 to 9 Unit Apartments | 11 (2.9%) | 367 (97.1%) |
| 10 or more Apartments | 0 (0.0%) | 710 (100.0%) |
| Mobile Home / Other | 484 (59.1%) | 335 (40.9%) |
| Total | 4,951 (64.5%) | 2,730 (35.5%) |
Housing Structures by Number of Rooms in Angleton

| Number of Rooms | Owner-occupied | Renter-occupied |
| 1 Room | 0 (0.0%) | 15 (0.5%) |
| 2 or 3 Rooms | 37 (0.7%) | 601 (22.0%) |
| 4 or 5 Rooms | 2,119 (42.8%) | 1,662 (60.9%) |
| 6 or 7 Rooms | 2,059 (41.6%) | 439 (16.1%) |
| 8 or more Rooms | 736 (14.9%) | 13 (0.5%) |
| Total | 4,951 (100.0%) | 2,730 (100.0%) |
Housing Structure by Heating Type in Angleton
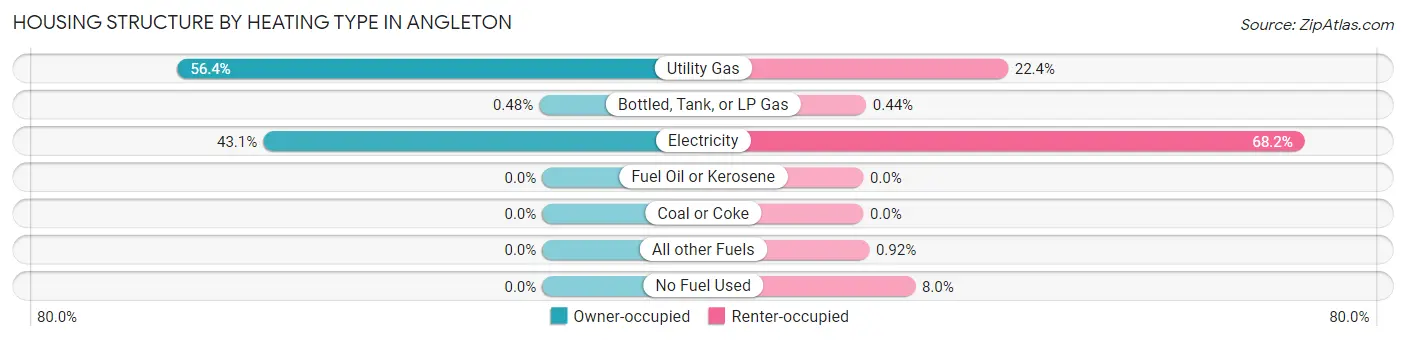
| Heating Type | Owner-occupied | Renter-occupied |
| Utility Gas | 2,791 (56.4%) | 611 (22.4%) |
| Bottled, Tank, or LP Gas | 24 (0.5%) | 12 (0.4%) |
| Electricity | 2,136 (43.1%) | 1,863 (68.2%) |
| Fuel Oil or Kerosene | 0 (0.0%) | 0 (0.0%) |
| Coal or Coke | 0 (0.0%) | 0 (0.0%) |
| All other Fuels | 0 (0.0%) | 25 (0.9%) |
| No Fuel Used | 0 (0.0%) | 219 (8.0%) |
| Total | 4,951 (100.0%) | 2,730 (100.0%) |
Household Vehicle Usage in Angleton
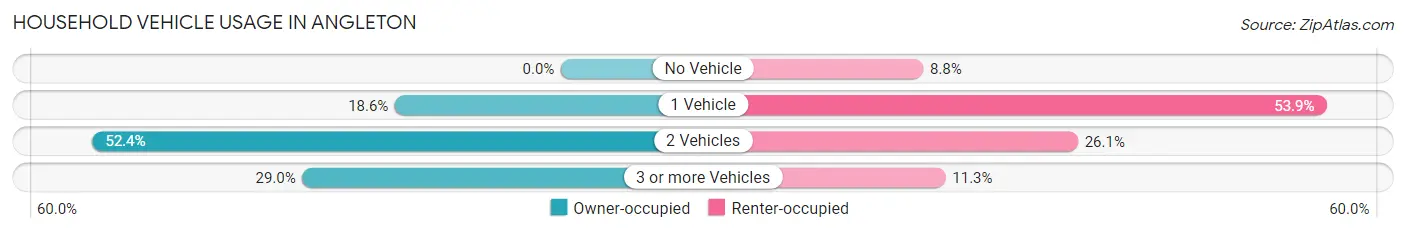
| Vehicles per Household | Owner-occupied | Renter-occupied |
| No Vehicle | 0 (0.0%) | 239 (8.7%) |
| 1 Vehicle | 921 (18.6%) | 1,472 (53.9%) |
| 2 Vehicles | 2,595 (52.4%) | 712 (26.1%) |
| 3 or more Vehicles | 1,435 (29.0%) | 307 (11.3%) |
| Total | 4,951 (100.0%) | 2,730 (100.0%) |
Real Estate & Mortgages in Angleton
Real Estate and Mortgage Overview in Angleton
| Characteristic | Without Mortgage | With Mortgage |
| Housing Units | 2,288 | 2,663 |
| Median Property Value | $136,100 | $190,500 |
| Median Household Income | $75,032 | $846 |
| Monthly Housing Costs | $537 | $156 |
| Real Estate Taxes | $1,764 | $71 |
Property Value by Mortgage Status in Angleton
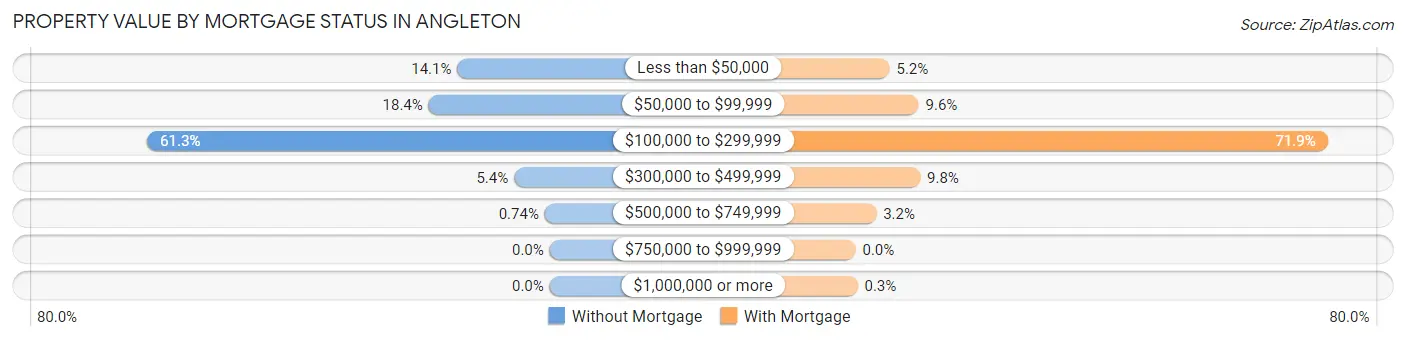
| Property Value | Without Mortgage | With Mortgage |
| Less than $50,000 | 322 (14.1%) | 138 (5.2%) |
| $50,000 to $99,999 | 422 (18.4%) | 256 (9.6%) |
| $100,000 to $299,999 | 1,403 (61.3%) | 1,915 (71.9%) |
| $300,000 to $499,999 | 124 (5.4%) | 262 (9.8%) |
| $500,000 to $749,999 | 17 (0.7%) | 84 (3.2%) |
| $750,000 to $999,999 | 0 (0.0%) | 0 (0.0%) |
| $1,000,000 or more | 0 (0.0%) | 8 (0.3%) |
| Total | 2,288 (100.0%) | 2,663 (100.0%) |
Household Income by Mortgage Status in Angleton
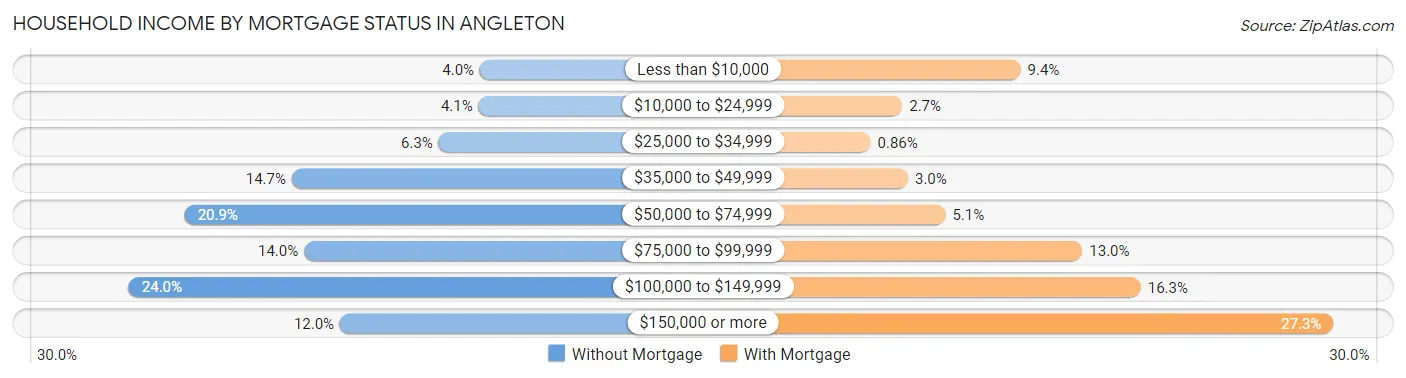
| Household Income | Without Mortgage | With Mortgage |
| Less than $10,000 | 91 (4.0%) | 251 (9.4%) |
| $10,000 to $24,999 | 93 (4.1%) | 71 (2.7%) |
| $25,000 to $34,999 | 145 (6.3%) | 23 (0.9%) |
| $35,000 to $49,999 | 337 (14.7%) | 80 (3.0%) |
| $50,000 to $74,999 | 477 (20.8%) | 137 (5.1%) |
| $75,000 to $99,999 | 321 (14.0%) | 345 (13.0%) |
| $100,000 to $149,999 | 550 (24.0%) | 434 (16.3%) |
| $150,000 or more | 274 (12.0%) | 727 (27.3%) |
| Total | 2,288 (100.0%) | 2,663 (100.0%) |
Property Value to Household Income Ratio in Angleton
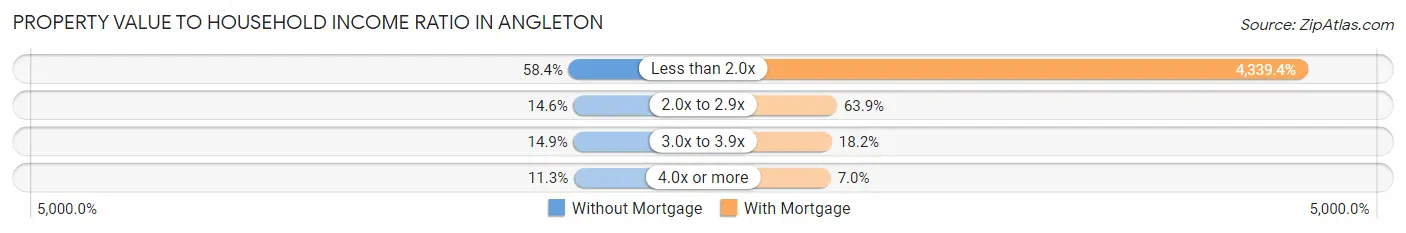
| Value-to-Income Ratio | Without Mortgage | With Mortgage |
| Less than 2.0x | 1,335 (58.4%) | 115,557 (4,339.4%) |
| 2.0x to 2.9x | 335 (14.6%) | 1,701 (63.9%) |
| 3.0x to 3.9x | 340 (14.9%) | 485 (18.2%) |
| 4.0x or more | 258 (11.3%) | 187 (7.0%) |
| Total | 2,288 (100.0%) | 2,663 (100.0%) |
Real Estate Taxes by Mortgage Status in Angleton
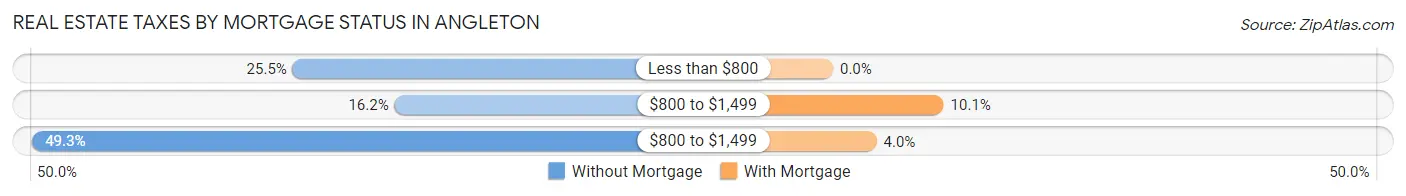
| Property Taxes | Without Mortgage | With Mortgage |
| Less than $800 | 584 (25.5%) | 0 (0.0%) |
| $800 to $1,499 | 371 (16.2%) | 269 (10.1%) |
| $800 to $1,499 | 1,128 (49.3%) | 106 (4.0%) |
| Total | 2,288 (100.0%) | 2,663 (100.0%) |
Health & Disability in Angleton
Health Insurance Coverage by Age in Angleton
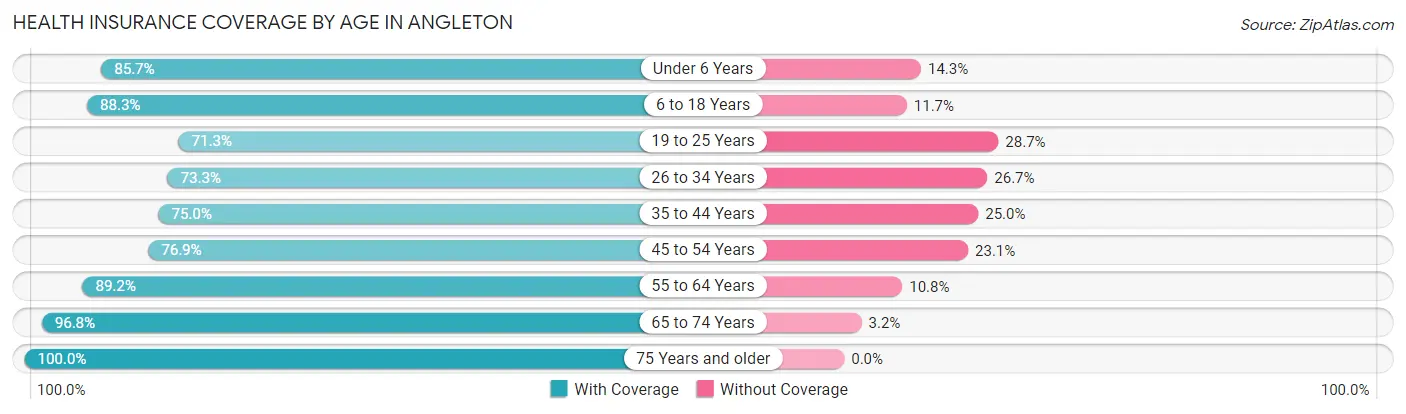
| Age Bracket | With Coverage | Without Coverage |
| Under 6 Years | 1,334 (85.7%) | 223 (14.3%) |
| 6 to 18 Years | 2,854 (88.3%) | 377 (11.7%) |
| 19 to 25 Years | 1,180 (71.3%) | 476 (28.7%) |
| 26 to 34 Years | 1,888 (73.3%) | 687 (26.7%) |
| 35 to 44 Years | 2,077 (75.0%) | 692 (25.0%) |
| 45 to 54 Years | 1,362 (76.9%) | 409 (23.1%) |
| 55 to 64 Years | 2,457 (89.2%) | 298 (10.8%) |
| 65 to 74 Years | 1,887 (96.8%) | 63 (3.2%) |
| 75 Years and older | 1,043 (100.0%) | 0 (0.0%) |
| Total | 16,082 (83.3%) | 3,225 (16.7%) |
Health Insurance Coverage by Citizenship Status in Angleton
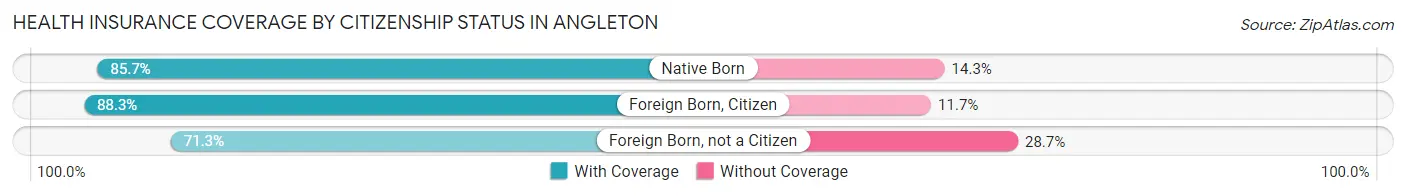
| Citizenship Status | With Coverage | Without Coverage |
| Native Born | 1,334 (85.7%) | 223 (14.3%) |
| Foreign Born, Citizen | 2,854 (88.3%) | 377 (11.7%) |
| Foreign Born, not a Citizen | 1,180 (71.3%) | 476 (28.7%) |
Health Insurance Coverage by Household Income in Angleton
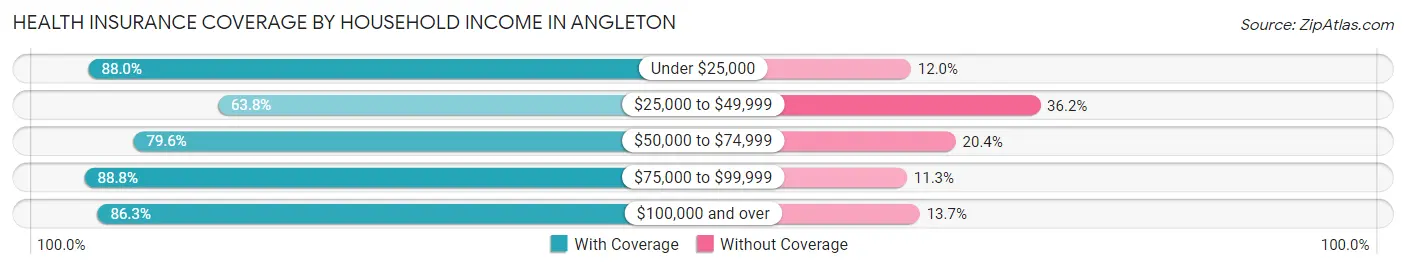
| Household Income | With Coverage | Without Coverage |
| Under $25,000 | 1,650 (88.0%) | 225 (12.0%) |
| $25,000 to $49,999 | 1,301 (63.8%) | 739 (36.2%) |
| $50,000 to $74,999 | 2,964 (79.6%) | 759 (20.4%) |
| $75,000 to $99,999 | 2,975 (88.7%) | 377 (11.3%) |
| $100,000 and over | 7,037 (86.3%) | 1,113 (13.7%) |
Public vs Private Health Insurance Coverage by Age in Angleton
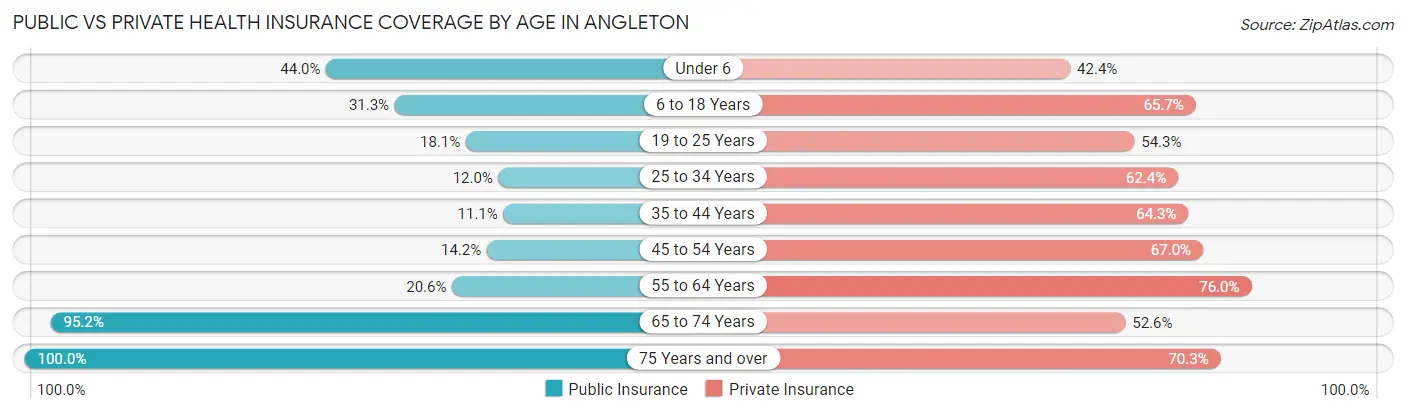
| Age Bracket | Public Insurance | Private Insurance |
| Under 6 | 685 (44.0%) | 660 (42.4%) |
| 6 to 18 Years | 1,010 (31.3%) | 2,122 (65.7%) |
| 19 to 25 Years | 299 (18.1%) | 899 (54.3%) |
| 25 to 34 Years | 309 (12.0%) | 1,607 (62.4%) |
| 35 to 44 Years | 307 (11.1%) | 1,781 (64.3%) |
| 45 to 54 Years | 251 (14.2%) | 1,187 (67.0%) |
| 55 to 64 Years | 568 (20.6%) | 2,094 (76.0%) |
| 65 to 74 Years | 1,856 (95.2%) | 1,026 (52.6%) |
| 75 Years and over | 1,043 (100.0%) | 733 (70.3%) |
| Total | 6,328 (32.8%) | 12,109 (62.7%) |
Disability Status by Sex by Age in Angleton
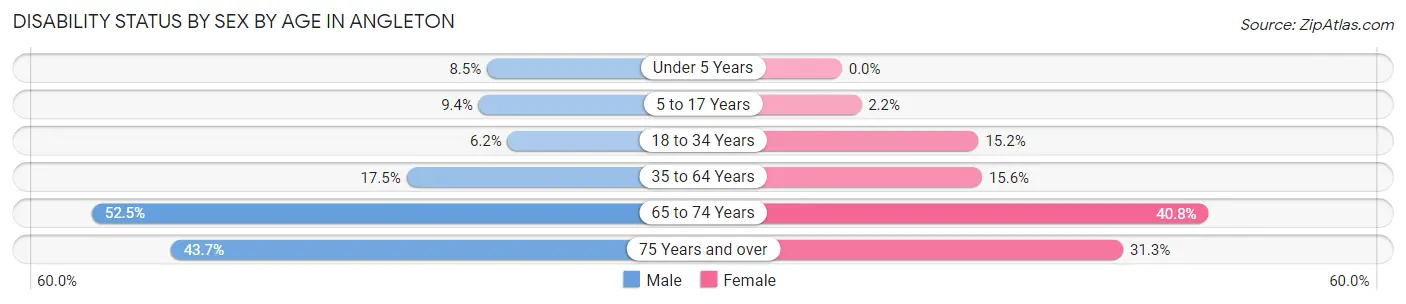
| Age Bracket | Male | Female |
| Under 5 Years | 54 (8.5%) | 0 (0.0%) |
| 5 to 17 Years | 136 (9.4%) | 36 (2.2%) |
| 18 to 34 Years | 135 (6.2%) | 382 (15.2%) |
| 35 to 64 Years | 632 (17.5%) | 574 (15.6%) |
| 65 to 74 Years | 503 (52.5%) | 405 (40.8%) |
| 75 Years and over | 181 (43.7%) | 197 (31.3%) |
Disability Class by Sex by Age in Angleton
Disability Class: Hearing Difficulty
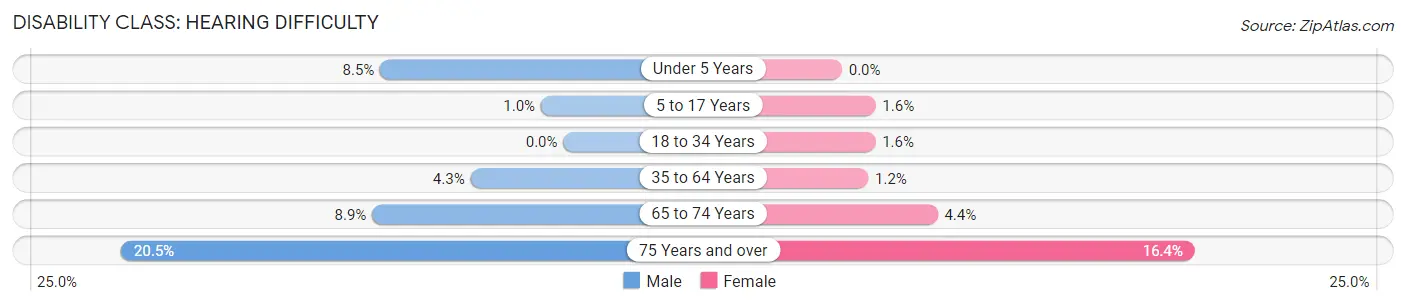
| Age Bracket | Male | Female |
| Under 5 Years | 54 (8.5%) | 0 (0.0%) |
| 5 to 17 Years | 15 (1.0%) | 26 (1.6%) |
| 18 to 34 Years | 0 (0.0%) | 39 (1.5%) |
| 35 to 64 Years | 156 (4.3%) | 45 (1.2%) |
| 65 to 74 Years | 85 (8.9%) | 44 (4.4%) |
| 75 Years and over | 85 (20.5%) | 103 (16.4%) |
Disability Class: Vision Difficulty
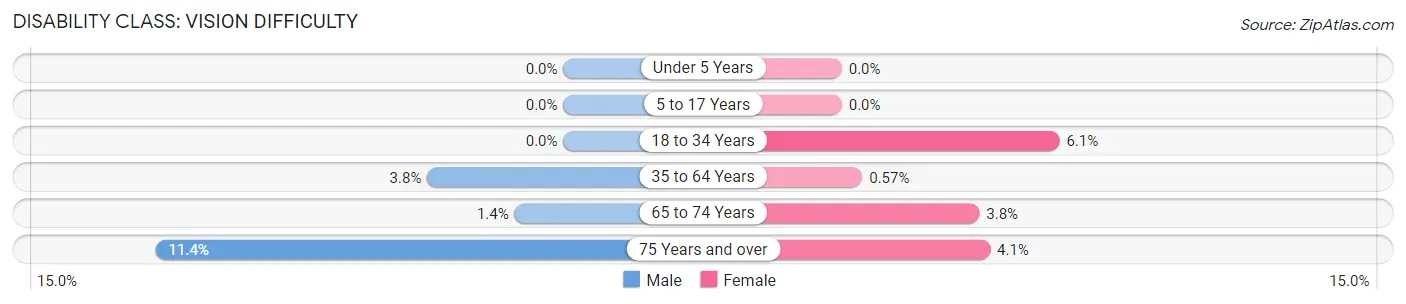
| Age Bracket | Male | Female |
| Under 5 Years | 0 (0.0%) | 0 (0.0%) |
| 5 to 17 Years | 0 (0.0%) | 0 (0.0%) |
| 18 to 34 Years | 0 (0.0%) | 152 (6.1%) |
| 35 to 64 Years | 137 (3.8%) | 21 (0.6%) |
| 65 to 74 Years | 13 (1.4%) | 38 (3.8%) |
| 75 Years and over | 47 (11.4%) | 26 (4.1%) |
Disability Class: Cognitive Difficulty
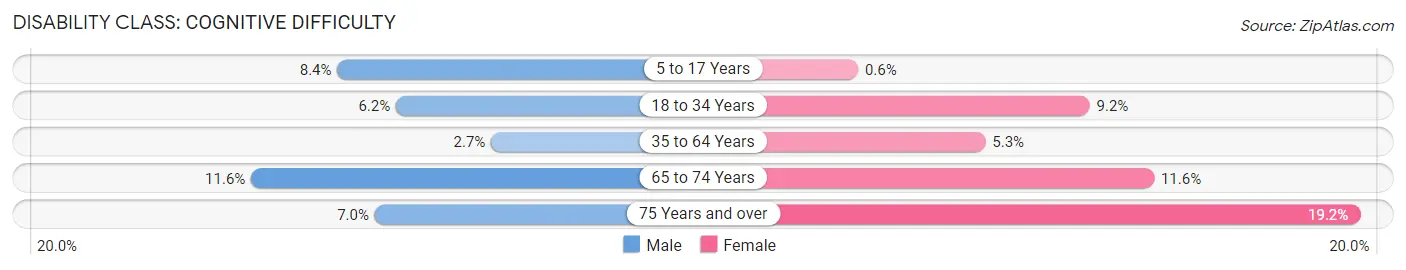
| Age Bracket | Male | Female |
| 5 to 17 Years | 121 (8.4%) | 10 (0.6%) |
| 18 to 34 Years | 135 (6.2%) | 231 (9.2%) |
| 35 to 64 Years | 97 (2.7%) | 196 (5.3%) |
| 65 to 74 Years | 111 (11.6%) | 115 (11.6%) |
| 75 Years and over | 29 (7.0%) | 121 (19.2%) |
Disability Class: Ambulatory Difficulty
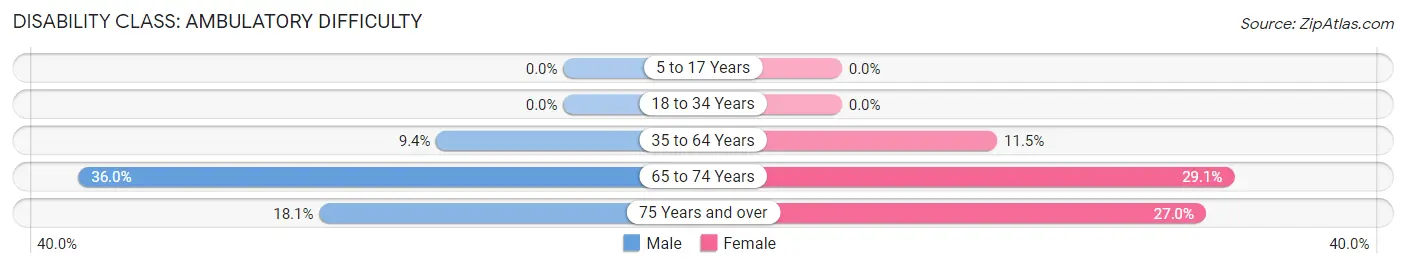
| Age Bracket | Male | Female |
| 5 to 17 Years | 0 (0.0%) | 0 (0.0%) |
| 18 to 34 Years | 0 (0.0%) | 0 (0.0%) |
| 35 to 64 Years | 341 (9.4%) | 424 (11.5%) |
| 65 to 74 Years | 345 (36.0%) | 289 (29.1%) |
| 75 Years and over | 75 (18.1%) | 170 (27.0%) |
Disability Class: Self-Care Difficulty
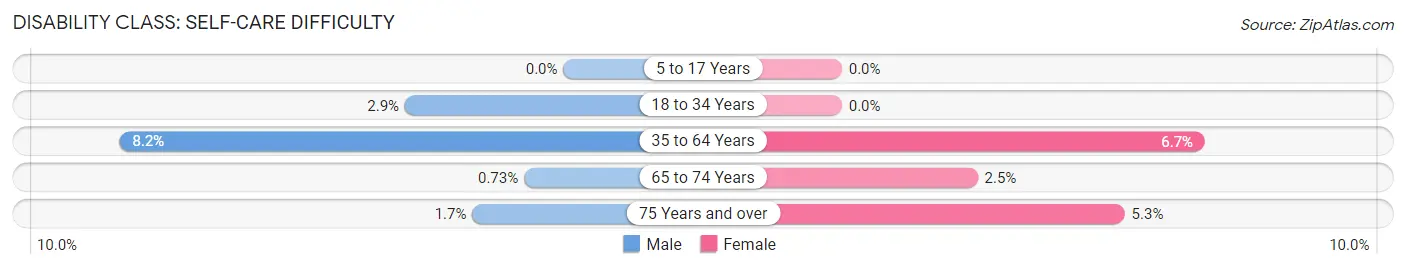
| Age Bracket | Male | Female |
| 5 to 17 Years | 0 (0.0%) | 0 (0.0%) |
| 18 to 34 Years | 64 (2.9%) | 0 (0.0%) |
| 35 to 64 Years | 298 (8.2%) | 248 (6.7%) |
| 65 to 74 Years | 7 (0.7%) | 25 (2.5%) |
| 75 Years and over | 7 (1.7%) | 33 (5.2%) |
Technology Access in Angleton
Computing Device Access in Angleton
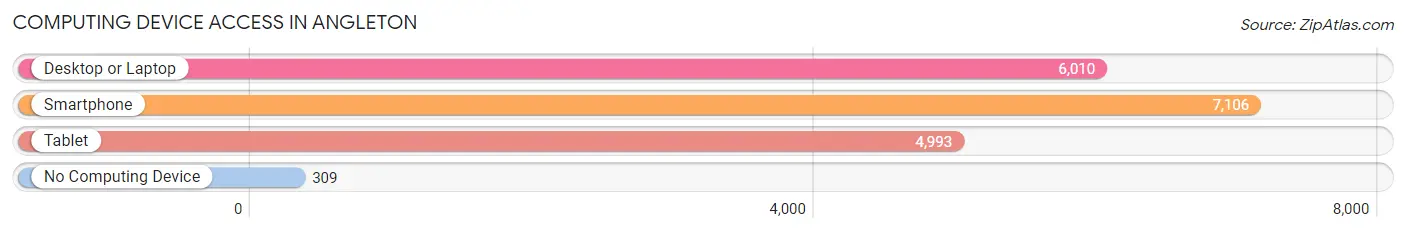
| Device Type | # Households | % Households |
| Desktop or Laptop | 6,010 | 78.2% |
| Smartphone | 7,106 | 92.5% |
| Tablet | 4,993 | 65.0% |
| No Computing Device | 309 | 4.0% |
| Total | 7,681 | 100.0% |
Internet Access in Angleton
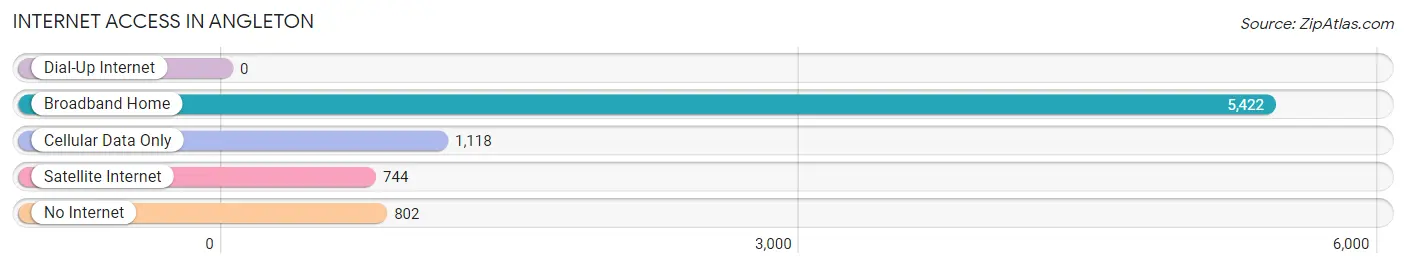
| Internet Type | # Households | % Households |
| Dial-Up Internet | 0 | 0.0% |
| Broadband Home | 5,422 | 70.6% |
| Cellular Data Only | 1,118 | 14.6% |
| Satellite Internet | 744 | 9.7% |
| No Internet | 802 | 10.4% |
| Total | 7,681 | 100.0% |
Angleton Summary
Angleton, Texas is a city located in Brazoria County, Texas, United States. It is the county seat of Brazoria County and is located in the Houston–The Woodlands–Sugar Land metropolitan area. The city is located about 50 miles south of Houston and is part of the Greater Houston metropolitan area. As of the 2010 census, the city had a population of 18,862.
History
The area that is now Angleton was first settled in 1854 by William A. E. Rogers, who named the settlement after his hometown of Angleton, England. The town was officially incorporated in 1890.
In the early 1900s, Angleton was a thriving agricultural center, with cotton, corn, and sugar cane being the main crops. The city was also home to several sawmills and lumberyards.
In the 1920s, Angleton began to experience a population boom, as oil was discovered in the area. The city quickly became a center for oil production and refining, and the population continued to grow.
In the 1950s, Angleton began to experience a decline in population, as many of the oil fields in the area began to dry up. The city was also hit hard by the Great Depression, and many of the businesses in the area closed.
In the 1970s, Angleton began to experience a resurgence, as the city began to attract new businesses and industries. The city also began to experience a population boom, as many people moved to the area to take advantage of the city's low cost of living and its proximity to Houston.
Geography
Angleton is located in southeastern Texas, about 50 miles south of Houston. The city is situated on the Gulf Coastal Plain, and is bordered by the Brazos River to the east and the San Bernard River to the west. The city has a total area of 11.2 square miles, of which 11.1 square miles is land and 0.1 square miles is water.
Economy
The economy of Angleton is largely based on the oil and gas industry. The city is home to several oil and gas companies, as well as several refineries. The city is also home to several manufacturing companies, including a large paper mill.
The city is also home to several retail stores, restaurants, and other businesses. The city is also home to several medical facilities, including a hospital and several clinics.
Demographics
As of the 2010 census, the city had a population of 18,862. The racial makeup of the city was 73.3% White, 11.3% African American, 0.7% Native American, 0.7% Asian, 0.1% Pacific Islander, 11.7% from other races, and 2.9% from two or more races. Hispanic or Latino of any race were 28.3% of the population.
The median income for a household in the city was $41,945, and the median income for a family was $50,945. The per capita income for the city was $20,945. About 17.3% of families and 20.7% of the population were below the poverty line, including 28.3% of those under age 18 and 11.7% of those age 65 or over.
Common Questions
What is Per Capita Income in Angleton?
Per Capita income in Angleton is $39,040.
What is the Median Family Income in Angleton?
Median Family Income in Angleton is $91,629.
What is the Median Household income in Angleton?
Median Household Income in Angleton is $77,235.
What is Income or Wage Gap in Angleton?
Income or Wage Gap in Angleton is 34.9%.
Women in Angleton earn 65.1 cents for every dollar earned by a man.
What is Family Income Deficit in Angleton?
Family Income Deficit in Angleton is $14,281.
Families that are below poverty line in Angleton earn $14,281 less on average than the poverty threshold level.
What is Inequality or Gini Index in Angleton?
Inequality or Gini Index in Angleton is 0.41.
What is the Total Population of Angleton?
Total Population of Angleton is 19,452.
What is the Total Male Population of Angleton?
Total Male Population of Angleton is 9,310.
What is the Total Female Population of Angleton?
Total Female Population of Angleton is 10,142.
What is the Ratio of Males per 100 Females in Angleton?
There are 91.80 Males per 100 Females in Angleton.
What is the Ratio of Females per 100 Males in Angleton?
There are 108.94 Females per 100 Males in Angleton.
What is the Median Population Age in Angleton?
Median Population Age in Angleton is 37.4 Years.
What is the Average Family Size in Angleton
Average Family Size in Angleton is 3.0 People.
What is the Average Household Size in Angleton
Average Household Size in Angleton is 2.5 People.
How Large is the Labor Force in Angleton?
There are 9,562 People in the Labor Forcein in Angleton.
What is the Percentage of People in the Labor Force in Angleton?
61.7% of People are in the Labor Force in Angleton.
What is the Unemployment Rate in Angleton?
Unemployment Rate in Angleton is 2.4%.