Andrews, TX Map & Demographics
Andrews Map
Andrews Overview
$38,464
PER CAPITA INCOME
$95,944
AVG FAMILY INCOME
$86,806
AVG HOUSEHOLD INCOME
38.8%
WAGE / INCOME GAP [ % ]
61.2¢/ $1
WAGE / INCOME GAP [ $ ]
$13,144
FAMILY INCOME DEFICIT
0.44
INEQUALITY / GINI INDEX
13,342
TOTAL POPULATION
6,392
MALE POPULATION
6,950
FEMALE POPULATION
91.97
MALES / 100 FEMALES
108.73
FEMALES / 100 MALES
31.9
MEDIAN AGE
3.1
AVG FAMILY SIZE
2.6
AVG HOUSEHOLD SIZE
7,094
LABOR FORCE [ PEOPLE ]
72.9%
PERCENT IN LABOR FORCE
2.7%
UNEMPLOYMENT RATE
Andrews Zip Codes
Andrews Area Codes
Income in Andrews
Income Overview in Andrews
Per Capita Income in Andrews is $38,464, while median incomes of families and households are $95,944 and $86,806 respectively.
| Characteristic | Number | Measure |
| Per Capita Income | 13,342 | $38,464 |
| Median Family Income | 3,782 | $95,944 |
| Mean Family Income | 3,782 | $109,329 |
| Median Household Income | 4,994 | $86,806 |
| Mean Household Income | 4,994 | $103,748 |
| Income Deficit | 3,782 | $13,144 |
| Wage / Income Gap (%) | 13,342 | 38.78% |
| Wage / Income Gap ($) | 13,342 | 61.22¢ per $1 |
| Gini / Inequality Index | 13,342 | 0.44 |
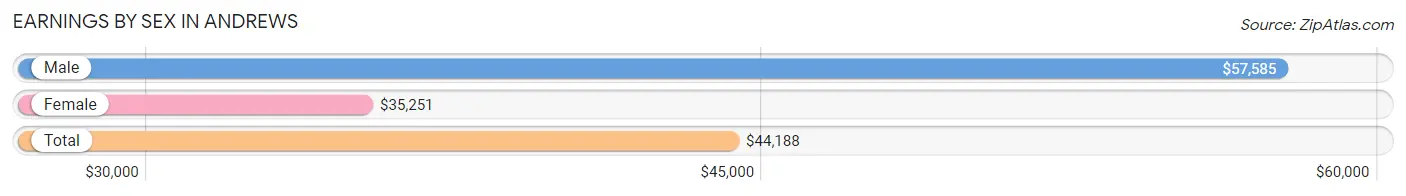
Earnings by Sex in Andrews
Average Earnings in Andrews are $44,188, $57,585 for men and $35,251 for women, a difference of 38.8%.
| Sex | Number | Average Earnings |
| Male | 3,969 (53.5%) | $57,585 |
| Female | 3,447 (46.5%) | $35,251 |
| Total | 7,416 (100.0%) | $44,188 |
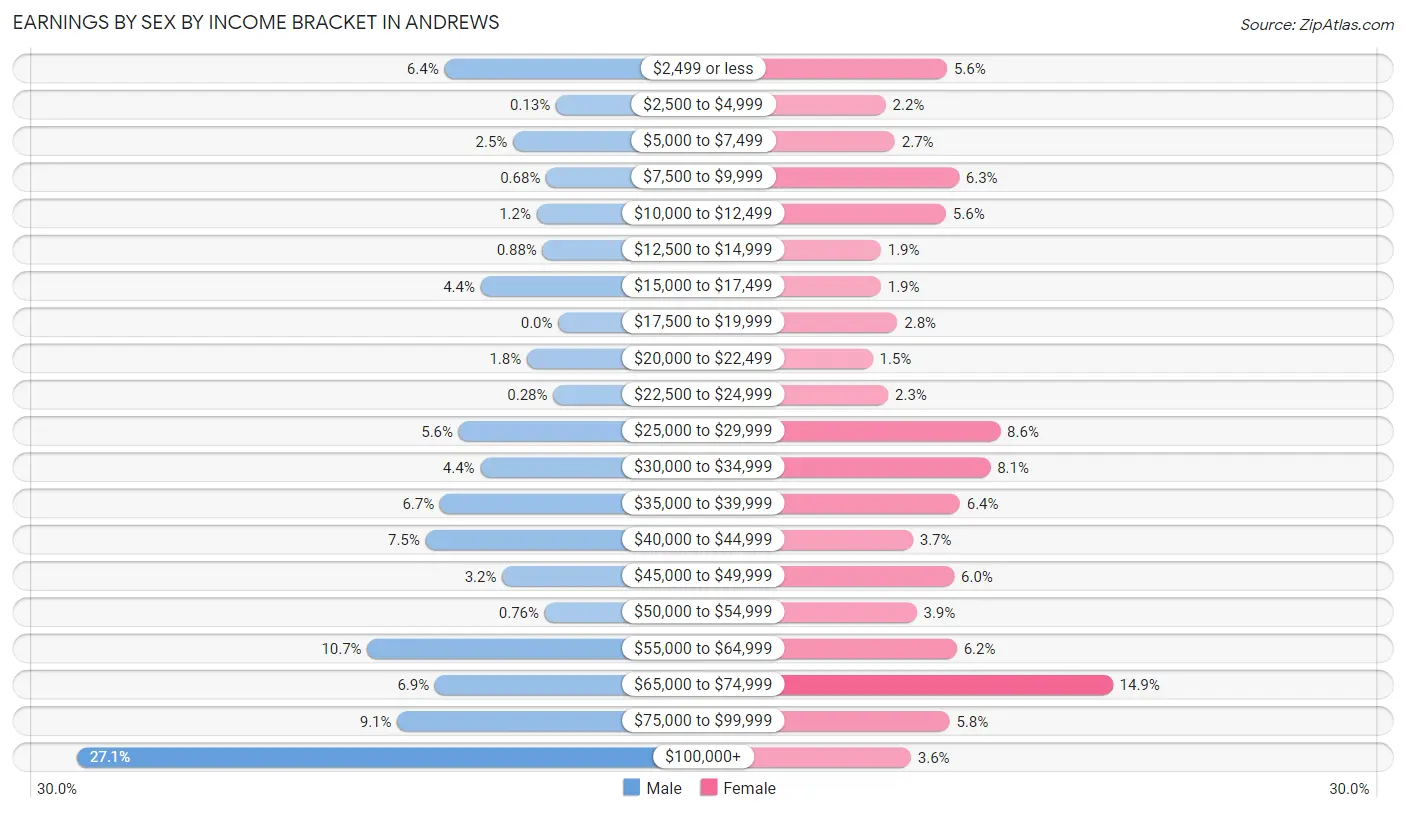
Earnings by Sex by Income Bracket in Andrews
The most common earnings brackets in Andrews are $100,000+ for men (1,074 | 27.1%) and $65,000 to $74,999 for women (515 | 14.9%).
| Income | Male | Female |
| $2,499 or less | 254 (6.4%) | 194 (5.6%) |
| $2,500 to $4,999 | 5 (0.1%) | 75 (2.2%) |
| $5,000 to $7,499 | 101 (2.5%) | 93 (2.7%) |
| $7,500 to $9,999 | 27 (0.7%) | 217 (6.3%) |
| $10,000 to $12,499 | 48 (1.2%) | 192 (5.6%) |
| $12,500 to $14,999 | 35 (0.9%) | 66 (1.9%) |
| $15,000 to $17,499 | 173 (4.4%) | 66 (1.9%) |
| $17,500 to $19,999 | 0 (0.0%) | 98 (2.8%) |
| $20,000 to $22,499 | 70 (1.8%) | 50 (1.5%) |
| $22,500 to $24,999 | 11 (0.3%) | 80 (2.3%) |
| $25,000 to $29,999 | 222 (5.6%) | 297 (8.6%) |
| $30,000 to $34,999 | 174 (4.4%) | 278 (8.1%) |
| $35,000 to $39,999 | 264 (6.7%) | 219 (6.4%) |
| $40,000 to $44,999 | 296 (7.5%) | 128 (3.7%) |
| $45,000 to $49,999 | 125 (3.2%) | 208 (6.0%) |
| $50,000 to $54,999 | 30 (0.8%) | 135 (3.9%) |
| $55,000 to $64,999 | 426 (10.7%) | 213 (6.2%) |
| $65,000 to $74,999 | 275 (6.9%) | 515 (14.9%) |
| $75,000 to $99,999 | 359 (9.0%) | 199 (5.8%) |
| $100,000+ | 1,074 (27.1%) | 124 (3.6%) |
| Total | 3,969 (100.0%) | 3,447 (100.0%) |
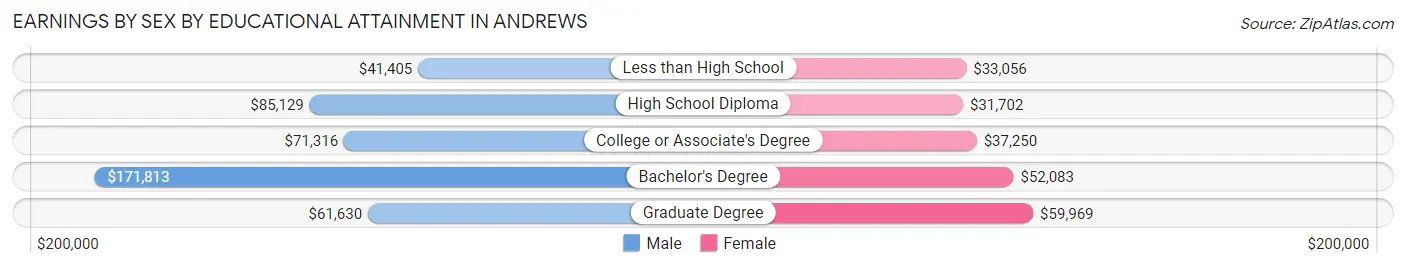
Earnings by Sex by Educational Attainment in Andrews
Average earnings in Andrews are $60,469 for men and $40,903 for women, a difference of 32.4%. Men with an educational attainment of bachelor's degree enjoy the highest average annual earnings of $171,813, while those with less than high school education earn the least with $41,405. Women with an educational attainment of graduate degree earn the most with the average annual earnings of $59,969, while those with high school diploma education have the smallest earnings of $31,702.
| Educational Attainment | Male Income | Female Income |
| Less than High School | $41,405 | $33,056 |
| High School Diploma | $85,129 | $31,702 |
| College or Associate's Degree | $71,316 | $37,250 |
| Bachelor's Degree | $171,813 | $52,083 |
| Graduate Degree | $61,630 | $59,969 |
| Total | $60,469 | $40,903 |
Family Income in Andrews
Family Income Brackets in Andrews
According to the Andrews family income data, there are 1,055 families falling into the $100,000 to $149,999 income range, which is the most common income bracket and makes up 27.9% of all families. Conversely, the $10,000 to $14,999 income bracket is the least frequent group with only 42 families (1.1%) belonging to this category.
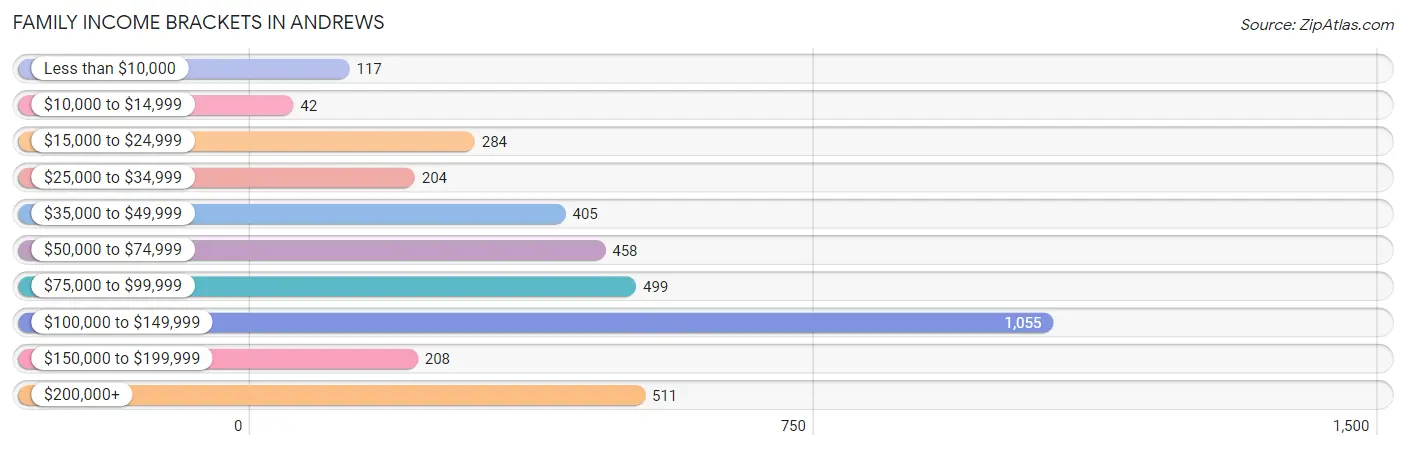
| Income Bracket | # Families | % Families |
| Less than $10,000 | 117 | 3.1% |
| $10,000 to $14,999 | 42 | 1.1% |
| $15,000 to $24,999 | 284 | 7.5% |
| $25,000 to $34,999 | 204 | 5.4% |
| $35,000 to $49,999 | 405 | 10.7% |
| $50,000 to $74,999 | 458 | 12.1% |
| $75,000 to $99,999 | 499 | 13.2% |
| $100,000 to $149,999 | 1,055 | 27.9% |
| $150,000 to $199,999 | 208 | 5.5% |
| $200,000+ | 511 | 13.5% |
Family Income by Famaliy Size in Andrews
6-person families (139 | 3.7%) account for the highest median family income in Andrews with $131,178 per family, while 2-person families (1,289 | 34.1%) have the highest median income of $44,982 per family member.
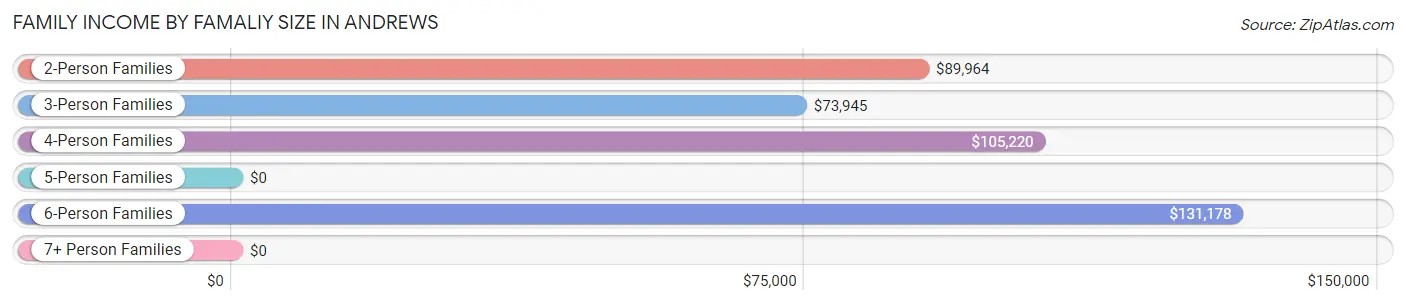
| Income Bracket | # Families | Median Income |
| 2-Person Families | 1,289 (34.1%) | $89,964 |
| 3-Person Families | 778 (20.6%) | $73,945 |
| 4-Person Families | 1,027 (27.2%) | $105,220 |
| 5-Person Families | 537 (14.2%) | $0 |
| 6-Person Families | 139 (3.7%) | $131,178 |
| 7+ Person Families | 12 (0.3%) | $0 |
| Total | 3,782 (100.0%) | $95,944 |
Family Income by Number of Earners in Andrews
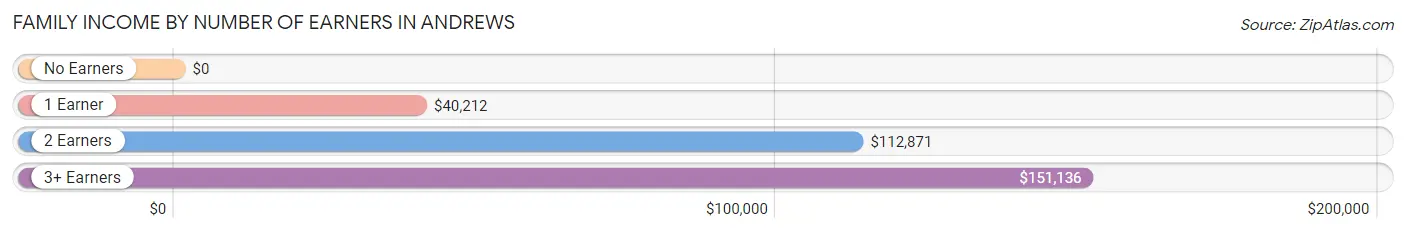
| Number of Earners | # Families | Median Income |
| No Earners | 284 (7.5%) | $0 |
| 1 Earner | 1,100 (29.1%) | $40,212 |
| 2 Earners | 1,884 (49.8%) | $112,871 |
| 3+ Earners | 514 (13.6%) | $151,136 |
| Total | 3,782 (100.0%) | $95,944 |
Household Income in Andrews
Household Income Brackets in Andrews
With 1,169 households falling in the category, the $100,000 to $149,999 income range is the most frequent in Andrews, accounting for 23.4% of all households. In contrast, only 30 households (0.6%) fall into the $10,000 to $14,999 income bracket, making it the least populous group.
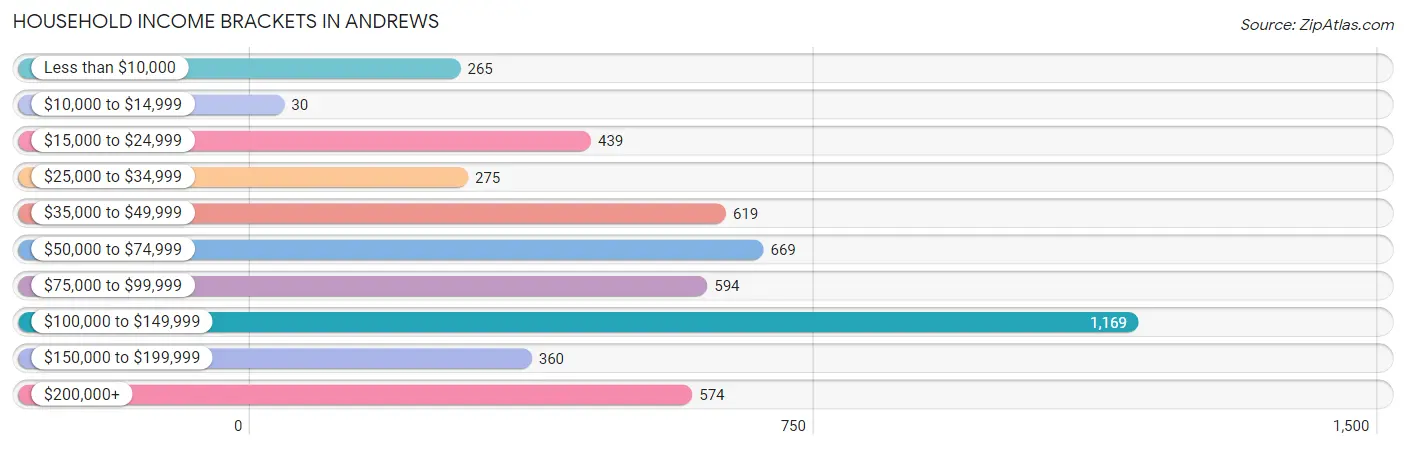
| Income Bracket | # Households | % Households |
| Less than $10,000 | 265 | 5.3% |
| $10,000 to $14,999 | 30 | 0.6% |
| $15,000 to $24,999 | 439 | 8.8% |
| $25,000 to $34,999 | 275 | 5.5% |
| $35,000 to $49,999 | 619 | 12.4% |
| $50,000 to $74,999 | 669 | 13.4% |
| $75,000 to $99,999 | 594 | 11.9% |
| $100,000 to $149,999 | 1,169 | 23.4% |
| $150,000 to $199,999 | 360 | 7.2% |
| $200,000+ | 574 | 11.5% |
Household Income by Householder Age in Andrews
The median household income in Andrews is $86,806, with the highest median household income of $99,681 found in the 45 to 64 years age bracket for the primary householder. A total of 1,620 households (32.4%) fall into this category. Meanwhile, the 65+ years age bracket for the primary householder has the lowest median household income of $60,357, with 858 households (17.2%) in this group.
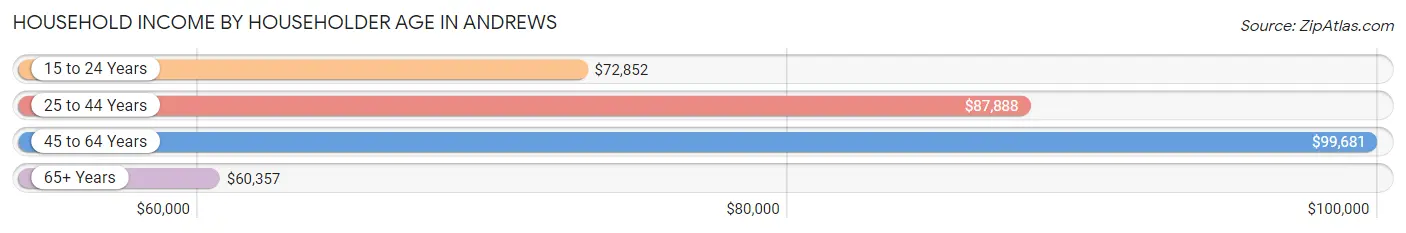
| Income Bracket | # Households | Median Income |
| 15 to 24 Years | 336 (6.7%) | $72,852 |
| 25 to 44 Years | 2,180 (43.6%) | $87,888 |
| 45 to 64 Years | 1,620 (32.4%) | $99,681 |
| 65+ Years | 858 (17.2%) | $60,357 |
| Total | 4,994 (100.0%) | $86,806 |
Poverty in Andrews
Income Below Poverty by Sex and Age in Andrews
With 12.3% poverty level for males and 14.3% for females among the residents of Andrews, 6 to 11 year old males and 18 to 24 year old females are the most vulnerable to poverty, with 188 males (25.5%) and 228 females (34.6%) in their respective age groups living below the poverty level.
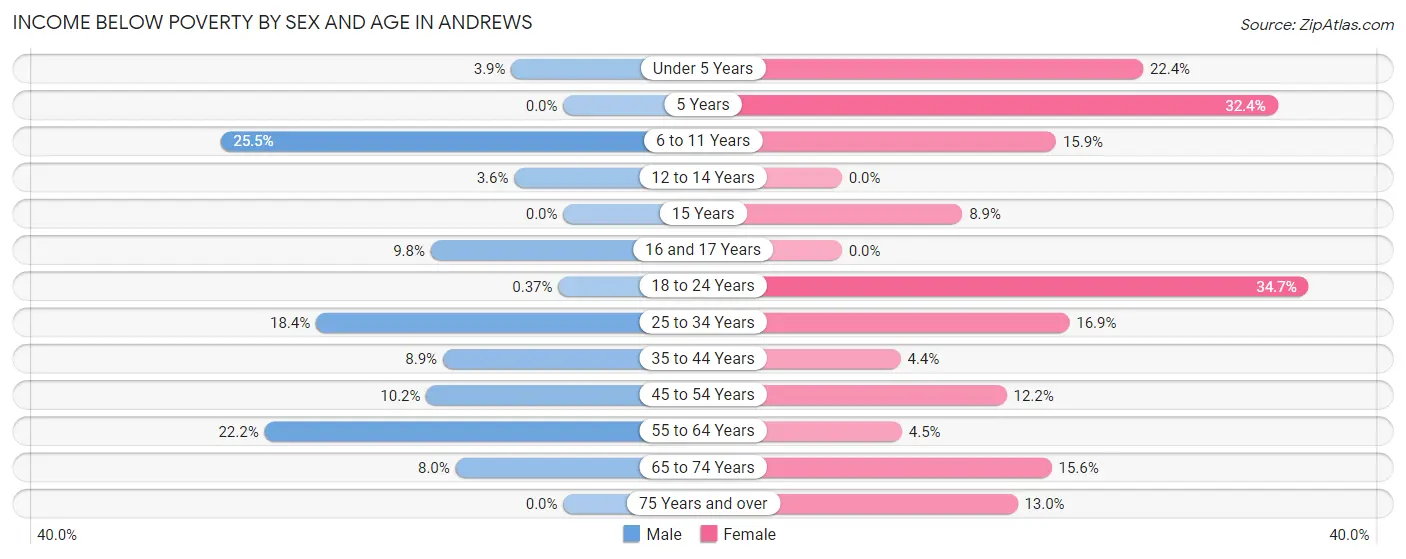
| Age Bracket | Male | Female |
| Under 5 Years | 19 (3.9%) | 142 (22.4%) |
| 5 Years | 0 (0.0%) | 33 (32.4%) |
| 6 to 11 Years | 188 (25.5%) | 141 (15.9%) |
| 12 to 14 Years | 13 (3.6%) | 0 (0.0%) |
| 15 Years | 0 (0.0%) | 16 (8.9%) |
| 16 and 17 Years | 31 (9.8%) | 0 (0.0%) |
| 18 to 24 Years | 2 (0.4%) | 228 (34.6%) |
| 25 to 34 Years | 195 (18.4%) | 177 (16.9%) |
| 35 to 44 Years | 93 (8.9%) | 37 (4.4%) |
| 45 to 54 Years | 54 (10.2%) | 80 (12.2%) |
| 55 to 64 Years | 148 (22.2%) | 41 (4.5%) |
| 65 to 74 Years | 34 (8.0%) | 57 (15.6%) |
| 75 Years and over | 0 (0.0%) | 33 (13.0%) |
| Total | 777 (12.3%) | 985 (14.3%) |
Income Above Poverty by Sex and Age in Andrews
According to the poverty statistics in Andrews, males aged 5 years and females aged 12 to 14 years are the age groups that are most secure financially, with 100.0% of males and 100.0% of females in these age groups living above the poverty line.
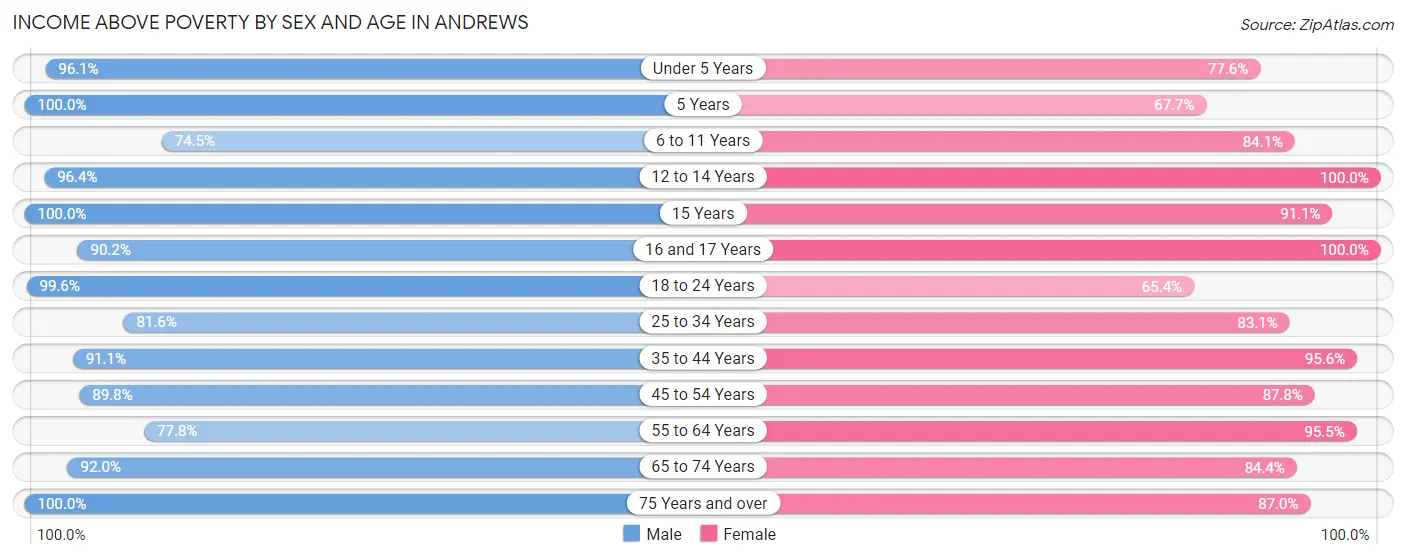
| Age Bracket | Male | Female |
| Under 5 Years | 473 (96.1%) | 493 (77.6%) |
| 5 Years | 10 (100.0%) | 69 (67.6%) |
| 6 to 11 Years | 550 (74.5%) | 746 (84.1%) |
| 12 to 14 Years | 344 (96.4%) | 201 (100.0%) |
| 15 Years | 10 (100.0%) | 163 (91.1%) |
| 16 and 17 Years | 284 (90.2%) | 140 (100.0%) |
| 18 to 24 Years | 540 (99.6%) | 430 (65.3%) |
| 25 to 34 Years | 867 (81.6%) | 871 (83.1%) |
| 35 to 44 Years | 947 (91.1%) | 811 (95.6%) |
| 45 to 54 Years | 477 (89.8%) | 574 (87.8%) |
| 55 to 64 Years | 519 (77.8%) | 879 (95.5%) |
| 65 to 74 Years | 391 (92.0%) | 309 (84.4%) |
| 75 Years and over | 130 (100.0%) | 220 (87.0%) |
| Total | 5,542 (87.7%) | 5,906 (85.7%) |
Income Below Poverty Among Married-Couple Families in Andrews
The poverty statistics for married-couple families in Andrews show that 12.1% or 348 of the total 2,869 families live below the poverty line. Families with 3 or 4 children have the highest poverty rate of 39.6%, comprising of 188 families. On the other hand, families with 1 or 2 children have the lowest poverty rate of 5.3%, which includes 63 families.
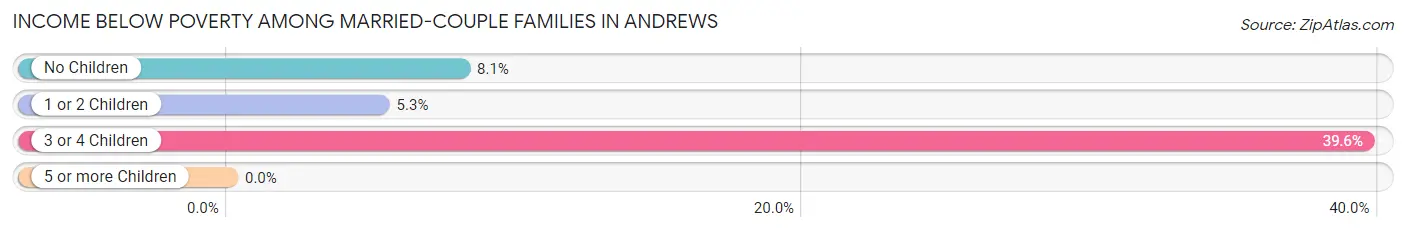
| Children | Above Poverty | Below Poverty |
| No Children | 1,103 (91.9%) | 97 (8.1%) |
| 1 or 2 Children | 1,131 (94.7%) | 63 (5.3%) |
| 3 or 4 Children | 287 (60.4%) | 188 (39.6%) |
| 5 or more Children | 0 (0.0%) | 0 (0.0%) |
| Total | 2,521 (87.9%) | 348 (12.1%) |
Income Below Poverty Among Single-Parent Households in Andrews
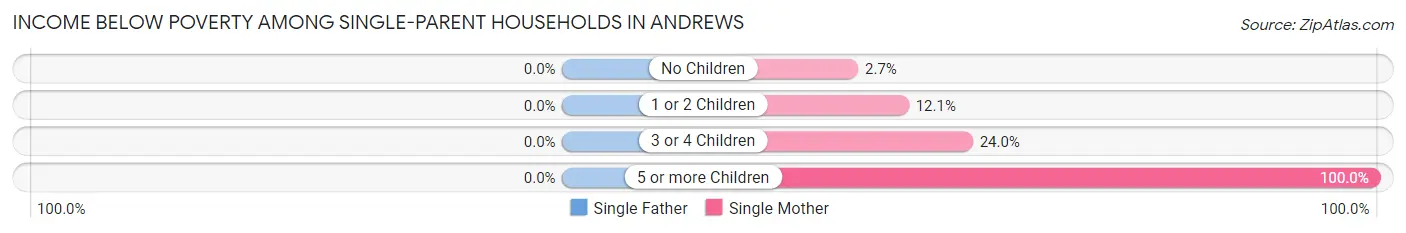
| Children | Single Father | Single Mother |
| No Children | 0 (0.0%) | 10 (2.7%) |
| 1 or 2 Children | 0 (0.0%) | 16 (12.1%) |
| 3 or 4 Children | 0 (0.0%) | 37 (24.0%) |
| 5 or more Children | 0 (0.0%) | 13 (100.0%) |
| Total | 0 (0.0%) | 76 (11.3%) |
Income Below Poverty Among Married-Couple vs Single-Parent Households in Andrews
The poverty data for Andrews shows that 348 of the married-couple family households (12.1%) and 76 of the single-parent households (8.3%) are living below the poverty level. Within the married-couple family households, those with 3 or 4 children have the highest poverty rate, with 188 households (39.6%) falling below the poverty line. Among the single-parent households, those with 5 or more children have the highest poverty rate, with 13 household (100.0%) living below poverty.
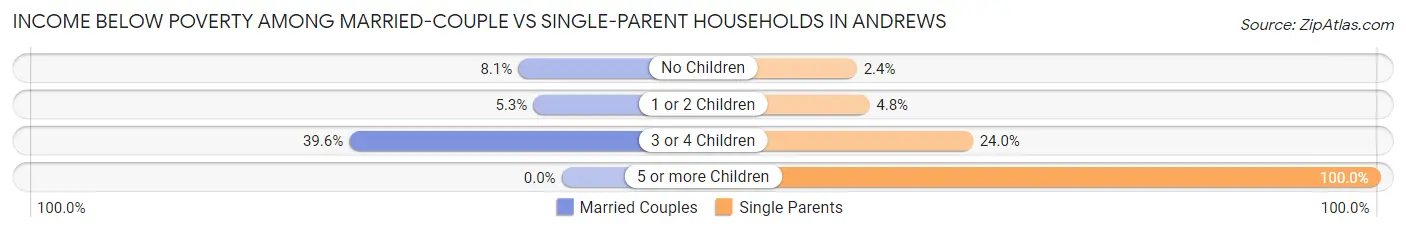
| Children | Married-Couple Families | Single-Parent Households |
| No Children | 97 (8.1%) | 10 (2.4%) |
| 1 or 2 Children | 63 (5.3%) | 16 (4.8%) |
| 3 or 4 Children | 188 (39.6%) | 37 (24.0%) |
| 5 or more Children | 0 (0.0%) | 13 (100.0%) |
| Total | 348 (12.1%) | 76 (8.3%) |
Race in Andrews
The most populous races in Andrews are White / Caucasian (9,151 | 68.6%), Hispanic or Latino (7,146 | 53.6%), and Two or more Races (2,143 | 16.1%).
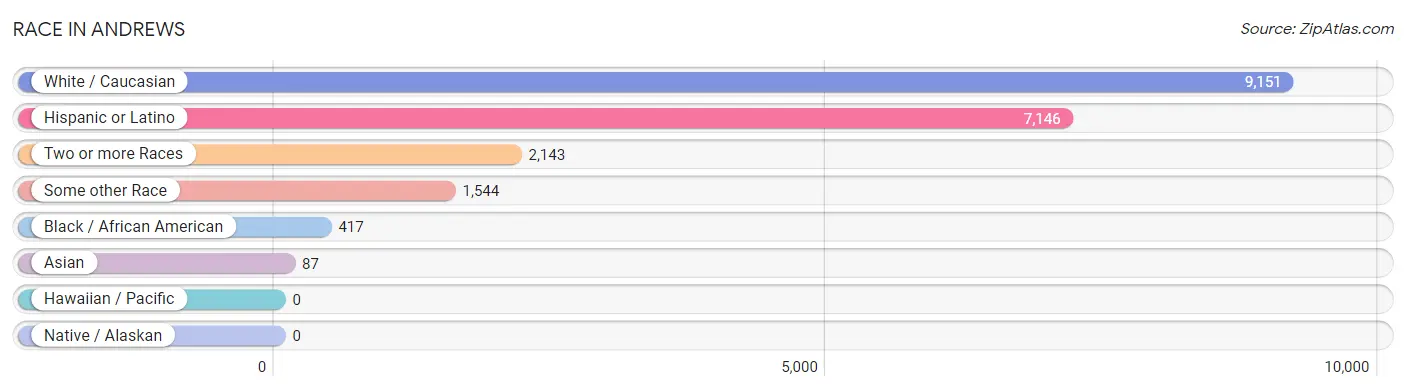
| Race | # Population | % Population |
| Asian | 87 | 0.6% |
| Black / African American | 417 | 3.1% |
| Hawaiian / Pacific | 0 | 0.0% |
| Hispanic or Latino | 7,146 | 53.6% |
| Native / Alaskan | 0 | 0.0% |
| White / Caucasian | 9,151 | 68.6% |
| Two or more Races | 2,143 | 16.1% |
| Some other Race | 1,544 | 11.6% |
| Total | 13,342 | 100.0% |
Ancestry in Andrews
The most populous ancestries reported in Andrews are Mexican (6,680 | 50.1%), German (1,323 | 9.9%), English (898 | 6.7%), Irish (868 | 6.5%), and American (744 | 5.6%), together accounting for 78.8% of all Andrews residents.
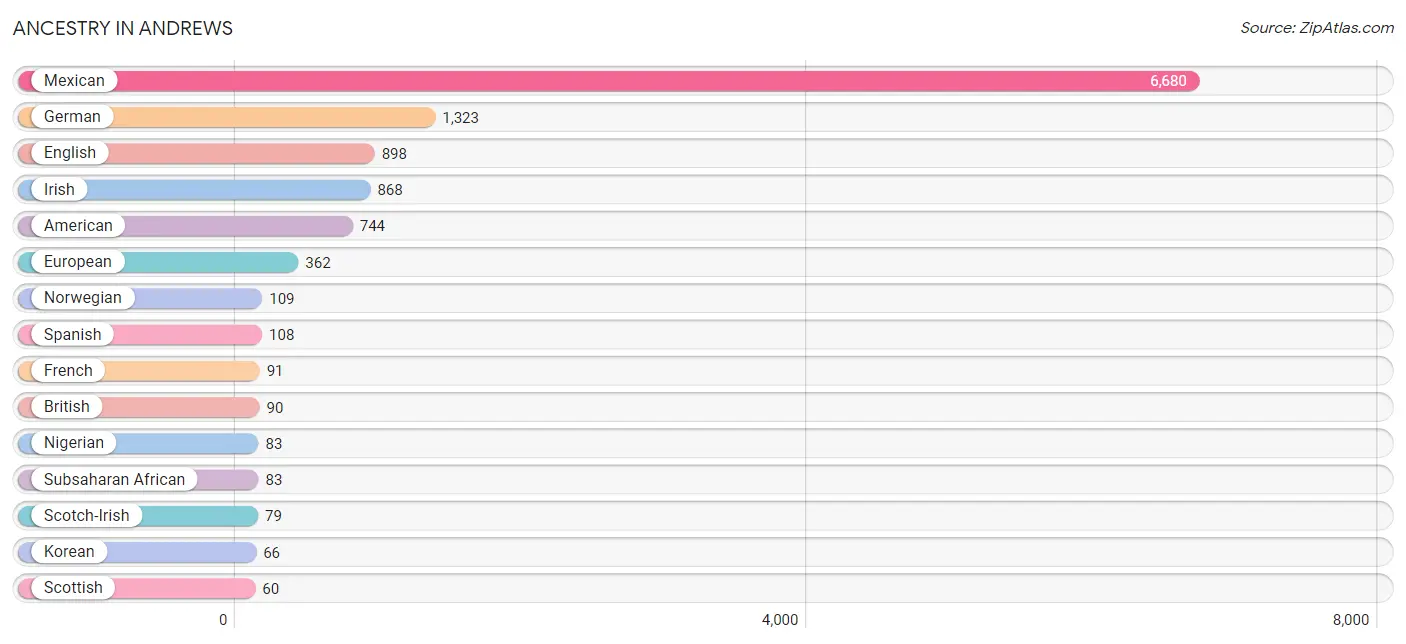
| Ancestry | # Population | % Population |
| American | 744 | 5.6% |
| British | 90 | 0.7% |
| Burmese | 26 | 0.2% |
| Central American | 19 | 0.1% |
| Central American Indian | 19 | 0.1% |
| Comanche | 42 | 0.3% |
| Czech | 20 | 0.2% |
| Dutch | 4 | 0.0% |
| Eastern European | 31 | 0.2% |
| English | 898 | 6.7% |
| European | 362 | 2.7% |
| French | 91 | 0.7% |
| French Canadian | 5 | 0.0% |
| German | 1,323 | 9.9% |
| Honduran | 19 | 0.1% |
| Hungarian | 32 | 0.2% |
| Irish | 868 | 6.5% |
| Italian | 11 | 0.1% |
| Korean | 66 | 0.5% |
| Mexican | 6,680 | 50.1% |
| Nigerian | 83 | 0.6% |
| Northern European | 9 | 0.1% |
| Norwegian | 109 | 0.8% |
| Polish | 35 | 0.3% |
| Portuguese | 44 | 0.3% |
| Puerto Rican | 40 | 0.3% |
| Russian | 31 | 0.2% |
| Samoan | 14 | 0.1% |
| Scandinavian | 57 | 0.4% |
| Scotch-Irish | 79 | 0.6% |
| Scottish | 60 | 0.4% |
| Spanish | 108 | 0.8% |
| Sri Lankan | 25 | 0.2% |
| Subsaharan African | 83 | 0.6% | View All 34 Rows |
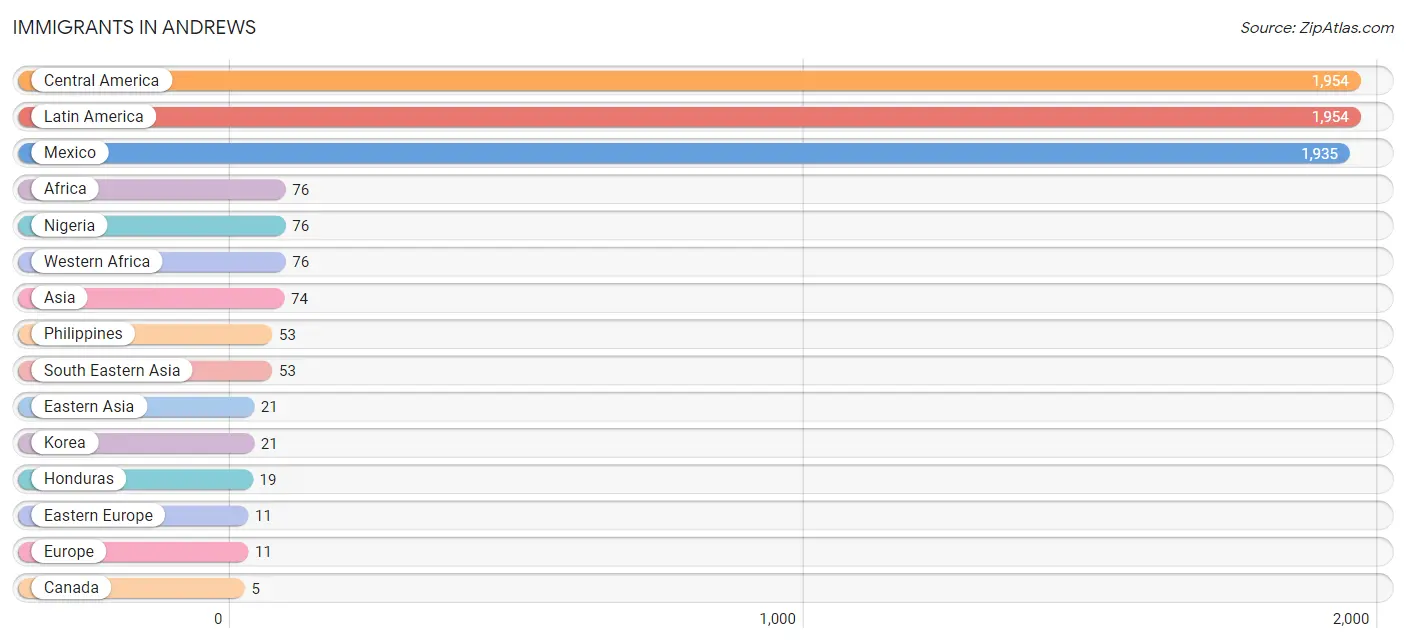
Immigrants in Andrews
The most numerous immigrant groups reported in Andrews came from Central America (1,954 | 14.6%), Latin America (1,954 | 14.6%), Mexico (1,935 | 14.5%), Africa (76 | 0.6%), and Nigeria (76 | 0.6%), together accounting for 44.9% of all Andrews residents.
| Immigration Origin | # Population | % Population |
| Africa | 76 | 0.6% |
| Asia | 74 | 0.5% |
| Canada | 5 | 0.0% |
| Central America | 1,954 | 14.6% |
| Eastern Asia | 21 | 0.2% |
| Eastern Europe | 11 | 0.1% |
| Europe | 11 | 0.1% |
| Honduras | 19 | 0.1% |
| Korea | 21 | 0.2% |
| Latin America | 1,954 | 14.6% |
| Mexico | 1,935 | 14.5% |
| Nigeria | 76 | 0.6% |
| Philippines | 53 | 0.4% |
| South Eastern Asia | 53 | 0.4% |
| Western Africa | 76 | 0.6% | View All 15 Rows |
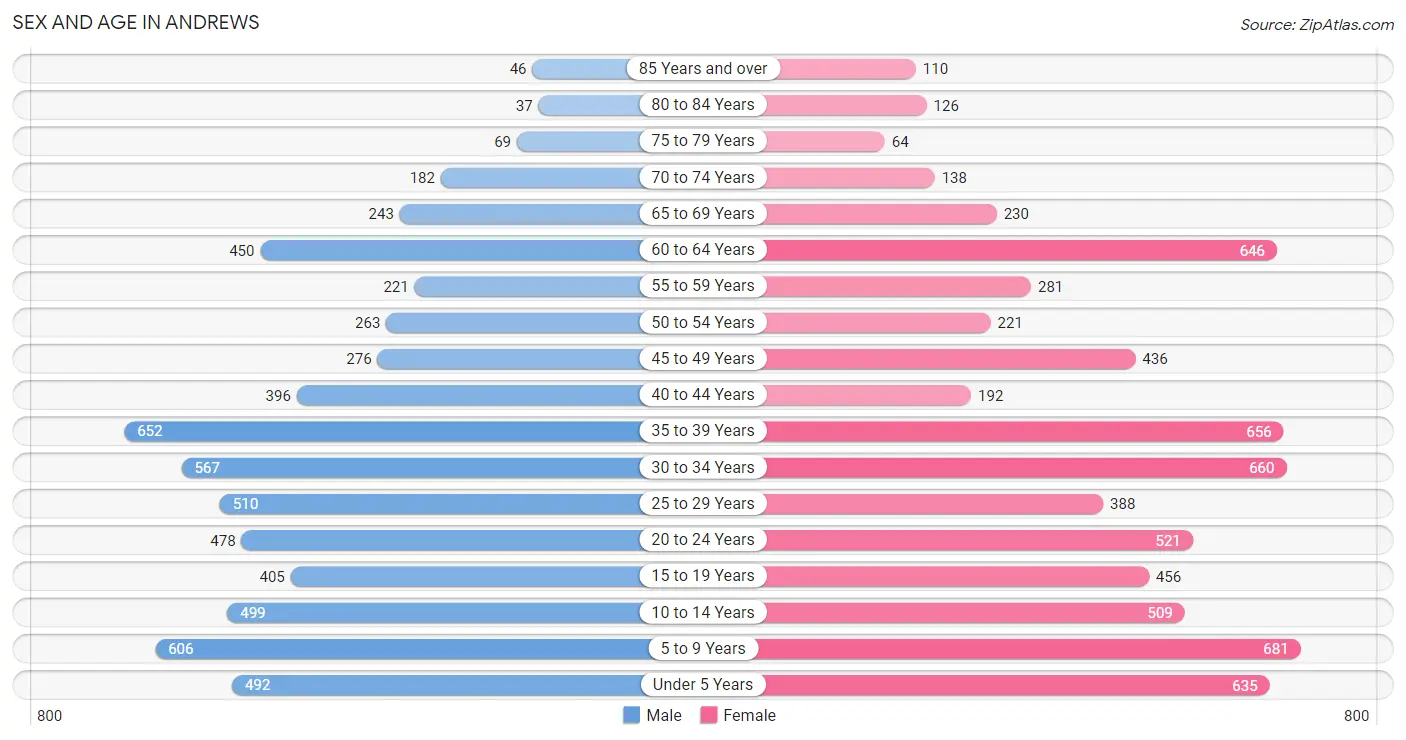
Sex and Age in Andrews
Sex and Age in Andrews
The most populous age groups in Andrews are 35 to 39 Years (652 | 10.2%) for men and 5 to 9 Years (681 | 9.8%) for women.
| Age Bracket | Male | Female |
| Under 5 Years | 492 (7.7%) | 635 (9.1%) |
| 5 to 9 Years | 606 (9.5%) | 681 (9.8%) |
| 10 to 14 Years | 499 (7.8%) | 509 (7.3%) |
| 15 to 19 Years | 405 (6.3%) | 456 (6.6%) |
| 20 to 24 Years | 478 (7.5%) | 521 (7.5%) |
| 25 to 29 Years | 510 (8.0%) | 388 (5.6%) |
| 30 to 34 Years | 567 (8.9%) | 660 (9.5%) |
| 35 to 39 Years | 652 (10.2%) | 656 (9.4%) |
| 40 to 44 Years | 396 (6.2%) | 192 (2.8%) |
| 45 to 49 Years | 276 (4.3%) | 436 (6.3%) |
| 50 to 54 Years | 263 (4.1%) | 221 (3.2%) |
| 55 to 59 Years | 221 (3.5%) | 281 (4.0%) |
| 60 to 64 Years | 450 (7.0%) | 646 (9.3%) |
| 65 to 69 Years | 243 (3.8%) | 230 (3.3%) |
| 70 to 74 Years | 182 (2.9%) | 138 (2.0%) |
| 75 to 79 Years | 69 (1.1%) | 64 (0.9%) |
| 80 to 84 Years | 37 (0.6%) | 126 (1.8%) |
| 85 Years and over | 46 (0.7%) | 110 (1.6%) |
| Total | 6,392 (100.0%) | 6,950 (100.0%) |
Families and Households in Andrews
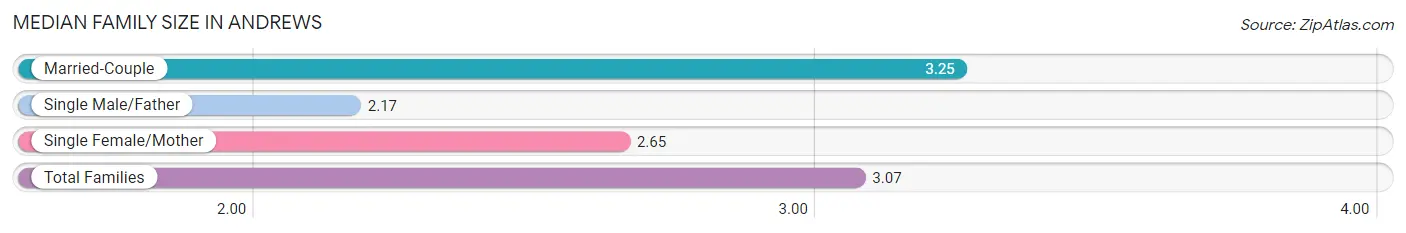
Median Family Size in Andrews
The median family size in Andrews is 3.07 persons per family, with married-couple families (2,869 | 75.9%) accounting for the largest median family size of 3.25 persons per family. On the other hand, single male/father families (242 | 6.4%) represent the smallest median family size with 2.17 persons per family.
| Family Type | # Families | Family Size |
| Married-Couple | 2,869 (75.9%) | 3.25 |
| Single Male/Father | 242 (6.4%) | 2.17 |
| Single Female/Mother | 671 (17.7%) | 2.65 |
| Total Families | 3,782 (100.0%) | 3.07 |
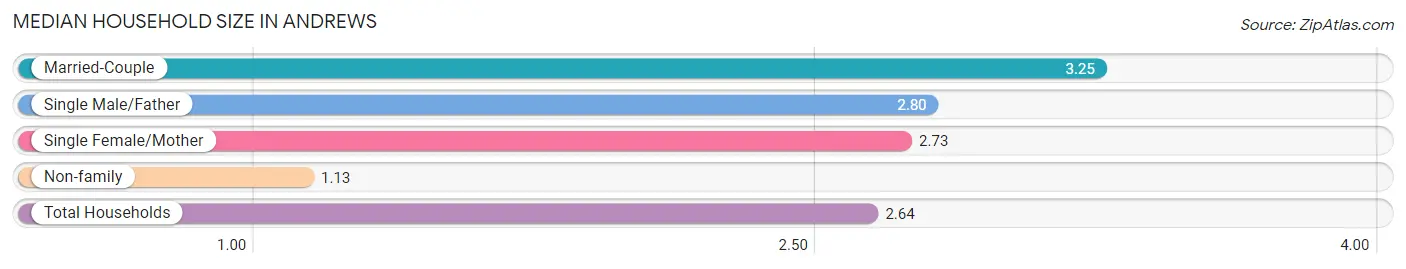
Median Household Size in Andrews
The median household size in Andrews is 2.64 persons per household, with married-couple households (2,869 | 57.5%) accounting for the largest median household size of 3.25 persons per household. non-family households (1,212 | 24.3%) represent the smallest median household size with 1.13 persons per household.
| Household Type | # Households | Household Size |
| Married-Couple | 2,869 (57.5%) | 3.25 |
| Single Male/Father | 242 (4.9%) | 2.80 |
| Single Female/Mother | 671 (13.4%) | 2.73 |
| Non-family | 1,212 (24.3%) | 1.13 |
| Total Households | 4,994 (100.0%) | 2.64 |
Household Size by Marriage Status in Andrews
Out of a total of 4,994 households in Andrews, 3,782 (75.7%) are family households, while 1,212 (24.3%) are nonfamily households. The most numerous type of family households are 2-person households, comprising 1,222, and the most common type of nonfamily households are 1-person households, comprising 1,047.
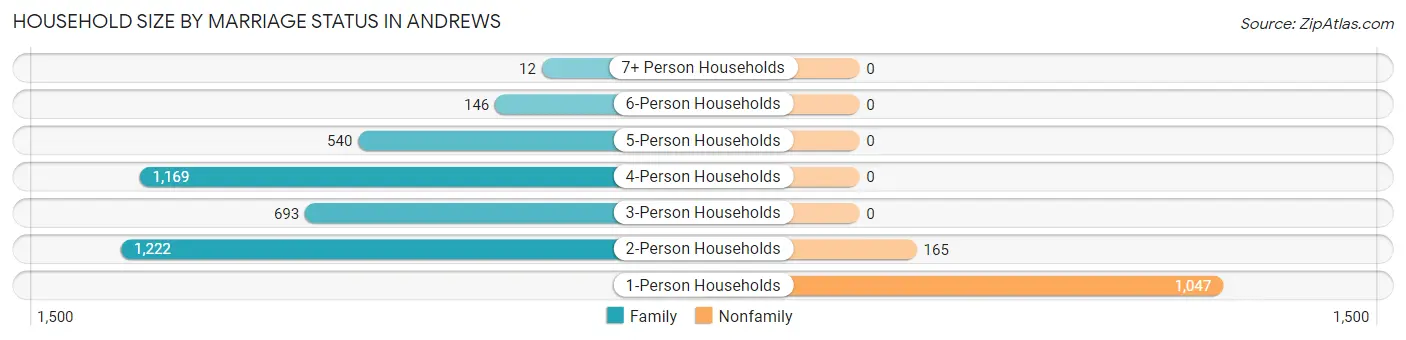
| Household Size | Family Households | Nonfamily Households |
| 1-Person Households | - | 1,047 (21.0%) |
| 2-Person Households | 1,222 (24.5%) | 165 (3.3%) |
| 3-Person Households | 693 (13.9%) | 0 (0.0%) |
| 4-Person Households | 1,169 (23.4%) | 0 (0.0%) |
| 5-Person Households | 540 (10.8%) | 0 (0.0%) |
| 6-Person Households | 146 (2.9%) | 0 (0.0%) |
| 7+ Person Households | 12 (0.2%) | 0 (0.0%) |
| Total | 3,782 (75.7%) | 1,212 (24.3%) |
Female Fertility in Andrews
Fertility by Age in Andrews
Average fertility rate in Andrews is 104.0 births per 1,000 women. Women in the age bracket of 20 to 34 years have the highest fertility rate with 171.0 births per 1,000 women. Women in the age bracket of 20 to 34 years acount for 77.7% of all women with births.
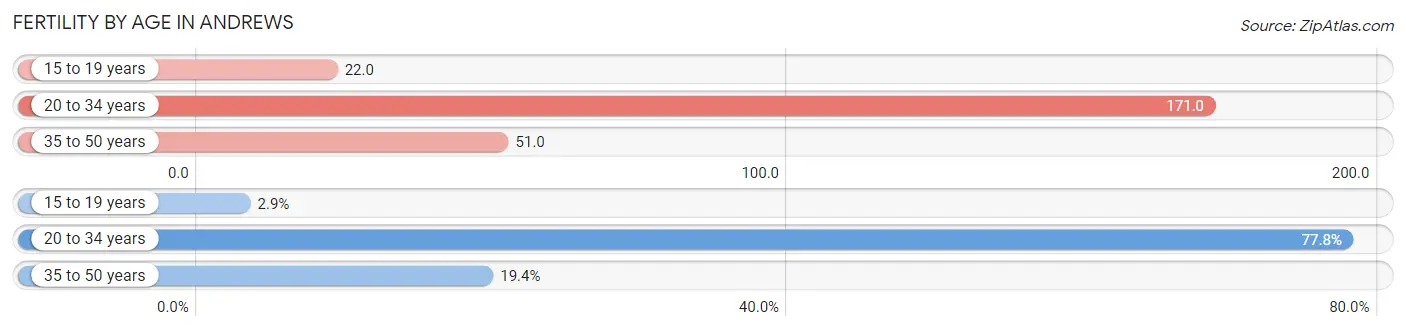
| Age Bracket | Women with Births | Births / 1,000 Women |
| 15 to 19 years | 10 (2.9%) | 22.0 |
| 20 to 34 years | 269 (77.7%) | 171.0 |
| 35 to 50 years | 67 (19.4%) | 51.0 |
| Total | 346 (100.0%) | 104.0 |
Fertility by Age by Marriage Status in Andrews
85.8% of women with births (346) in Andrews are married. The highest percentage of unmarried women with births falls into 15 to 19 years age bracket with 100.0% of them unmarried at the time of birth, while the lowest percentage of unmarried women with births belong to 35 to 50 years age bracket with 0.0% of them unmarried.
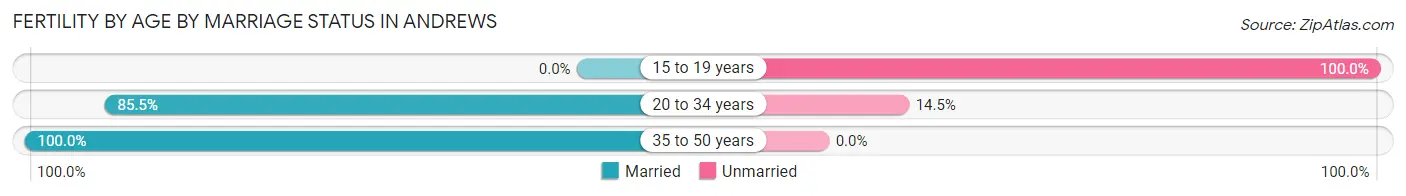
| Age Bracket | Married | Unmarried |
| 15 to 19 years | 0 (0.0%) | 10 (100.0%) |
| 20 to 34 years | 230 (85.5%) | 39 (14.5%) |
| 35 to 50 years | 67 (100.0%) | 0 (0.0%) |
| Total | 297 (85.8%) | 49 (14.2%) |
Fertility by Education in Andrews
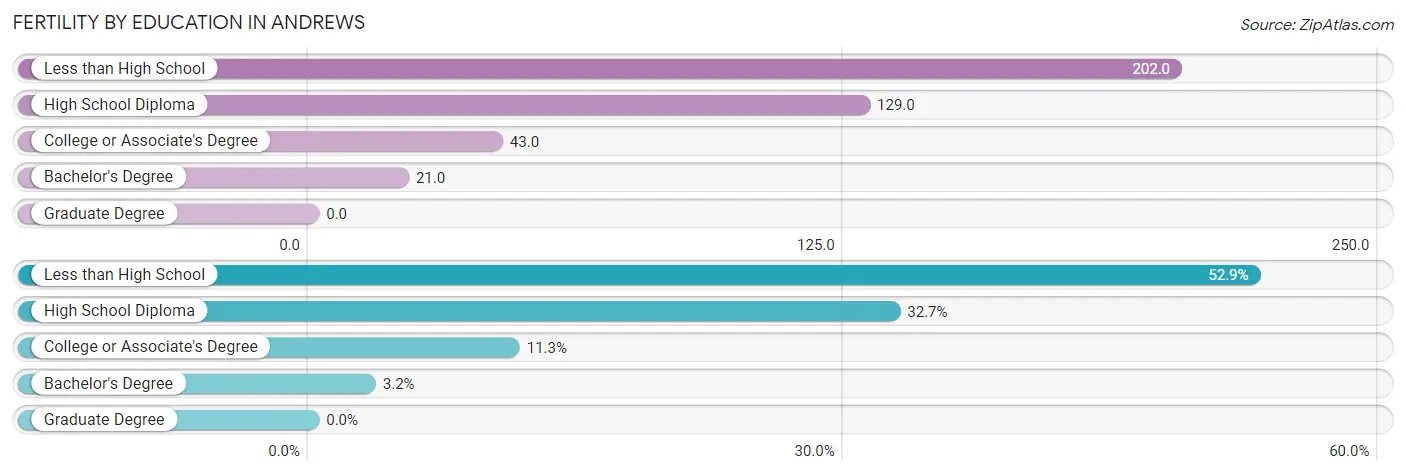
| Educational Attainment | Women with Births | Births / 1,000 Women |
| Less than High School | 183 (52.9%) | 202.0 |
| High School Diploma | 113 (32.7%) | 129.0 |
| College or Associate's Degree | 39 (11.3%) | 43.0 |
| Bachelor's Degree | 11 (3.2%) | 21.0 |
| Graduate Degree | 0 (0.0%) | 0.0 |
| Total | 346 (100.0%) | 104.0 |
Fertility by Education by Marriage Status in Andrews
14.2% of women with births in Andrews are unmarried. Women with the educational attainment of high school diploma are most likely to be married with 100.0% of them married at childbirth, while women with the educational attainment of college or associate's degree are least likely to be married with 100.0% of them unmarried at childbirth.
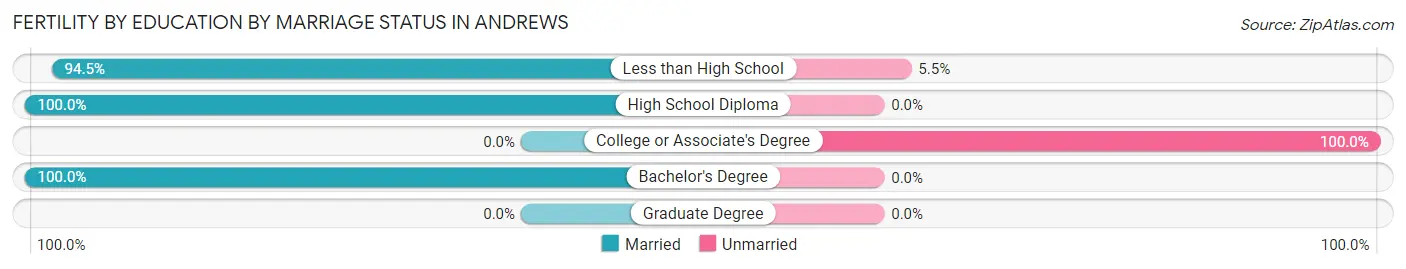
| Educational Attainment | Married | Unmarried |
| Less than High School | 173 (94.5%) | 10 (5.5%) |
| High School Diploma | 113 (100.0%) | 0 (0.0%) |
| College or Associate's Degree | 0 (0.0%) | 39 (100.0%) |
| Bachelor's Degree | 11 (100.0%) | 0 (0.0%) |
| Graduate Degree | 0 (0.0%) | 0 (0.0%) |
| Total | 297 (85.8%) | 49 (14.2%) |
Employment Characteristics in Andrews
Employment by Class of Employer in Andrews
Among the 6,692 employed individuals in Andrews, private company employees (4,958 | 74.1%), local government employees (678 | 10.1%), and self-employed (incorporated) (345 | 5.2%) make up the most common classes of employment.
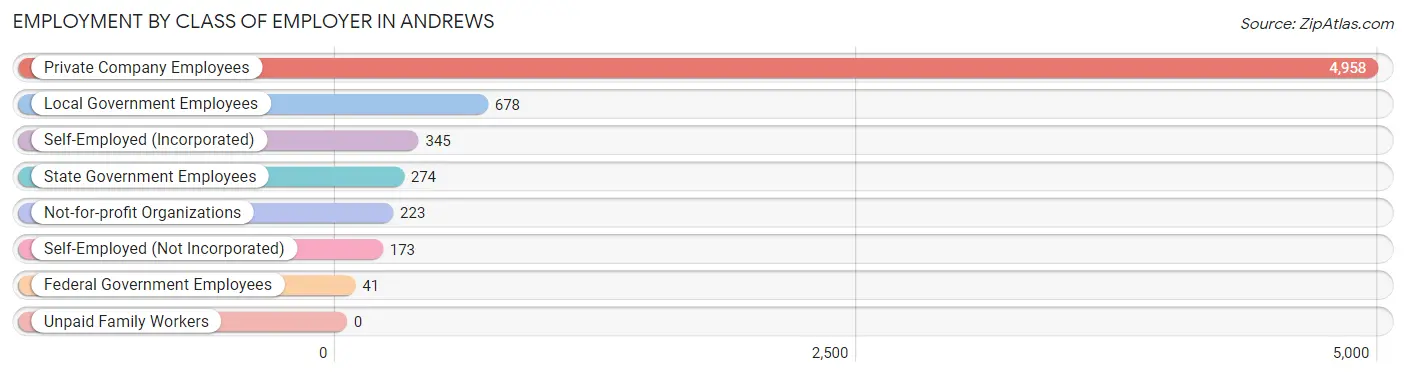
| Employer Class | # Employees | % Employees |
| Private Company Employees | 4,958 | 74.1% |
| Self-Employed (Incorporated) | 345 | 5.2% |
| Self-Employed (Not Incorporated) | 173 | 2.6% |
| Not-for-profit Organizations | 223 | 3.3% |
| Local Government Employees | 678 | 10.1% |
| State Government Employees | 274 | 4.1% |
| Federal Government Employees | 41 | 0.6% |
| Unpaid Family Workers | 0 | 0.0% |
| Total | 6,692 | 100.0% |
Employment Status by Age in Andrews
According to the labor force statistics for Andrews, out of the total population over 16 years of age (9,731), 72.9% or 7,094 individuals are in the labor force, with 2.7% or 192 of them unemployed. The age group with the highest labor force participation rate is 35 to 44 years, with 92.0% or 1,744 individuals in the labor force. Within the labor force, the 45 to 54 years age range has the highest percentage of unemployed individuals, with 8.8% or 91 of them being unemployed.
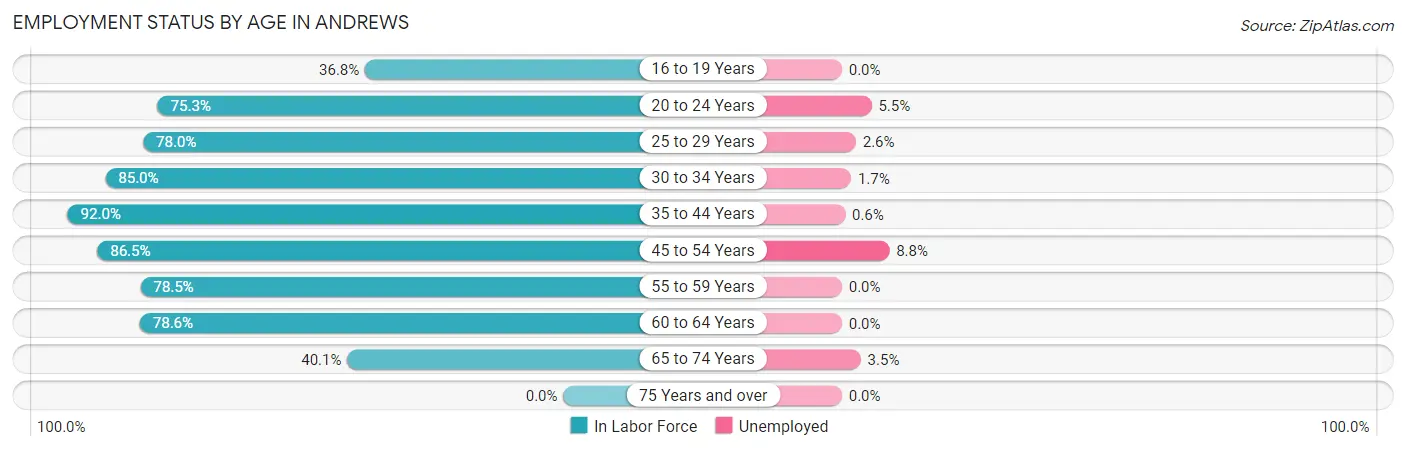
| Age Bracket | In Labor Force | Unemployed |
| 16 to 19 Years | 247 (36.8%) | 0 (0.0%) |
| 20 to 24 Years | 752 (75.3%) | 41 (5.5%) |
| 25 to 29 Years | 700 (78.0%) | 18 (2.6%) |
| 30 to 34 Years | 1,043 (85.0%) | 18 (1.7%) |
| 35 to 44 Years | 1,744 (92.0%) | 10 (0.6%) |
| 45 to 54 Years | 1,035 (86.5%) | 91 (8.8%) |
| 55 to 59 Years | 394 (78.5%) | 0 (0.0%) |
| 60 to 64 Years | 861 (78.6%) | 0 (0.0%) |
| 65 to 74 Years | 318 (40.1%) | 11 (3.5%) |
| 75 Years and over | 0 (0.0%) | 0 (0.0%) |
| Total | 7,094 (72.9%) | 192 (2.7%) |
Employment Status by Educational Attainment in Andrews
According to labor force statistics for Andrews, 84.8% of individuals (5,779) out of the total population between 25 and 64 years of age (6,815) are in the labor force, with 2.4% or 139 of them being unemployed. The group with the highest labor force participation rate are those with the educational attainment of bachelor's degree or higher, with 92.9% or 1,423 individuals in the labor force. Within the labor force, individuals with college / associate degree education have the highest percentage of unemployment, with 4.1% or 54 of them being unemployed.
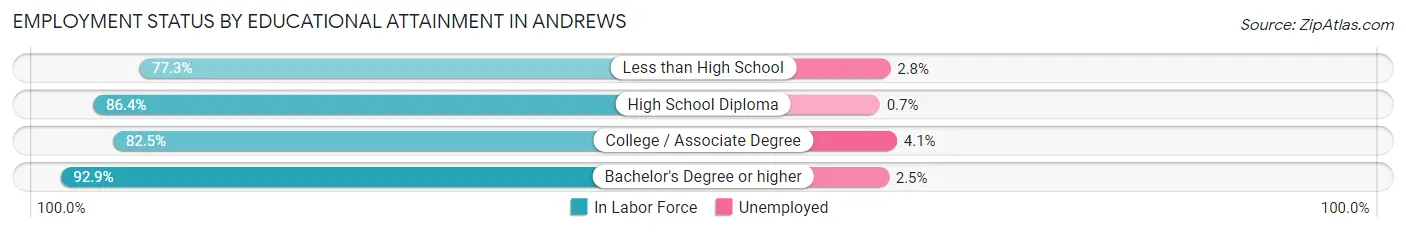
| Educational Attainment | In Labor Force | Unemployed |
| Less than High School | 1,236 (77.3%) | 45 (2.8%) |
| High School Diploma | 1,792 (86.4%) | 15 (0.7%) |
| College / Associate Degree | 1,328 (82.5%) | 66 (4.1%) |
| Bachelor's Degree or higher | 1,423 (92.9%) | 38 (2.5%) |
| Total | 5,779 (84.8%) | 164 (2.4%) |
Employment Occupations by Sex in Andrews
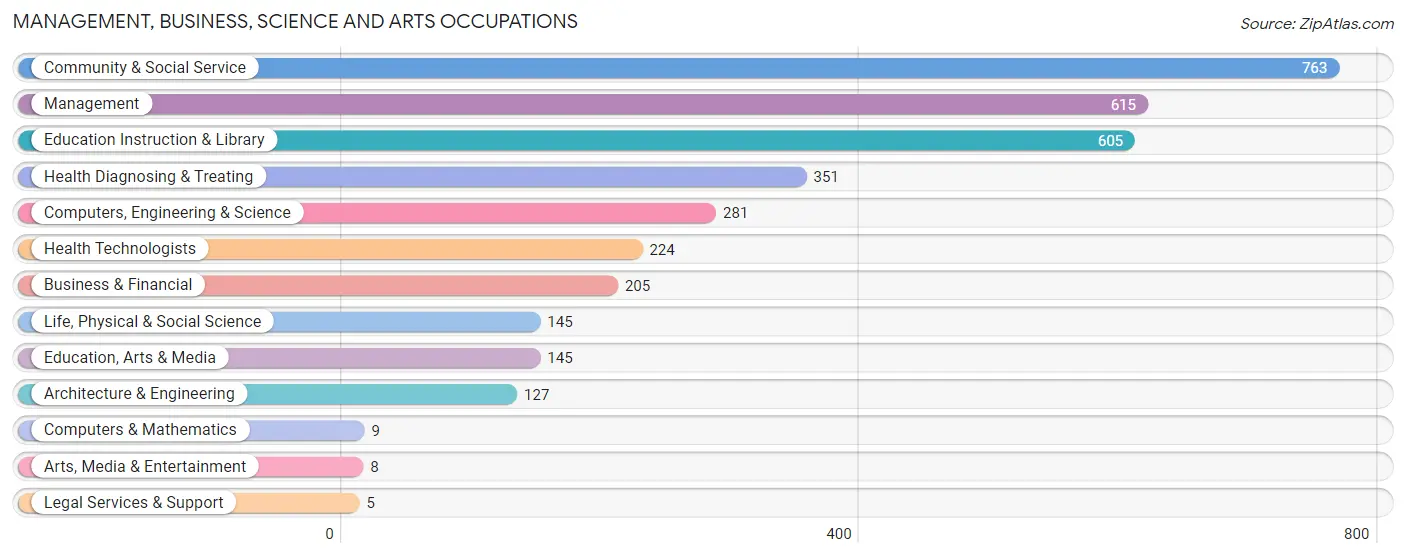
Management, Business, Science and Arts Occupations
The most common Management, Business, Science and Arts occupations in Andrews are Community & Social Service (763 | 11.1%), Management (615 | 8.9%), Education Instruction & Library (605 | 8.8%), Health Diagnosing & Treating (351 | 5.1%), and Computers, Engineering & Science (281 | 4.1%).
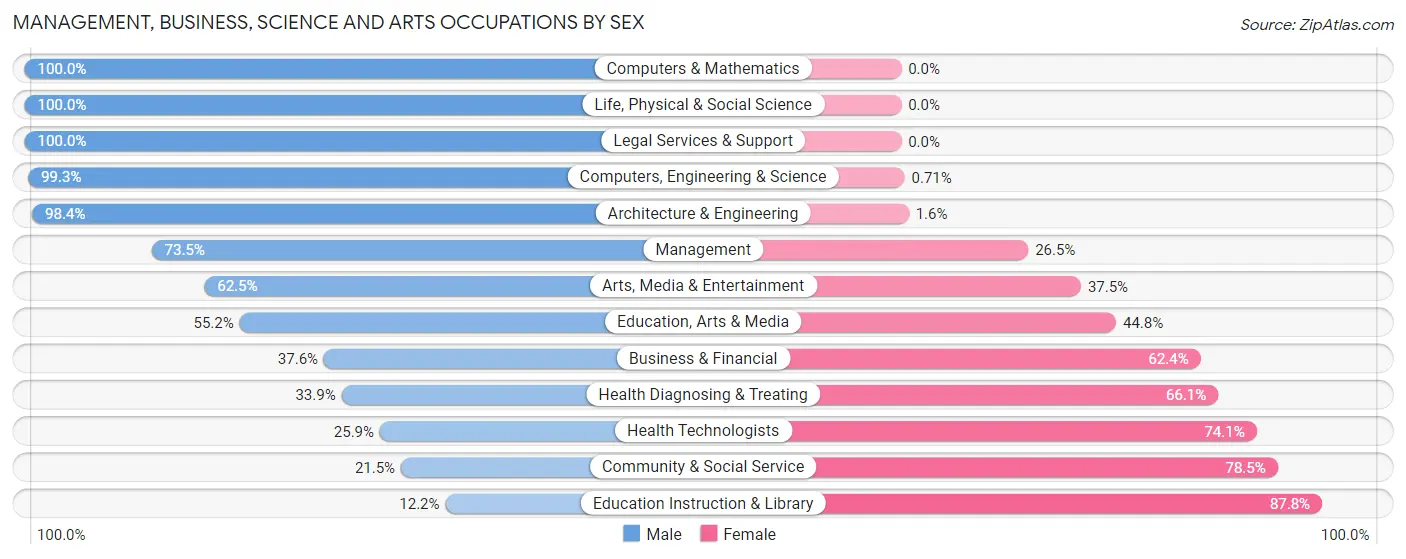
Management, Business, Science and Arts Occupations by Sex
Within the Management, Business, Science and Arts occupations in Andrews, the most male-oriented occupations are Computers & Mathematics (100.0%), Life, Physical & Social Science (100.0%), and Legal Services & Support (100.0%), while the most female-oriented occupations are Education Instruction & Library (87.8%), Community & Social Service (78.5%), and Health Technologists (74.1%).
| Occupation | Male | Female |
| Management | 452 (73.5%) | 163 (26.5%) |
| Business & Financial | 77 (37.6%) | 128 (62.4%) |
| Computers, Engineering & Science | 279 (99.3%) | 2 (0.7%) |
| Computers & Mathematics | 9 (100.0%) | 0 (0.0%) |
| Architecture & Engineering | 125 (98.4%) | 2 (1.6%) |
| Life, Physical & Social Science | 145 (100.0%) | 0 (0.0%) |
| Community & Social Service | 164 (21.5%) | 599 (78.5%) |
| Education, Arts & Media | 80 (55.2%) | 65 (44.8%) |
| Legal Services & Support | 5 (100.0%) | 0 (0.0%) |
| Education Instruction & Library | 74 (12.2%) | 531 (87.8%) |
| Arts, Media & Entertainment | 5 (62.5%) | 3 (37.5%) |
| Health Diagnosing & Treating | 119 (33.9%) | 232 (66.1%) |
| Health Technologists | 58 (25.9%) | 166 (74.1%) |
| Total (Category) | 1,091 (49.3%) | 1,124 (50.7%) |
| Total (Overall) | 3,757 (54.4%) | 3,150 (45.6%) |
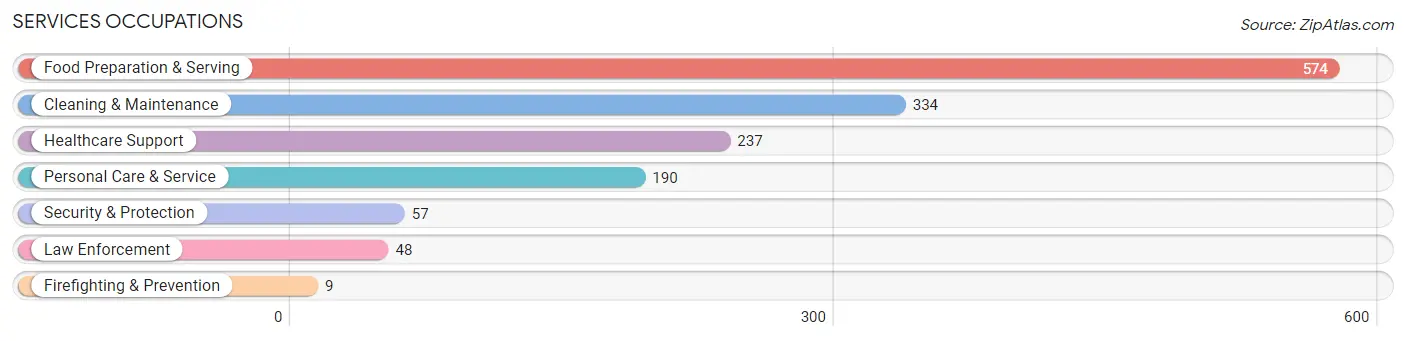
Services Occupations
The most common Services occupations in Andrews are Food Preparation & Serving (574 | 8.3%), Cleaning & Maintenance (334 | 4.8%), Healthcare Support (237 | 3.4%), Personal Care & Service (190 | 2.8%), and Security & Protection (57 | 0.8%).
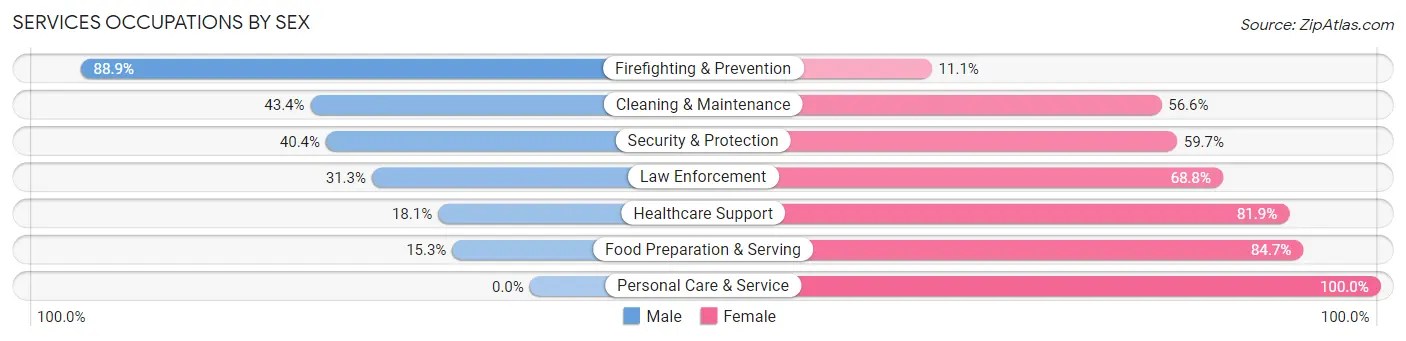
Services Occupations by Sex
Within the Services occupations in Andrews, the most male-oriented occupations are Firefighting & Prevention (88.9%), Cleaning & Maintenance (43.4%), and Security & Protection (40.4%), while the most female-oriented occupations are Personal Care & Service (100.0%), Food Preparation & Serving (84.7%), and Healthcare Support (81.9%).
| Occupation | Male | Female |
| Healthcare Support | 43 (18.1%) | 194 (81.9%) |
| Security & Protection | 23 (40.4%) | 34 (59.7%) |
| Firefighting & Prevention | 8 (88.9%) | 1 (11.1%) |
| Law Enforcement | 15 (31.2%) | 33 (68.8%) |
| Food Preparation & Serving | 88 (15.3%) | 486 (84.7%) |
| Cleaning & Maintenance | 145 (43.4%) | 189 (56.6%) |
| Personal Care & Service | 0 (0.0%) | 190 (100.0%) |
| Total (Category) | 299 (21.5%) | 1,093 (78.5%) |
| Total (Overall) | 3,757 (54.4%) | 3,150 (45.6%) |
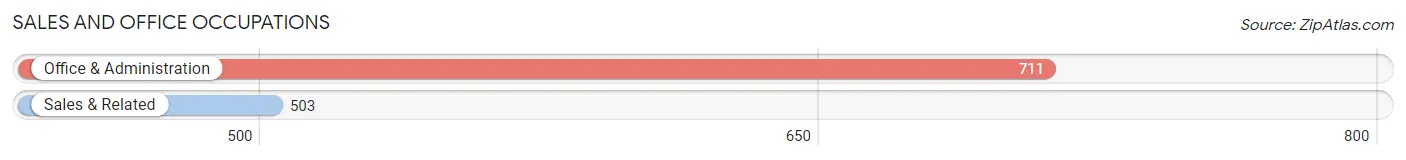
Sales and Office Occupations
The most common Sales and Office occupations in Andrews are Office & Administration (711 | 10.3%), and Sales & Related (503 | 7.3%).
Sales and Office Occupations by Sex
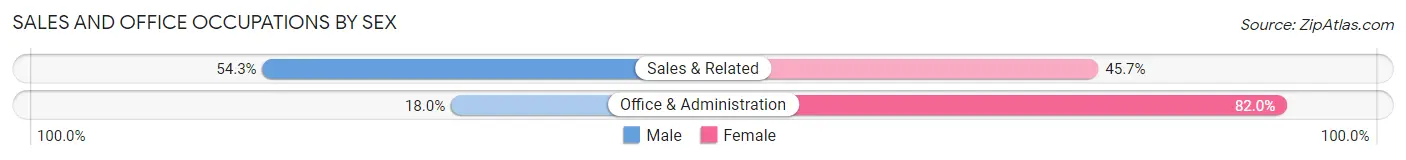
| Occupation | Male | Female |
| Sales & Related | 273 (54.3%) | 230 (45.7%) |
| Office & Administration | 128 (18.0%) | 583 (82.0%) |
| Total (Category) | 401 (33.0%) | 813 (67.0%) |
| Total (Overall) | 3,757 (54.4%) | 3,150 (45.6%) |
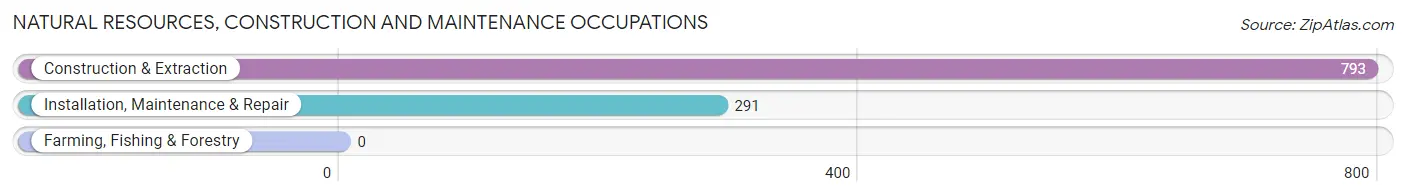
Natural Resources, Construction and Maintenance Occupations
The most common Natural Resources, Construction and Maintenance occupations in Andrews are Construction & Extraction (793 | 11.5%), and Installation, Maintenance & Repair (291 | 4.2%).
Natural Resources, Construction and Maintenance Occupations by Sex
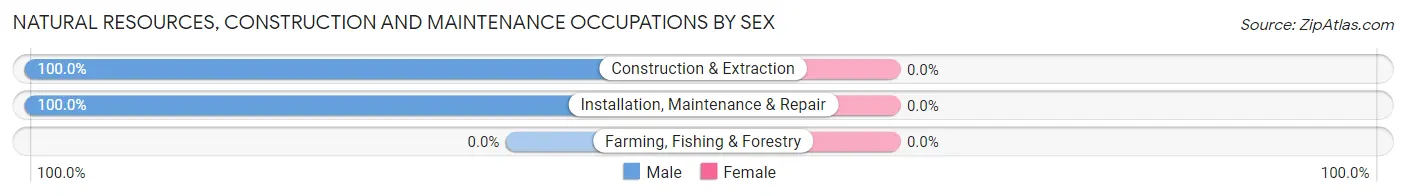
| Occupation | Male | Female |
| Farming, Fishing & Forestry | 0 (0.0%) | 0 (0.0%) |
| Construction & Extraction | 793 (100.0%) | 0 (0.0%) |
| Installation, Maintenance & Repair | 291 (100.0%) | 0 (0.0%) |
| Total (Category) | 1,084 (100.0%) | 0 (0.0%) |
| Total (Overall) | 3,757 (54.4%) | 3,150 (45.6%) |
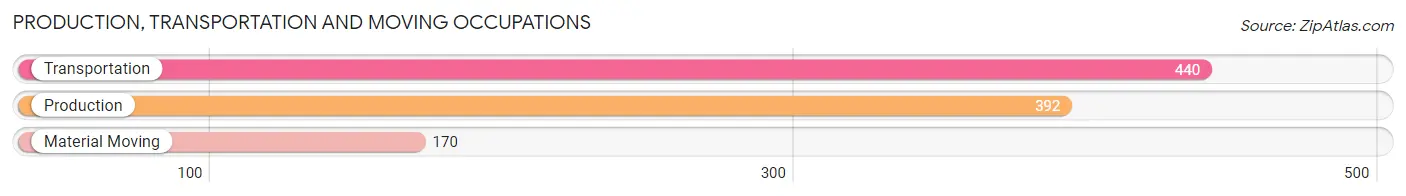
Production, Transportation and Moving Occupations
The most common Production, Transportation and Moving occupations in Andrews are Transportation (440 | 6.4%), Production (392 | 5.7%), and Material Moving (170 | 2.5%).
Production, Transportation and Moving Occupations by Sex
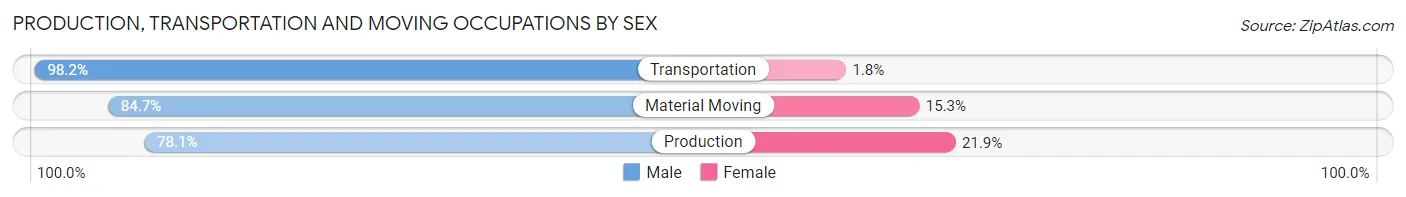
| Occupation | Male | Female |
| Production | 306 (78.1%) | 86 (21.9%) |
| Transportation | 432 (98.2%) | 8 (1.8%) |
| Material Moving | 144 (84.7%) | 26 (15.3%) |
| Total (Category) | 882 (88.0%) | 120 (12.0%) |
| Total (Overall) | 3,757 (54.4%) | 3,150 (45.6%) |
Employment Industries by Sex in Andrews
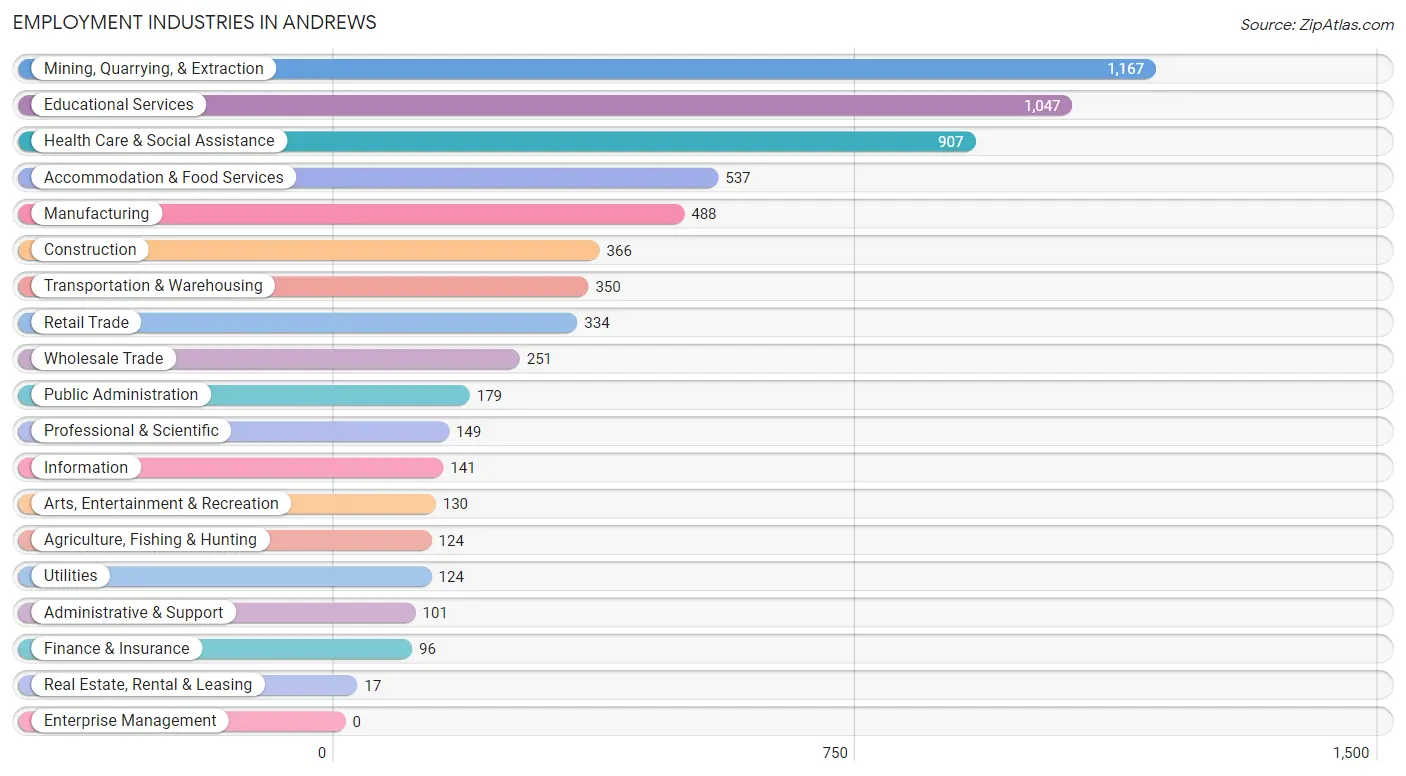
Employment Industries in Andrews
The major employment industries in Andrews include Mining, Quarrying, & Extraction (1,167 | 16.9%), Educational Services (1,047 | 15.2%), Health Care & Social Assistance (907 | 13.1%), Accommodation & Food Services (537 | 7.8%), and Manufacturing (488 | 7.1%).
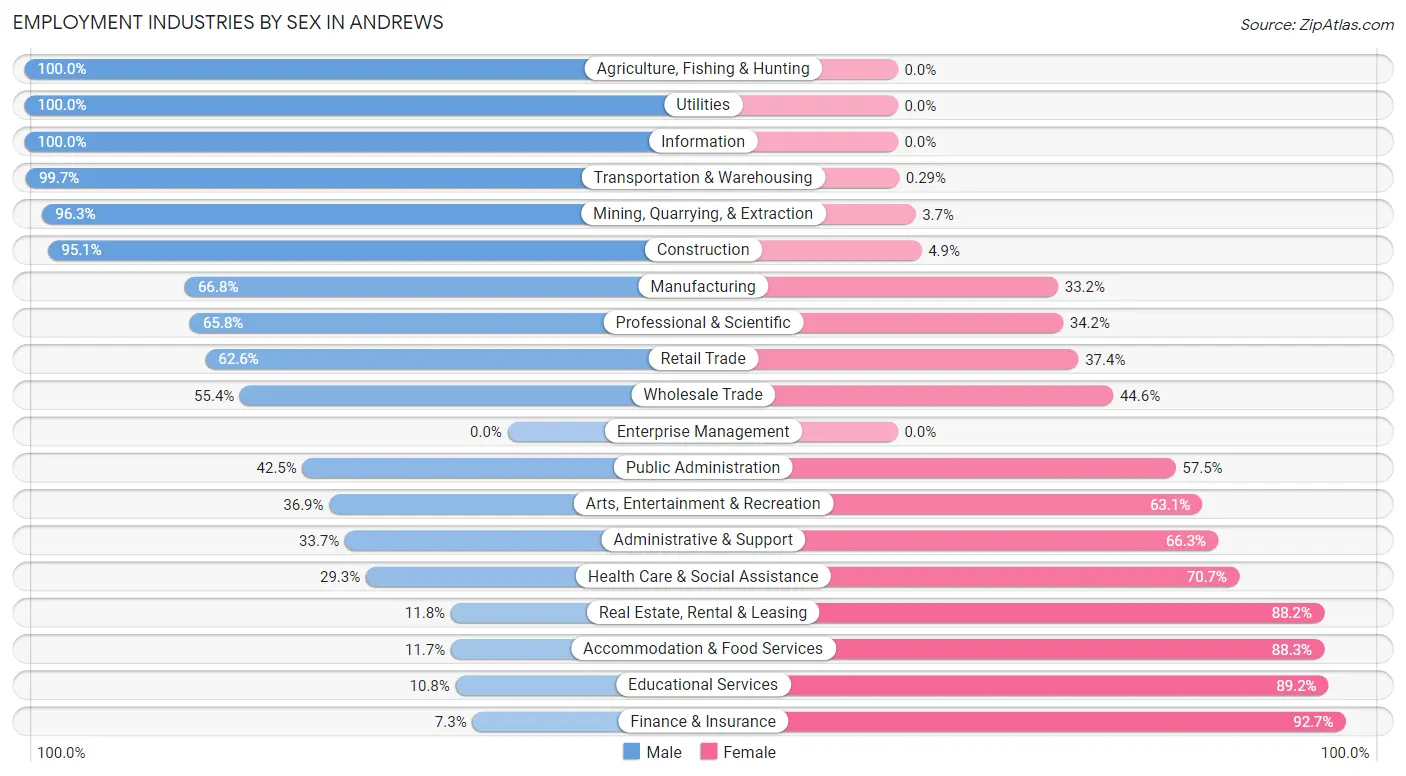
Employment Industries by Sex in Andrews
The Andrews industries that see more men than women are Agriculture, Fishing & Hunting (100.0%), Utilities (100.0%), and Information (100.0%), whereas the industries that tend to have a higher number of women are Finance & Insurance (92.7%), Educational Services (89.2%), and Accommodation & Food Services (88.3%).
| Industry | Male | Female |
| Agriculture, Fishing & Hunting | 124 (100.0%) | 0 (0.0%) |
| Mining, Quarrying, & Extraction | 1,124 (96.3%) | 43 (3.7%) |
| Construction | 348 (95.1%) | 18 (4.9%) |
| Manufacturing | 326 (66.8%) | 162 (33.2%) |
| Wholesale Trade | 139 (55.4%) | 112 (44.6%) |
| Retail Trade | 209 (62.6%) | 125 (37.4%) |
| Transportation & Warehousing | 349 (99.7%) | 1 (0.3%) |
| Utilities | 124 (100.0%) | 0 (0.0%) |
| Information | 141 (100.0%) | 0 (0.0%) |
| Finance & Insurance | 7 (7.3%) | 89 (92.7%) |
| Real Estate, Rental & Leasing | 2 (11.8%) | 15 (88.2%) |
| Professional & Scientific | 98 (65.8%) | 51 (34.2%) |
| Enterprise Management | 0 (0.0%) | 0 (0.0%) |
| Administrative & Support | 34 (33.7%) | 67 (66.3%) |
| Educational Services | 113 (10.8%) | 934 (89.2%) |
| Health Care & Social Assistance | 266 (29.3%) | 641 (70.7%) |
| Arts, Entertainment & Recreation | 48 (36.9%) | 82 (63.1%) |
| Accommodation & Food Services | 63 (11.7%) | 474 (88.3%) |
| Public Administration | 76 (42.5%) | 103 (57.5%) |
| Total | 3,757 (54.4%) | 3,150 (45.6%) |
Education in Andrews
School Enrollment in Andrews
The most common levels of schooling among the 3,852 students in Andrews are elementary school (1,070 | 27.8%), middle school (951 | 24.7%), and high school (743 | 19.3%).
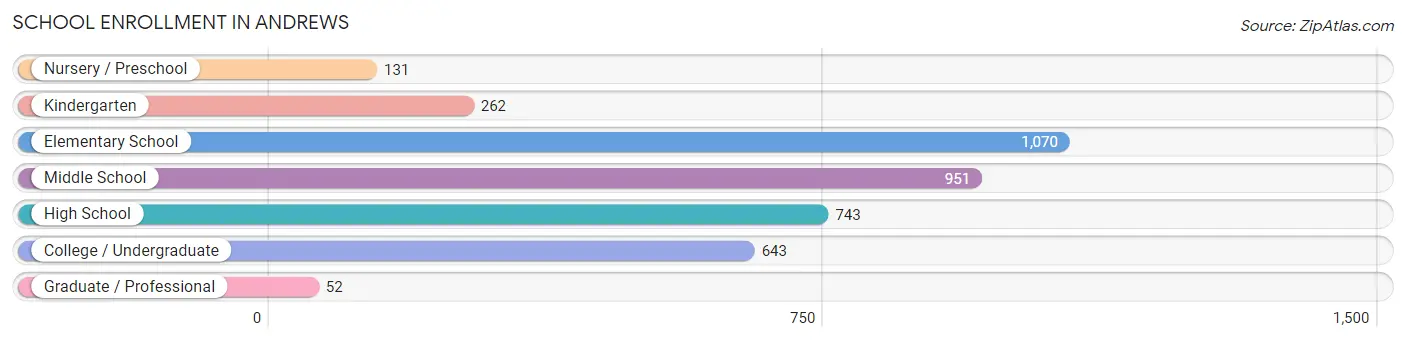
| School Level | # Students | % Students |
| Nursery / Preschool | 131 | 3.4% |
| Kindergarten | 262 | 6.8% |
| Elementary School | 1,070 | 27.8% |
| Middle School | 951 | 24.7% |
| High School | 743 | 19.3% |
| College / Undergraduate | 643 | 16.7% |
| Graduate / Professional | 52 | 1.3% |
| Total | 3,852 | 100.0% |
School Enrollment by Age by Funding Source in Andrews
Out of a total of 3,852 students who are enrolled in schools in Andrews, 223 (5.8%) attend a private institution, while the remaining 3,629 (94.2%) are enrolled in public schools. The age group of 3 to 4 year olds has the highest likelihood of being enrolled in private schools, with 60 (45.8% in the age bracket) enrolled. Conversely, the age group of 20 to 24 year olds has the lowest likelihood of being enrolled in a private school, with 34 (100.0% in the age bracket) attending a public institution.
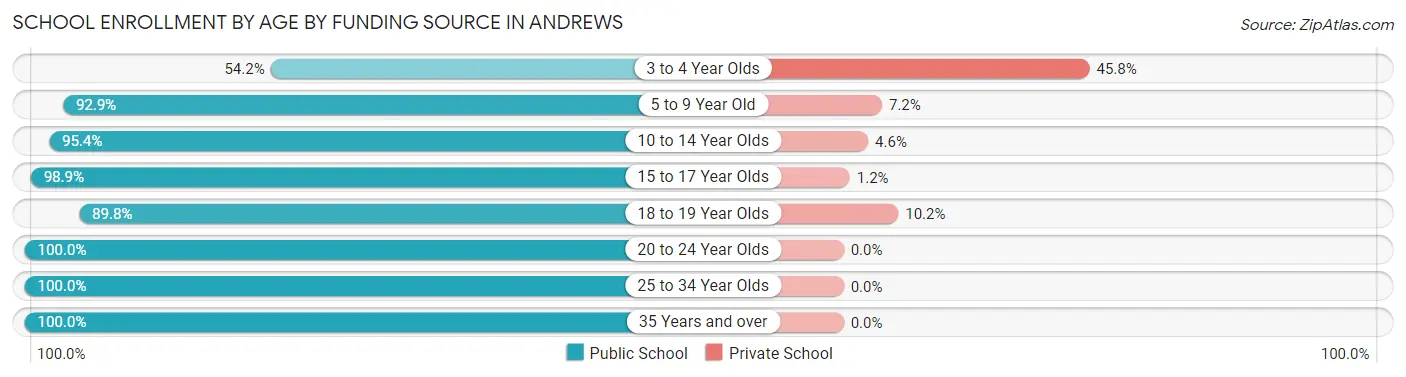
| Age Bracket | Public School | Private School |
| 3 to 4 Year Olds | 71 (54.2%) | 60 (45.8%) |
| 5 to 9 Year Old | 1,195 (92.8%) | 92 (7.1%) |
| 10 to 14 Year Olds | 962 (95.4%) | 46 (4.6%) |
| 15 to 17 Year Olds | 603 (98.9%) | 7 (1.1%) |
| 18 to 19 Year Olds | 159 (89.8%) | 18 (10.2%) |
| 20 to 24 Year Olds | 34 (100.0%) | 0 (0.0%) |
| 25 to 34 Year Olds | 281 (100.0%) | 0 (0.0%) |
| 35 Years and over | 324 (100.0%) | 0 (0.0%) |
| Total | 3,629 (94.2%) | 223 (5.8%) |
Educational Attainment by Field of Study in Andrews
Education (436 | 22.0%), arts & humanities (390 | 19.7%), science & technology (258 | 13.0%), bio, nature & agricultural (219 | 11.0%), and engineering (142 | 7.2%) are the most common fields of study among 1,983 individuals in Andrews who have obtained a bachelor's degree or higher.
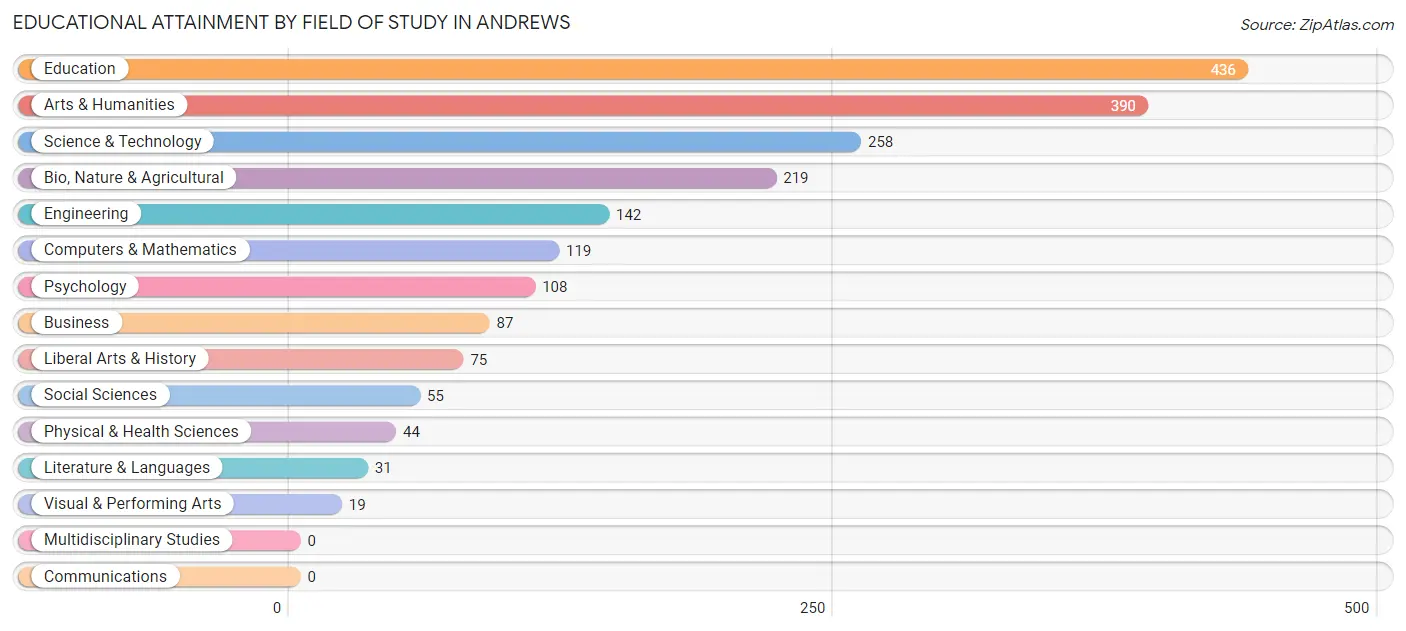
| Field of Study | # Graduates | % Graduates |
| Computers & Mathematics | 119 | 6.0% |
| Bio, Nature & Agricultural | 219 | 11.0% |
| Physical & Health Sciences | 44 | 2.2% |
| Psychology | 108 | 5.4% |
| Social Sciences | 55 | 2.8% |
| Engineering | 142 | 7.2% |
| Multidisciplinary Studies | 0 | 0.0% |
| Science & Technology | 258 | 13.0% |
| Business | 87 | 4.4% |
| Education | 436 | 22.0% |
| Literature & Languages | 31 | 1.6% |
| Liberal Arts & History | 75 | 3.8% |
| Visual & Performing Arts | 19 | 1.0% |
| Communications | 0 | 0.0% |
| Arts & Humanities | 390 | 19.7% |
| Total | 1,983 | 100.0% |
Transportation & Commute in Andrews
Vehicle Availability by Sex in Andrews
The most prevalent vehicle ownership categories in Andrews are males with 2 vehicles (1,910, accounting for 51.9%) and females with 2 vehicles (1,068, making up 63.4%).
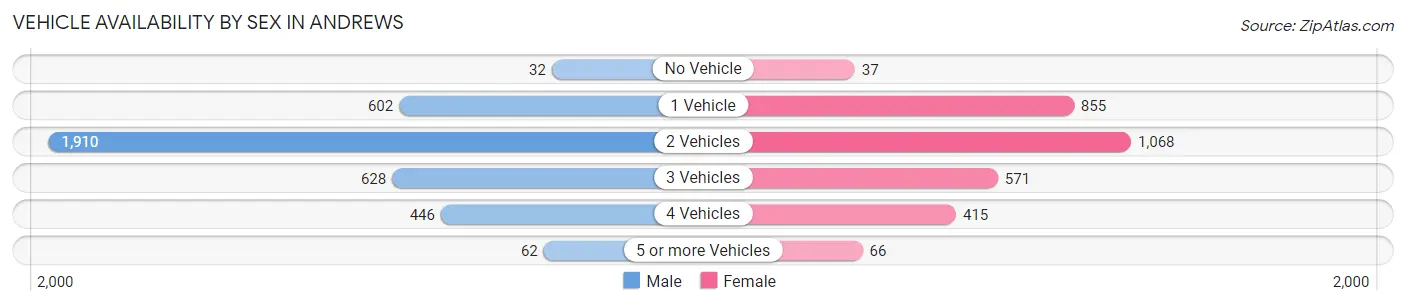
| Vehicles Available | Male | Female |
| No Vehicle | 32 (0.9%) | 37 (1.2%) |
| 1 Vehicle | 602 (16.4%) | 855 (28.4%) |
| 2 Vehicles | 1,910 (51.9%) | 1,068 (35.5%) |
| 3 Vehicles | 628 (17.1%) | 571 (19.0%) |
| 4 Vehicles | 446 (12.1%) | 415 (13.8%) |
| 5 or more Vehicles | 62 (1.7%) | 66 (2.2%) |
| Total | 3,680 (100.0%) | 3,012 (100.0%) |
Commute Time in Andrews
The most frequently occuring commute durations in Andrews are 5 to 9 minutes (1,439 commuters, 21.9%), 10 to 14 minutes (1,167 commuters, 17.8%), and less than 5 minutes (979 commuters, 14.9%).
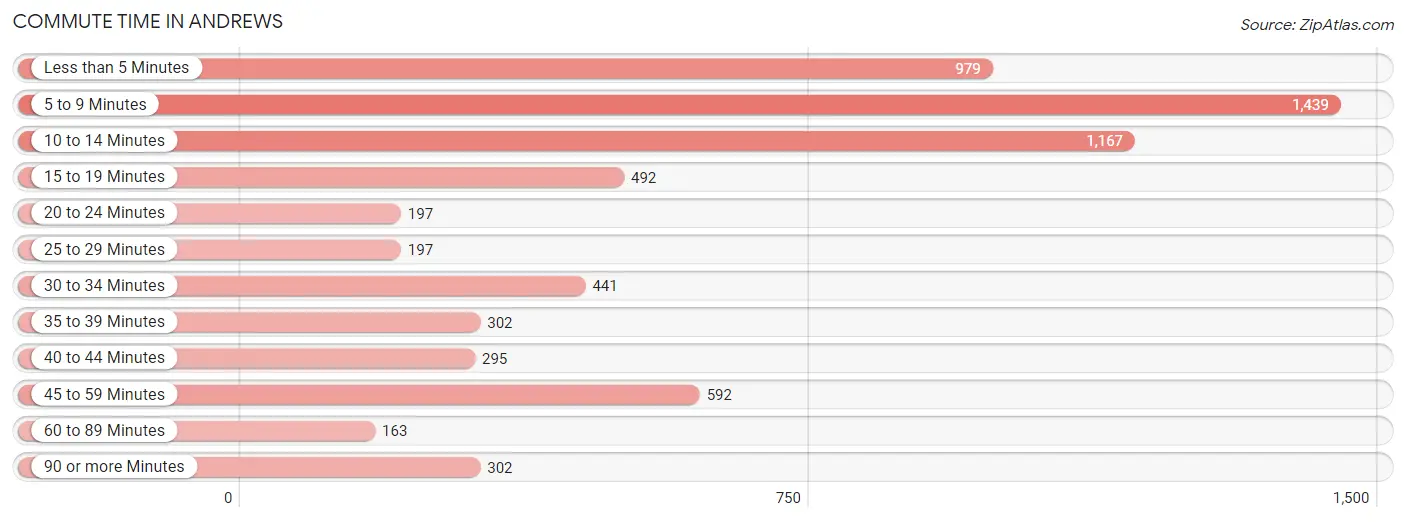
| Commute Time | # Commuters | % Commuters |
| Less than 5 Minutes | 979 | 14.9% |
| 5 to 9 Minutes | 1,439 | 21.9% |
| 10 to 14 Minutes | 1,167 | 17.8% |
| 15 to 19 Minutes | 492 | 7.5% |
| 20 to 24 Minutes | 197 | 3.0% |
| 25 to 29 Minutes | 197 | 3.0% |
| 30 to 34 Minutes | 441 | 6.7% |
| 35 to 39 Minutes | 302 | 4.6% |
| 40 to 44 Minutes | 295 | 4.5% |
| 45 to 59 Minutes | 592 | 9.0% |
| 60 to 89 Minutes | 163 | 2.5% |
| 90 or more Minutes | 302 | 4.6% |
Commute Time by Sex in Andrews
The most common commute times in Andrews are 5 to 9 minutes (667 commuters, 18.5%) for males and 5 to 9 minutes (772 commuters, 26.0%) for females.
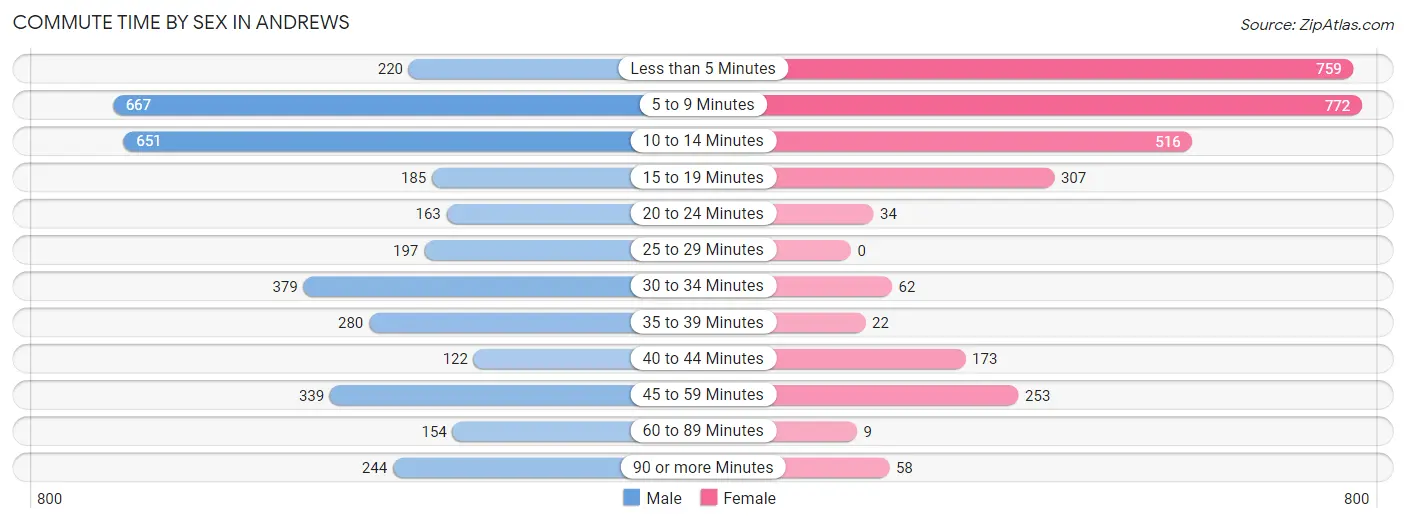
| Commute Time | Male | Female |
| Less than 5 Minutes | 220 (6.1%) | 759 (25.6%) |
| 5 to 9 Minutes | 667 (18.5%) | 772 (26.0%) |
| 10 to 14 Minutes | 651 (18.1%) | 516 (17.4%) |
| 15 to 19 Minutes | 185 (5.1%) | 307 (10.3%) |
| 20 to 24 Minutes | 163 (4.5%) | 34 (1.1%) |
| 25 to 29 Minutes | 197 (5.5%) | 0 (0.0%) |
| 30 to 34 Minutes | 379 (10.5%) | 62 (2.1%) |
| 35 to 39 Minutes | 280 (7.8%) | 22 (0.7%) |
| 40 to 44 Minutes | 122 (3.4%) | 173 (5.8%) |
| 45 to 59 Minutes | 339 (9.4%) | 253 (8.5%) |
| 60 to 89 Minutes | 154 (4.3%) | 9 (0.3%) |
| 90 or more Minutes | 244 (6.8%) | 58 (2.0%) |
Time of Departure to Work by Sex in Andrews
The most frequent times of departure to work in Andrews are 7:00 AM to 7:29 AM (914, 25.4%) for males and 7:30 AM to 7:59 AM (659, 22.2%) for females.
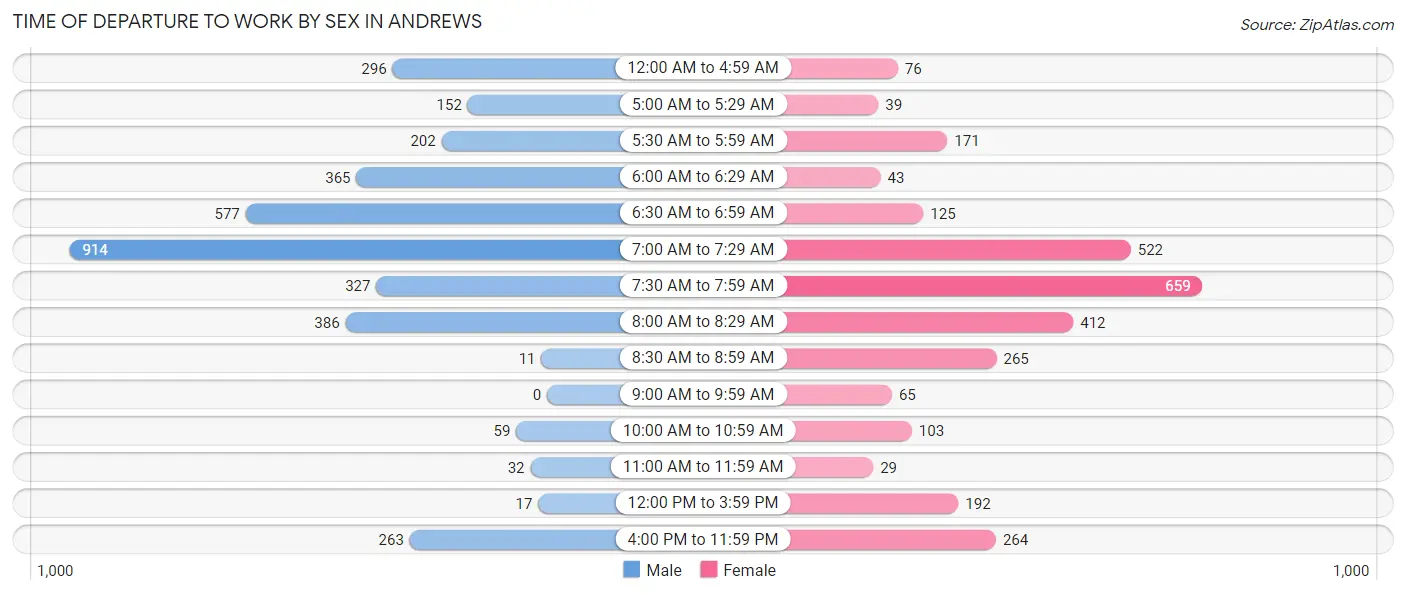
| Time of Departure | Male | Female |
| 12:00 AM to 4:59 AM | 296 (8.2%) | 76 (2.6%) |
| 5:00 AM to 5:29 AM | 152 (4.2%) | 39 (1.3%) |
| 5:30 AM to 5:59 AM | 202 (5.6%) | 171 (5.8%) |
| 6:00 AM to 6:29 AM | 365 (10.1%) | 43 (1.5%) |
| 6:30 AM to 6:59 AM | 577 (16.0%) | 125 (4.2%) |
| 7:00 AM to 7:29 AM | 914 (25.4%) | 522 (17.6%) |
| 7:30 AM to 7:59 AM | 327 (9.1%) | 659 (22.2%) |
| 8:00 AM to 8:29 AM | 386 (10.7%) | 412 (13.9%) |
| 8:30 AM to 8:59 AM | 11 (0.3%) | 265 (8.9%) |
| 9:00 AM to 9:59 AM | 0 (0.0%) | 65 (2.2%) |
| 10:00 AM to 10:59 AM | 59 (1.6%) | 103 (3.5%) |
| 11:00 AM to 11:59 AM | 32 (0.9%) | 29 (1.0%) |
| 12:00 PM to 3:59 PM | 17 (0.5%) | 192 (6.5%) |
| 4:00 PM to 11:59 PM | 263 (7.3%) | 264 (8.9%) |
| Total | 3,601 (100.0%) | 2,965 (100.0%) |
Housing Occupancy in Andrews
Occupancy by Ownership in Andrews
Of the total 4,994 dwellings in Andrews, owner-occupied units account for 3,488 (69.8%), while renter-occupied units make up 1,506 (30.2%).
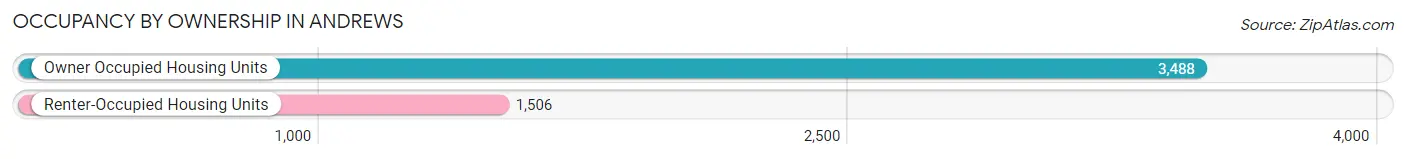
| Occupancy | # Housing Units | % Housing Units |
| Owner Occupied Housing Units | 3,488 | 69.8% |
| Renter-Occupied Housing Units | 1,506 | 30.2% |
| Total Occupied Housing Units | 4,994 | 100.0% |
Occupancy by Household Size in Andrews
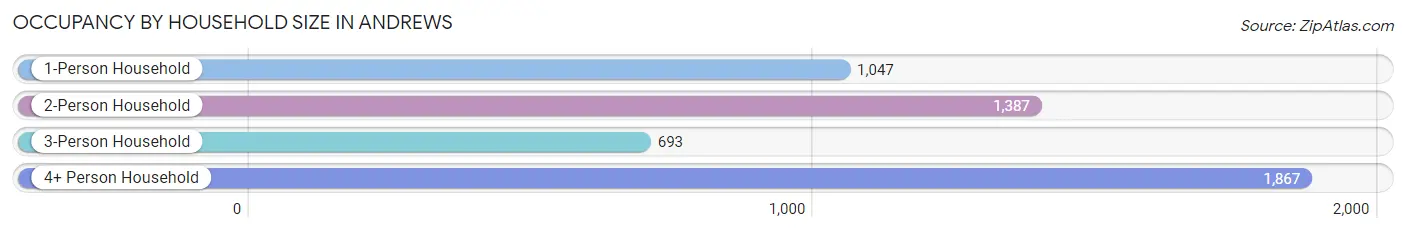
| Household Size | # Housing Units | % Housing Units |
| 1-Person Household | 1,047 | 21.0% |
| 2-Person Household | 1,387 | 27.8% |
| 3-Person Household | 693 | 13.9% |
| 4+ Person Household | 1,867 | 37.4% |
| Total Housing Units | 4,994 | 100.0% |
Occupancy by Ownership by Household Size in Andrews
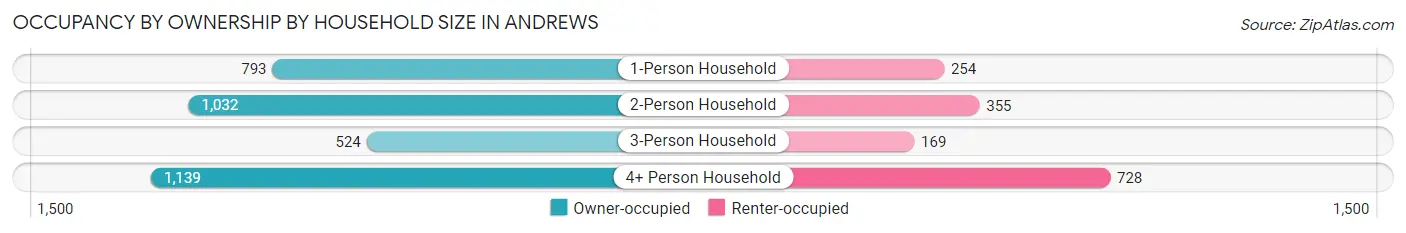
| Household Size | Owner-occupied | Renter-occupied |
| 1-Person Household | 793 (75.7%) | 254 (24.3%) |
| 2-Person Household | 1,032 (74.4%) | 355 (25.6%) |
| 3-Person Household | 524 (75.6%) | 169 (24.4%) |
| 4+ Person Household | 1,139 (61.0%) | 728 (39.0%) |
| Total Housing Units | 3,488 (69.8%) | 1,506 (30.2%) |
Occupancy by Educational Attainment in Andrews
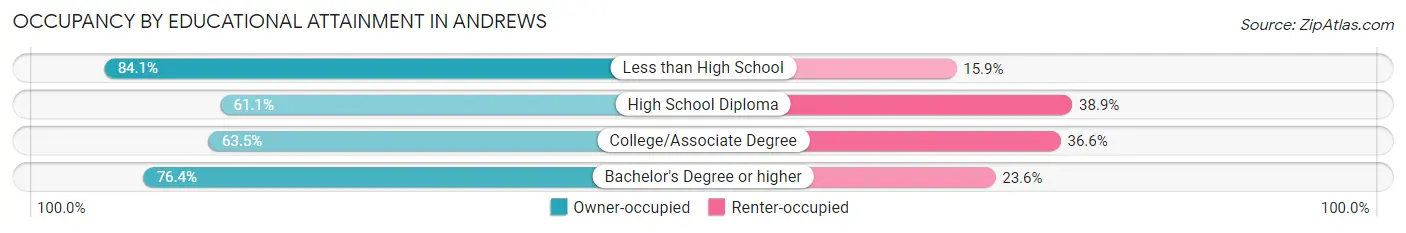
| Household Size | Owner-occupied | Renter-occupied |
| Less than High School | 847 (84.1%) | 160 (15.9%) |
| High School Diploma | 955 (61.1%) | 607 (38.9%) |
| College/Associate Degree | 816 (63.4%) | 470 (36.5%) |
| Bachelor's Degree or higher | 870 (76.4%) | 269 (23.6%) |
Occupancy by Age of Householder in Andrews
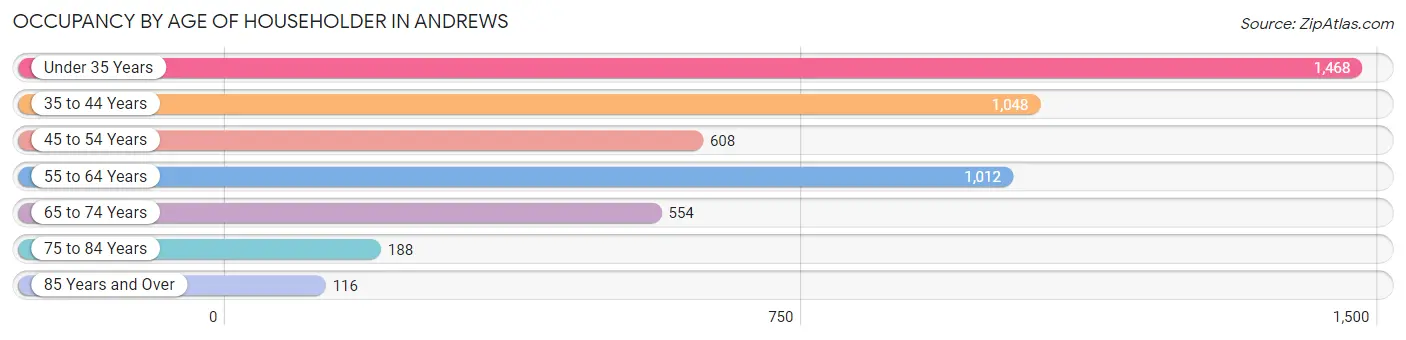
| Age Bracket | # Households | % Households |
| Under 35 Years | 1,468 | 29.4% |
| 35 to 44 Years | 1,048 | 21.0% |
| 45 to 54 Years | 608 | 12.2% |
| 55 to 64 Years | 1,012 | 20.3% |
| 65 to 74 Years | 554 | 11.1% |
| 75 to 84 Years | 188 | 3.8% |
| 85 Years and Over | 116 | 2.3% |
| Total | 4,994 | 100.0% |
Housing Finances in Andrews
Median Income by Occupancy in Andrews
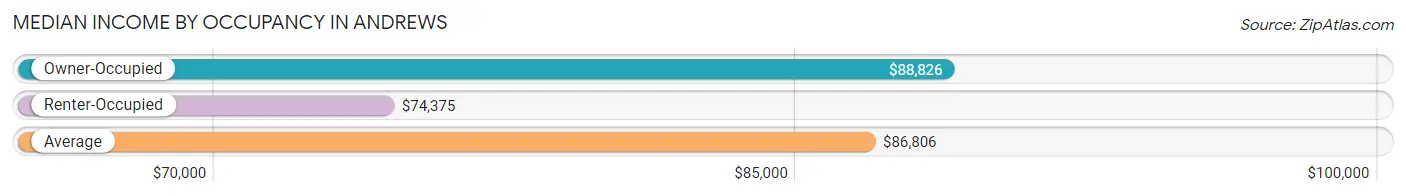
| Occupancy Type | # Households | Median Income |
| Owner-Occupied | 3,488 (69.8%) | $88,826 |
| Renter-Occupied | 1,506 (30.2%) | $74,375 |
| Average | 4,994 (100.0%) | $86,806 |
Occupancy by Householder Income Bracket in Andrews
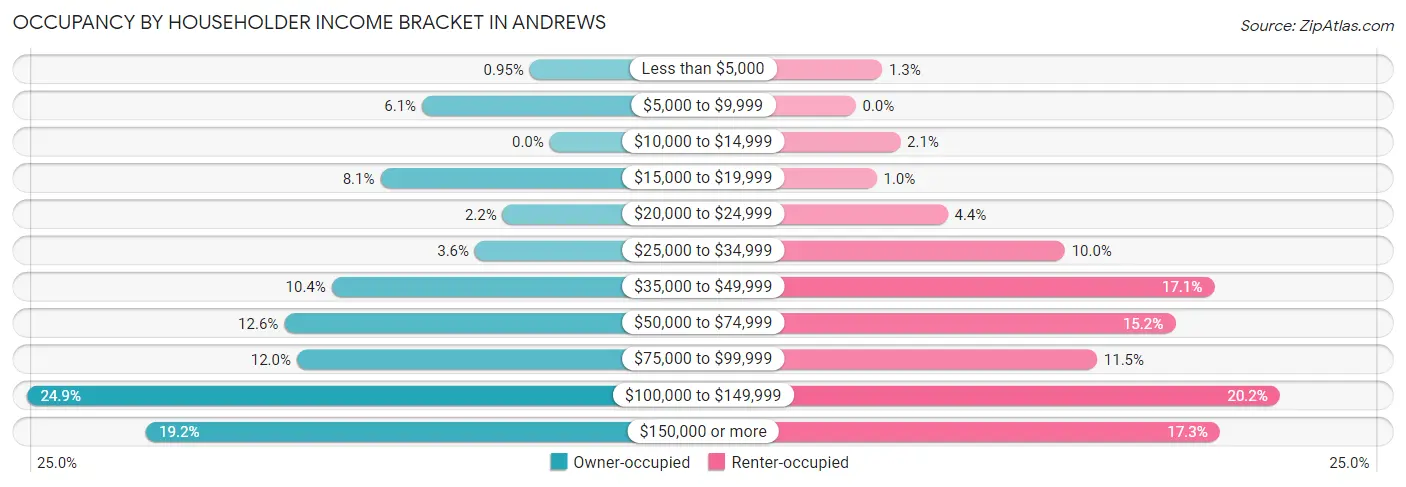
| Income Bracket | Owner-occupied | Renter-occupied |
| Less than $5,000 | 33 (0.9%) | 19 (1.3%) |
| $5,000 to $9,999 | 212 (6.1%) | 0 (0.0%) |
| $10,000 to $14,999 | 0 (0.0%) | 32 (2.1%) |
| $15,000 to $19,999 | 281 (8.1%) | 15 (1.0%) |
| $20,000 to $24,999 | 78 (2.2%) | 66 (4.4%) |
| $25,000 to $34,999 | 124 (3.6%) | 150 (10.0%) |
| $35,000 to $49,999 | 362 (10.4%) | 257 (17.1%) |
| $50,000 to $74,999 | 441 (12.6%) | 229 (15.2%) |
| $75,000 to $99,999 | 420 (12.0%) | 173 (11.5%) |
| $100,000 to $149,999 | 867 (24.9%) | 304 (20.2%) |
| $150,000 or more | 670 (19.2%) | 261 (17.3%) |
| Total | 3,488 (100.0%) | 1,506 (100.0%) |
Monthly Housing Cost Tiers in Andrews
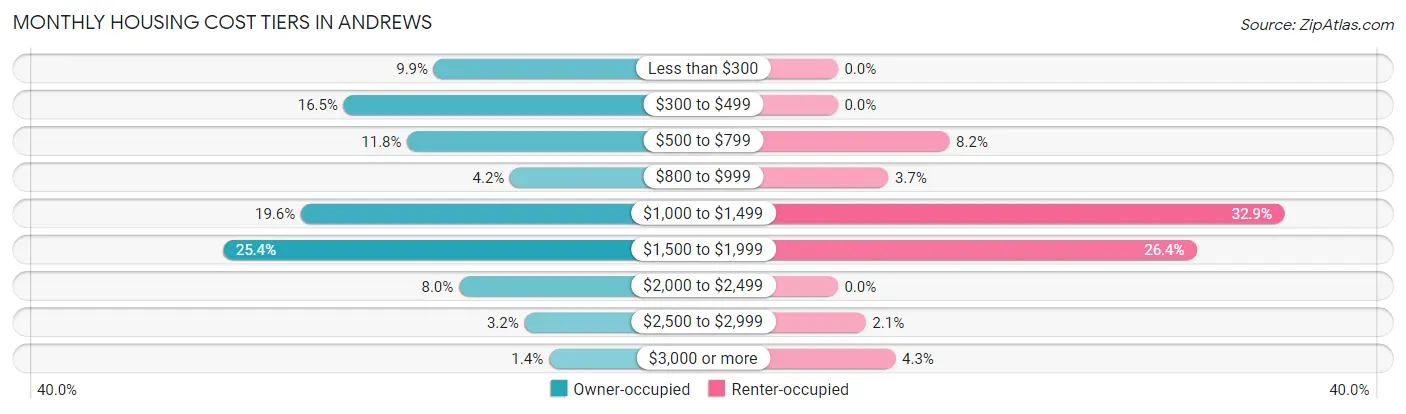
| Monthly Cost | Owner-occupied | Renter-occupied |
| Less than $300 | 344 (9.9%) | 0 (0.0%) |
| $300 to $499 | 575 (16.5%) | 0 (0.0%) |
| $500 to $799 | 412 (11.8%) | 124 (8.2%) |
| $800 to $999 | 148 (4.2%) | 56 (3.7%) |
| $1,000 to $1,499 | 685 (19.6%) | 495 (32.9%) |
| $1,500 to $1,999 | 886 (25.4%) | 398 (26.4%) |
| $2,000 to $2,499 | 279 (8.0%) | 0 (0.0%) |
| $2,500 to $2,999 | 111 (3.2%) | 31 (2.1%) |
| $3,000 or more | 48 (1.4%) | 64 (4.3%) |
| Total | 3,488 (100.0%) | 1,506 (100.0%) |
Physical Housing Characteristics in Andrews
Housing Structures in Andrews
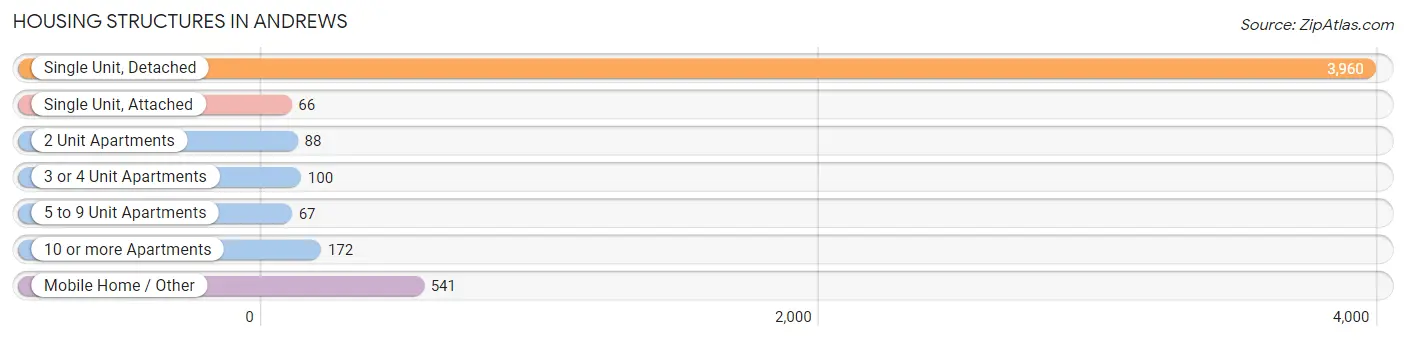
| Structure Type | # Housing Units | % Housing Units |
| Single Unit, Detached | 3,960 | 79.3% |
| Single Unit, Attached | 66 | 1.3% |
| 2 Unit Apartments | 88 | 1.8% |
| 3 or 4 Unit Apartments | 100 | 2.0% |
| 5 to 9 Unit Apartments | 67 | 1.3% |
| 10 or more Apartments | 172 | 3.4% |
| Mobile Home / Other | 541 | 10.8% |
| Total | 4,994 | 100.0% |
Housing Structures by Occupancy in Andrews
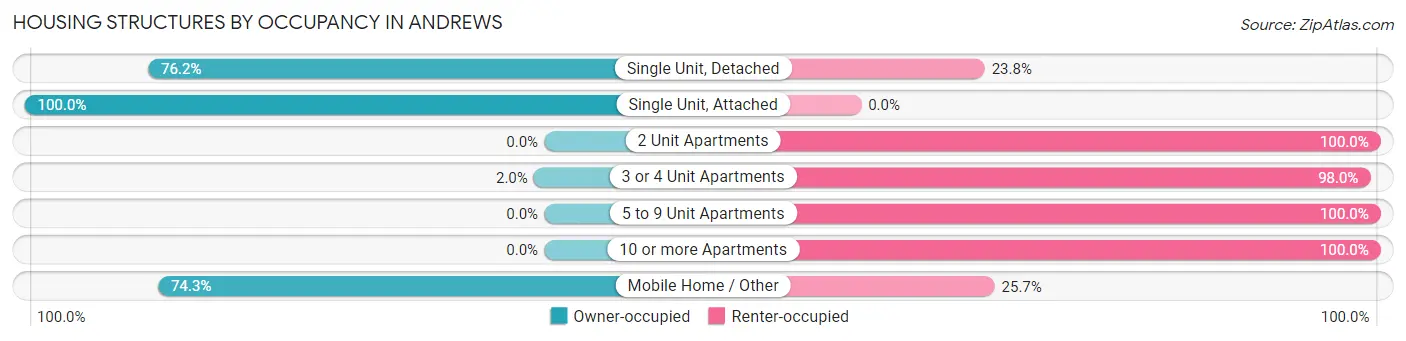
| Structure Type | Owner-occupied | Renter-occupied |
| Single Unit, Detached | 3,018 (76.2%) | 942 (23.8%) |
| Single Unit, Attached | 66 (100.0%) | 0 (0.0%) |
| 2 Unit Apartments | 0 (0.0%) | 88 (100.0%) |
| 3 or 4 Unit Apartments | 2 (2.0%) | 98 (98.0%) |
| 5 to 9 Unit Apartments | 0 (0.0%) | 67 (100.0%) |
| 10 or more Apartments | 0 (0.0%) | 172 (100.0%) |
| Mobile Home / Other | 402 (74.3%) | 139 (25.7%) |
| Total | 3,488 (69.8%) | 1,506 (30.2%) |
Housing Structures by Number of Rooms in Andrews
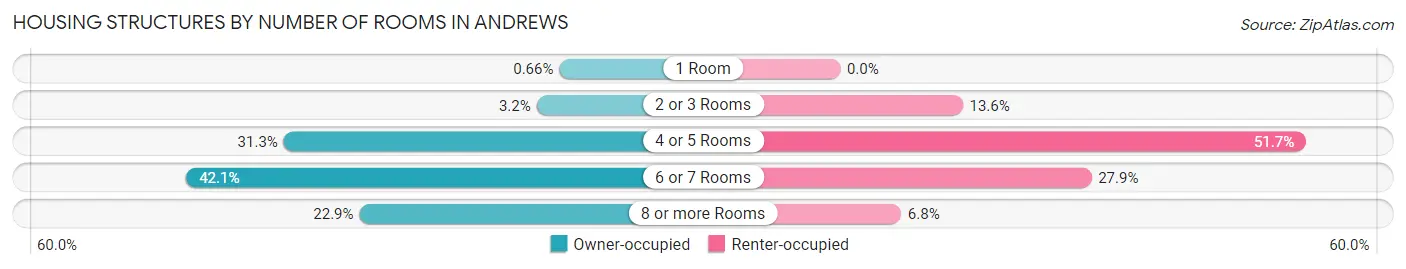
| Number of Rooms | Owner-occupied | Renter-occupied |
| 1 Room | 23 (0.7%) | 0 (0.0%) |
| 2 or 3 Rooms | 111 (3.2%) | 205 (13.6%) |
| 4 or 5 Rooms | 1,090 (31.2%) | 779 (51.7%) |
| 6 or 7 Rooms | 1,467 (42.1%) | 420 (27.9%) |
| 8 or more Rooms | 797 (22.9%) | 102 (6.8%) |
| Total | 3,488 (100.0%) | 1,506 (100.0%) |
Housing Structure by Heating Type in Andrews
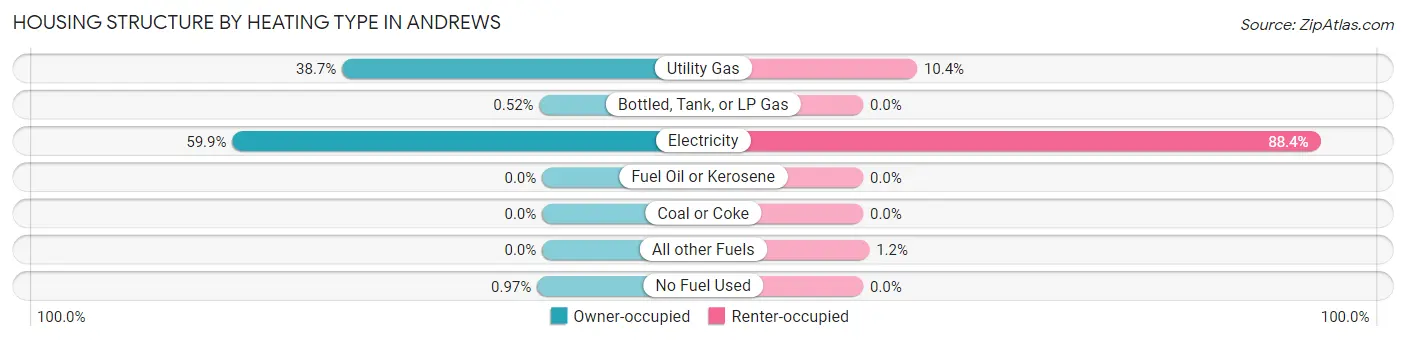
| Heating Type | Owner-occupied | Renter-occupied |
| Utility Gas | 1,348 (38.7%) | 157 (10.4%) |
| Bottled, Tank, or LP Gas | 18 (0.5%) | 0 (0.0%) |
| Electricity | 2,088 (59.9%) | 1,331 (88.4%) |
| Fuel Oil or Kerosene | 0 (0.0%) | 0 (0.0%) |
| Coal or Coke | 0 (0.0%) | 0 (0.0%) |
| All other Fuels | 0 (0.0%) | 18 (1.2%) |
| No Fuel Used | 34 (1.0%) | 0 (0.0%) |
| Total | 3,488 (100.0%) | 1,506 (100.0%) |
Household Vehicle Usage in Andrews
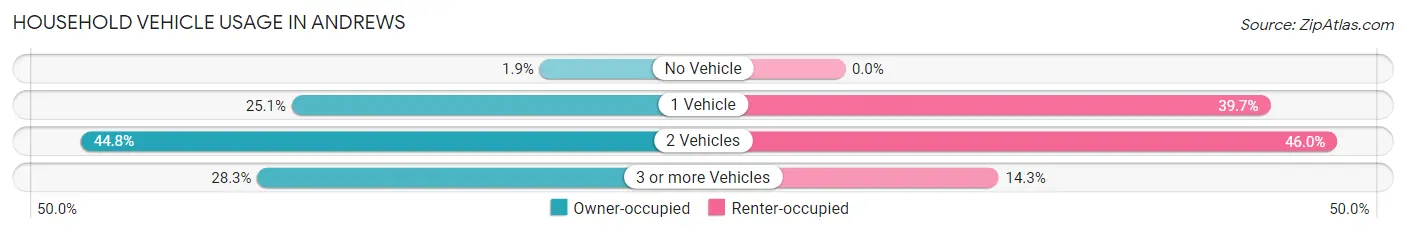
| Vehicles per Household | Owner-occupied | Renter-occupied |
| No Vehicle | 67 (1.9%) | 0 (0.0%) |
| 1 Vehicle | 874 (25.1%) | 598 (39.7%) |
| 2 Vehicles | 1,561 (44.8%) | 692 (46.0%) |
| 3 or more Vehicles | 986 (28.3%) | 216 (14.3%) |
| Total | 3,488 (100.0%) | 1,506 (100.0%) |
Real Estate & Mortgages in Andrews
Real Estate and Mortgage Overview in Andrews
| Characteristic | Without Mortgage | With Mortgage |
| Housing Units | 1,605 | 1,883 |
| Median Property Value | $138,900 | $188,600 |
| Median Household Income | $67,411 | $425 |
| Monthly Housing Costs | $459 | $46 |
| Real Estate Taxes | $1,785 | $107 |
Property Value by Mortgage Status in Andrews
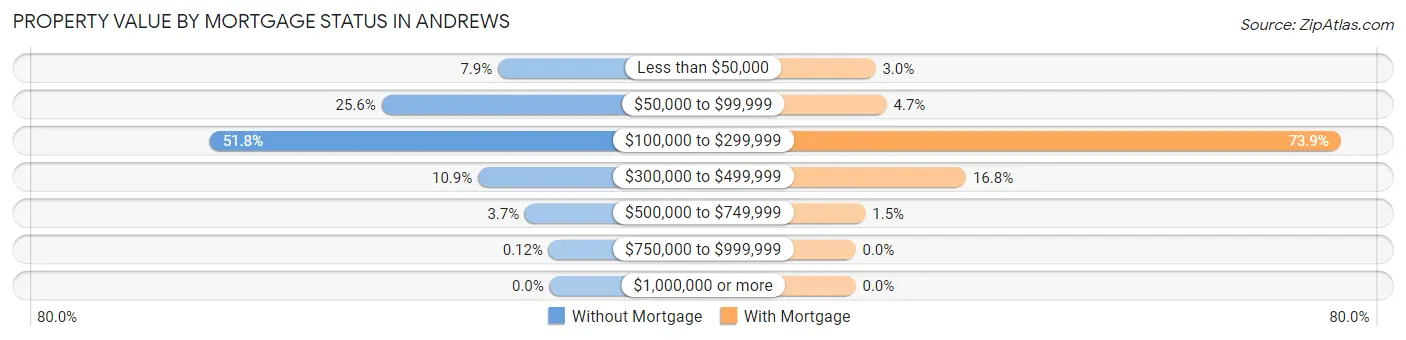
| Property Value | Without Mortgage | With Mortgage |
| Less than $50,000 | 126 (7.9%) | 57 (3.0%) |
| $50,000 to $99,999 | 411 (25.6%) | 89 (4.7%) |
| $100,000 to $299,999 | 831 (51.8%) | 1,392 (73.9%) |
| $300,000 to $499,999 | 175 (10.9%) | 317 (16.8%) |
| $500,000 to $749,999 | 60 (3.7%) | 28 (1.5%) |
| $750,000 to $999,999 | 2 (0.1%) | 0 (0.0%) |
| $1,000,000 or more | 0 (0.0%) | 0 (0.0%) |
| Total | 1,605 (100.0%) | 1,883 (100.0%) |
Household Income by Mortgage Status in Andrews
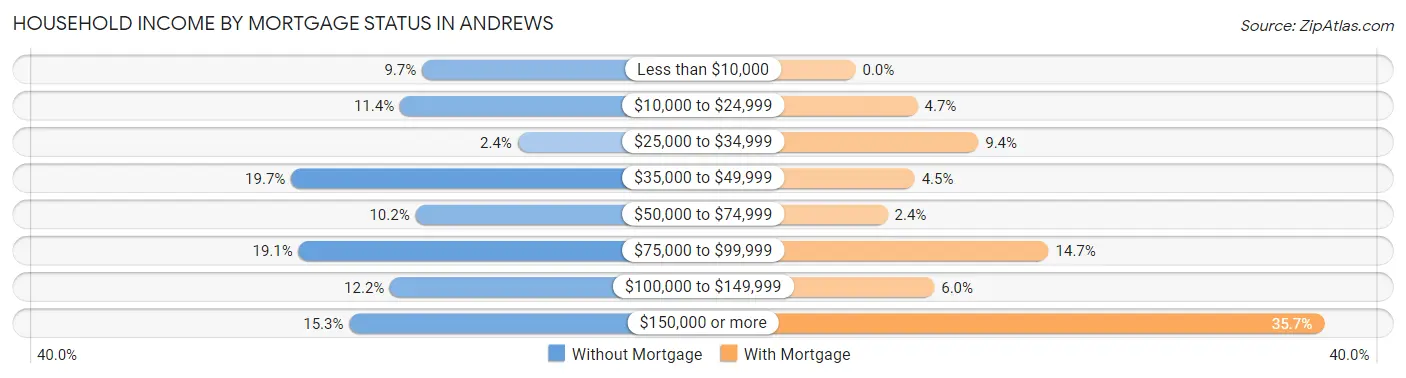
| Household Income | Without Mortgage | With Mortgage |
| Less than $10,000 | 156 (9.7%) | 0 (0.0%) |
| $10,000 to $24,999 | 183 (11.4%) | 89 (4.7%) |
| $25,000 to $34,999 | 39 (2.4%) | 176 (9.3%) |
| $35,000 to $49,999 | 316 (19.7%) | 85 (4.5%) |
| $50,000 to $74,999 | 164 (10.2%) | 46 (2.4%) |
| $75,000 to $99,999 | 307 (19.1%) | 277 (14.7%) |
| $100,000 to $149,999 | 195 (12.1%) | 113 (6.0%) |
| $150,000 or more | 245 (15.3%) | 672 (35.7%) |
| Total | 1,605 (100.0%) | 1,883 (100.0%) |
Property Value to Household Income Ratio in Andrews
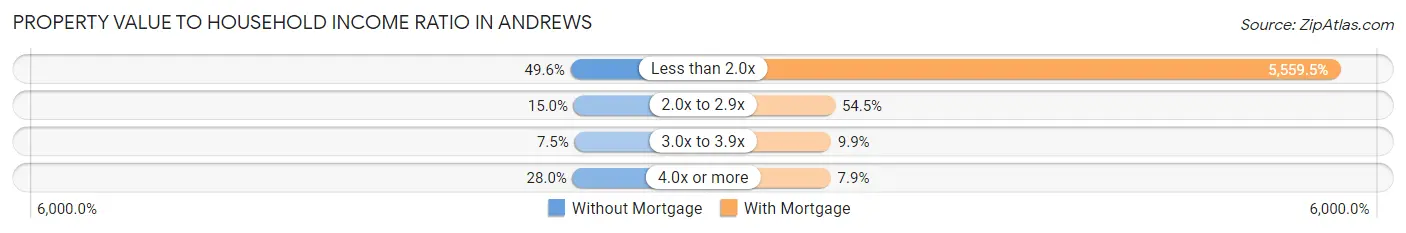
| Value-to-Income Ratio | Without Mortgage | With Mortgage |
| Less than 2.0x | 796 (49.6%) | 104,685 (5,559.5%) |
| 2.0x to 2.9x | 240 (14.9%) | 1,026 (54.5%) |
| 3.0x to 3.9x | 120 (7.5%) | 186 (9.9%) |
| 4.0x or more | 449 (28.0%) | 149 (7.9%) |
| Total | 1,605 (100.0%) | 1,883 (100.0%) |
Real Estate Taxes by Mortgage Status in Andrews
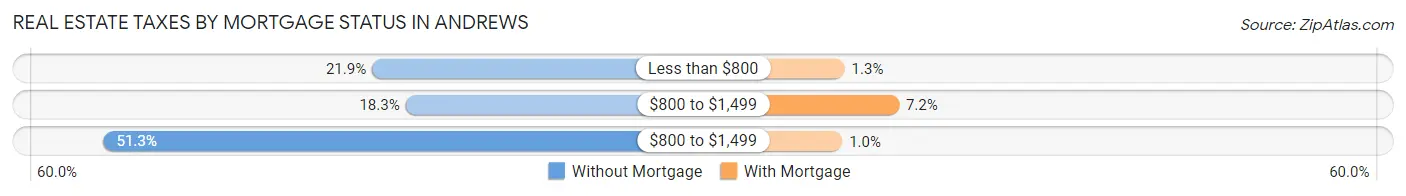
| Property Taxes | Without Mortgage | With Mortgage |
| Less than $800 | 352 (21.9%) | 24 (1.3%) |
| $800 to $1,499 | 293 (18.3%) | 136 (7.2%) |
| $800 to $1,499 | 824 (51.3%) | 19 (1.0%) |
| Total | 1,605 (100.0%) | 1,883 (100.0%) |
Health & Disability in Andrews
Health Insurance Coverage by Age in Andrews
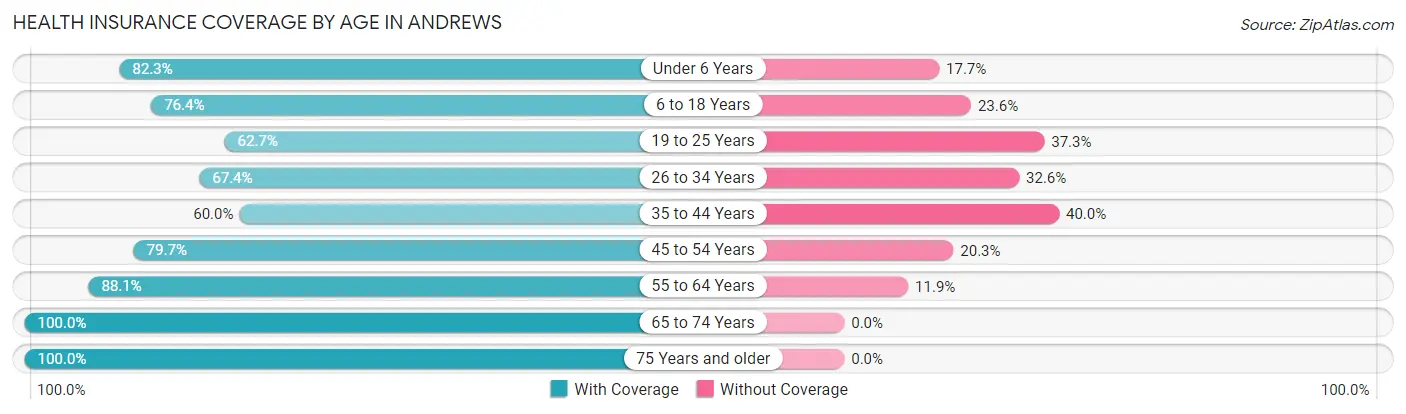
| Age Bracket | With Coverage | Without Coverage |
| Under 6 Years | 1,020 (82.3%) | 219 (17.7%) |
| 6 to 18 Years | 2,263 (76.4%) | 700 (23.6%) |
| 19 to 25 Years | 884 (62.7%) | 526 (37.3%) |
| 26 to 34 Years | 1,189 (67.4%) | 575 (32.6%) |
| 35 to 44 Years | 1,132 (60.0%) | 756 (40.0%) |
| 45 to 54 Years | 944 (79.7%) | 241 (20.3%) |
| 55 to 64 Years | 1,398 (88.1%) | 189 (11.9%) |
| 65 to 74 Years | 791 (100.0%) | 0 (0.0%) |
| 75 Years and older | 383 (100.0%) | 0 (0.0%) |
| Total | 10,004 (75.7%) | 3,206 (24.3%) |
Health Insurance Coverage by Citizenship Status in Andrews
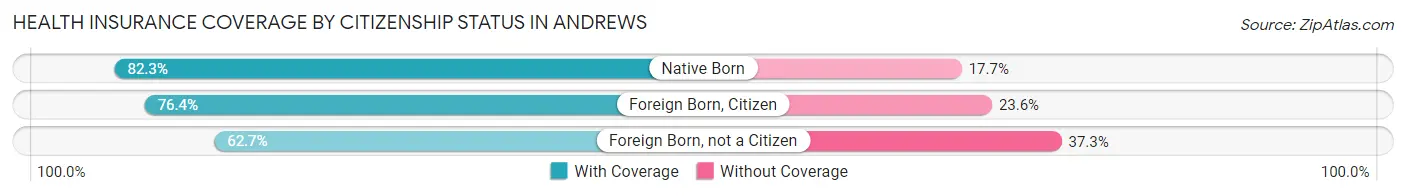
| Citizenship Status | With Coverage | Without Coverage |
| Native Born | 1,020 (82.3%) | 219 (17.7%) |
| Foreign Born, Citizen | 2,263 (76.4%) | 700 (23.6%) |
| Foreign Born, not a Citizen | 884 (62.7%) | 526 (37.3%) |
Health Insurance Coverage by Household Income in Andrews
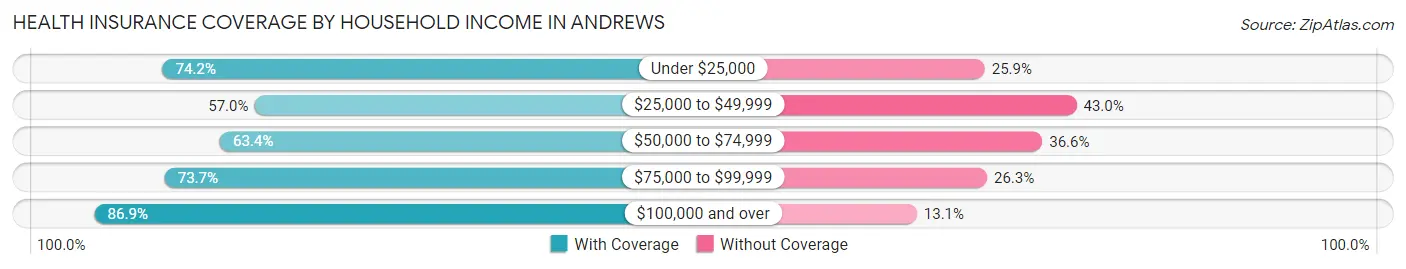
| Household Income | With Coverage | Without Coverage |
| Under $25,000 | 1,228 (74.2%) | 428 (25.9%) |
| $25,000 to $49,999 | 1,232 (57.0%) | 931 (43.0%) |
| $50,000 to $74,999 | 1,031 (63.4%) | 596 (36.6%) |
| $75,000 to $99,999 | 1,280 (73.7%) | 456 (26.3%) |
| $100,000 and over | 5,233 (86.9%) | 791 (13.1%) |
Public vs Private Health Insurance Coverage by Age in Andrews
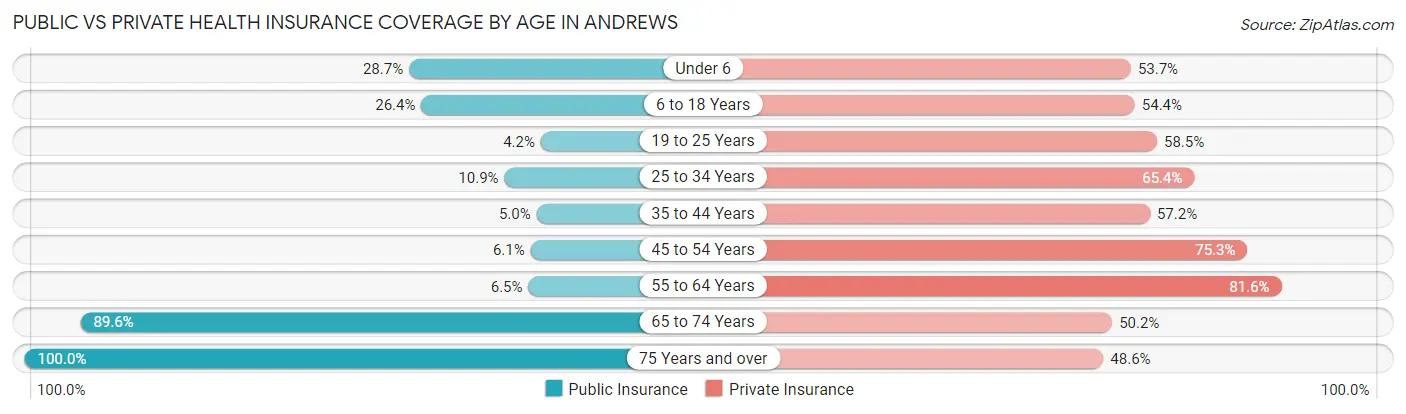
| Age Bracket | Public Insurance | Private Insurance |
| Under 6 | 355 (28.6%) | 665 (53.7%) |
| 6 to 18 Years | 781 (26.4%) | 1,612 (54.4%) |
| 19 to 25 Years | 59 (4.2%) | 825 (58.5%) |
| 25 to 34 Years | 193 (10.9%) | 1,154 (65.4%) |
| 35 to 44 Years | 94 (5.0%) | 1,080 (57.2%) |
| 45 to 54 Years | 72 (6.1%) | 892 (75.3%) |
| 55 to 64 Years | 103 (6.5%) | 1,295 (81.6%) |
| 65 to 74 Years | 709 (89.6%) | 397 (50.2%) |
| 75 Years and over | 383 (100.0%) | 186 (48.6%) |
| Total | 2,749 (20.8%) | 8,106 (61.4%) |
Disability Status by Sex by Age in Andrews
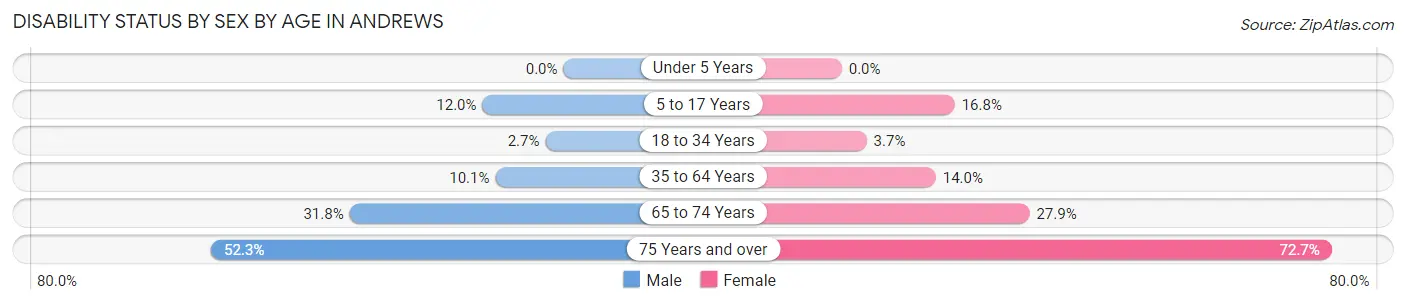
| Age Bracket | Male | Female |
| Under 5 Years | 0 (0.0%) | 0 (0.0%) |
| 5 to 17 Years | 172 (12.0%) | 253 (16.8%) |
| 18 to 34 Years | 43 (2.7%) | 63 (3.7%) |
| 35 to 64 Years | 226 (10.1%) | 338 (14.0%) |
| 65 to 74 Years | 135 (31.8%) | 102 (27.9%) |
| 75 Years and over | 68 (52.3%) | 184 (72.7%) |
Disability Class by Sex by Age in Andrews
Disability Class: Hearing Difficulty
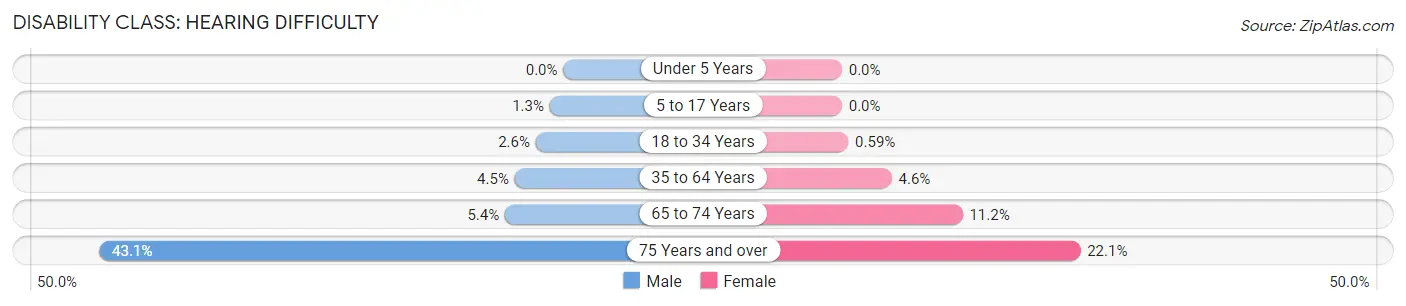
| Age Bracket | Male | Female |
| Under 5 Years | 0 (0.0%) | 0 (0.0%) |
| 5 to 17 Years | 18 (1.3%) | 0 (0.0%) |
| 18 to 34 Years | 41 (2.6%) | 10 (0.6%) |
| 35 to 64 Years | 101 (4.5%) | 112 (4.6%) |
| 65 to 74 Years | 23 (5.4%) | 41 (11.2%) |
| 75 Years and over | 56 (43.1%) | 56 (22.1%) |
Disability Class: Vision Difficulty
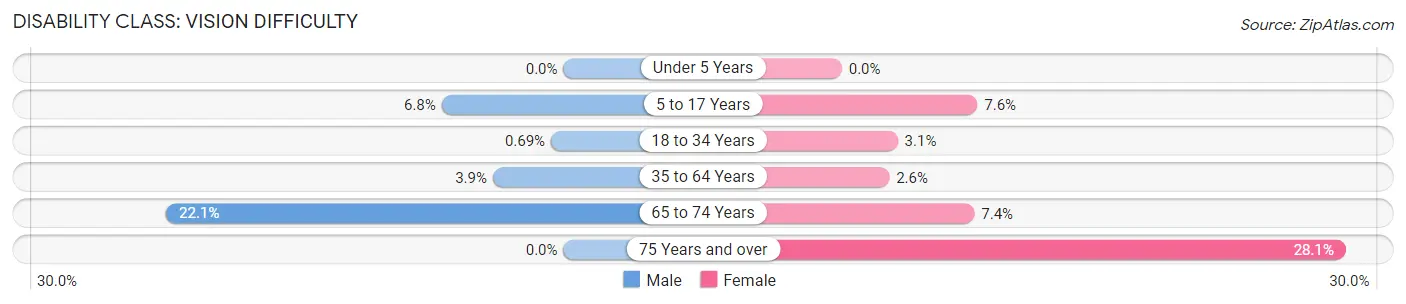
| Age Bracket | Male | Female |
| Under 5 Years | 0 (0.0%) | 0 (0.0%) |
| 5 to 17 Years | 97 (6.8%) | 114 (7.5%) |
| 18 to 34 Years | 11 (0.7%) | 53 (3.1%) |
| 35 to 64 Years | 88 (3.9%) | 64 (2.6%) |
| 65 to 74 Years | 94 (22.1%) | 27 (7.4%) |
| 75 Years and over | 0 (0.0%) | 71 (28.1%) |
Disability Class: Cognitive Difficulty
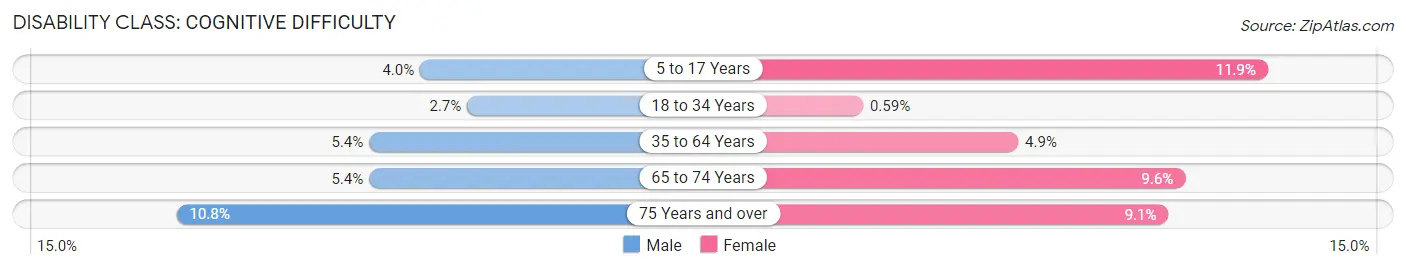
| Age Bracket | Male | Female |
| 5 to 17 Years | 57 (4.0%) | 179 (11.9%) |
| 18 to 34 Years | 43 (2.7%) | 10 (0.6%) |
| 35 to 64 Years | 121 (5.4%) | 119 (4.9%) |
| 65 to 74 Years | 23 (5.4%) | 35 (9.6%) |
| 75 Years and over | 14 (10.8%) | 23 (9.1%) |
Disability Class: Ambulatory Difficulty
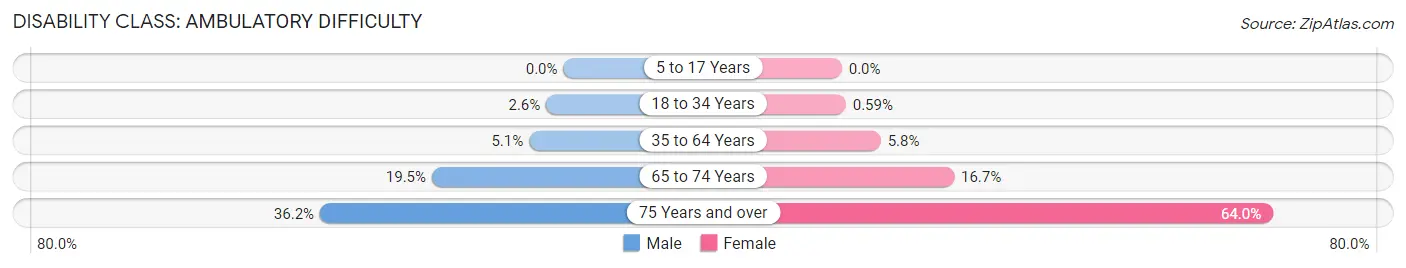
| Age Bracket | Male | Female |
| 5 to 17 Years | 0 (0.0%) | 0 (0.0%) |
| 18 to 34 Years | 41 (2.6%) | 10 (0.6%) |
| 35 to 64 Years | 114 (5.1%) | 140 (5.8%) |
| 65 to 74 Years | 83 (19.5%) | 61 (16.7%) |
| 75 Years and over | 47 (36.1%) | 162 (64.0%) |
Disability Class: Self-Care Difficulty
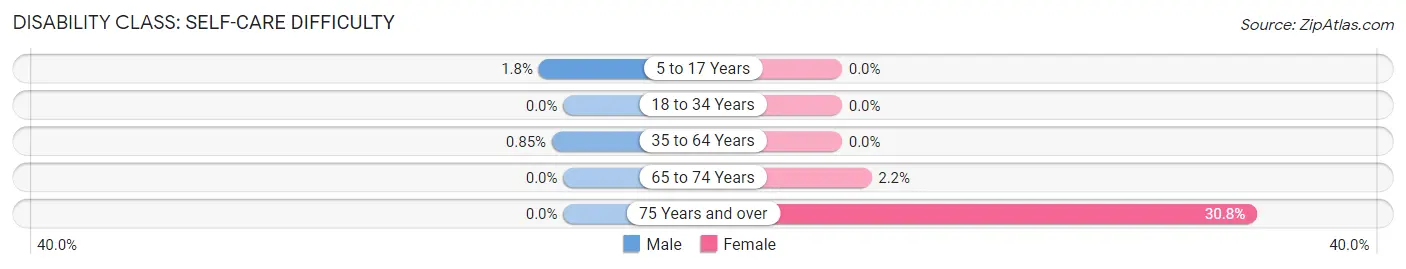
| Age Bracket | Male | Female |
| 5 to 17 Years | 26 (1.8%) | 0 (0.0%) |
| 18 to 34 Years | 0 (0.0%) | 0 (0.0%) |
| 35 to 64 Years | 19 (0.9%) | 0 (0.0%) |
| 65 to 74 Years | 0 (0.0%) | 8 (2.2%) |
| 75 Years and over | 0 (0.0%) | 78 (30.8%) |
Technology Access in Andrews
Computing Device Access in Andrews
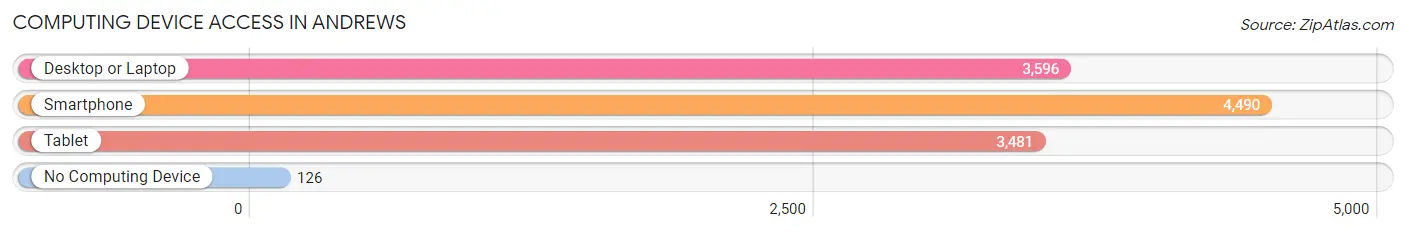
| Device Type | # Households | % Households |
| Desktop or Laptop | 3,596 | 72.0% |
| Smartphone | 4,490 | 89.9% |
| Tablet | 3,481 | 69.7% |
| No Computing Device | 126 | 2.5% |
| Total | 4,994 | 100.0% |
Internet Access in Andrews
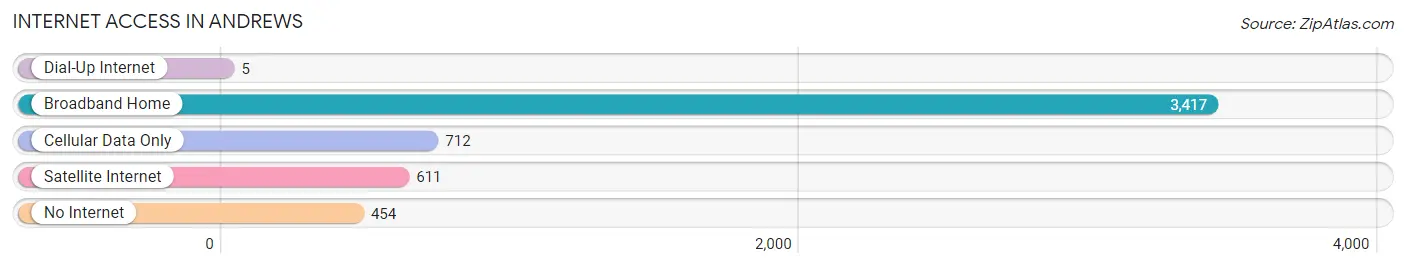
| Internet Type | # Households | % Households |
| Dial-Up Internet | 5 | 0.1% |
| Broadband Home | 3,417 | 68.4% |
| Cellular Data Only | 712 | 14.3% |
| Satellite Internet | 611 | 12.2% |
| No Internet | 454 | 9.1% |
| Total | 4,994 | 100.0% |
Andrews Summary
Andrews is a city located in Andrews County, Texas, United States. It is the county seat of Andrews County and is located in the Permian Basin region of West Texas. The population was 12,718 at the 2010 census.
History
The area around Andrews was first settled in the late 19th century. The town was named after Richard Andrews, who was the first settler in the area. The town was officially established in 1909 and was incorporated in 1910.
In the early 20th century, Andrews was a small farming community. However, the discovery of oil in the area in the 1920s led to a boom in the local economy. The town quickly grew and by the 1940s, it had become a major oil and gas center.
Geography
Andrews is located in the Permian Basin region of West Texas. It is situated at the intersection of U.S. Route 385 and State Highway 176. The city is located approximately 30 miles north of Odessa and 60 miles south of Lubbock.
The city has a total area of 8.2 square miles, all of which is land. The terrain is mostly flat with some rolling hills. The climate is semi-arid with hot summers and mild winters.
Economy
The economy of Andrews is largely based on oil and gas production. The city is home to several oil and gas companies, including Apache Corporation, Chevron Corporation, and ExxonMobil.
In addition to oil and gas, Andrews is also home to several other industries, including agriculture, manufacturing, and tourism. The city is home to several large employers, including the Andrews Independent School District, the Andrews County Hospital, and the Andrews County Courthouse.
Demographics
As of the 2010 census, there were 12,718 people, 4,717 households, and 3,521 families residing in the city. The population density was 1,547.3 people per square mile. The racial makeup of the city was 75.3% White, 0.9% African American, 0.7% Native American, 0.4% Asian, 0.1% Pacific Islander, 20.2% from other races, and 2.4% from two or more races. Hispanic or Latino of any race were 44.2% of the population.
The median income for a household in the city was $37,917, and the median income for a family was $45,917. The per capita income for the city was $18,917. About 17.2% of families and 20.7% of the population were below the poverty line, including 28.2% of those under age 18 and 11.2% of those age 65 or over.
Conclusion
Andrews is a city located in Andrews County, Texas. It is the county seat of Andrews County and is located in the Permian Basin region of West Texas. The city has a long history, dating back to the late 19th century. The discovery of oil in the area in the 1920s led to a boom in the local economy and the city quickly grew. Today, the economy of Andrews is largely based on oil and gas production, as well as agriculture, manufacturing, and tourism. The population of the city was 12,718 at the 2010 census.
Common Questions
What is Per Capita Income in Andrews?
Per Capita income in Andrews is $38,464.
What is the Median Family Income in Andrews?
Median Family Income in Andrews is $95,944.
What is the Median Household income in Andrews?
Median Household Income in Andrews is $86,806.
What is Income or Wage Gap in Andrews?
Income or Wage Gap in Andrews is 38.8%.
Women in Andrews earn 61.2 cents for every dollar earned by a man.
What is Family Income Deficit in Andrews?
Family Income Deficit in Andrews is $13,144.
Families that are below poverty line in Andrews earn $13,144 less on average than the poverty threshold level.
What is Inequality or Gini Index in Andrews?
Inequality or Gini Index in Andrews is 0.44.
What is the Total Population of Andrews?
Total Population of Andrews is 13,342.
What is the Total Male Population of Andrews?
Total Male Population of Andrews is 6,392.
What is the Total Female Population of Andrews?
Total Female Population of Andrews is 6,950.
What is the Ratio of Males per 100 Females in Andrews?
There are 91.97 Males per 100 Females in Andrews.
What is the Ratio of Females per 100 Males in Andrews?
There are 108.73 Females per 100 Males in Andrews.
What is the Median Population Age in Andrews?
Median Population Age in Andrews is 31.9 Years.
What is the Average Family Size in Andrews
Average Family Size in Andrews is 3.1 People.
What is the Average Household Size in Andrews
Average Household Size in Andrews is 2.6 People.
How Large is the Labor Force in Andrews?
There are 7,094 People in the Labor Forcein in Andrews.
What is the Percentage of People in the Labor Force in Andrews?
72.9% of People are in the Labor Force in Andrews.
What is the Unemployment Rate in Andrews?
Unemployment Rate in Andrews is 2.7%.