Alvarado, TX Map & Demographics
Alvarado Map
Alvarado Overview
$28,670
PER CAPITA INCOME
$91,031
AVG FAMILY INCOME
$86,083
AVG HOUSEHOLD INCOME
32.6%
WAGE / INCOME GAP [ % ]
67.4¢/ $1
WAGE / INCOME GAP [ $ ]
0.34
INEQUALITY / GINI INDEX
5,107
TOTAL POPULATION
2,523
MALE POPULATION
2,584
FEMALE POPULATION
97.64
MALES / 100 FEMALES
102.42
FEMALES / 100 MALES
32.0
MEDIAN AGE
3.4
AVG FAMILY SIZE
3.1
AVG HOUSEHOLD SIZE
2,396
LABOR FORCE [ PEOPLE ]
62.5%
PERCENT IN LABOR FORCE
1.3%
UNEMPLOYMENT RATE
Alvarado Zip Codes
Income in Alvarado
Income Overview in Alvarado
Per Capita Income in Alvarado is $28,670, while median incomes of families and households are $91,031 and $86,083 respectively.
| Characteristic | Number | Measure |
| Per Capita Income | 5,107 | $28,670 |
| Median Family Income | 1,371 | $91,031 |
| Mean Family Income | 1,371 | $95,223 |
| Median Household Income | 1,585 | $86,083 |
| Mean Household Income | 1,585 | $91,718 |
| Income Deficit | 1,371 | $0 |
| Wage / Income Gap (%) | 5,107 | 32.61% |
| Wage / Income Gap ($) | 5,107 | 67.39¢ per $1 |
| Gini / Inequality Index | 5,107 | 0.34 |
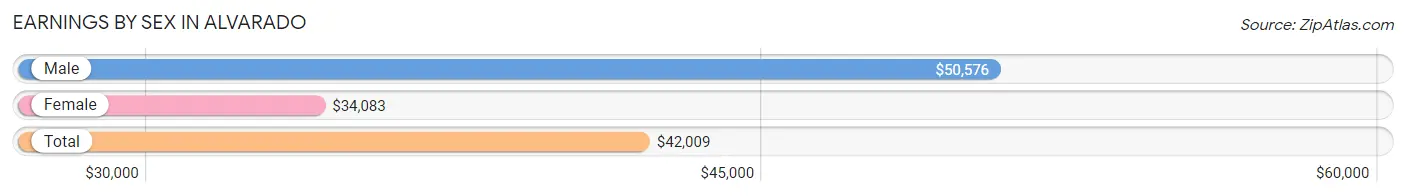
Earnings by Sex in Alvarado
Average Earnings in Alvarado are $42,009, $50,576 for men and $34,083 for women, a difference of 32.6%.
| Sex | Number | Average Earnings |
| Male | 1,582 (59.0%) | $50,576 |
| Female | 1,101 (41.0%) | $34,083 |
| Total | 2,683 (100.0%) | $42,009 |
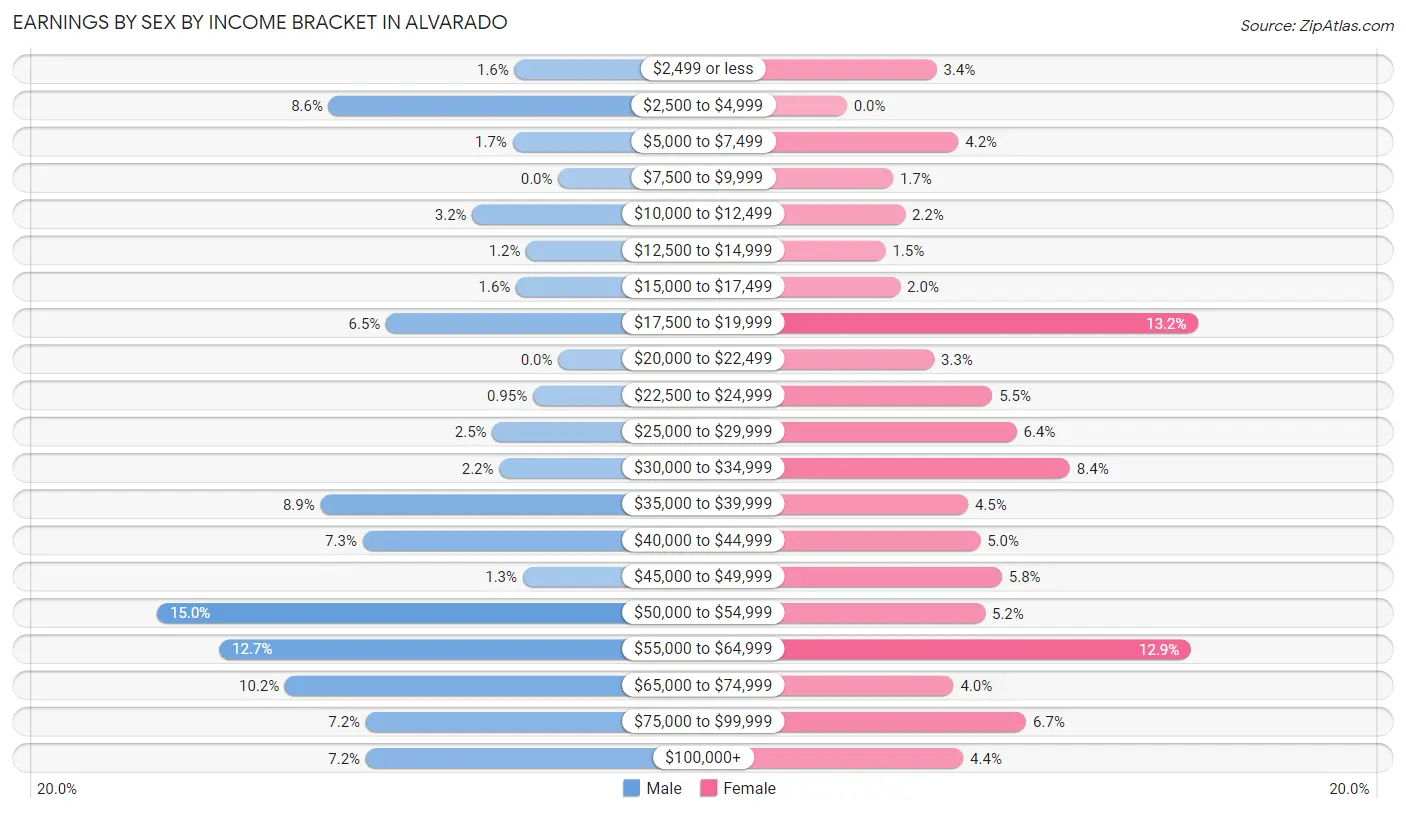
Earnings by Sex by Income Bracket in Alvarado
The most common earnings brackets in Alvarado are $50,000 to $54,999 for men (238 | 15.0%) and $17,500 to $19,999 for women (145 | 13.2%).
| Income | Male | Female |
| $2,499 or less | 26 (1.6%) | 37 (3.4%) |
| $2,500 to $4,999 | 136 (8.6%) | 0 (0.0%) |
| $5,000 to $7,499 | 27 (1.7%) | 46 (4.2%) |
| $7,500 to $9,999 | 0 (0.0%) | 19 (1.7%) |
| $10,000 to $12,499 | 51 (3.2%) | 24 (2.2%) |
| $12,500 to $14,999 | 19 (1.2%) | 16 (1.5%) |
| $15,000 to $17,499 | 25 (1.6%) | 22 (2.0%) |
| $17,500 to $19,999 | 102 (6.5%) | 145 (13.2%) |
| $20,000 to $22,499 | 0 (0.0%) | 36 (3.3%) |
| $22,500 to $24,999 | 15 (0.9%) | 60 (5.4%) |
| $25,000 to $29,999 | 39 (2.5%) | 70 (6.4%) |
| $30,000 to $34,999 | 35 (2.2%) | 92 (8.4%) |
| $35,000 to $39,999 | 141 (8.9%) | 50 (4.5%) |
| $40,000 to $44,999 | 116 (7.3%) | 55 (5.0%) |
| $45,000 to $49,999 | 21 (1.3%) | 64 (5.8%) |
| $50,000 to $54,999 | 238 (15.0%) | 57 (5.2%) |
| $55,000 to $64,999 | 201 (12.7%) | 142 (12.9%) |
| $65,000 to $74,999 | 162 (10.2%) | 44 (4.0%) |
| $75,000 to $99,999 | 114 (7.2%) | 74 (6.7%) |
| $100,000+ | 114 (7.2%) | 48 (4.4%) |
| Total | 1,582 (100.0%) | 1,101 (100.0%) |
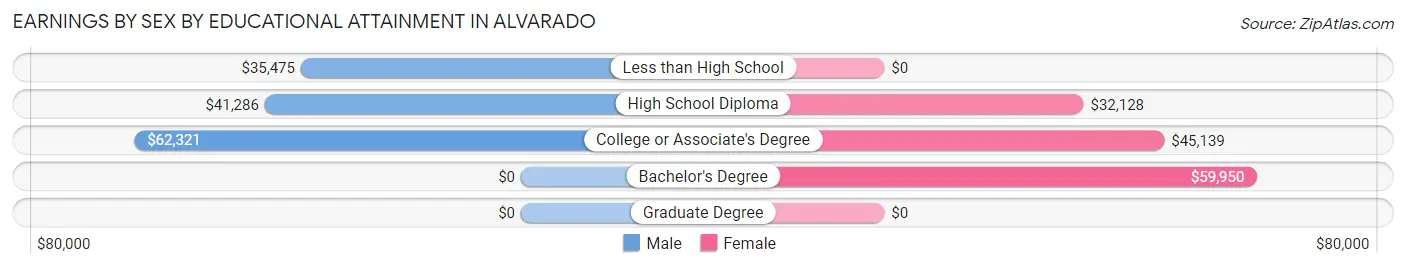
Earnings by Sex by Educational Attainment in Alvarado
Average earnings in Alvarado are $51,008 for men and $45,833 for women, a difference of 10.2%. Men with an educational attainment of college or associate's degree enjoy the highest average annual earnings of $62,321, while those with less than high school education earn the least with $35,475. Women with an educational attainment of bachelor's degree earn the most with the average annual earnings of $59,950, while those with high school diploma education have the smallest earnings of $32,128.
| Educational Attainment | Male Income | Female Income |
| Less than High School | $35,475 | $0 |
| High School Diploma | $41,286 | $32,128 |
| College or Associate's Degree | $62,321 | $45,139 |
| Bachelor's Degree | - | - |
| Graduate Degree | - | - |
| Total | $51,008 | $45,833 |
Family Income in Alvarado
Family Income Brackets in Alvarado
According to the Alvarado family income data, there are 521 families falling into the $100,000 to $149,999 income range, which is the most common income bracket and makes up 38.0% of all families.
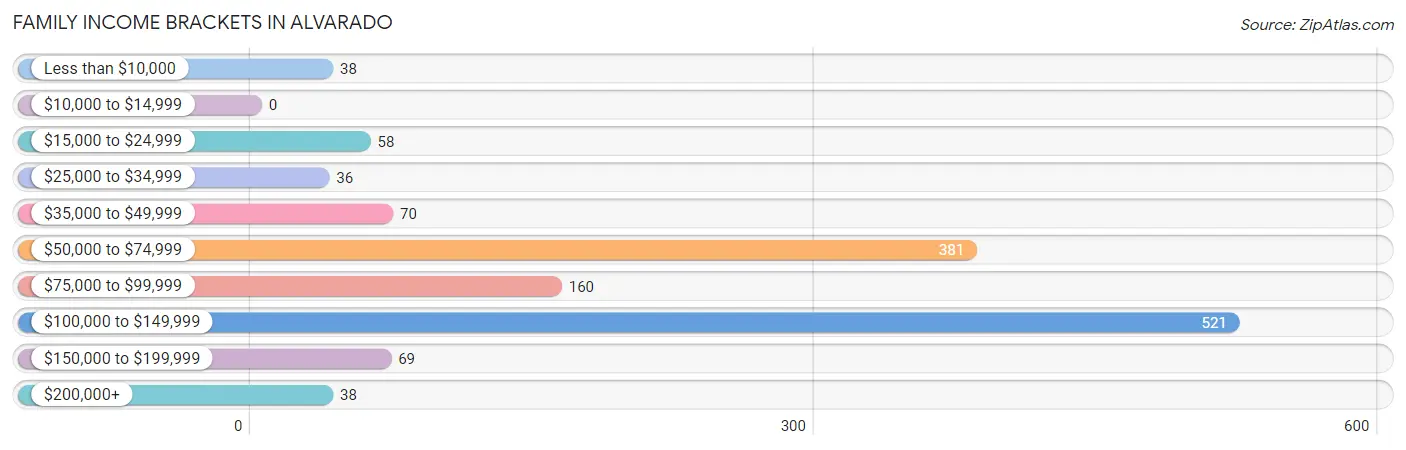
| Income Bracket | # Families | % Families |
| Less than $10,000 | 38 | 2.8% |
| $10,000 to $14,999 | 0 | 0.0% |
| $15,000 to $24,999 | 58 | 4.2% |
| $25,000 to $34,999 | 36 | 2.6% |
| $35,000 to $49,999 | 70 | 5.1% |
| $50,000 to $74,999 | 381 | 27.8% |
| $75,000 to $99,999 | 160 | 11.7% |
| $100,000 to $149,999 | 521 | 38.0% |
| $150,000 to $199,999 | 69 | 5.0% |
| $200,000+ | 38 | 2.8% |
Family Income by Famaliy Size in Alvarado
5-person families (104 | 7.6%) account for the highest median family income in Alvarado with $128,194 per family, while 2-person families (395 | 28.8%) have the highest median income of $34,534 per family member.
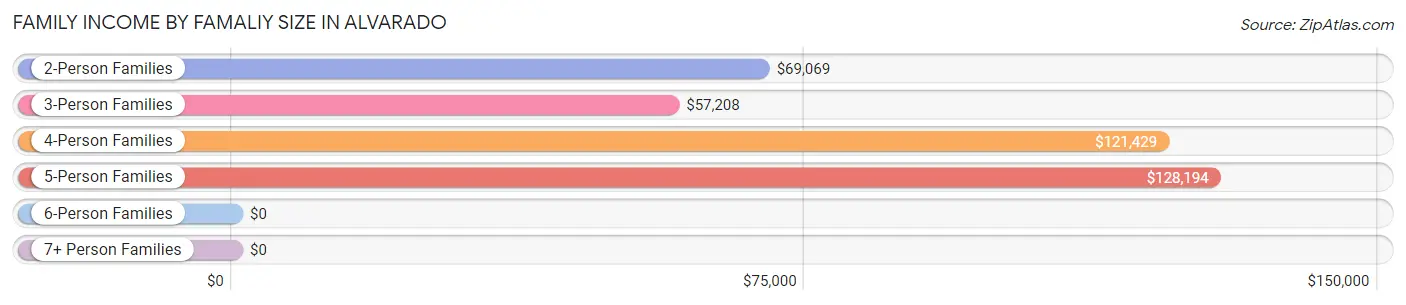
| Income Bracket | # Families | Median Income |
| 2-Person Families | 395 (28.8%) | $69,069 |
| 3-Person Families | 515 (37.6%) | $57,208 |
| 4-Person Families | 224 (16.3%) | $121,429 |
| 5-Person Families | 104 (7.6%) | $128,194 |
| 6-Person Families | 47 (3.4%) | $0 |
| 7+ Person Families | 86 (6.3%) | $0 |
| Total | 1,371 (100.0%) | $91,031 |
Family Income by Number of Earners in Alvarado
The median family income in Alvarado is $91,031, with families comprising 2 earners (700) having the highest median family income of $119,206, while families with no earners (70) have the lowest median family income of $2,499, accounting for 51.1% and 5.1% of families, respectively.
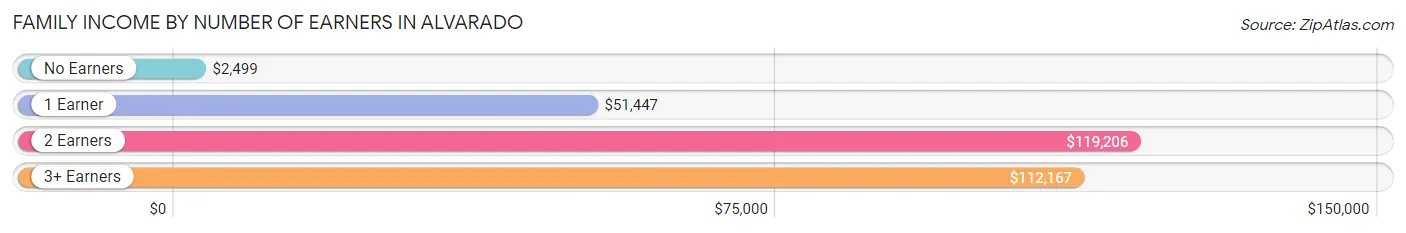
| Number of Earners | # Families | Median Income |
| No Earners | 70 (5.1%) | $2,499 |
| 1 Earner | 387 (28.2%) | $51,447 |
| 2 Earners | 700 (51.1%) | $119,206 |
| 3+ Earners | 214 (15.6%) | $112,167 |
| Total | 1,371 (100.0%) | $91,031 |
Household Income in Alvarado
Household Income Brackets in Alvarado
With 540 households falling in the category, the $100,000 to $149,999 income range is the most frequent in Alvarado, accounting for 34.1% of all households. In contrast, only 19 households (1.2%) fall into the $10,000 to $14,999 income bracket, making it the least populous group.
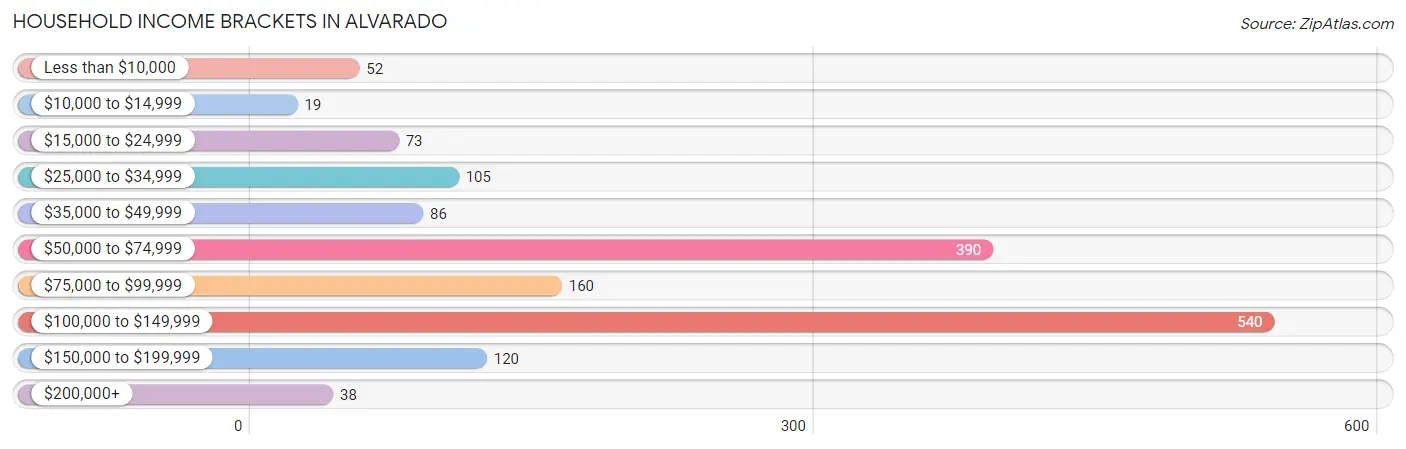
| Income Bracket | # Households | % Households |
| Less than $10,000 | 52 | 3.3% |
| $10,000 to $14,999 | 19 | 1.2% |
| $15,000 to $24,999 | 73 | 4.6% |
| $25,000 to $34,999 | 105 | 6.6% |
| $35,000 to $49,999 | 86 | 5.4% |
| $50,000 to $74,999 | 390 | 24.6% |
| $75,000 to $99,999 | 160 | 10.1% |
| $100,000 to $149,999 | 540 | 34.1% |
| $150,000 to $199,999 | 120 | 7.6% |
| $200,000+ | 38 | 2.4% |
Household Income by Householder Age in Alvarado
The median household income in Alvarado is $86,083, with the highest median household income of $118,829 found in the 25 to 44 years age bracket for the primary householder. A total of 557 households (35.1%) fall into this category. Meanwhile, the 65+ years age bracket for the primary householder has the lowest median household income of $53,212, with 335 households (21.1%) in this group.
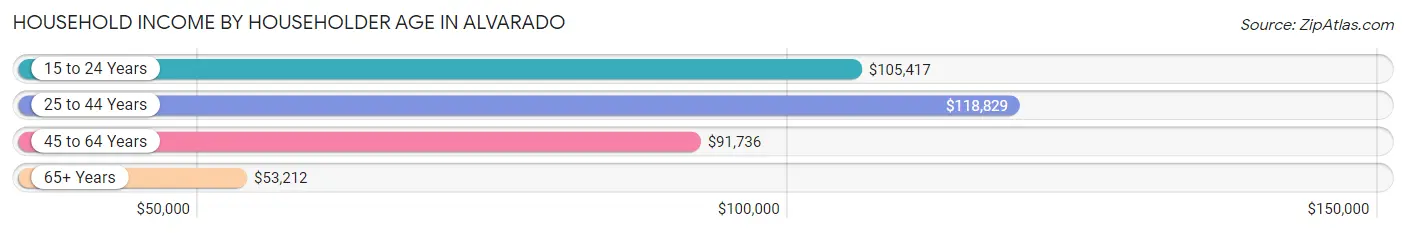
| Income Bracket | # Households | Median Income |
| 15 to 24 Years | 65 (4.1%) | $105,417 |
| 25 to 44 Years | 557 (35.1%) | $118,829 |
| 45 to 64 Years | 628 (39.6%) | $91,736 |
| 65+ Years | 335 (21.1%) | $53,212 |
| Total | 1,585 (100.0%) | $86,083 |
Poverty in Alvarado
Income Below Poverty by Sex and Age in Alvarado
With 5.1% poverty level for males and 10.7% for females among the residents of Alvarado, under 5 year old males and 75 year old and over females are the most vulnerable to poverty, with 13 males (16.7%) and 25 females (23.4%) in their respective age groups living below the poverty level.
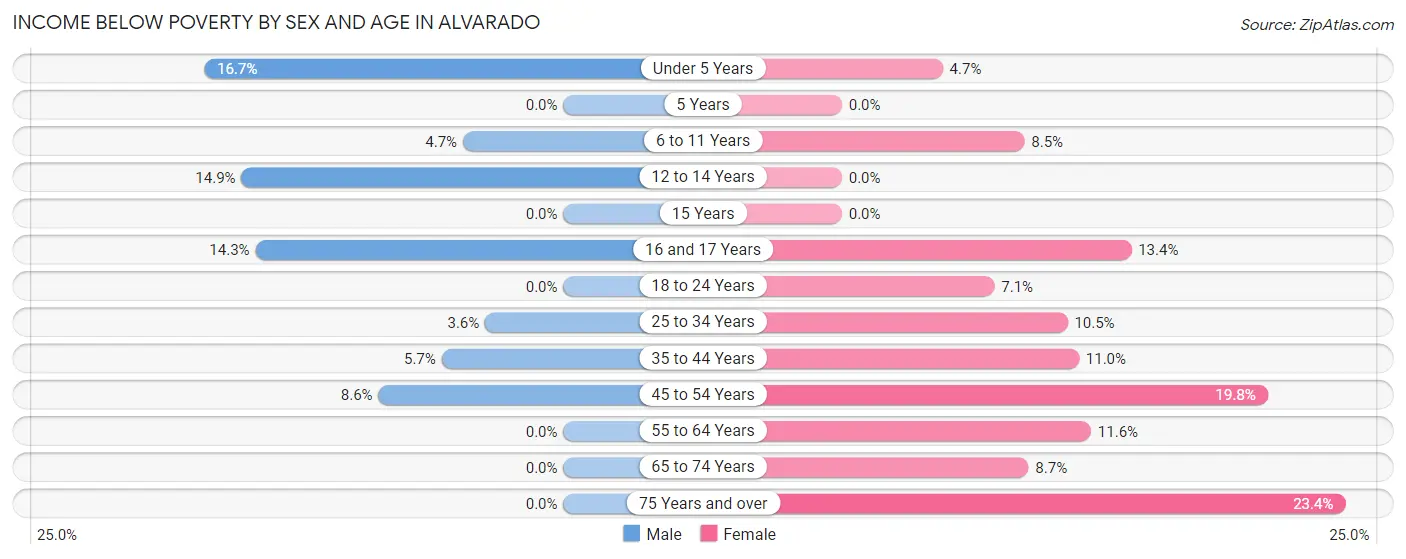
| Age Bracket | Male | Female |
| Under 5 Years | 13 (16.7%) | 14 (4.7%) |
| 5 Years | 0 (0.0%) | 0 (0.0%) |
| 6 to 11 Years | 15 (4.7%) | 16 (8.5%) |
| 12 to 14 Years | 13 (14.9%) | 0 (0.0%) |
| 15 Years | 0 (0.0%) | 0 (0.0%) |
| 16 and 17 Years | 10 (14.3%) | 18 (13.4%) |
| 18 to 24 Years | 0 (0.0%) | 23 (7.1%) |
| 25 to 34 Years | 15 (3.6%) | 49 (10.5%) |
| 35 to 44 Years | 10 (5.7%) | 22 (11.0%) |
| 45 to 54 Years | 47 (8.6%) | 67 (19.8%) |
| 55 to 64 Years | 0 (0.0%) | 23 (11.6%) |
| 65 to 74 Years | 0 (0.0%) | 11 (8.7%) |
| 75 Years and over | 0 (0.0%) | 25 (23.4%) |
| Total | 123 (5.1%) | 268 (10.7%) |
Income Above Poverty by Sex and Age in Alvarado
According to the poverty statistics in Alvarado, males aged 5 years and females aged 5 years are the age groups that are most secure financially, with 100.0% of males and 100.0% of females in these age groups living above the poverty line.
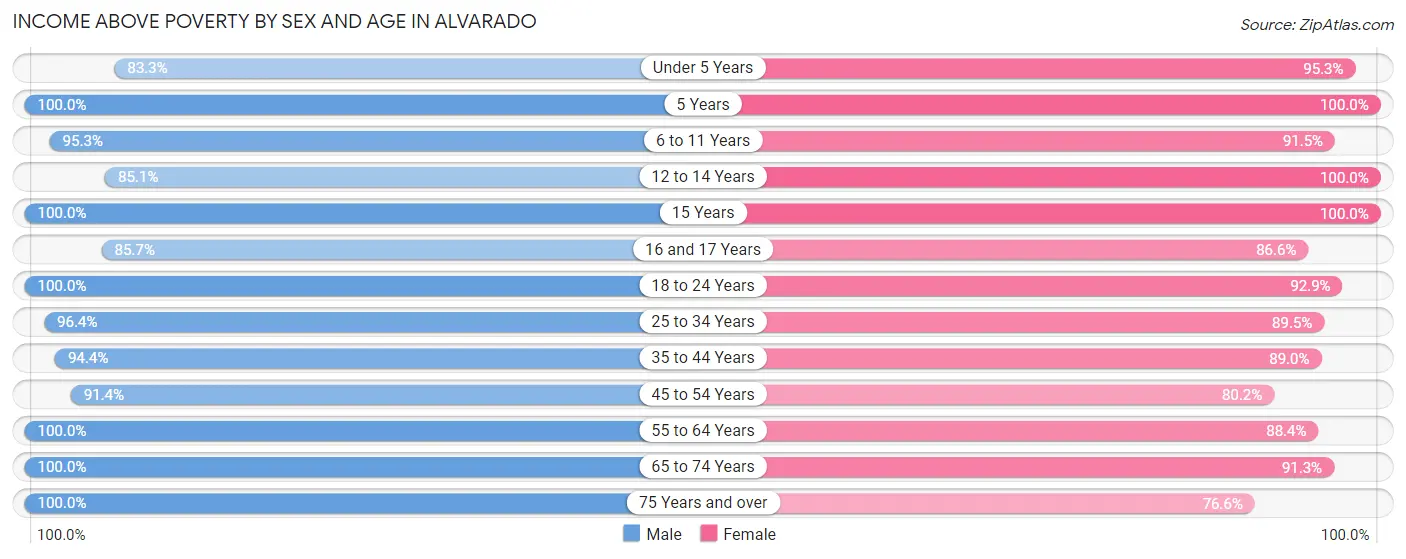
| Age Bracket | Male | Female |
| Under 5 Years | 65 (83.3%) | 285 (95.3%) |
| 5 Years | 40 (100.0%) | 79 (100.0%) |
| 6 to 11 Years | 307 (95.3%) | 173 (91.5%) |
| 12 to 14 Years | 74 (85.1%) | 27 (100.0%) |
| 15 Years | 52 (100.0%) | 17 (100.0%) |
| 16 and 17 Years | 60 (85.7%) | 116 (86.6%) |
| 18 to 24 Years | 136 (100.0%) | 302 (92.9%) |
| 25 to 34 Years | 398 (96.4%) | 419 (89.5%) |
| 35 to 44 Years | 167 (94.4%) | 178 (89.0%) |
| 45 to 54 Years | 501 (91.4%) | 272 (80.2%) |
| 55 to 64 Years | 92 (100.0%) | 176 (88.4%) |
| 65 to 74 Years | 358 (100.0%) | 116 (91.3%) |
| 75 Years and over | 33 (100.0%) | 82 (76.6%) |
| Total | 2,283 (94.9%) | 2,242 (89.3%) |
Income Below Poverty Among Married-Couple Families in Alvarado
The poverty statistics for married-couple families in Alvarado show that 6.3% or 60 of the total 951 families live below the poverty line. Families with no children have the highest poverty rate of 9.8%, comprising of 38 families. On the other hand, families with 1 or 2 children have the lowest poverty rate of 2.8%, which includes 13 families.
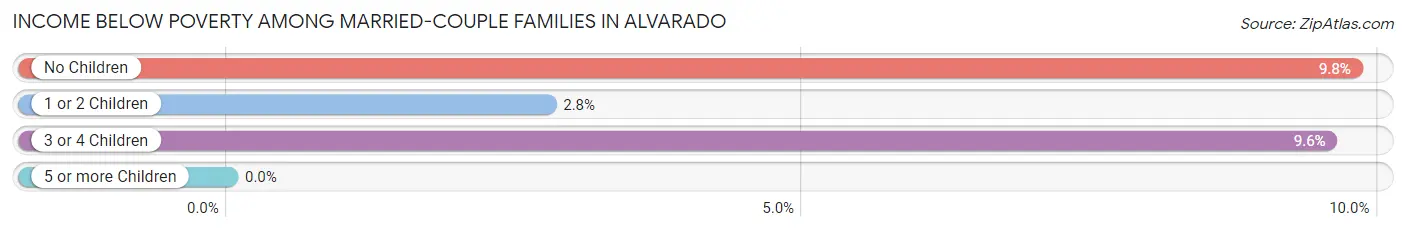
| Children | Above Poverty | Below Poverty |
| No Children | 350 (90.2%) | 38 (9.8%) |
| 1 or 2 Children | 456 (97.2%) | 13 (2.8%) |
| 3 or 4 Children | 85 (90.4%) | 9 (9.6%) |
| 5 or more Children | 0 (0.0%) | 0 (0.0%) |
| Total | 891 (93.7%) | 60 (6.3%) |
Income Below Poverty Among Single-Parent Households in Alvarado
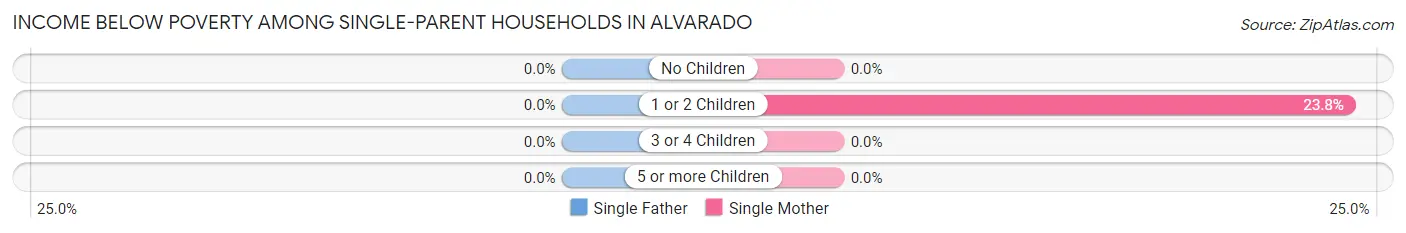
| Children | Single Father | Single Mother |
| No Children | 0 (0.0%) | 0 (0.0%) |
| 1 or 2 Children | 0 (0.0%) | 36 (23.8%) |
| 3 or 4 Children | 0 (0.0%) | 0 (0.0%) |
| 5 or more Children | 0 (0.0%) | 0 (0.0%) |
| Total | 0 (0.0%) | 36 (13.8%) |
Income Below Poverty Among Married-Couple vs Single-Parent Households in Alvarado
The poverty data for Alvarado shows that 60 of the married-couple family households (6.3%) and 36 of the single-parent households (8.6%) are living below the poverty level. Within the married-couple family households, those with no children have the highest poverty rate, with 38 households (9.8%) falling below the poverty line. Among the single-parent households, those with 1 or 2 children have the highest poverty rate, with 36 household (16.9%) living below poverty.
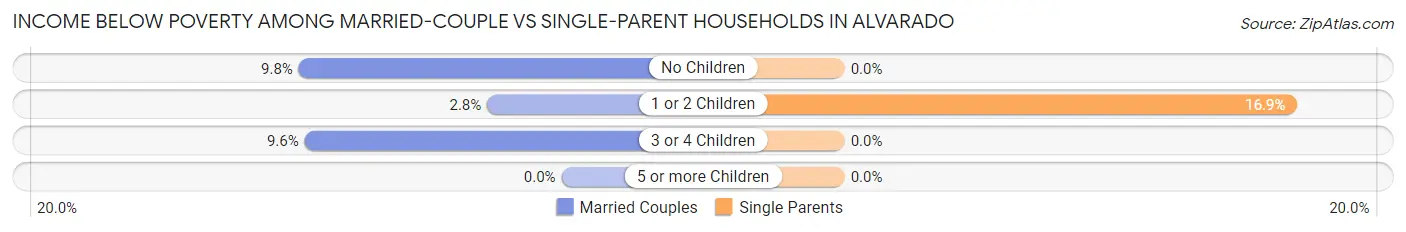
| Children | Married-Couple Families | Single-Parent Households |
| No Children | 38 (9.8%) | 0 (0.0%) |
| 1 or 2 Children | 13 (2.8%) | 36 (16.9%) |
| 3 or 4 Children | 9 (9.6%) | 0 (0.0%) |
| 5 or more Children | 0 (0.0%) | 0 (0.0%) |
| Total | 60 (6.3%) | 36 (8.6%) |
Race in Alvarado
The most populous races in Alvarado are White / Caucasian (3,736 | 73.2%), Hispanic or Latino (1,737 | 34.0%), and Black / African American (640 | 12.5%).
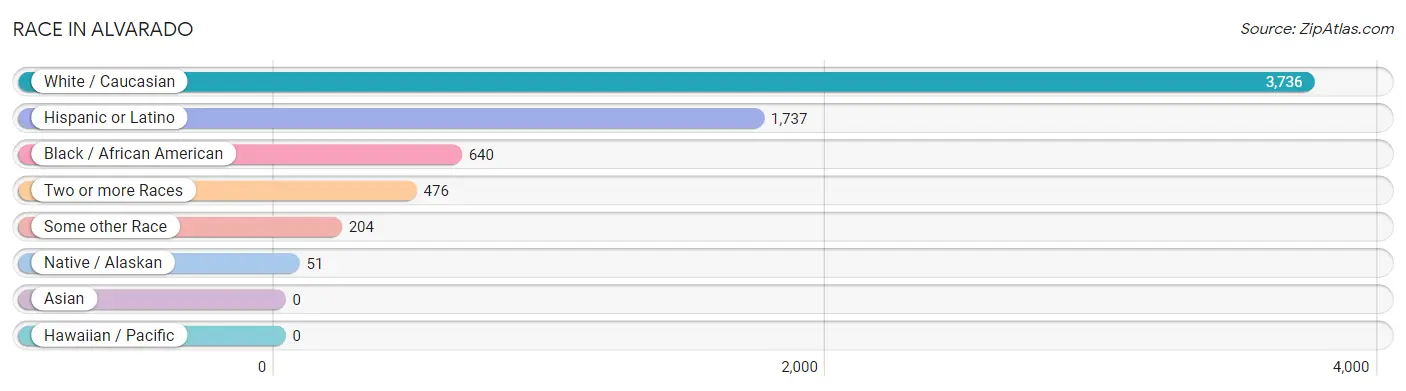
| Race | # Population | % Population |
| Asian | 0 | 0.0% |
| Black / African American | 640 | 12.5% |
| Hawaiian / Pacific | 0 | 0.0% |
| Hispanic or Latino | 1,737 | 34.0% |
| Native / Alaskan | 51 | 1.0% |
| White / Caucasian | 3,736 | 73.2% |
| Two or more Races | 476 | 9.3% |
| Some other Race | 204 | 4.0% |
| Total | 5,107 | 100.0% |
Ancestry in Alvarado
The most populous ancestries reported in Alvarado are Mexican (1,639 | 32.1%), American (1,250 | 24.5%), German (234 | 4.6%), Irish (151 | 3.0%), and Central American (95 | 1.9%), together accounting for 66.0% of all Alvarado residents.
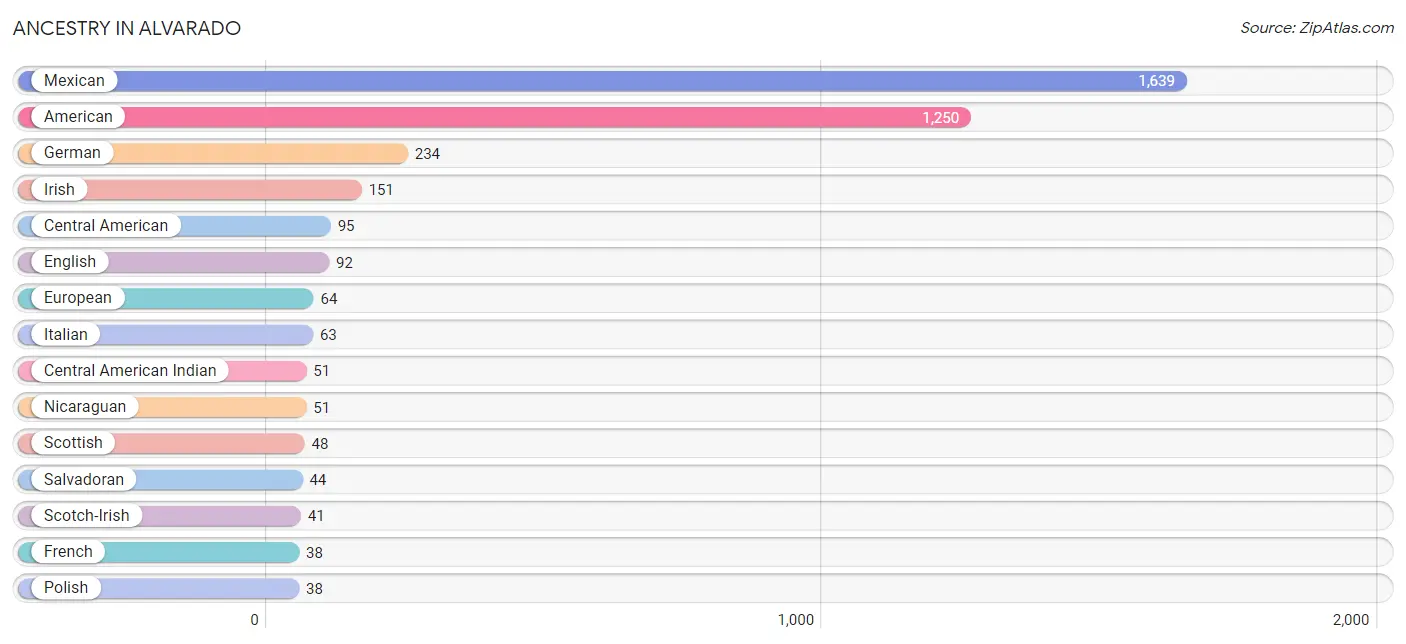
| Ancestry | # Population | % Population |
| American | 1,250 | 24.5% |
| Bhutanese | 11 | 0.2% |
| British | 17 | 0.3% |
| Central American | 95 | 1.9% |
| Central American Indian | 51 | 1.0% |
| Cherokee | 15 | 0.3% |
| Choctaw | 8 | 0.2% |
| Czech | 9 | 0.2% |
| Dutch West Indian | 4 | 0.1% |
| English | 92 | 1.8% |
| European | 64 | 1.3% |
| French | 38 | 0.7% |
| German | 234 | 4.6% |
| Irish | 151 | 3.0% |
| Italian | 63 | 1.2% |
| Mexican | 1,639 | 32.1% |
| Nicaraguan | 51 | 1.0% |
| Northern European | 9 | 0.2% |
| Polish | 38 | 0.7% |
| Portuguese | 6 | 0.1% |
| Salvadoran | 44 | 0.9% |
| Scotch-Irish | 41 | 0.8% |
| Scottish | 48 | 0.9% |
| Subsaharan African | 34 | 0.7% | View All 24 Rows |
Immigrants in Alvarado
The most numerous immigrant groups reported in Alvarado came from Central America (320 | 6.3%), Latin America (320 | 6.3%), Mexico (320 | 6.3%), Africa (42 | 0.8%), and Nigeria (42 | 0.8%), together accounting for 20.5% of all Alvarado residents.
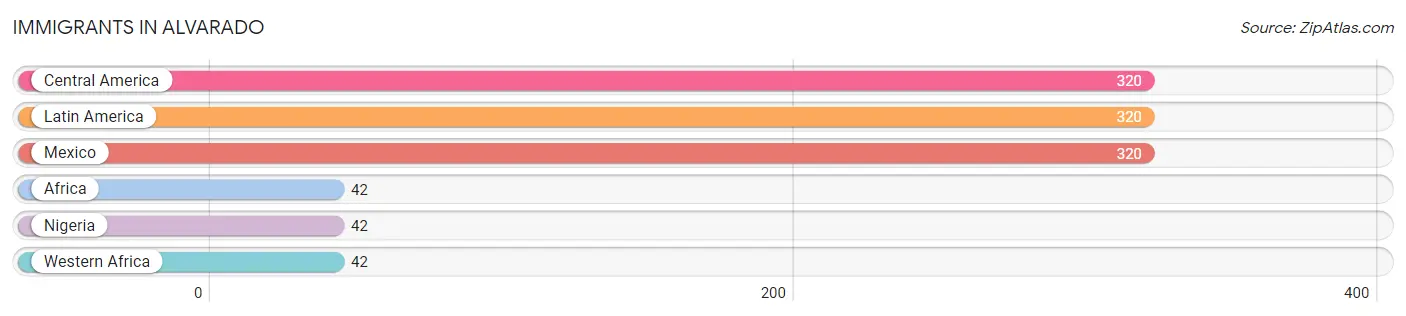
| Immigration Origin | # Population | % Population |
| Africa | 42 | 0.8% |
| Central America | 320 | 6.3% |
| Latin America | 320 | 6.3% |
| Mexico | 320 | 6.3% |
| Nigeria | 42 | 0.8% |
| Western Africa | 42 | 0.8% | View All 6 Rows |
Sex and Age in Alvarado
Sex and Age in Alvarado
The most populous age groups in Alvarado are 45 to 49 Years (370 | 14.7%) for men and Under 5 Years (304 | 11.8%) for women.
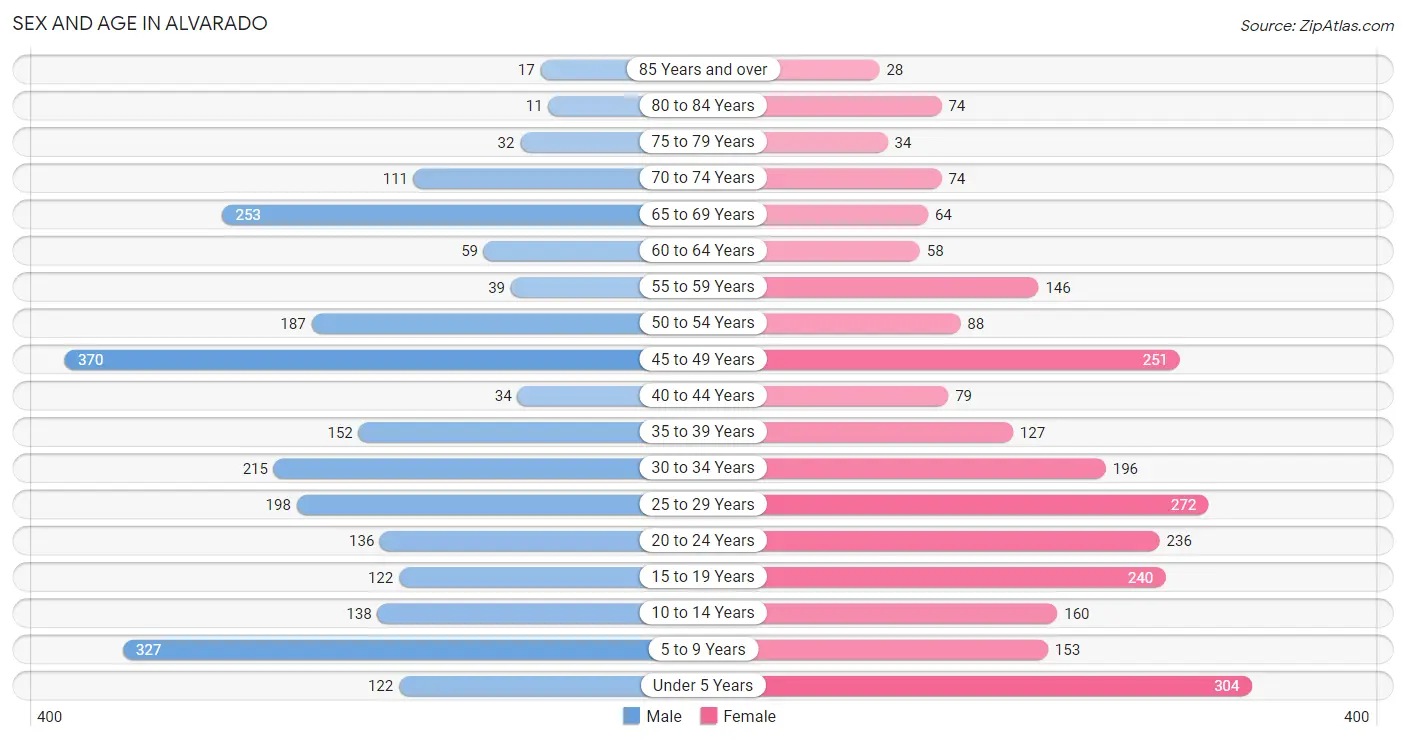
| Age Bracket | Male | Female |
| Under 5 Years | 122 (4.8%) | 304 (11.8%) |
| 5 to 9 Years | 327 (13.0%) | 153 (5.9%) |
| 10 to 14 Years | 138 (5.5%) | 160 (6.2%) |
| 15 to 19 Years | 122 (4.8%) | 240 (9.3%) |
| 20 to 24 Years | 136 (5.4%) | 236 (9.1%) |
| 25 to 29 Years | 198 (7.9%) | 272 (10.5%) |
| 30 to 34 Years | 215 (8.5%) | 196 (7.6%) |
| 35 to 39 Years | 152 (6.0%) | 127 (4.9%) |
| 40 to 44 Years | 34 (1.3%) | 79 (3.1%) |
| 45 to 49 Years | 370 (14.7%) | 251 (9.7%) |
| 50 to 54 Years | 187 (7.4%) | 88 (3.4%) |
| 55 to 59 Years | 39 (1.5%) | 146 (5.7%) |
| 60 to 64 Years | 59 (2.3%) | 58 (2.2%) |
| 65 to 69 Years | 253 (10.0%) | 64 (2.5%) |
| 70 to 74 Years | 111 (4.4%) | 74 (2.9%) |
| 75 to 79 Years | 32 (1.3%) | 34 (1.3%) |
| 80 to 84 Years | 11 (0.4%) | 74 (2.9%) |
| 85 Years and over | 17 (0.7%) | 28 (1.1%) |
| Total | 2,523 (100.0%) | 2,584 (100.0%) |
Families and Households in Alvarado
Median Family Size in Alvarado
The median family size in Alvarado is 3.37 persons per family, with married-couple families (951 | 69.4%) accounting for the largest median family size of 3.51 persons per family. On the other hand, single male/father families (159 | 11.6%) represent the smallest median family size with 2.78 persons per family.
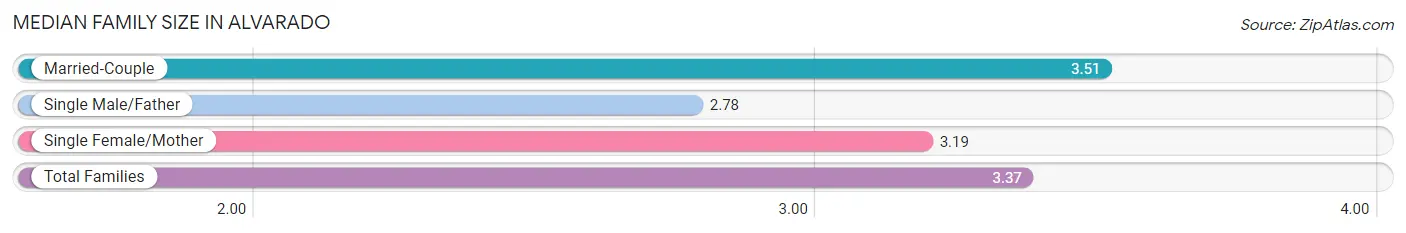
| Family Type | # Families | Family Size |
| Married-Couple | 951 (69.4%) | 3.51 |
| Single Male/Father | 159 (11.6%) | 2.78 |
| Single Female/Mother | 261 (19.0%) | 3.19 |
| Total Families | 1,371 (100.0%) | 3.37 |
Median Household Size in Alvarado
The median household size in Alvarado is 3.15 persons per household, with married-couple households (951 | 60.0%) accounting for the largest median household size of 3.62 persons per household. non-family households (214 | 13.5%) represent the smallest median household size with 1.23 persons per household.
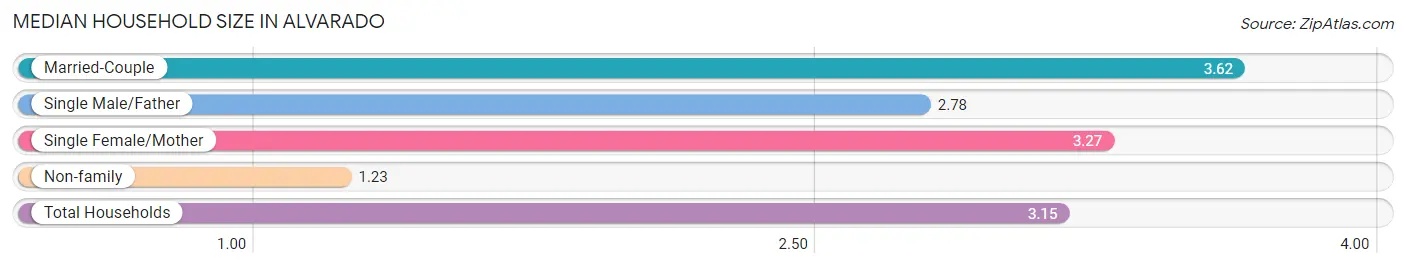
| Household Type | # Households | Household Size |
| Married-Couple | 951 (60.0%) | 3.62 |
| Single Male/Father | 159 (10.0%) | 2.78 |
| Single Female/Mother | 261 (16.5%) | 3.27 |
| Non-family | 214 (13.5%) | 1.23 |
| Total Households | 1,585 (100.0%) | 3.15 |
Household Size by Marriage Status in Alvarado
Out of a total of 1,585 households in Alvarado, 1,371 (86.5%) are family households, while 214 (13.5%) are nonfamily households. The most numerous type of family households are 3-person households, comprising 478, and the most common type of nonfamily households are 1-person households, comprising 181.
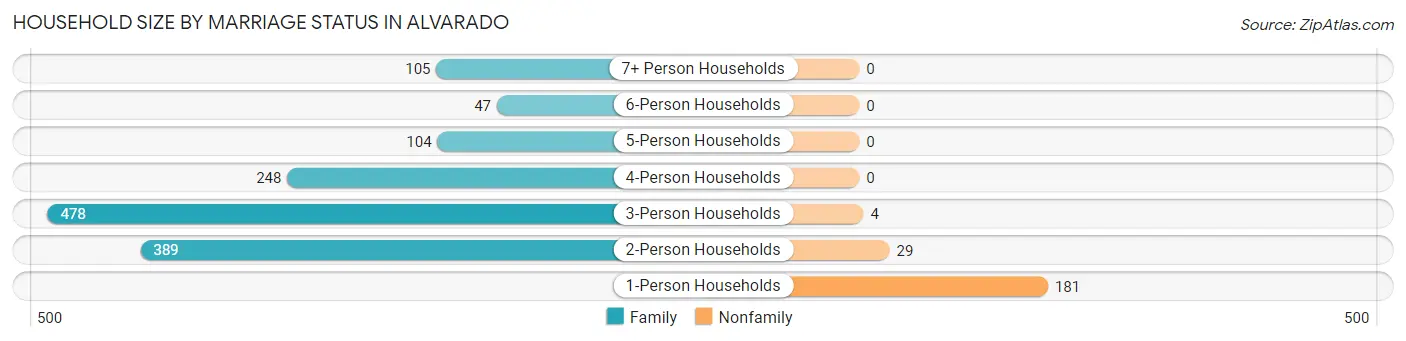
| Household Size | Family Households | Nonfamily Households |
| 1-Person Households | - | 181 (11.4%) |
| 2-Person Households | 389 (24.5%) | 29 (1.8%) |
| 3-Person Households | 478 (30.2%) | 4 (0.3%) |
| 4-Person Households | 248 (15.7%) | 0 (0.0%) |
| 5-Person Households | 104 (6.6%) | 0 (0.0%) |
| 6-Person Households | 47 (3.0%) | 0 (0.0%) |
| 7+ Person Households | 105 (6.6%) | 0 (0.0%) |
| Total | 1,371 (86.5%) | 214 (13.5%) |
Female Fertility in Alvarado
Fertility by Age in Alvarado
Average fertility rate in Alvarado is 104.0 births per 1,000 women. Women in the age bracket of 20 to 34 years have the highest fertility rate with 189.0 births per 1,000 women. Women in the age bracket of 20 to 34 years acount for 89.3% of all women with births.
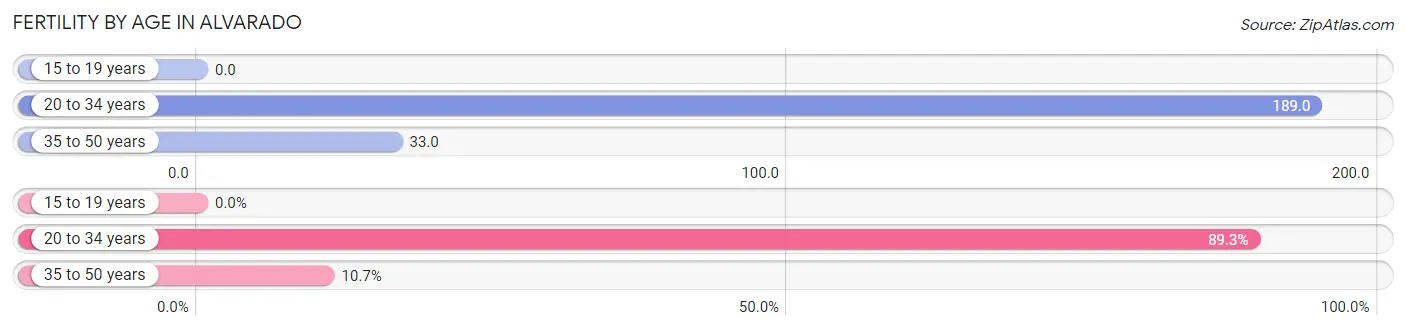
| Age Bracket | Women with Births | Births / 1,000 Women |
| 15 to 19 years | 0 (0.0%) | 0.0 |
| 20 to 34 years | 133 (89.3%) | 189.0 |
| 35 to 50 years | 16 (10.7%) | 33.0 |
| Total | 149 (100.0%) | 104.0 |
Fertility by Age by Marriage Status in Alvarado
89.9% of women with births (149) in Alvarado are married. The highest percentage of unmarried women with births falls into 20 to 34 years age bracket with 11.3% of them unmarried at the time of birth, while the lowest percentage of unmarried women with births belong to 35 to 50 years age bracket with 0.0% of them unmarried.
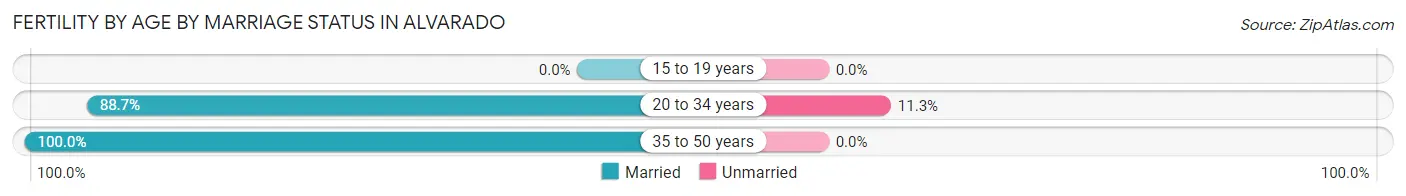
| Age Bracket | Married | Unmarried |
| 15 to 19 years | 0 (0.0%) | 0 (0.0%) |
| 20 to 34 years | 118 (88.7%) | 15 (11.3%) |
| 35 to 50 years | 16 (100.0%) | 0 (0.0%) |
| Total | 134 (89.9%) | 15 (10.1%) |
Fertility by Education in Alvarado
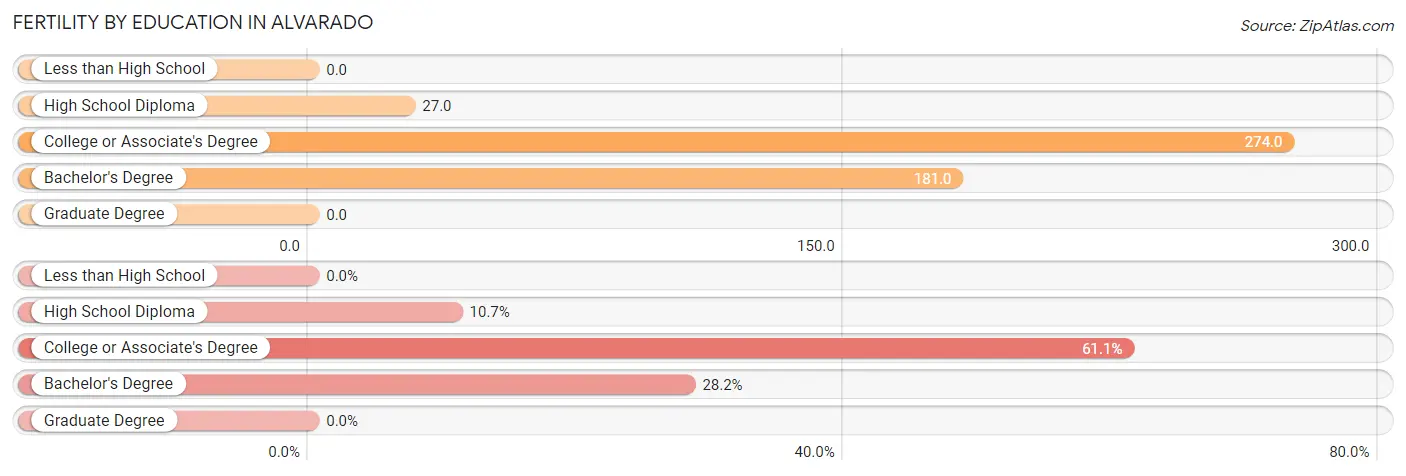
| Educational Attainment | Women with Births | Births / 1,000 Women |
| Less than High School | 0 (0.0%) | 0.0 |
| High School Diploma | 16 (10.7%) | 27.0 |
| College or Associate's Degree | 91 (61.1%) | 274.0 |
| Bachelor's Degree | 42 (28.2%) | 181.0 |
| Graduate Degree | 0 (0.0%) | 0.0 |
| Total | 149 (100.0%) | 104.0 |
Fertility by Education by Marriage Status in Alvarado
10.1% of women with births in Alvarado are unmarried. Women with the educational attainment of high school diploma are most likely to be married with 100.0% of them married at childbirth, while women with the educational attainment of college or associate's degree are least likely to be married with 16.5% of them unmarried at childbirth.
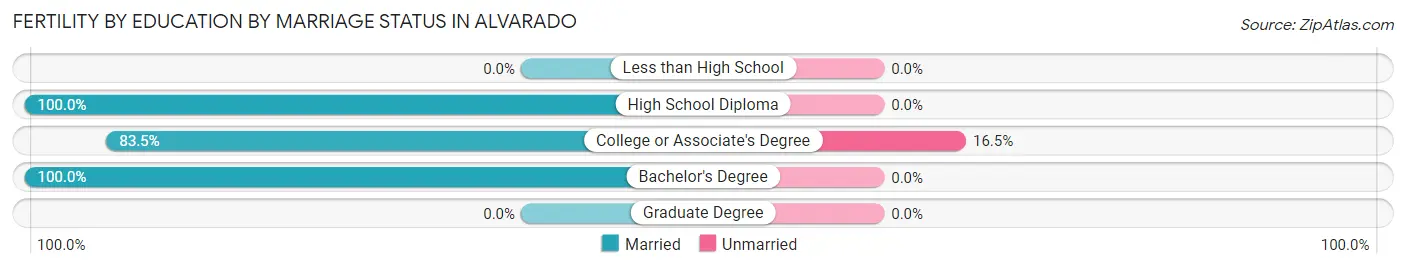
| Educational Attainment | Married | Unmarried |
| Less than High School | 0 (0.0%) | 0 (0.0%) |
| High School Diploma | 16 (100.0%) | 0 (0.0%) |
| College or Associate's Degree | 76 (83.5%) | 15 (16.5%) |
| Bachelor's Degree | 42 (100.0%) | 0 (0.0%) |
| Graduate Degree | 0 (0.0%) | 0 (0.0%) |
| Total | 134 (89.9%) | 15 (10.1%) |
Employment Characteristics in Alvarado
Employment by Class of Employer in Alvarado
Among the 2,272 employed individuals in Alvarado, private company employees (1,516 | 66.7%), not-for-profit organizations (309 | 13.6%), and local government employees (212 | 9.3%) make up the most common classes of employment.
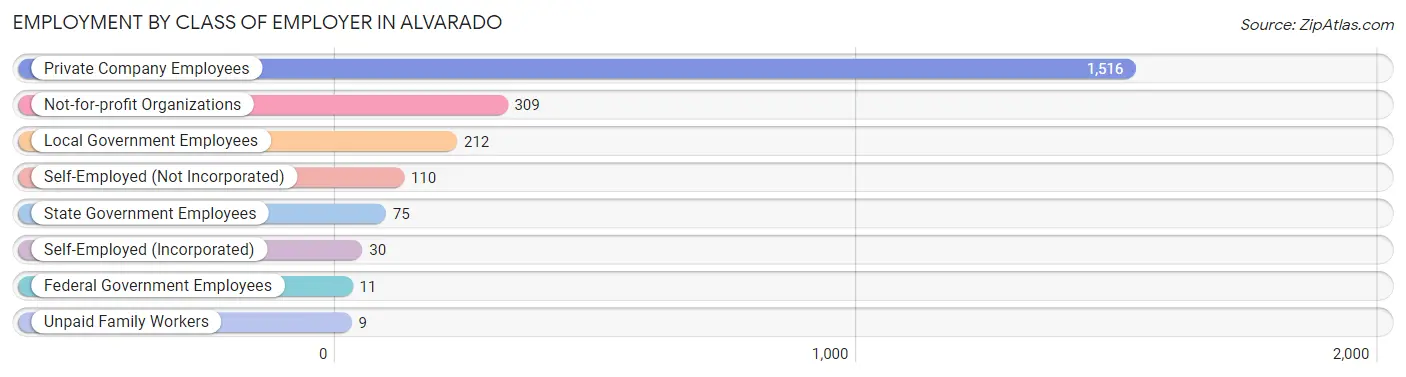
| Employer Class | # Employees | % Employees |
| Private Company Employees | 1,516 | 66.7% |
| Self-Employed (Incorporated) | 30 | 1.3% |
| Self-Employed (Not Incorporated) | 110 | 4.8% |
| Not-for-profit Organizations | 309 | 13.6% |
| Local Government Employees | 212 | 9.3% |
| State Government Employees | 75 | 3.3% |
| Federal Government Employees | 11 | 0.5% |
| Unpaid Family Workers | 9 | 0.4% |
| Total | 2,272 | 100.0% |
Employment Status by Age in Alvarado
According to the labor force statistics for Alvarado, out of the total population over 16 years of age (3,834), 62.5% or 2,396 individuals are in the labor force, with 1.3% or 31 of them unemployed. The age group with the highest labor force participation rate is 30 to 34 years, with 92.2% or 379 individuals in the labor force. Within the labor force, the 35 to 44 years age range has the highest percentage of unemployed individuals, with 11.2% or 32 of them being unemployed.
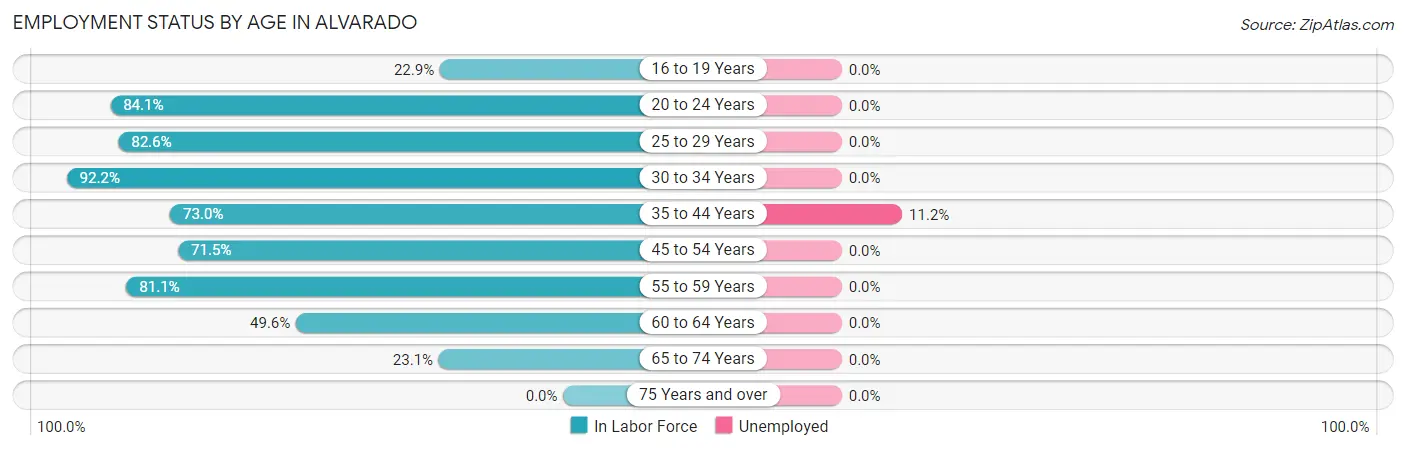
| Age Bracket | In Labor Force | Unemployed |
| 16 to 19 Years | 67 (22.9%) | 0 (0.0%) |
| 20 to 24 Years | 313 (84.1%) | 0 (0.0%) |
| 25 to 29 Years | 388 (82.6%) | 0 (0.0%) |
| 30 to 34 Years | 379 (92.2%) | 0 (0.0%) |
| 35 to 44 Years | 286 (73.0%) | 32 (11.2%) |
| 45 to 54 Years | 641 (71.5%) | 0 (0.0%) |
| 55 to 59 Years | 150 (81.1%) | 0 (0.0%) |
| 60 to 64 Years | 58 (49.6%) | 0 (0.0%) |
| 65 to 74 Years | 116 (23.1%) | 0 (0.0%) |
| 75 Years and over | 0 (0.0%) | 0 (0.0%) |
| Total | 2,396 (62.5%) | 31 (1.3%) |
Employment Status by Educational Attainment in Alvarado
According to labor force statistics for Alvarado, 77.0% of individuals (1,903) out of the total population between 25 and 64 years of age (2,471) are in the labor force, with 1.7% or 32 of them being unemployed. The group with the highest labor force participation rate are those with the educational attainment of bachelor's degree or higher, with 97.0% or 383 individuals in the labor force. Within the labor force, individuals with bachelor's degree or higher education have the highest percentage of unemployment, with 5.7% or 22 of them being unemployed.
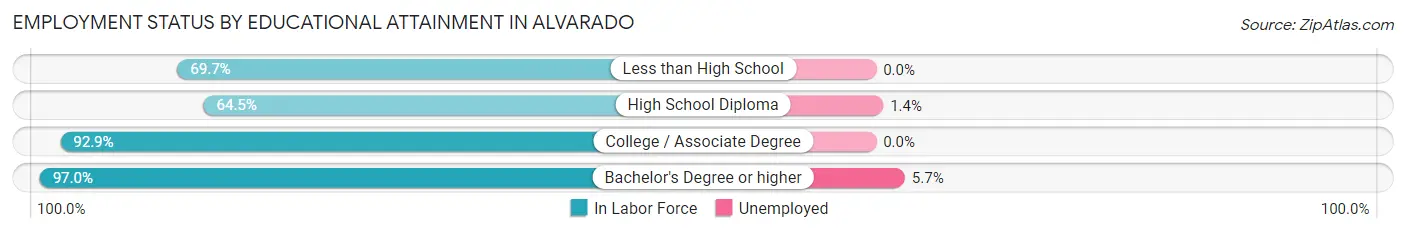
| Educational Attainment | In Labor Force | Unemployed |
| Less than High School | 315 (69.7%) | 0 (0.0%) |
| High School Diploma | 691 (64.5%) | 15 (1.4%) |
| College / Associate Degree | 513 (92.9%) | 0 (0.0%) |
| Bachelor's Degree or higher | 383 (97.0%) | 23 (5.7%) |
| Total | 1,903 (77.0%) | 42 (1.7%) |
Employment Occupations by Sex in Alvarado
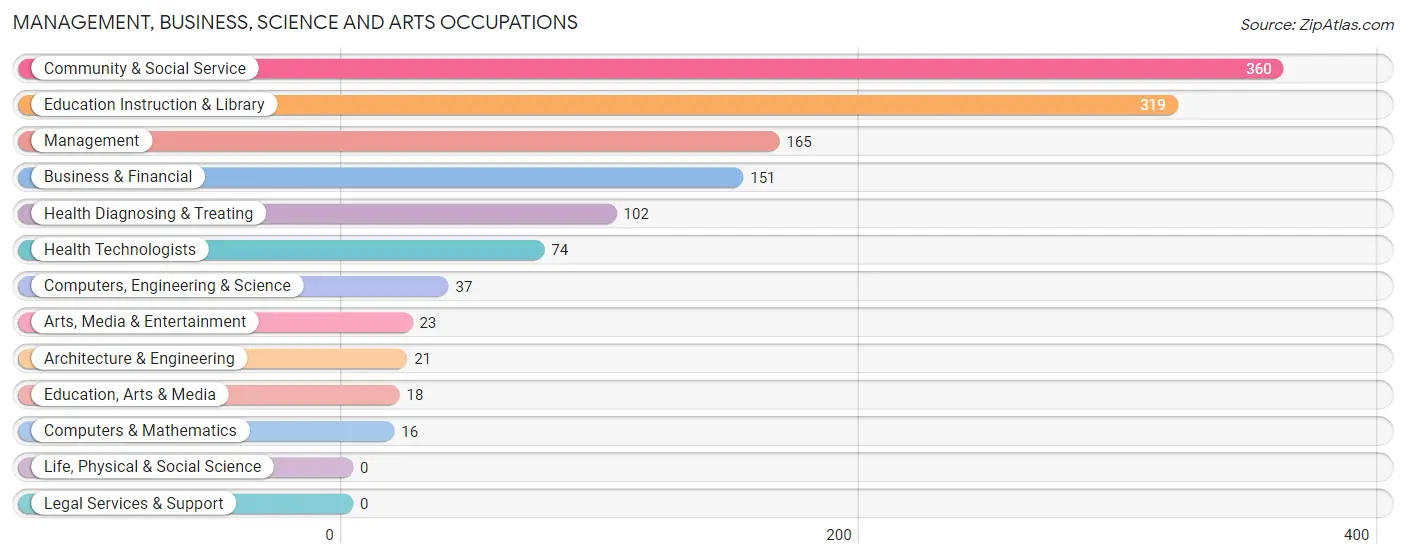
Management, Business, Science and Arts Occupations
The most common Management, Business, Science and Arts occupations in Alvarado are Community & Social Service (360 | 15.2%), Education Instruction & Library (319 | 13.5%), Management (165 | 7.0%), Business & Financial (151 | 6.4%), and Health Diagnosing & Treating (102 | 4.3%).
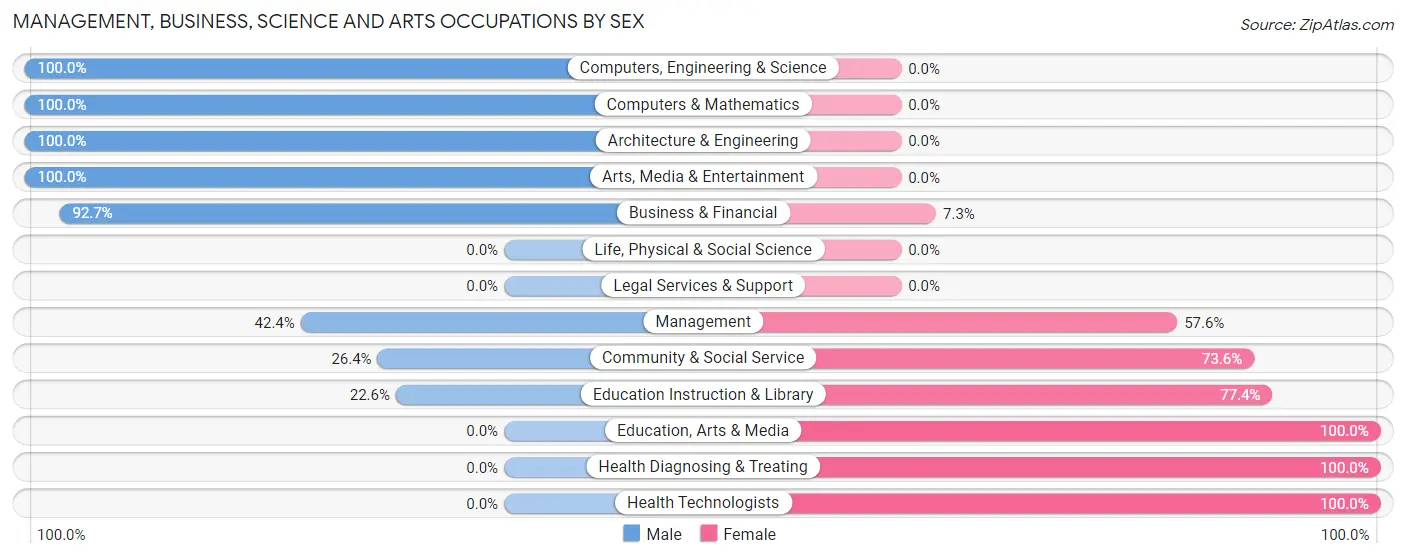
Management, Business, Science and Arts Occupations by Sex
Within the Management, Business, Science and Arts occupations in Alvarado, the most male-oriented occupations are Computers, Engineering & Science (100.0%), Computers & Mathematics (100.0%), and Architecture & Engineering (100.0%), while the most female-oriented occupations are Education, Arts & Media (100.0%), Health Diagnosing & Treating (100.0%), and Health Technologists (100.0%).
| Occupation | Male | Female |
| Management | 70 (42.4%) | 95 (57.6%) |
| Business & Financial | 140 (92.7%) | 11 (7.3%) |
| Computers, Engineering & Science | 37 (100.0%) | 0 (0.0%) |
| Computers & Mathematics | 16 (100.0%) | 0 (0.0%) |
| Architecture & Engineering | 21 (100.0%) | 0 (0.0%) |
| Life, Physical & Social Science | 0 (0.0%) | 0 (0.0%) |
| Community & Social Service | 95 (26.4%) | 265 (73.6%) |
| Education, Arts & Media | 0 (0.0%) | 18 (100.0%) |
| Legal Services & Support | 0 (0.0%) | 0 (0.0%) |
| Education Instruction & Library | 72 (22.6%) | 247 (77.4%) |
| Arts, Media & Entertainment | 23 (100.0%) | 0 (0.0%) |
| Health Diagnosing & Treating | 0 (0.0%) | 102 (100.0%) |
| Health Technologists | 0 (0.0%) | 74 (100.0%) |
| Total (Category) | 342 (42.0%) | 473 (58.0%) |
| Total (Overall) | 1,327 (56.1%) | 1,039 (43.9%) |
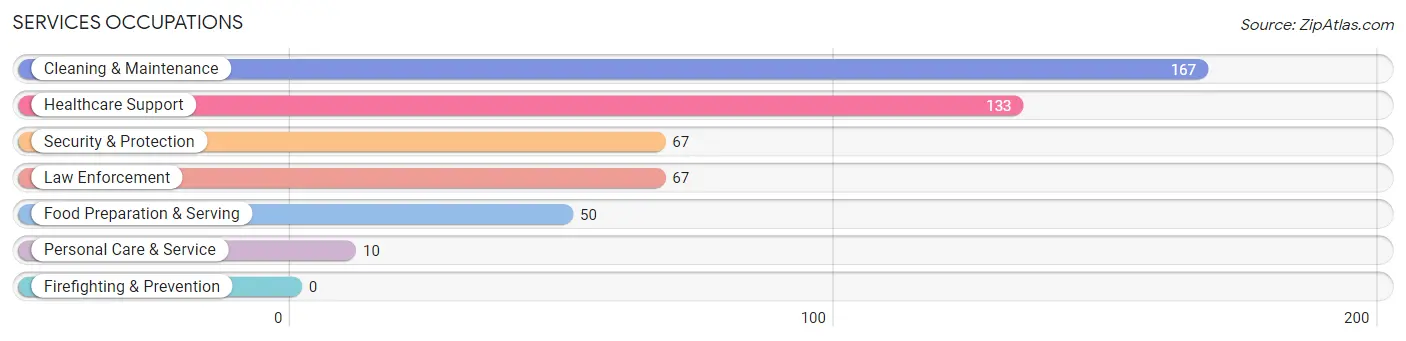
Services Occupations
The most common Services occupations in Alvarado are Cleaning & Maintenance (167 | 7.1%), Healthcare Support (133 | 5.6%), Security & Protection (67 | 2.8%), Law Enforcement (67 | 2.8%), and Food Preparation & Serving (50 | 2.1%).
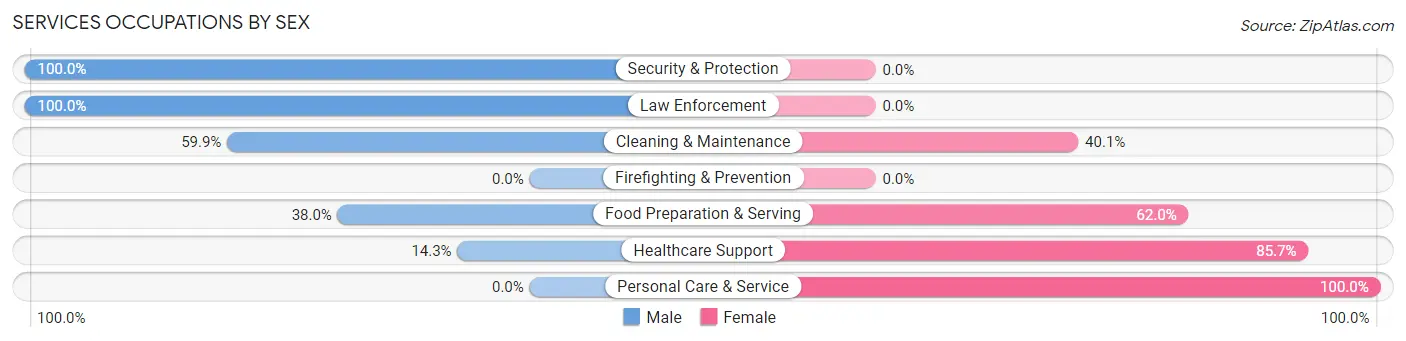
Services Occupations by Sex
Within the Services occupations in Alvarado, the most male-oriented occupations are Security & Protection (100.0%), Law Enforcement (100.0%), and Cleaning & Maintenance (59.9%), while the most female-oriented occupations are Personal Care & Service (100.0%), Healthcare Support (85.7%), and Food Preparation & Serving (62.0%).
| Occupation | Male | Female |
| Healthcare Support | 19 (14.3%) | 114 (85.7%) |
| Security & Protection | 67 (100.0%) | 0 (0.0%) |
| Firefighting & Prevention | 0 (0.0%) | 0 (0.0%) |
| Law Enforcement | 67 (100.0%) | 0 (0.0%) |
| Food Preparation & Serving | 19 (38.0%) | 31 (62.0%) |
| Cleaning & Maintenance | 100 (59.9%) | 67 (40.1%) |
| Personal Care & Service | 0 (0.0%) | 10 (100.0%) |
| Total (Category) | 205 (48.0%) | 222 (52.0%) |
| Total (Overall) | 1,327 (56.1%) | 1,039 (43.9%) |
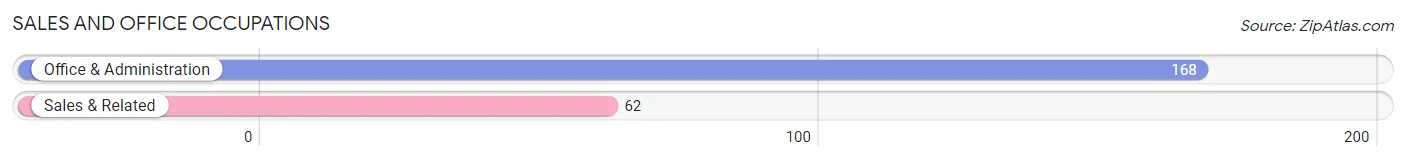
Sales and Office Occupations
The most common Sales and Office occupations in Alvarado are Office & Administration (168 | 7.1%), and Sales & Related (62 | 2.6%).
Sales and Office Occupations by Sex
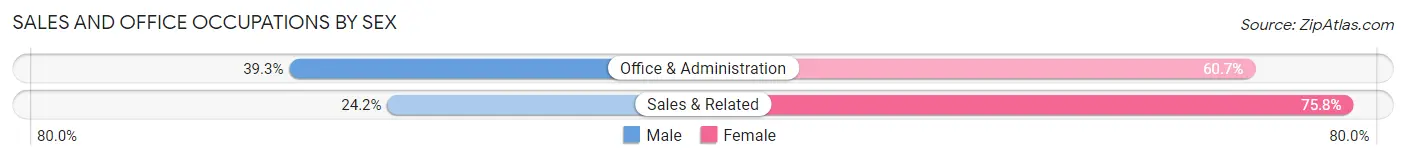
| Occupation | Male | Female |
| Sales & Related | 15 (24.2%) | 47 (75.8%) |
| Office & Administration | 66 (39.3%) | 102 (60.7%) |
| Total (Category) | 81 (35.2%) | 149 (64.8%) |
| Total (Overall) | 1,327 (56.1%) | 1,039 (43.9%) |
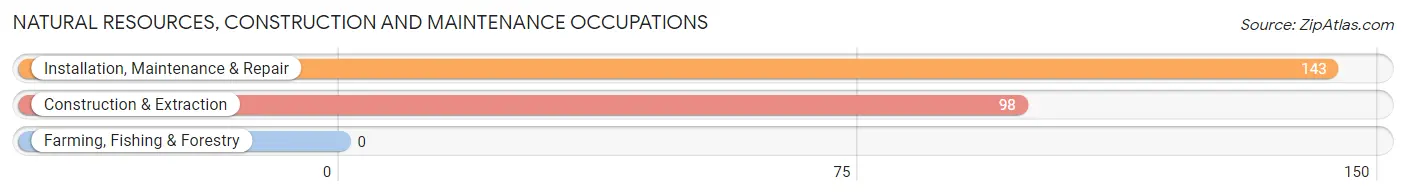
Natural Resources, Construction and Maintenance Occupations
The most common Natural Resources, Construction and Maintenance occupations in Alvarado are Installation, Maintenance & Repair (143 | 6.0%), and Construction & Extraction (98 | 4.1%).
Natural Resources, Construction and Maintenance Occupations by Sex
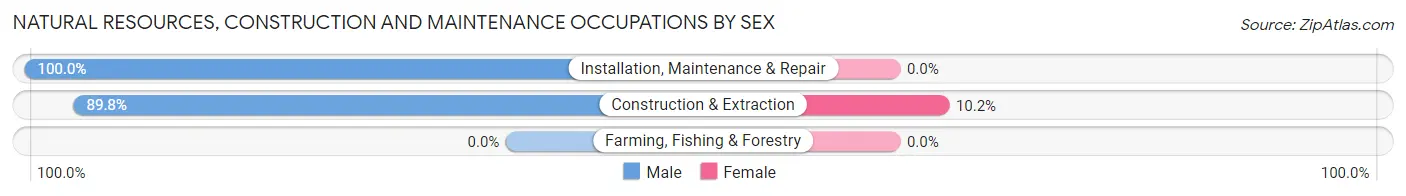
| Occupation | Male | Female |
| Farming, Fishing & Forestry | 0 (0.0%) | 0 (0.0%) |
| Construction & Extraction | 88 (89.8%) | 10 (10.2%) |
| Installation, Maintenance & Repair | 143 (100.0%) | 0 (0.0%) |
| Total (Category) | 231 (95.9%) | 10 (4.2%) |
| Total (Overall) | 1,327 (56.1%) | 1,039 (43.9%) |
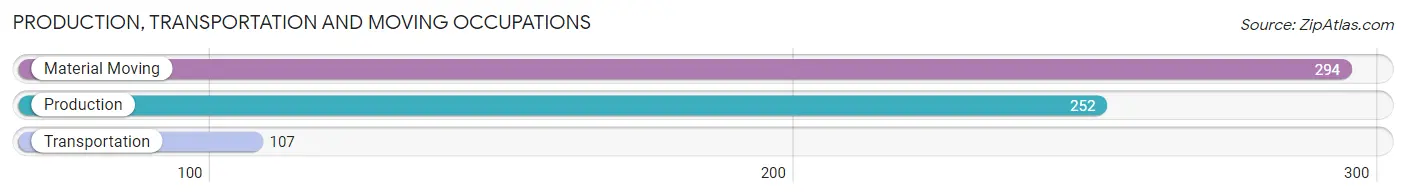
Production, Transportation and Moving Occupations
The most common Production, Transportation and Moving occupations in Alvarado are Material Moving (294 | 12.4%), Production (252 | 10.6%), and Transportation (107 | 4.5%).
Production, Transportation and Moving Occupations by Sex
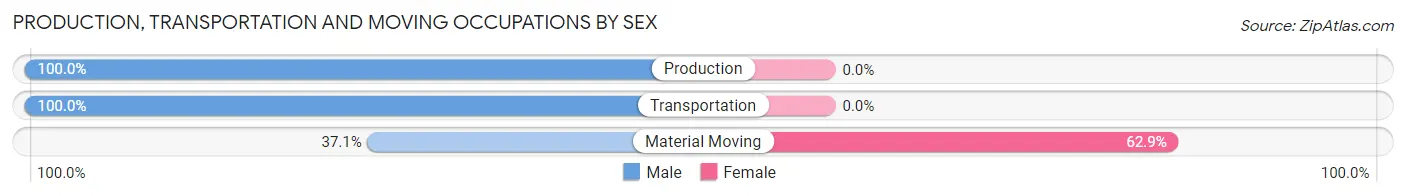
| Occupation | Male | Female |
| Production | 252 (100.0%) | 0 (0.0%) |
| Transportation | 107 (100.0%) | 0 (0.0%) |
| Material Moving | 109 (37.1%) | 185 (62.9%) |
| Total (Category) | 468 (71.7%) | 185 (28.3%) |
| Total (Overall) | 1,327 (56.1%) | 1,039 (43.9%) |
Employment Industries by Sex in Alvarado
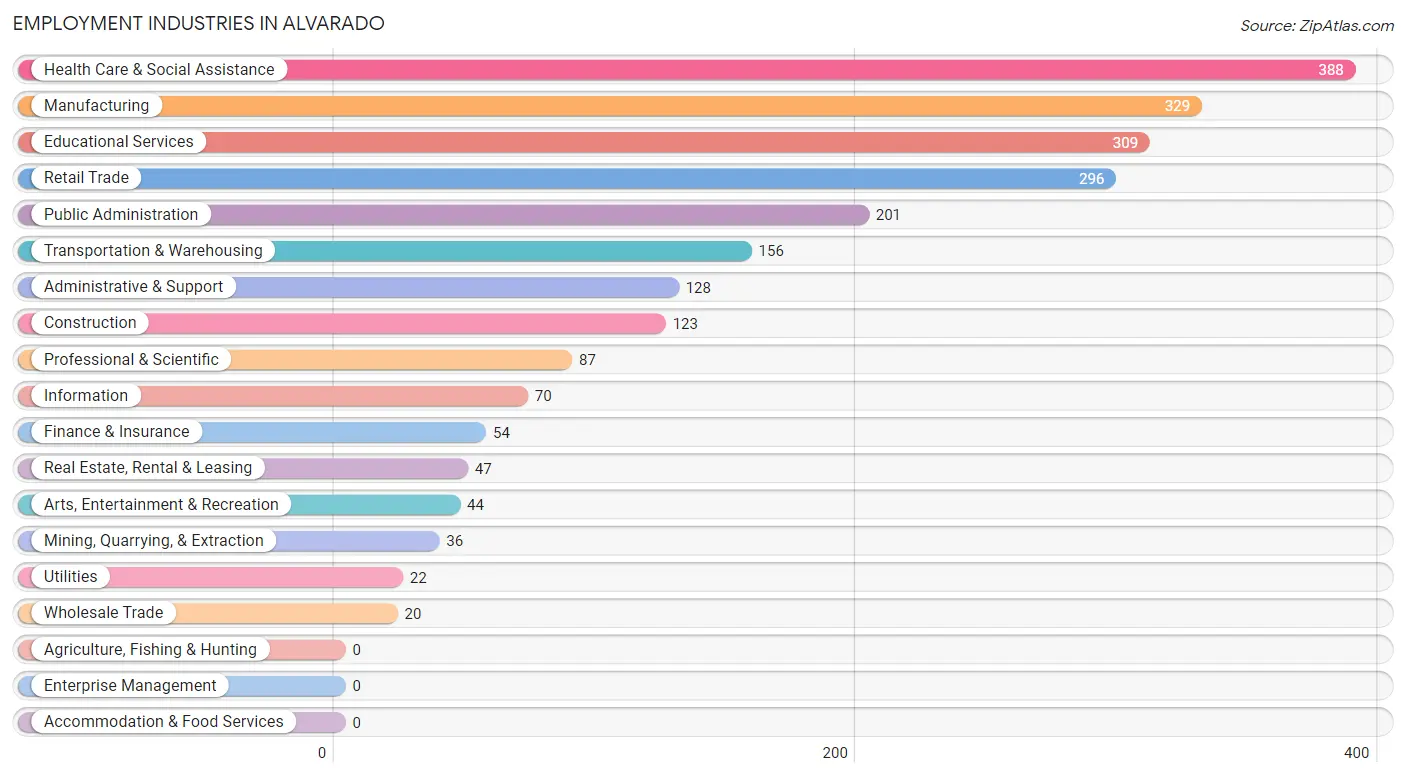
Employment Industries in Alvarado
The major employment industries in Alvarado include Health Care & Social Assistance (388 | 16.4%), Manufacturing (329 | 13.9%), Educational Services (309 | 13.1%), Retail Trade (296 | 12.5%), and Public Administration (201 | 8.5%).
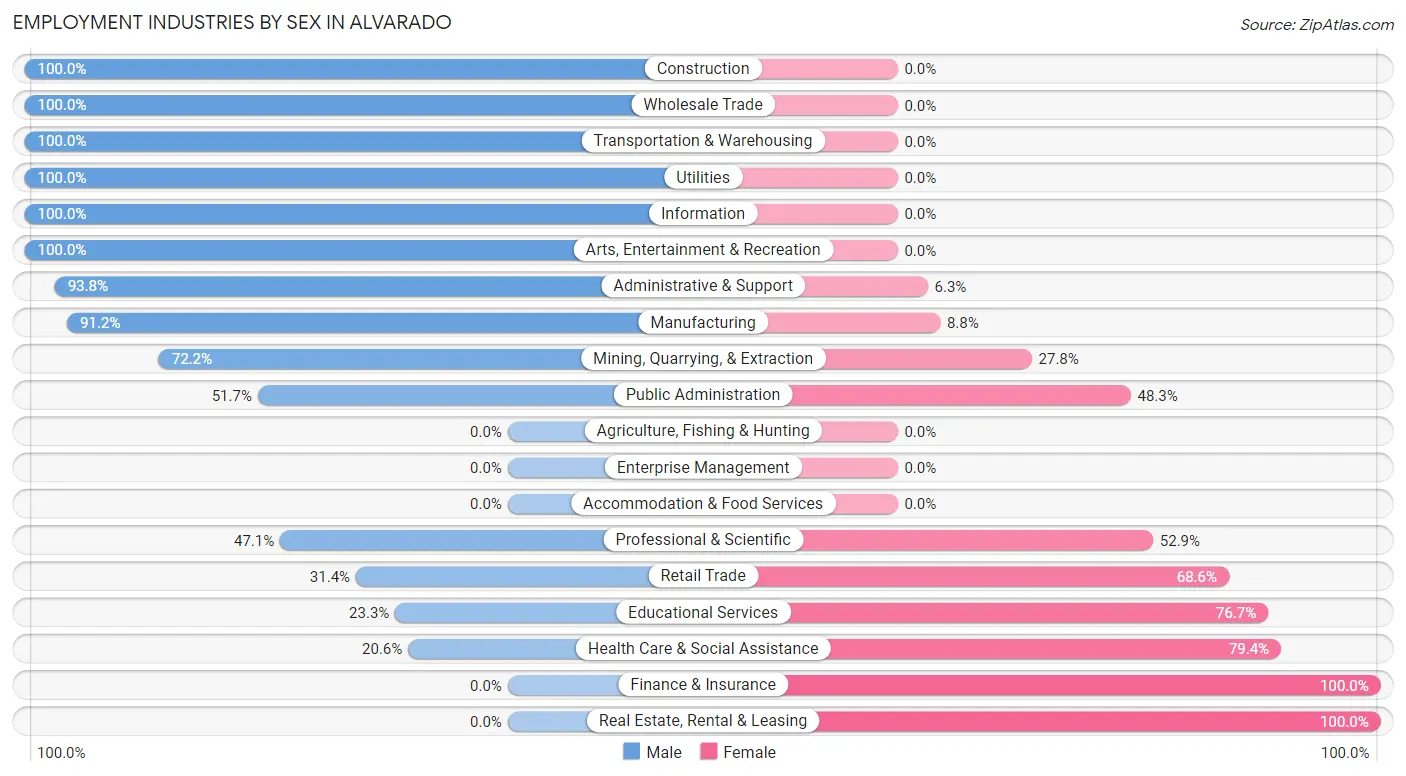
Employment Industries by Sex in Alvarado
The Alvarado industries that see more men than women are Construction (100.0%), Wholesale Trade (100.0%), and Transportation & Warehousing (100.0%), whereas the industries that tend to have a higher number of women are Finance & Insurance (100.0%), Real Estate, Rental & Leasing (100.0%), and Health Care & Social Assistance (79.4%).
| Industry | Male | Female |
| Agriculture, Fishing & Hunting | 0 (0.0%) | 0 (0.0%) |
| Mining, Quarrying, & Extraction | 26 (72.2%) | 10 (27.8%) |
| Construction | 123 (100.0%) | 0 (0.0%) |
| Manufacturing | 300 (91.2%) | 29 (8.8%) |
| Wholesale Trade | 20 (100.0%) | 0 (0.0%) |
| Retail Trade | 93 (31.4%) | 203 (68.6%) |
| Transportation & Warehousing | 156 (100.0%) | 0 (0.0%) |
| Utilities | 22 (100.0%) | 0 (0.0%) |
| Information | 70 (100.0%) | 0 (0.0%) |
| Finance & Insurance | 0 (0.0%) | 54 (100.0%) |
| Real Estate, Rental & Leasing | 0 (0.0%) | 47 (100.0%) |
| Professional & Scientific | 41 (47.1%) | 46 (52.9%) |
| Enterprise Management | 0 (0.0%) | 0 (0.0%) |
| Administrative & Support | 120 (93.8%) | 8 (6.2%) |
| Educational Services | 72 (23.3%) | 237 (76.7%) |
| Health Care & Social Assistance | 80 (20.6%) | 308 (79.4%) |
| Arts, Entertainment & Recreation | 44 (100.0%) | 0 (0.0%) |
| Accommodation & Food Services | 0 (0.0%) | 0 (0.0%) |
| Public Administration | 104 (51.7%) | 97 (48.3%) |
| Total | 1,327 (56.1%) | 1,039 (43.9%) |
Education in Alvarado
School Enrollment in Alvarado
The most common levels of schooling among the 948 students in Alvarado are middle school (279 | 29.4%), high school (214 | 22.6%), and college / undergraduate (151 | 15.9%).
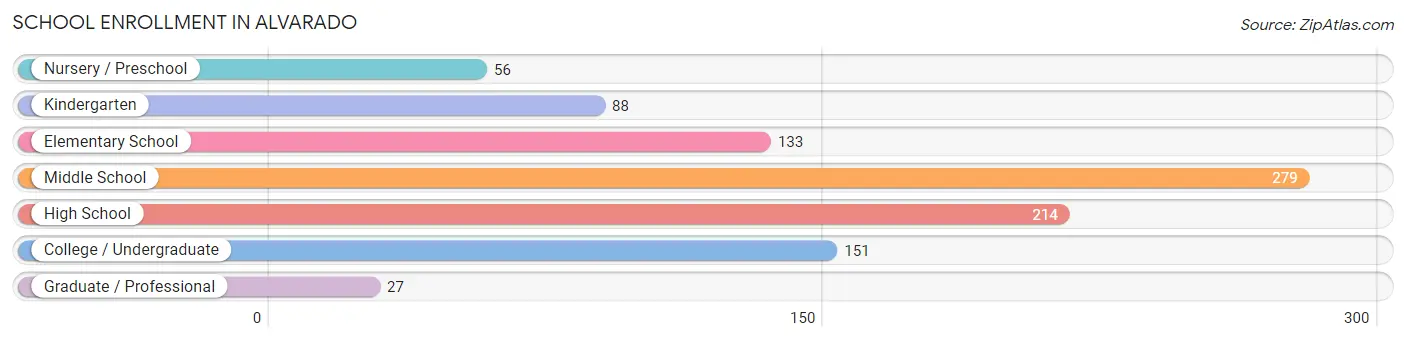
| School Level | # Students | % Students |
| Nursery / Preschool | 56 | 5.9% |
| Kindergarten | 88 | 9.3% |
| Elementary School | 133 | 14.0% |
| Middle School | 279 | 29.4% |
| High School | 214 | 22.6% |
| College / Undergraduate | 151 | 15.9% |
| Graduate / Professional | 27 | 2.9% |
| Total | 948 | 100.0% |
School Enrollment by Age by Funding Source in Alvarado
Out of a total of 948 students who are enrolled in schools in Alvarado, 111 (11.7%) attend a private institution, while the remaining 837 (88.3%) are enrolled in public schools. The age group of 5 to 9 year old has the highest likelihood of being enrolled in private schools, with 49 (26.3% in the age bracket) enrolled. Conversely, the age group of 3 to 4 year olds has the lowest likelihood of being enrolled in a private school, with 56 (100.0% in the age bracket) attending a public institution.
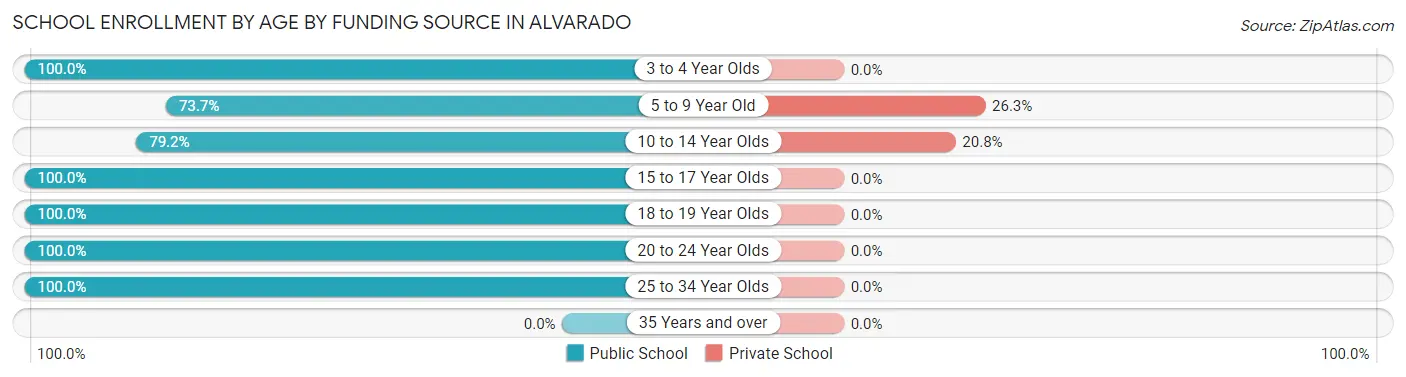
| Age Bracket | Public School | Private School |
| 3 to 4 Year Olds | 56 (100.0%) | 0 (0.0%) |
| 5 to 9 Year Old | 137 (73.7%) | 49 (26.3%) |
| 10 to 14 Year Olds | 236 (79.2%) | 62 (20.8%) |
| 15 to 17 Year Olds | 222 (100.0%) | 0 (0.0%) |
| 18 to 19 Year Olds | 14 (100.0%) | 0 (0.0%) |
| 20 to 24 Year Olds | 113 (100.0%) | 0 (0.0%) |
| 25 to 34 Year Olds | 59 (100.0%) | 0 (0.0%) |
| 35 Years and over | 0 (0.0%) | 0 (0.0%) |
| Total | 837 (88.3%) | 111 (11.7%) |
Educational Attainment by Field of Study in Alvarado
Education (247 | 45.8%), business (127 | 23.6%), arts & humanities (53 | 9.8%), science & technology (49 | 9.1%), and psychology (47 | 8.7%) are the most common fields of study among 539 individuals in Alvarado who have obtained a bachelor's degree or higher.
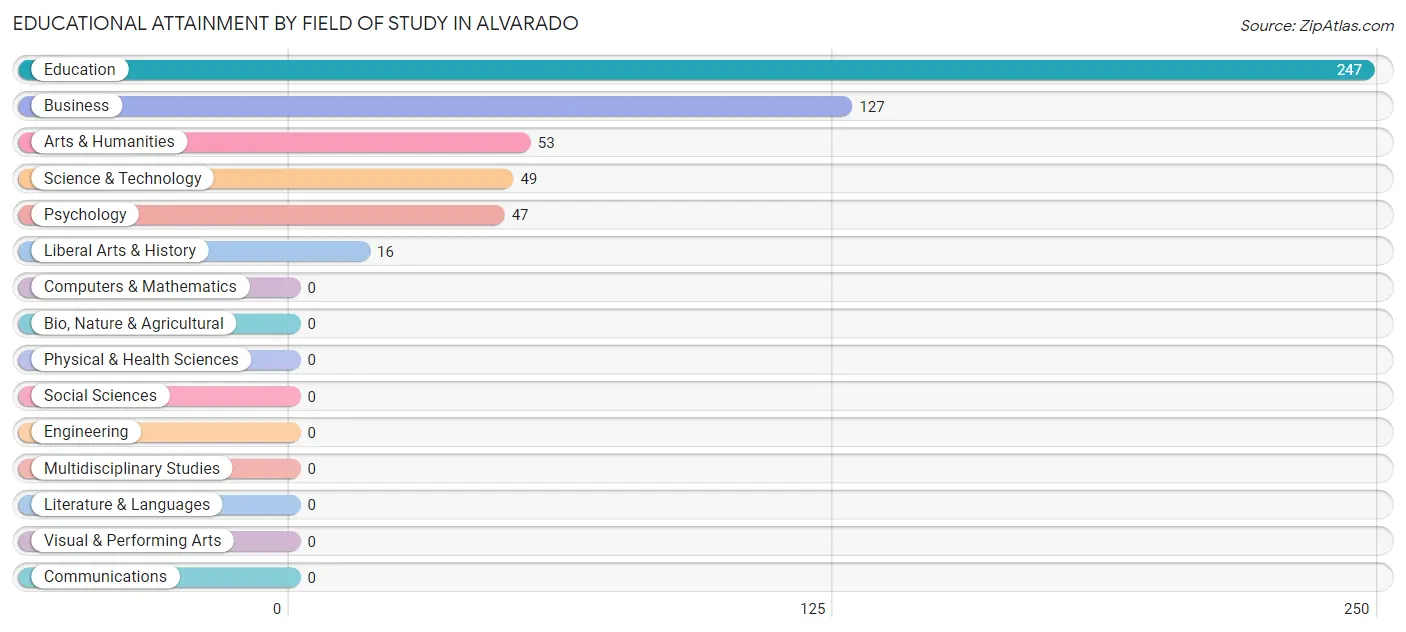
| Field of Study | # Graduates | % Graduates |
| Computers & Mathematics | 0 | 0.0% |
| Bio, Nature & Agricultural | 0 | 0.0% |
| Physical & Health Sciences | 0 | 0.0% |
| Psychology | 47 | 8.7% |
| Social Sciences | 0 | 0.0% |
| Engineering | 0 | 0.0% |
| Multidisciplinary Studies | 0 | 0.0% |
| Science & Technology | 49 | 9.1% |
| Business | 127 | 23.6% |
| Education | 247 | 45.8% |
| Literature & Languages | 0 | 0.0% |
| Liberal Arts & History | 16 | 3.0% |
| Visual & Performing Arts | 0 | 0.0% |
| Communications | 0 | 0.0% |
| Arts & Humanities | 53 | 9.8% |
| Total | 539 | 100.0% |
Transportation & Commute in Alvarado
Vehicle Availability by Sex in Alvarado
The most prevalent vehicle ownership categories in Alvarado are males with 2 vehicles (543, accounting for 42.0%) and females with 2 vehicles (421, making up 55.4%).
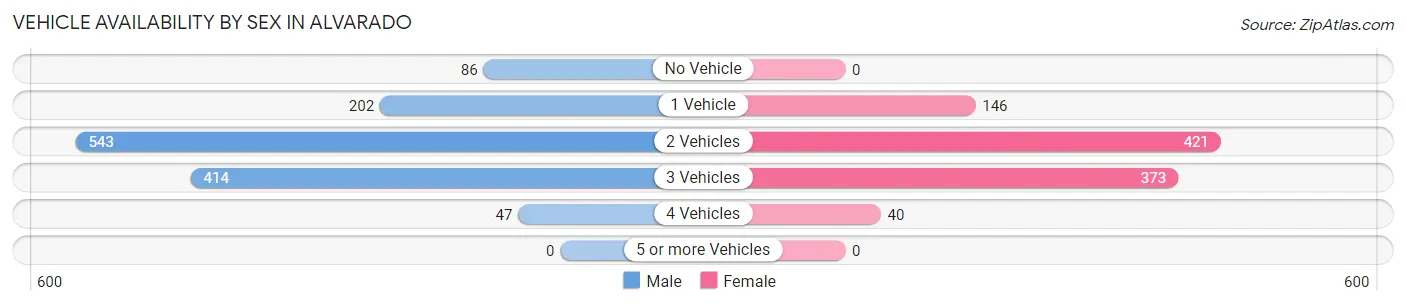
| Vehicles Available | Male | Female |
| No Vehicle | 86 (6.7%) | 0 (0.0%) |
| 1 Vehicle | 202 (15.6%) | 146 (14.9%) |
| 2 Vehicles | 543 (42.0%) | 421 (43.0%) |
| 3 Vehicles | 414 (32.0%) | 373 (38.1%) |
| 4 Vehicles | 47 (3.6%) | 40 (4.1%) |
| 5 or more Vehicles | 0 (0.0%) | 0 (0.0%) |
| Total | 1,292 (100.0%) | 980 (100.0%) |
Commute Time in Alvarado
The most frequently occuring commute durations in Alvarado are 45 to 59 minutes (438 commuters, 19.4%), 10 to 14 minutes (388 commuters, 17.2%), and 5 to 9 minutes (280 commuters, 12.4%).
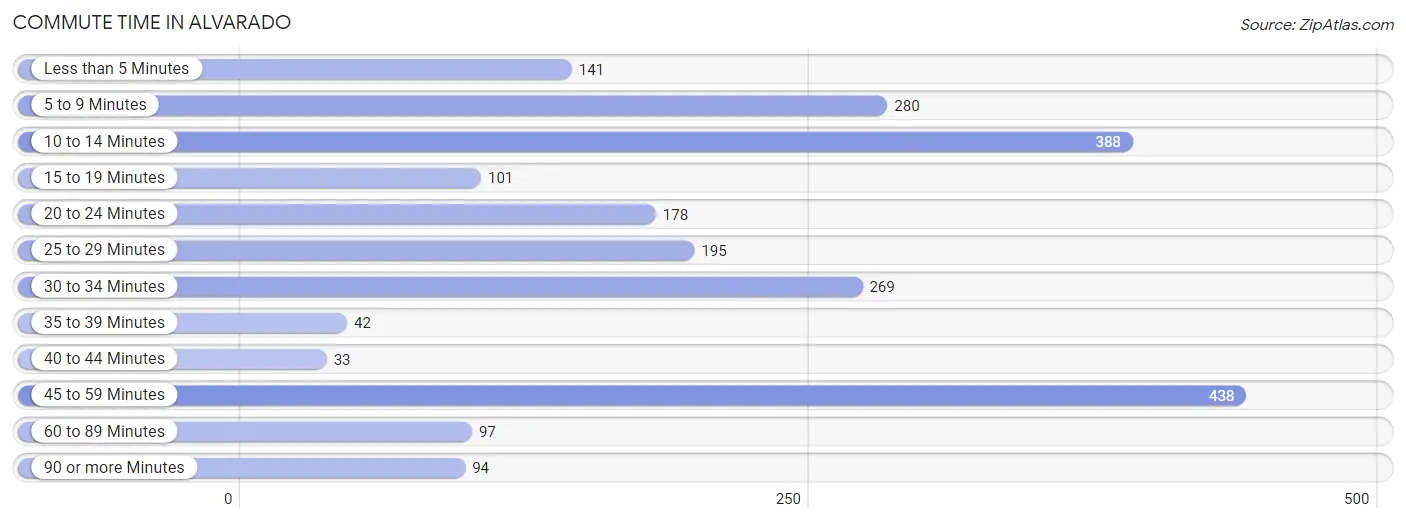
| Commute Time | # Commuters | % Commuters |
| Less than 5 Minutes | 141 | 6.2% |
| 5 to 9 Minutes | 280 | 12.4% |
| 10 to 14 Minutes | 388 | 17.2% |
| 15 to 19 Minutes | 101 | 4.5% |
| 20 to 24 Minutes | 178 | 7.9% |
| 25 to 29 Minutes | 195 | 8.6% |
| 30 to 34 Minutes | 269 | 11.9% |
| 35 to 39 Minutes | 42 | 1.9% |
| 40 to 44 Minutes | 33 | 1.5% |
| 45 to 59 Minutes | 438 | 19.4% |
| 60 to 89 Minutes | 97 | 4.3% |
| 90 or more Minutes | 94 | 4.2% |
Commute Time by Sex in Alvarado
The most common commute times in Alvarado are 45 to 59 minutes (386 commuters, 30.2%) for males and 10 to 14 minutes (216 commuters, 22.0%) for females.
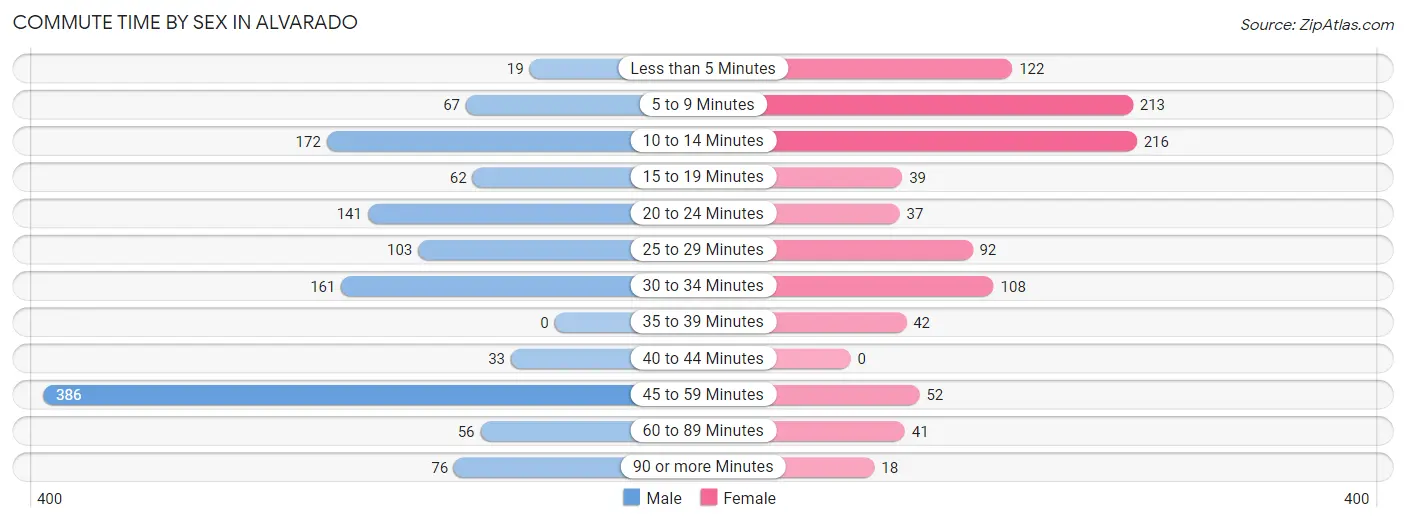
| Commute Time | Male | Female |
| Less than 5 Minutes | 19 (1.5%) | 122 (12.4%) |
| 5 to 9 Minutes | 67 (5.2%) | 213 (21.7%) |
| 10 to 14 Minutes | 172 (13.5%) | 216 (22.0%) |
| 15 to 19 Minutes | 62 (4.9%) | 39 (4.0%) |
| 20 to 24 Minutes | 141 (11.1%) | 37 (3.8%) |
| 25 to 29 Minutes | 103 (8.1%) | 92 (9.4%) |
| 30 to 34 Minutes | 161 (12.6%) | 108 (11.0%) |
| 35 to 39 Minutes | 0 (0.0%) | 42 (4.3%) |
| 40 to 44 Minutes | 33 (2.6%) | 0 (0.0%) |
| 45 to 59 Minutes | 386 (30.2%) | 52 (5.3%) |
| 60 to 89 Minutes | 56 (4.4%) | 41 (4.2%) |
| 90 or more Minutes | 76 (6.0%) | 18 (1.8%) |
Time of Departure to Work by Sex in Alvarado
The most frequent times of departure to work in Alvarado are 7:00 AM to 7:29 AM (419, 32.8%) for males and 7:00 AM to 7:29 AM (262, 26.7%) for females.
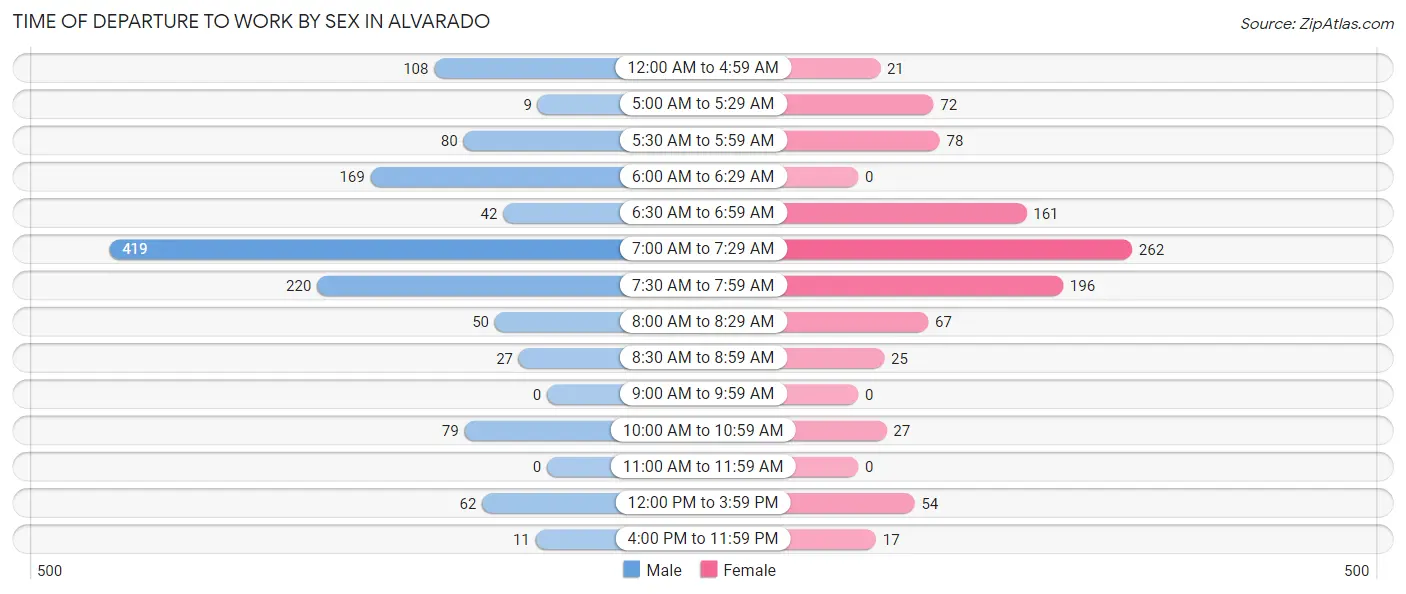
| Time of Departure | Male | Female |
| 12:00 AM to 4:59 AM | 108 (8.5%) | 21 (2.1%) |
| 5:00 AM to 5:29 AM | 9 (0.7%) | 72 (7.3%) |
| 5:30 AM to 5:59 AM | 80 (6.3%) | 78 (8.0%) |
| 6:00 AM to 6:29 AM | 169 (13.2%) | 0 (0.0%) |
| 6:30 AM to 6:59 AM | 42 (3.3%) | 161 (16.4%) |
| 7:00 AM to 7:29 AM | 419 (32.8%) | 262 (26.7%) |
| 7:30 AM to 7:59 AM | 220 (17.2%) | 196 (20.0%) |
| 8:00 AM to 8:29 AM | 50 (3.9%) | 67 (6.8%) |
| 8:30 AM to 8:59 AM | 27 (2.1%) | 25 (2.5%) |
| 9:00 AM to 9:59 AM | 0 (0.0%) | 0 (0.0%) |
| 10:00 AM to 10:59 AM | 79 (6.2%) | 27 (2.8%) |
| 11:00 AM to 11:59 AM | 0 (0.0%) | 0 (0.0%) |
| 12:00 PM to 3:59 PM | 62 (4.9%) | 54 (5.5%) |
| 4:00 PM to 11:59 PM | 11 (0.9%) | 17 (1.7%) |
| Total | 1,276 (100.0%) | 980 (100.0%) |
Housing Occupancy in Alvarado
Occupancy by Ownership in Alvarado
Of the total 1,585 dwellings in Alvarado, owner-occupied units account for 994 (62.7%), while renter-occupied units make up 591 (37.3%).
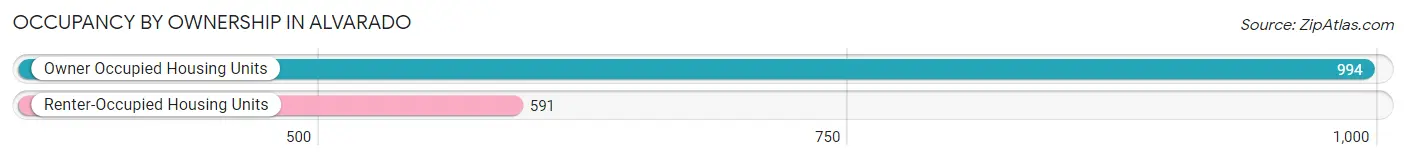
| Occupancy | # Housing Units | % Housing Units |
| Owner Occupied Housing Units | 994 | 62.7% |
| Renter-Occupied Housing Units | 591 | 37.3% |
| Total Occupied Housing Units | 1,585 | 100.0% |
Occupancy by Household Size in Alvarado
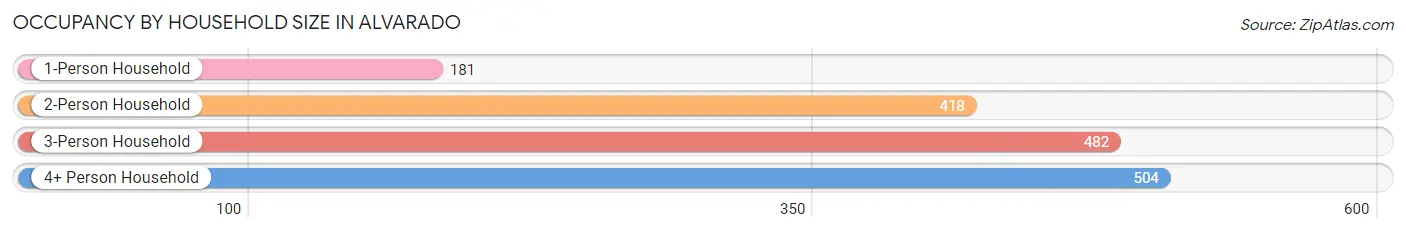
| Household Size | # Housing Units | % Housing Units |
| 1-Person Household | 181 | 11.4% |
| 2-Person Household | 418 | 26.4% |
| 3-Person Household | 482 | 30.4% |
| 4+ Person Household | 504 | 31.8% |
| Total Housing Units | 1,585 | 100.0% |
Occupancy by Ownership by Household Size in Alvarado
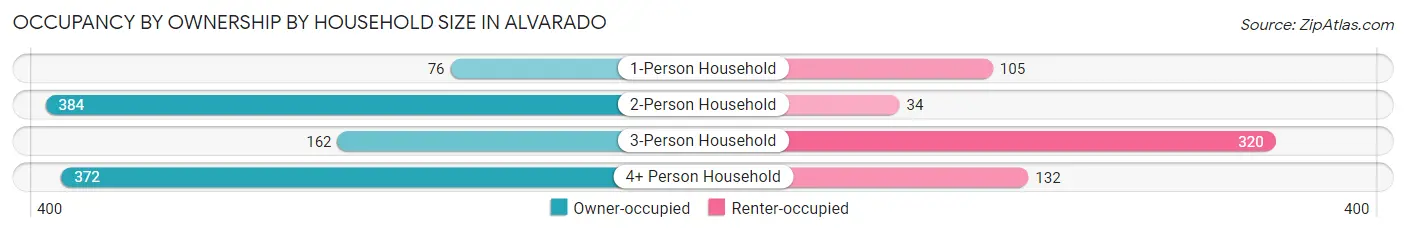
| Household Size | Owner-occupied | Renter-occupied |
| 1-Person Household | 76 (42.0%) | 105 (58.0%) |
| 2-Person Household | 384 (91.9%) | 34 (8.1%) |
| 3-Person Household | 162 (33.6%) | 320 (66.4%) |
| 4+ Person Household | 372 (73.8%) | 132 (26.2%) |
| Total Housing Units | 994 (62.7%) | 591 (37.3%) |
Occupancy by Educational Attainment in Alvarado
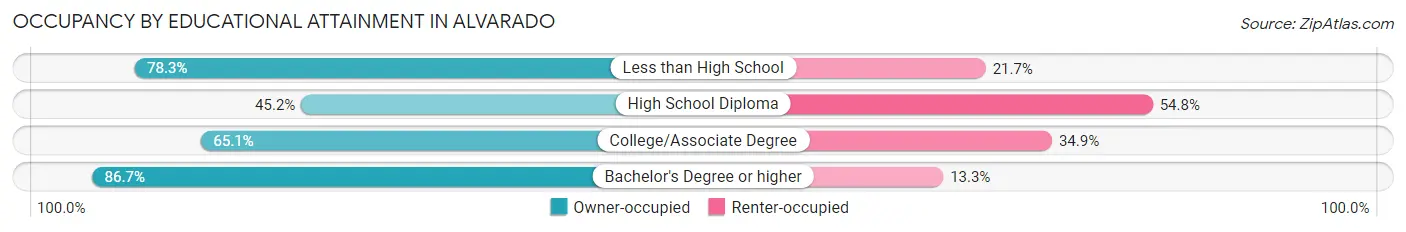
| Household Size | Owner-occupied | Renter-occupied |
| Less than High School | 191 (78.3%) | 53 (21.7%) |
| High School Diploma | 299 (45.2%) | 363 (54.8%) |
| College/Associate Degree | 256 (65.1%) | 137 (34.9%) |
| Bachelor's Degree or higher | 248 (86.7%) | 38 (13.3%) |
Occupancy by Age of Householder in Alvarado
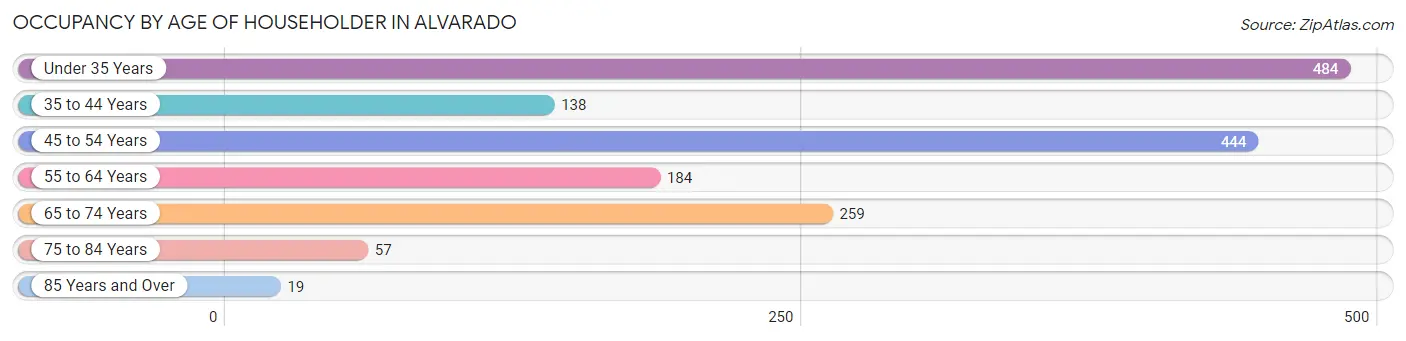
| Age Bracket | # Households | % Households |
| Under 35 Years | 484 | 30.5% |
| 35 to 44 Years | 138 | 8.7% |
| 45 to 54 Years | 444 | 28.0% |
| 55 to 64 Years | 184 | 11.6% |
| 65 to 74 Years | 259 | 16.3% |
| 75 to 84 Years | 57 | 3.6% |
| 85 Years and Over | 19 | 1.2% |
| Total | 1,585 | 100.0% |
Housing Finances in Alvarado
Median Income by Occupancy in Alvarado
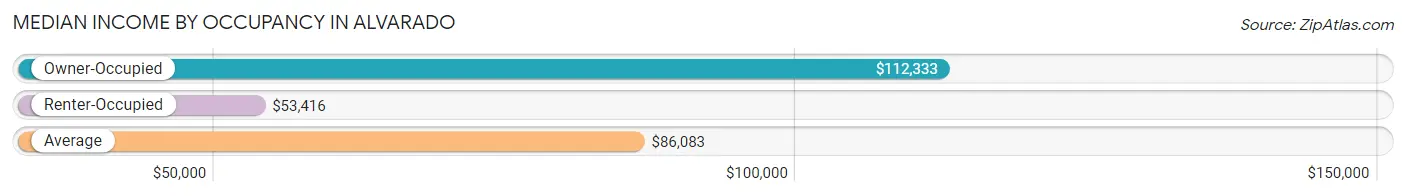
| Occupancy Type | # Households | Median Income |
| Owner-Occupied | 994 (62.7%) | $112,333 |
| Renter-Occupied | 591 (37.3%) | $53,416 |
| Average | 1,585 (100.0%) | $86,083 |
Occupancy by Householder Income Bracket in Alvarado
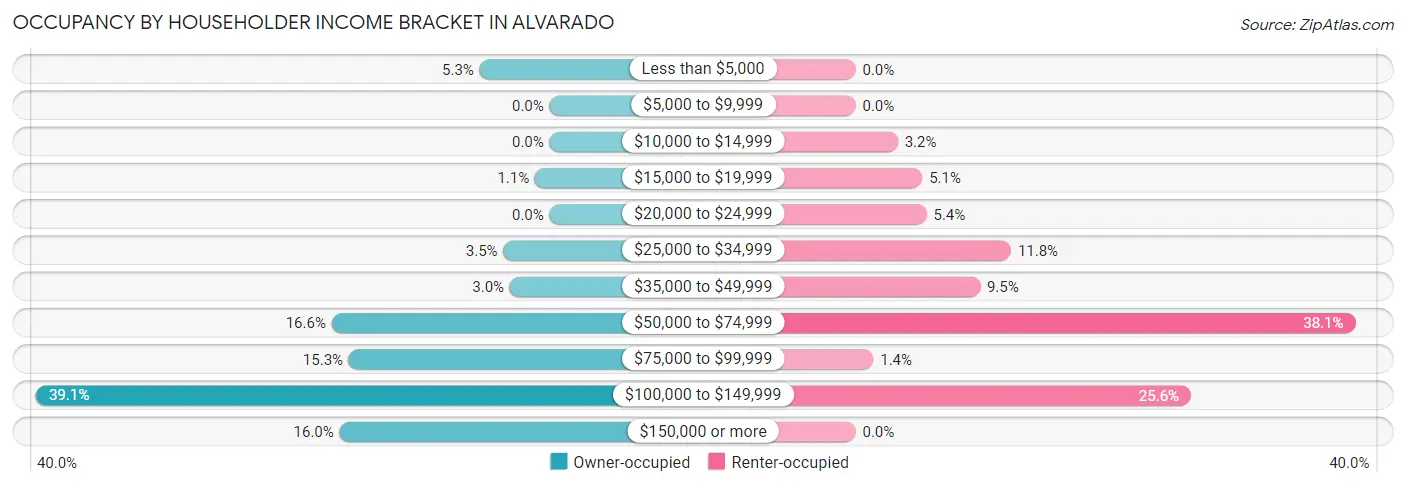
| Income Bracket | Owner-occupied | Renter-occupied |
| Less than $5,000 | 53 (5.3%) | 0 (0.0%) |
| $5,000 to $9,999 | 0 (0.0%) | 0 (0.0%) |
| $10,000 to $14,999 | 0 (0.0%) | 19 (3.2%) |
| $15,000 to $19,999 | 11 (1.1%) | 30 (5.1%) |
| $20,000 to $24,999 | 0 (0.0%) | 32 (5.4%) |
| $25,000 to $34,999 | 35 (3.5%) | 70 (11.8%) |
| $35,000 to $49,999 | 30 (3.0%) | 56 (9.5%) |
| $50,000 to $74,999 | 165 (16.6%) | 225 (38.1%) |
| $75,000 to $99,999 | 152 (15.3%) | 8 (1.3%) |
| $100,000 to $149,999 | 389 (39.1%) | 151 (25.6%) |
| $150,000 or more | 159 (16.0%) | 0 (0.0%) |
| Total | 994 (100.0%) | 591 (100.0%) |
Monthly Housing Cost Tiers in Alvarado
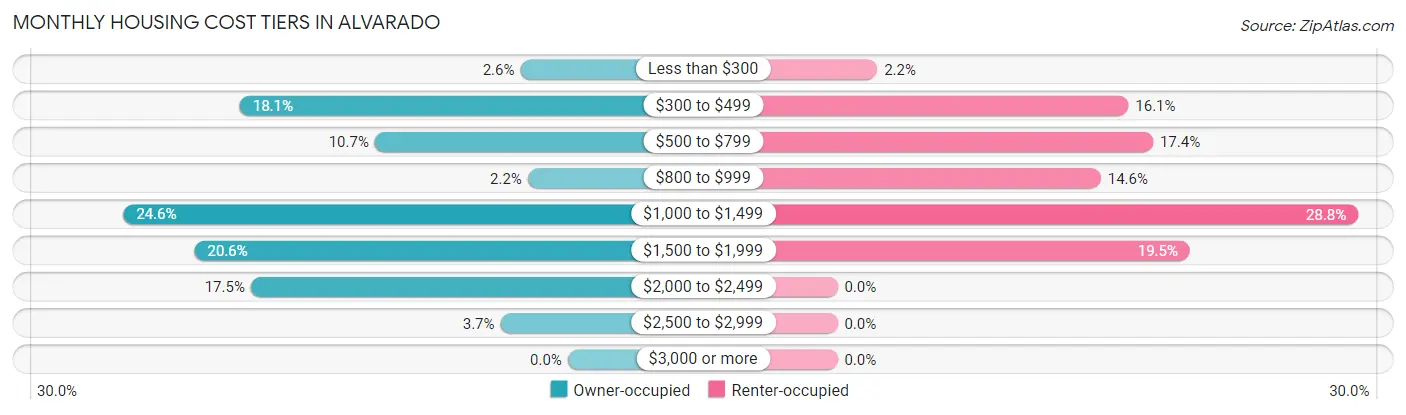
| Monthly Cost | Owner-occupied | Renter-occupied |
| Less than $300 | 26 (2.6%) | 13 (2.2%) |
| $300 to $499 | 180 (18.1%) | 95 (16.1%) |
| $500 to $799 | 106 (10.7%) | 103 (17.4%) |
| $800 to $999 | 22 (2.2%) | 86 (14.5%) |
| $1,000 to $1,499 | 244 (24.5%) | 170 (28.8%) |
| $1,500 to $1,999 | 205 (20.6%) | 115 (19.5%) |
| $2,000 to $2,499 | 174 (17.5%) | 0 (0.0%) |
| $2,500 to $2,999 | 37 (3.7%) | 0 (0.0%) |
| $3,000 or more | 0 (0.0%) | 0 (0.0%) |
| Total | 994 (100.0%) | 591 (100.0%) |
Physical Housing Characteristics in Alvarado
Housing Structures in Alvarado
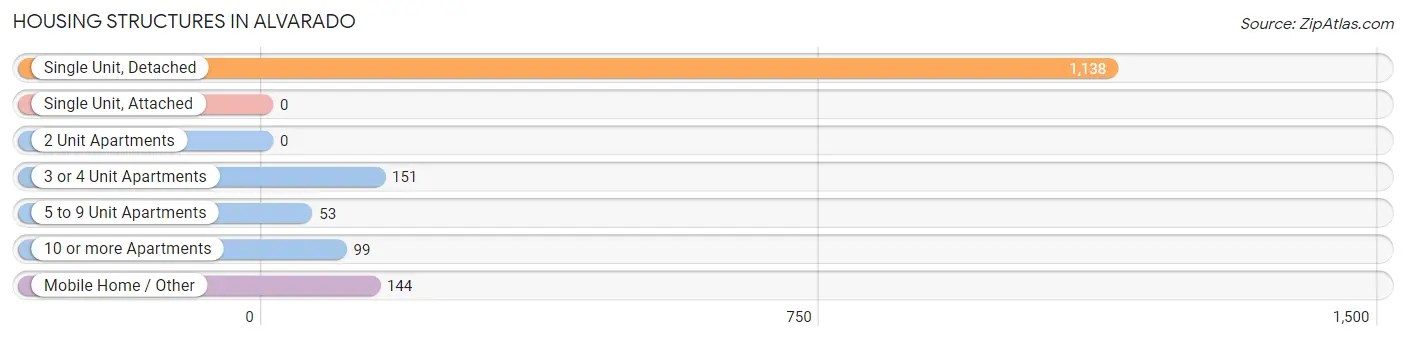
| Structure Type | # Housing Units | % Housing Units |
| Single Unit, Detached | 1,138 | 71.8% |
| Single Unit, Attached | 0 | 0.0% |
| 2 Unit Apartments | 0 | 0.0% |
| 3 or 4 Unit Apartments | 151 | 9.5% |
| 5 to 9 Unit Apartments | 53 | 3.3% |
| 10 or more Apartments | 99 | 6.2% |
| Mobile Home / Other | 144 | 9.1% |
| Total | 1,585 | 100.0% |
Housing Structures by Occupancy in Alvarado
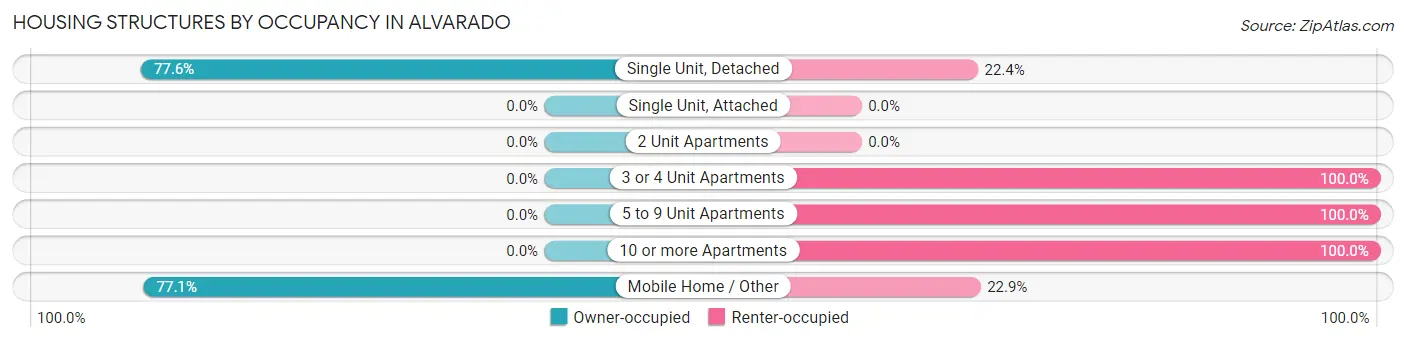
| Structure Type | Owner-occupied | Renter-occupied |
| Single Unit, Detached | 883 (77.6%) | 255 (22.4%) |
| Single Unit, Attached | 0 (0.0%) | 0 (0.0%) |
| 2 Unit Apartments | 0 (0.0%) | 0 (0.0%) |
| 3 or 4 Unit Apartments | 0 (0.0%) | 151 (100.0%) |
| 5 to 9 Unit Apartments | 0 (0.0%) | 53 (100.0%) |
| 10 or more Apartments | 0 (0.0%) | 99 (100.0%) |
| Mobile Home / Other | 111 (77.1%) | 33 (22.9%) |
| Total | 994 (62.7%) | 591 (37.3%) |
Housing Structures by Number of Rooms in Alvarado
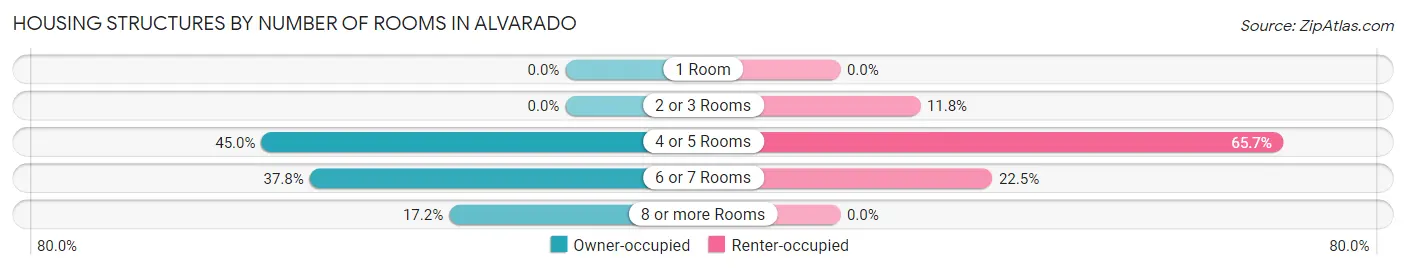
| Number of Rooms | Owner-occupied | Renter-occupied |
| 1 Room | 0 (0.0%) | 0 (0.0%) |
| 2 or 3 Rooms | 0 (0.0%) | 70 (11.8%) |
| 4 or 5 Rooms | 447 (45.0%) | 388 (65.6%) |
| 6 or 7 Rooms | 376 (37.8%) | 133 (22.5%) |
| 8 or more Rooms | 171 (17.2%) | 0 (0.0%) |
| Total | 994 (100.0%) | 591 (100.0%) |
Housing Structure by Heating Type in Alvarado
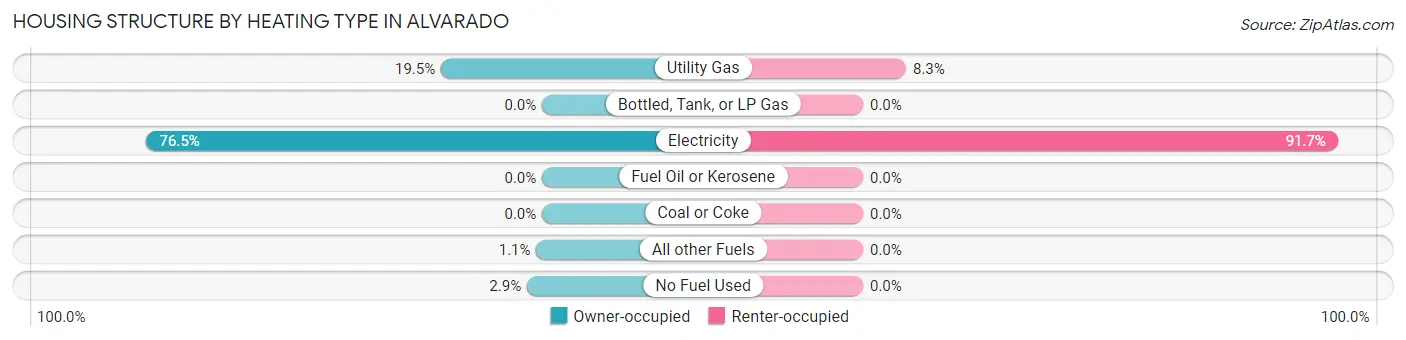
| Heating Type | Owner-occupied | Renter-occupied |
| Utility Gas | 194 (19.5%) | 49 (8.3%) |
| Bottled, Tank, or LP Gas | 0 (0.0%) | 0 (0.0%) |
| Electricity | 760 (76.5%) | 542 (91.7%) |
| Fuel Oil or Kerosene | 0 (0.0%) | 0 (0.0%) |
| Coal or Coke | 0 (0.0%) | 0 (0.0%) |
| All other Fuels | 11 (1.1%) | 0 (0.0%) |
| No Fuel Used | 29 (2.9%) | 0 (0.0%) |
| Total | 994 (100.0%) | 591 (100.0%) |
Household Vehicle Usage in Alvarado
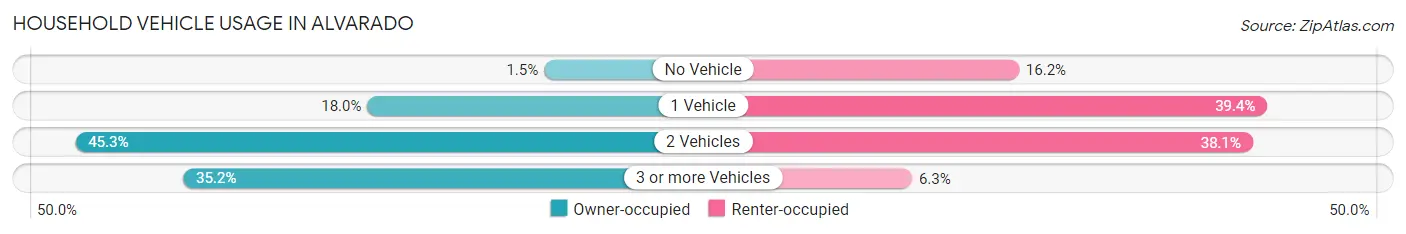
| Vehicles per Household | Owner-occupied | Renter-occupied |
| No Vehicle | 15 (1.5%) | 96 (16.2%) |
| 1 Vehicle | 179 (18.0%) | 233 (39.4%) |
| 2 Vehicles | 450 (45.3%) | 225 (38.1%) |
| 3 or more Vehicles | 350 (35.2%) | 37 (6.3%) |
| Total | 994 (100.0%) | 591 (100.0%) |
Real Estate & Mortgages in Alvarado
Real Estate and Mortgage Overview in Alvarado
| Characteristic | Without Mortgage | With Mortgage |
| Housing Units | 276 | 718 |
| Median Property Value | $89,800 | $196,600 |
| Median Household Income | $77,250 | $148 |
| Monthly Housing Costs | $426 | $0 |
| Real Estate Taxes | $1,526 | $0 |
Property Value by Mortgage Status in Alvarado
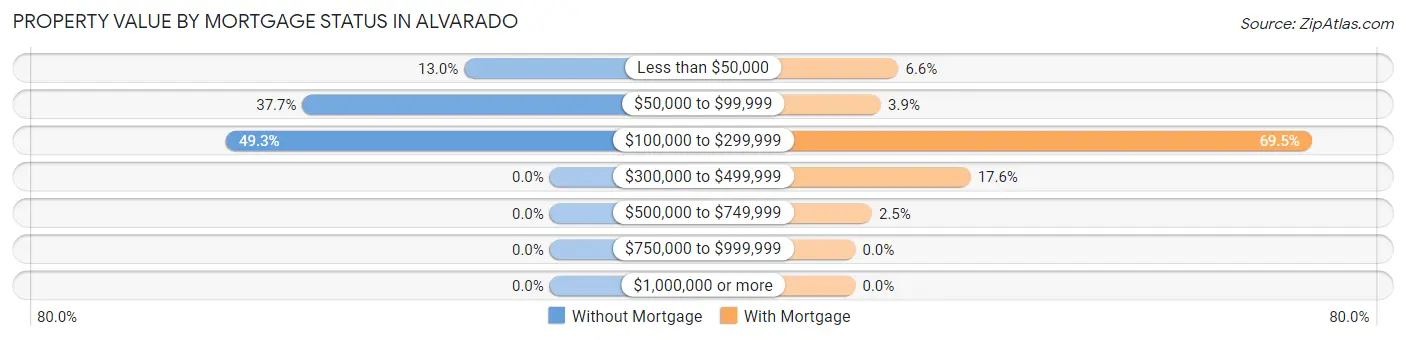
| Property Value | Without Mortgage | With Mortgage |
| Less than $50,000 | 36 (13.0%) | 47 (6.6%) |
| $50,000 to $99,999 | 104 (37.7%) | 28 (3.9%) |
| $100,000 to $299,999 | 136 (49.3%) | 499 (69.5%) |
| $300,000 to $499,999 | 0 (0.0%) | 126 (17.5%) |
| $500,000 to $749,999 | 0 (0.0%) | 18 (2.5%) |
| $750,000 to $999,999 | 0 (0.0%) | 0 (0.0%) |
| $1,000,000 or more | 0 (0.0%) | 0 (0.0%) |
| Total | 276 (100.0%) | 718 (100.0%) |
Household Income by Mortgage Status in Alvarado
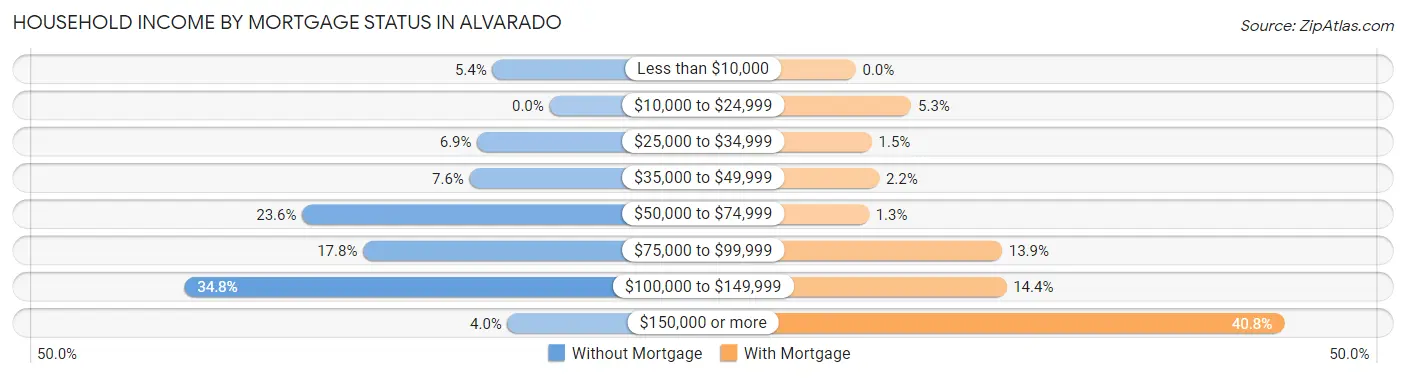
| Household Income | Without Mortgage | With Mortgage |
| Less than $10,000 | 15 (5.4%) | 0 (0.0%) |
| $10,000 to $24,999 | 0 (0.0%) | 38 (5.3%) |
| $25,000 to $34,999 | 19 (6.9%) | 11 (1.5%) |
| $35,000 to $49,999 | 21 (7.6%) | 16 (2.2%) |
| $50,000 to $74,999 | 65 (23.5%) | 9 (1.3%) |
| $75,000 to $99,999 | 49 (17.7%) | 100 (13.9%) |
| $100,000 to $149,999 | 96 (34.8%) | 103 (14.3%) |
| $150,000 or more | 11 (4.0%) | 293 (40.8%) |
| Total | 276 (100.0%) | 718 (100.0%) |
Property Value to Household Income Ratio in Alvarado
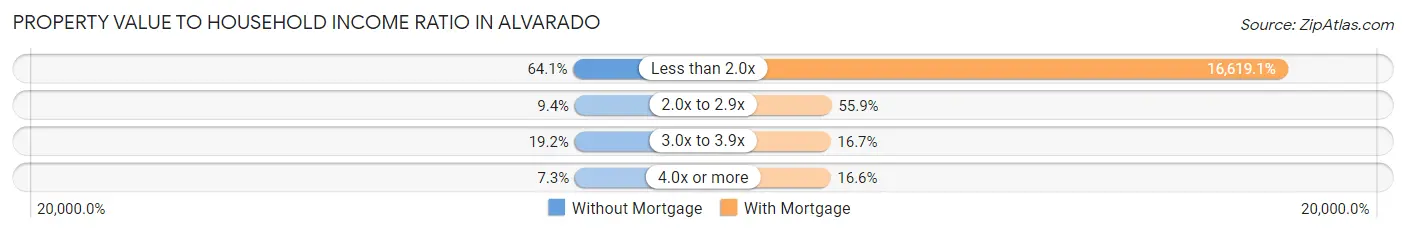
| Value-to-Income Ratio | Without Mortgage | With Mortgage |
| Less than 2.0x | 177 (64.1%) | 119,325 (16,619.1%) |
| 2.0x to 2.9x | 26 (9.4%) | 401 (55.8%) |
| 3.0x to 3.9x | 53 (19.2%) | 120 (16.7%) |
| 4.0x or more | 20 (7.2%) | 119 (16.6%) |
| Total | 276 (100.0%) | 718 (100.0%) |
Real Estate Taxes by Mortgage Status in Alvarado
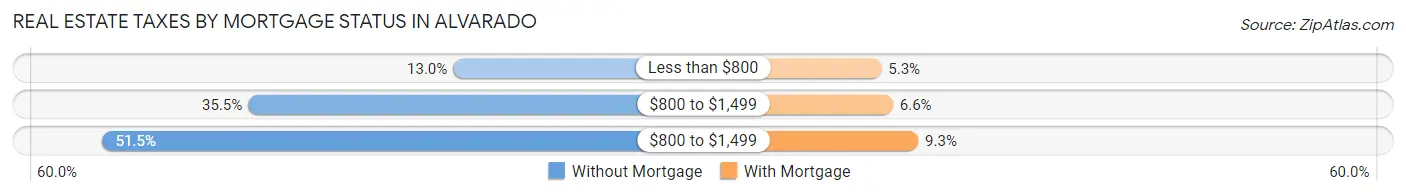
| Property Taxes | Without Mortgage | With Mortgage |
| Less than $800 | 36 (13.0%) | 38 (5.3%) |
| $800 to $1,499 | 98 (35.5%) | 47 (6.6%) |
| $800 to $1,499 | 142 (51.4%) | 67 (9.3%) |
| Total | 276 (100.0%) | 718 (100.0%) |
Health & Disability in Alvarado
Health Insurance Coverage by Age in Alvarado
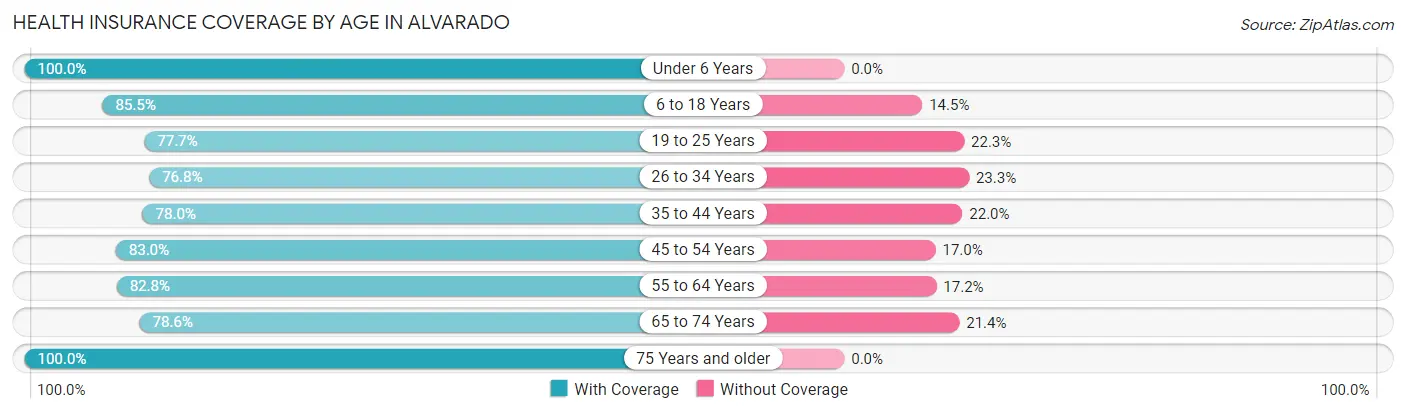
| Age Bracket | With Coverage | Without Coverage |
| Under 6 Years | 563 (100.0%) | 0 (0.0%) |
| 6 to 18 Years | 788 (85.5%) | 134 (14.5%) |
| 19 to 25 Years | 525 (77.7%) | 151 (22.3%) |
| 26 to 34 Years | 505 (76.7%) | 153 (23.3%) |
| 35 to 44 Years | 294 (78.0%) | 83 (22.0%) |
| 45 to 54 Years | 736 (83.0%) | 151 (17.0%) |
| 55 to 64 Years | 241 (82.8%) | 50 (17.2%) |
| 65 to 74 Years | 381 (78.6%) | 104 (21.4%) |
| 75 Years and older | 140 (100.0%) | 0 (0.0%) |
| Total | 4,173 (83.5%) | 826 (16.5%) |
Health Insurance Coverage by Citizenship Status in Alvarado
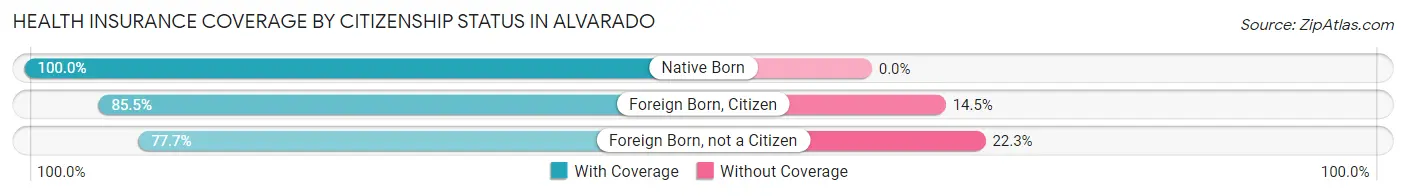
| Citizenship Status | With Coverage | Without Coverage |
| Native Born | 563 (100.0%) | 0 (0.0%) |
| Foreign Born, Citizen | 788 (85.5%) | 134 (14.5%) |
| Foreign Born, not a Citizen | 525 (77.7%) | 151 (22.3%) |
Health Insurance Coverage by Household Income in Alvarado
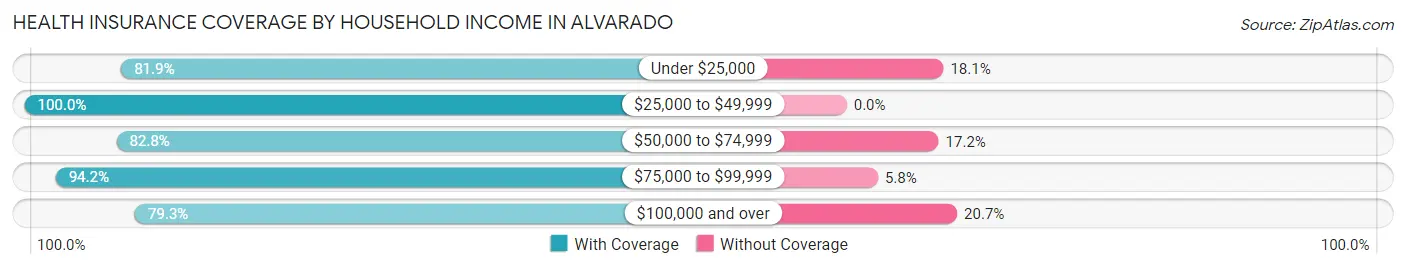
| Household Income | With Coverage | Without Coverage |
| Under $25,000 | 303 (81.9%) | 67 (18.1%) |
| $25,000 to $49,999 | 322 (100.0%) | 0 (0.0%) |
| $50,000 to $74,999 | 1,020 (82.8%) | 212 (17.2%) |
| $75,000 to $99,999 | 564 (94.2%) | 35 (5.8%) |
| $100,000 and over | 1,964 (79.3%) | 512 (20.7%) |
Public vs Private Health Insurance Coverage by Age in Alvarado
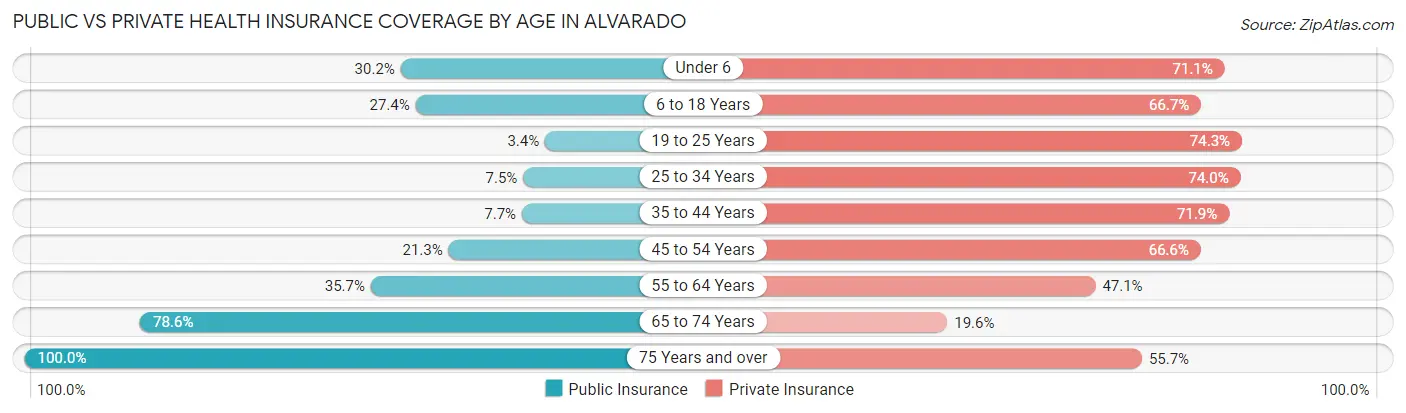
| Age Bracket | Public Insurance | Private Insurance |
| Under 6 | 170 (30.2%) | 400 (71.1%) |
| 6 to 18 Years | 253 (27.4%) | 615 (66.7%) |
| 19 to 25 Years | 23 (3.4%) | 502 (74.3%) |
| 25 to 34 Years | 49 (7.4%) | 487 (74.0%) |
| 35 to 44 Years | 29 (7.7%) | 271 (71.9%) |
| 45 to 54 Years | 189 (21.3%) | 591 (66.6%) |
| 55 to 64 Years | 104 (35.7%) | 137 (47.1%) |
| 65 to 74 Years | 381 (78.6%) | 95 (19.6%) |
| 75 Years and over | 140 (100.0%) | 78 (55.7%) |
| Total | 1,338 (26.8%) | 3,176 (63.5%) |
Disability Status by Sex by Age in Alvarado
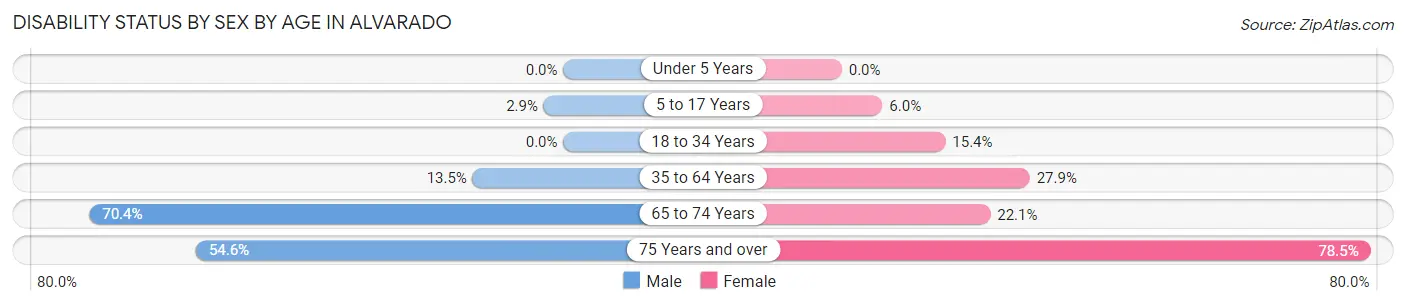
| Age Bracket | Male | Female |
| Under 5 Years | 0 (0.0%) | 0 (0.0%) |
| 5 to 17 Years | 17 (2.9%) | 28 (6.0%) |
| 18 to 34 Years | 0 (0.0%) | 122 (15.4%) |
| 35 to 64 Years | 110 (13.5%) | 206 (27.9%) |
| 65 to 74 Years | 252 (70.4%) | 28 (22.1%) |
| 75 Years and over | 18 (54.5%) | 84 (78.5%) |
Disability Class by Sex by Age in Alvarado
Disability Class: Hearing Difficulty
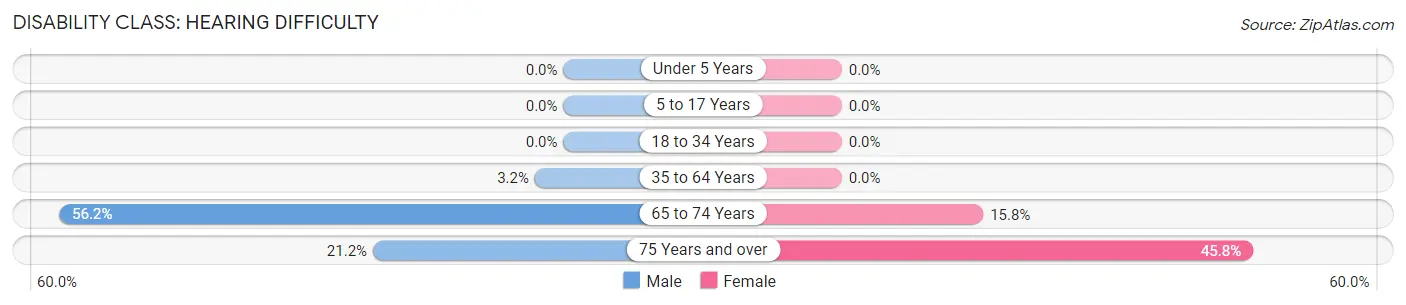
| Age Bracket | Male | Female |
| Under 5 Years | 0 (0.0%) | 0 (0.0%) |
| 5 to 17 Years | 0 (0.0%) | 0 (0.0%) |
| 18 to 34 Years | 0 (0.0%) | 0 (0.0%) |
| 35 to 64 Years | 26 (3.2%) | 0 (0.0%) |
| 65 to 74 Years | 201 (56.1%) | 20 (15.8%) |
| 75 Years and over | 7 (21.2%) | 49 (45.8%) |
Disability Class: Vision Difficulty
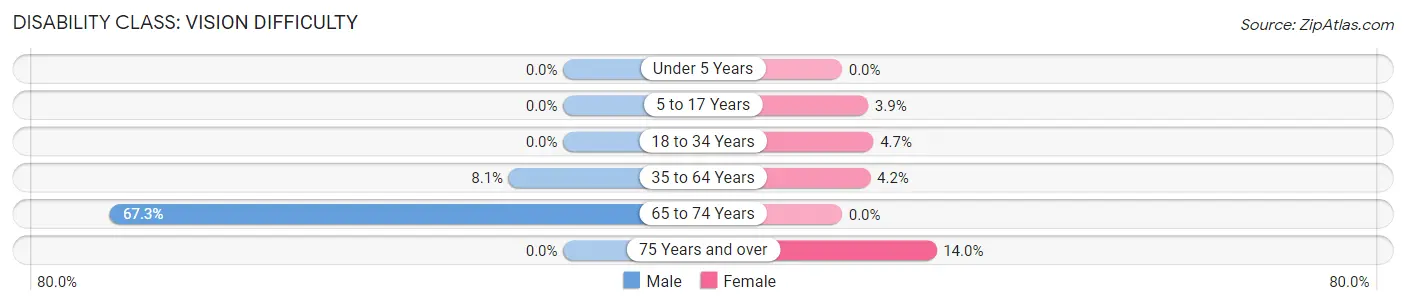
| Age Bracket | Male | Female |
| Under 5 Years | 0 (0.0%) | 0 (0.0%) |
| 5 to 17 Years | 0 (0.0%) | 18 (3.9%) |
| 18 to 34 Years | 0 (0.0%) | 37 (4.7%) |
| 35 to 64 Years | 66 (8.1%) | 31 (4.2%) |
| 65 to 74 Years | 241 (67.3%) | 0 (0.0%) |
| 75 Years and over | 0 (0.0%) | 15 (14.0%) |
Disability Class: Cognitive Difficulty
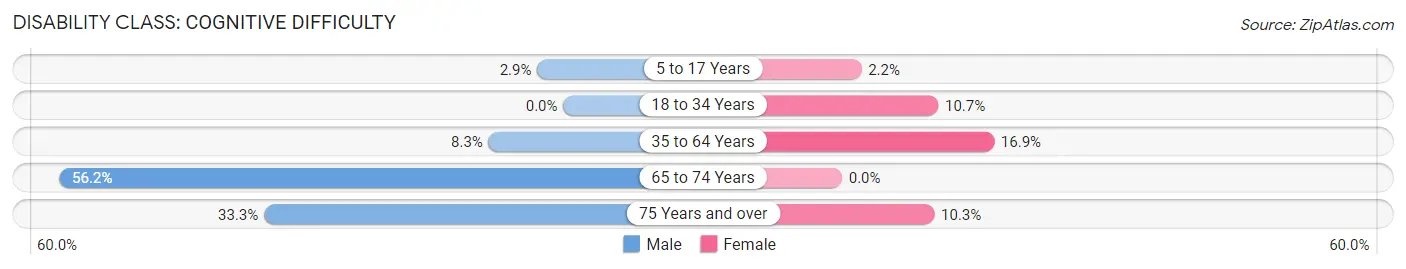
| Age Bracket | Male | Female |
| 5 to 17 Years | 17 (2.9%) | 10 (2.2%) |
| 18 to 34 Years | 0 (0.0%) | 85 (10.7%) |
| 35 to 64 Years | 68 (8.3%) | 125 (16.9%) |
| 65 to 74 Years | 201 (56.1%) | 0 (0.0%) |
| 75 Years and over | 11 (33.3%) | 11 (10.3%) |
Disability Class: Ambulatory Difficulty
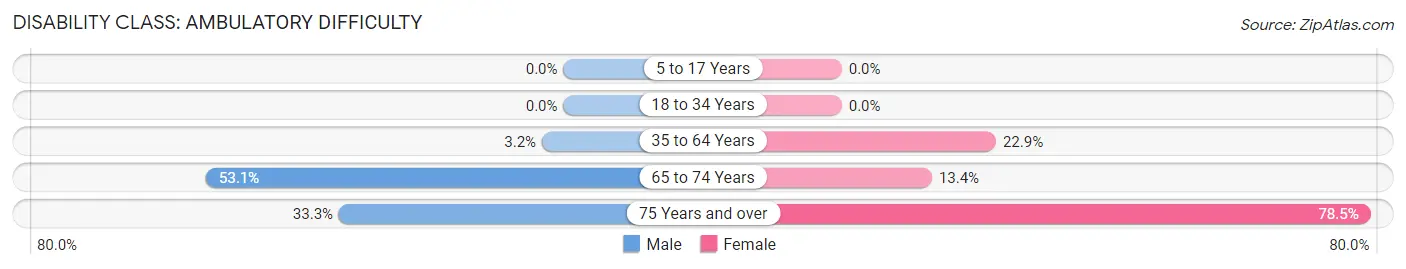
| Age Bracket | Male | Female |
| 5 to 17 Years | 0 (0.0%) | 0 (0.0%) |
| 18 to 34 Years | 0 (0.0%) | 0 (0.0%) |
| 35 to 64 Years | 26 (3.2%) | 169 (22.9%) |
| 65 to 74 Years | 190 (53.1%) | 17 (13.4%) |
| 75 Years and over | 11 (33.3%) | 84 (78.5%) |
Disability Class: Self-Care Difficulty
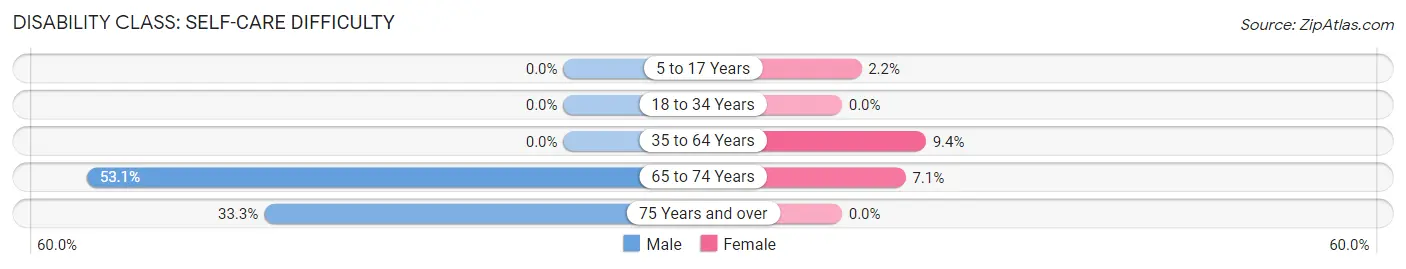
| Age Bracket | Male | Female |
| 5 to 17 Years | 0 (0.0%) | 10 (2.2%) |
| 18 to 34 Years | 0 (0.0%) | 0 (0.0%) |
| 35 to 64 Years | 0 (0.0%) | 69 (9.3%) |
| 65 to 74 Years | 190 (53.1%) | 9 (7.1%) |
| 75 Years and over | 11 (33.3%) | 0 (0.0%) |
Technology Access in Alvarado
Computing Device Access in Alvarado
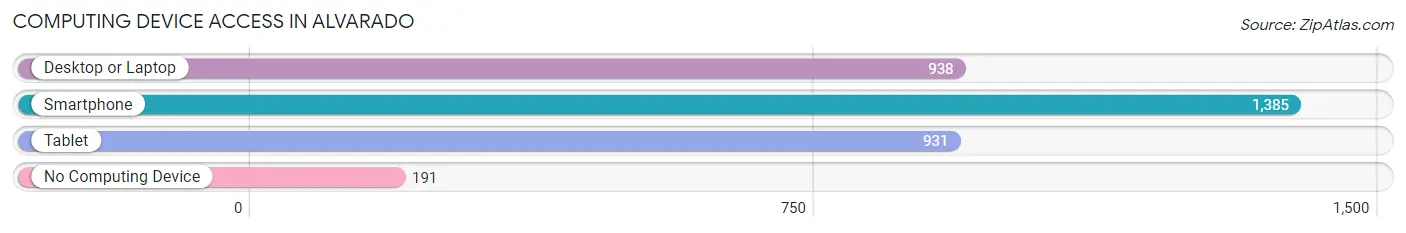
| Device Type | # Households | % Households |
| Desktop or Laptop | 938 | 59.2% |
| Smartphone | 1,385 | 87.4% |
| Tablet | 931 | 58.7% |
| No Computing Device | 191 | 12.0% |
| Total | 1,585 | 100.0% |
Internet Access in Alvarado
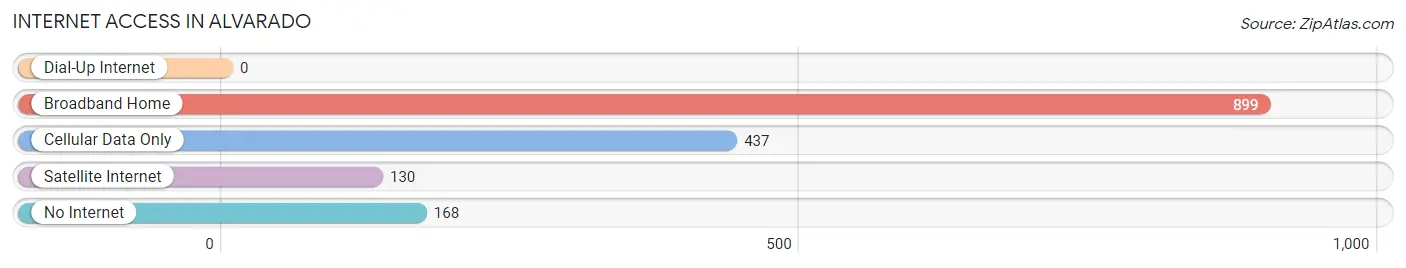
| Internet Type | # Households | % Households |
| Dial-Up Internet | 0 | 0.0% |
| Broadband Home | 899 | 56.7% |
| Cellular Data Only | 437 | 27.6% |
| Satellite Internet | 130 | 8.2% |
| No Internet | 168 | 10.6% |
| Total | 1,585 | 100.0% |
Alvarado Summary
Alvarado, Texas is a small city located in Johnson County, Texas, United States. It is situated about 25 miles south of Fort Worth and about 20 miles northwest of Dallas. The city has a population of approximately 5,000 people and is part of the Dallas-Fort Worth-Arlington metropolitan area.
History
Alvarado was founded in 1848 by a group of settlers from Kentucky and Tennessee. The town was named after the Mexican General, Juan Alvarado, who fought in the Texas Revolution. The town was originally a stop on the Texas and Pacific Railway, and it quickly grew into a thriving community. In 1876, the town was incorporated and the first mayor was elected.
In the early 1900s, Alvarado was a major cotton-producing center. The town was also home to several cotton gins, a cottonseed oil mill, and a cottonseed huller. The town also had a number of stores, churches, and schools.
In the 1950s, Alvarado began to experience a decline in population as people moved away to larger cities. However, in the late 1970s, the town began to experience a resurgence as people began to move back to the area.
Geography
Alvarado is located in Johnson County, Texas, about 25 miles south of Fort Worth and about 20 miles northwest of Dallas. The city is situated on the banks of the Trinity River and is surrounded by rolling hills and wooded areas. The city has a total area of 4.2 square miles, all of which is land.
Economy
Alvarado’s economy is largely based on agriculture and manufacturing. The city is home to several large farms, which produce cotton, corn, wheat, and other crops. The city is also home to several manufacturing companies, which produce a variety of products, including furniture, clothing, and electronics.
The city is also home to several retail stores, restaurants, and other businesses. The city is served by the Alvarado Independent School District, which serves students in grades K-12.
Demographics
As of the 2010 census, Alvarado had a population of 5,000 people. The racial makeup of the city was 75.3% White, 11.2% African American, 0.7% Native American, 0.3% Asian, 0.1% Pacific Islander, 10.2% from other races, and 2.4% from two or more races. Hispanic or Latino of any race were 20.2% of the population.
The median income for a household in Alvarado was $37,500, and the median income for a family was $45,000. The per capita income for the city was $17,000. About 17.2% of families and 20.2% of the population were below the poverty line, including 28.2% of those under age 18 and 11.2% of those age 65 or over.
Alvarado is a small city with a rich history and a diverse population. The city is home to several farms and manufacturing companies, as well as a variety of retail stores, restaurants, and other businesses. The city is served by the Alvarado Independent School District, which serves students in grades K-12. The city has a population of approximately 5,000 people and is part of the Dallas-Fort Worth-Arlington metropolitan area.
Common Questions
What is Per Capita Income in Alvarado?
Per Capita income in Alvarado is $28,670.
What is the Median Family Income in Alvarado?
Median Family Income in Alvarado is $91,031.
What is the Median Household income in Alvarado?
Median Household Income in Alvarado is $86,083.
What is Income or Wage Gap in Alvarado?
Income or Wage Gap in Alvarado is 32.6%.
Women in Alvarado earn 67.4 cents for every dollar earned by a man.
What is Inequality or Gini Index in Alvarado?
Inequality or Gini Index in Alvarado is 0.34.
What is the Total Population of Alvarado?
Total Population of Alvarado is 5,107.
What is the Total Male Population of Alvarado?
Total Male Population of Alvarado is 2,523.
What is the Total Female Population of Alvarado?
Total Female Population of Alvarado is 2,584.
What is the Ratio of Males per 100 Females in Alvarado?
There are 97.64 Males per 100 Females in Alvarado.
What is the Ratio of Females per 100 Males in Alvarado?
There are 102.42 Females per 100 Males in Alvarado.
What is the Median Population Age in Alvarado?
Median Population Age in Alvarado is 32.0 Years.
What is the Average Family Size in Alvarado
Average Family Size in Alvarado is 3.4 People.
What is the Average Household Size in Alvarado
Average Household Size in Alvarado is 3.1 People.
How Large is the Labor Force in Alvarado?
There are 2,396 People in the Labor Forcein in Alvarado.
What is the Percentage of People in the Labor Force in Alvarado?
62.5% of People are in the Labor Force in Alvarado.
What is the Unemployment Rate in Alvarado?
Unemployment Rate in Alvarado is 1.3%.