Albany, TX Map & Demographics
Albany Map
Albany Overview
$31,189
PER CAPITA INCOME
$65,278
AVG FAMILY INCOME
$48,182
AVG HOUSEHOLD INCOME
31.9%
WAGE / INCOME GAP [ % ]
68.1¢/ $1
WAGE / INCOME GAP [ $ ]
0.47
INEQUALITY / GINI INDEX
1,644
TOTAL POPULATION
820
MALE POPULATION
824
FEMALE POPULATION
99.51
MALES / 100 FEMALES
100.49
FEMALES / 100 MALES
44.1
MEDIAN AGE
2.9
AVG FAMILY SIZE
2.3
AVG HOUSEHOLD SIZE
849
LABOR FORCE [ PEOPLE ]
62.3%
PERCENT IN LABOR FORCE
11.7%
UNEMPLOYMENT RATE
Albany Zip Codes
Albany Area Codes
Income in Albany
Income Overview in Albany
Per Capita Income in Albany is $31,189, while median incomes of families and households are $65,278 and $48,182 respectively.
| Characteristic | Number | Measure |
| Per Capita Income | 1,644 | $31,189 |
| Median Family Income | 438 | $65,278 |
| Mean Family Income | 438 | $89,261 |
| Median Household Income | 694 | $48,182 |
| Mean Household Income | 694 | $69,188 |
| Income Deficit | 438 | $0 |
| Wage / Income Gap (%) | 1,644 | 31.95% |
| Wage / Income Gap ($) | 1,644 | 68.05¢ per $1 |
| Gini / Inequality Index | 1,644 | 0.47 |
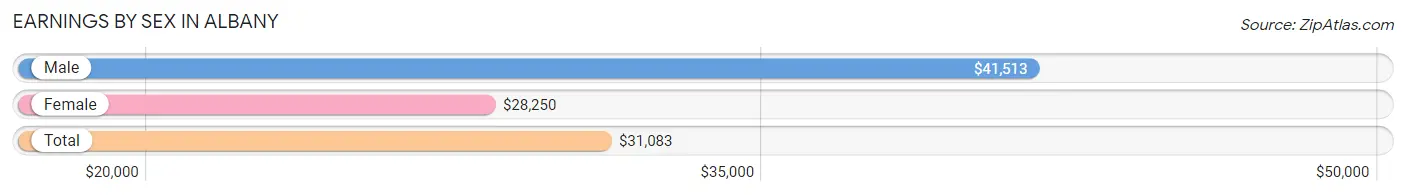
Earnings by Sex in Albany
Average Earnings in Albany are $31,083, $41,513 for men and $28,250 for women, a difference of 32.0%.
| Sex | Number | Average Earnings |
| Male | 490 (52.4%) | $41,513 |
| Female | 445 (47.6%) | $28,250 |
| Total | 935 (100.0%) | $31,083 |
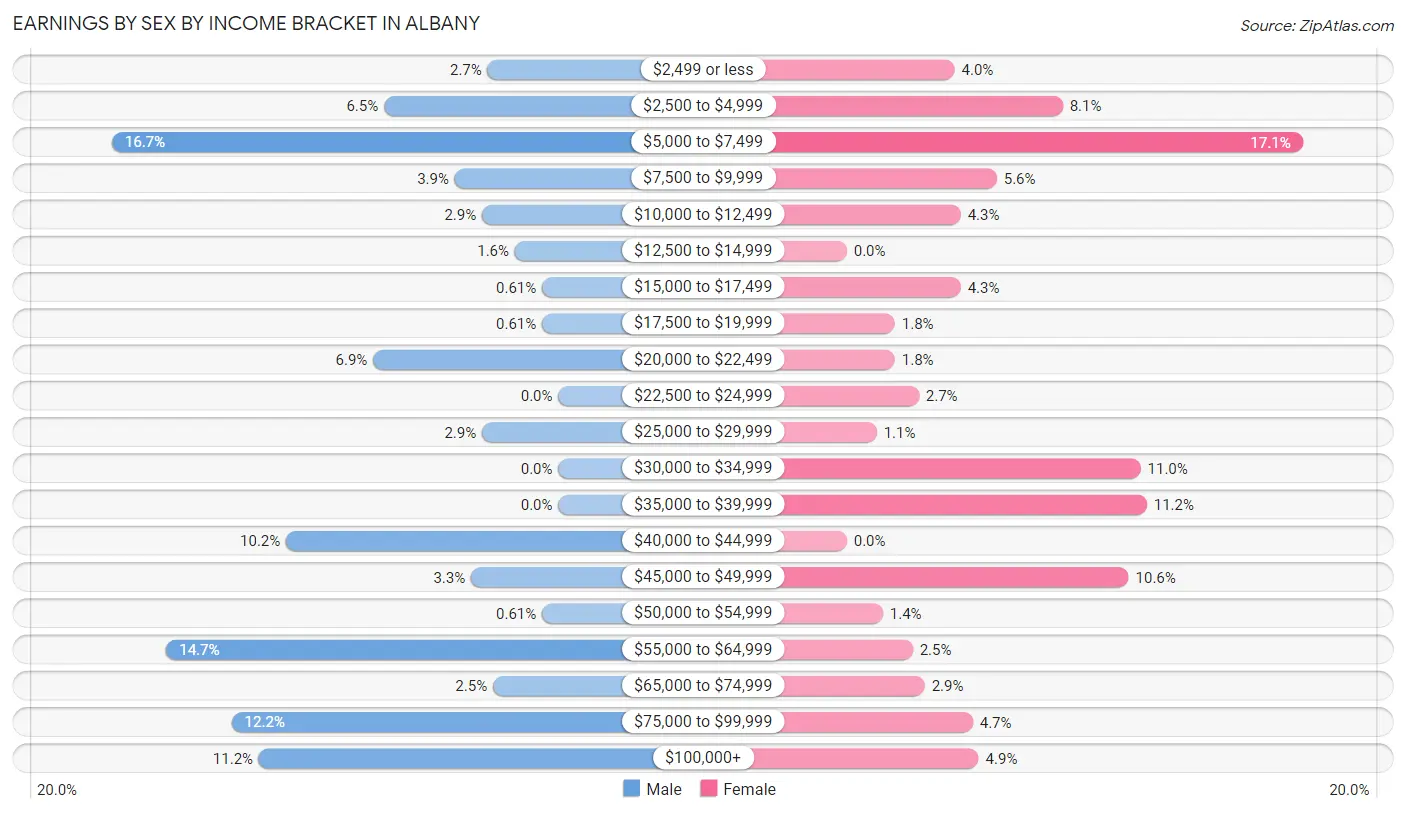
Earnings by Sex by Income Bracket in Albany
The most common earnings brackets in Albany are $5,000 to $7,499 for men (82 | 16.7%) and $5,000 to $7,499 for women (76 | 17.1%).
| Income | Male | Female |
| $2,499 or less | 13 (2.6%) | 18 (4.0%) |
| $2,500 to $4,999 | 32 (6.5%) | 36 (8.1%) |
| $5,000 to $7,499 | 82 (16.7%) | 76 (17.1%) |
| $7,500 to $9,999 | 19 (3.9%) | 25 (5.6%) |
| $10,000 to $12,499 | 14 (2.9%) | 19 (4.3%) |
| $12,500 to $14,999 | 8 (1.6%) | 0 (0.0%) |
| $15,000 to $17,499 | 3 (0.6%) | 19 (4.3%) |
| $17,500 to $19,999 | 3 (0.6%) | 8 (1.8%) |
| $20,000 to $22,499 | 34 (6.9%) | 8 (1.8%) |
| $22,500 to $24,999 | 0 (0.0%) | 12 (2.7%) |
| $25,000 to $29,999 | 14 (2.9%) | 5 (1.1%) |
| $30,000 to $34,999 | 0 (0.0%) | 49 (11.0%) |
| $35,000 to $39,999 | 0 (0.0%) | 50 (11.2%) |
| $40,000 to $44,999 | 50 (10.2%) | 0 (0.0%) |
| $45,000 to $49,999 | 16 (3.3%) | 47 (10.6%) |
| $50,000 to $54,999 | 3 (0.6%) | 6 (1.3%) |
| $55,000 to $64,999 | 72 (14.7%) | 11 (2.5%) |
| $65,000 to $74,999 | 12 (2.5%) | 13 (2.9%) |
| $75,000 to $99,999 | 60 (12.2%) | 21 (4.7%) |
| $100,000+ | 55 (11.2%) | 22 (4.9%) |
| Total | 490 (100.0%) | 445 (100.0%) |
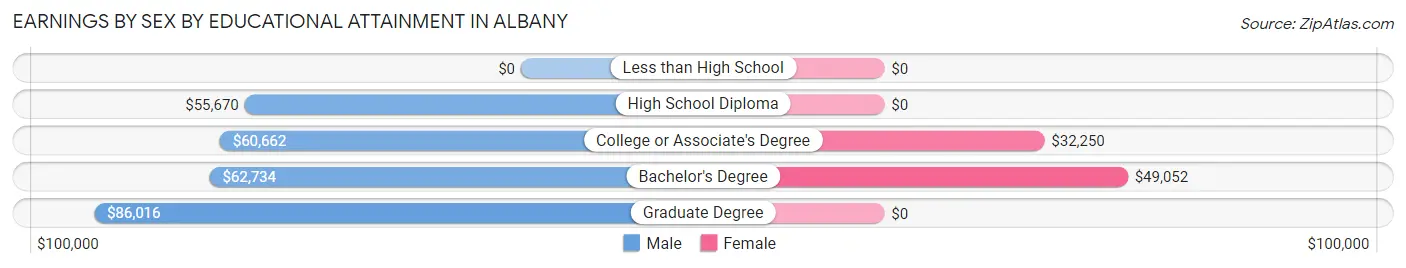
Earnings by Sex by Educational Attainment in Albany
Average earnings in Albany are $58,750 for men and $31,778 for women, a difference of 45.9%. Men with an educational attainment of graduate degree enjoy the highest average annual earnings of $86,016, while those with high school diploma education earn the least with $55,670. Women with an educational attainment of bachelor's degree earn the most with the average annual earnings of $49,052, while those with college or associate's degree education have the smallest earnings of $32,250.
| Educational Attainment | Male Income | Female Income |
| Less than High School | - | - |
| High School Diploma | $55,670 | $0 |
| College or Associate's Degree | $60,662 | $32,250 |
| Bachelor's Degree | $62,734 | $49,052 |
| Graduate Degree | $86,016 | $0 |
| Total | $58,750 | $31,778 |
Family Income in Albany
Family Income Brackets in Albany
According to the Albany family income data, there are 90 families falling into the $50,000 to $74,999 income range, which is the most common income bracket and makes up 20.5% of all families. Conversely, the $10,000 to $14,999 income bracket is the least frequent group with only 5 families (1.1%) belonging to this category.
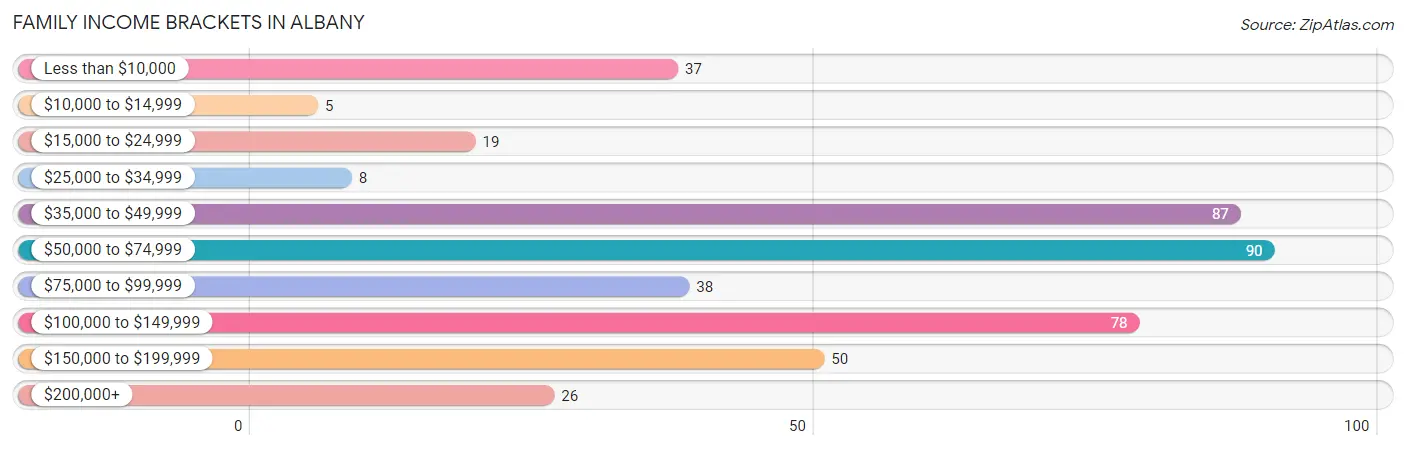
| Income Bracket | # Families | % Families |
| Less than $10,000 | 37 | 8.4% |
| $10,000 to $14,999 | 5 | 1.1% |
| $15,000 to $24,999 | 19 | 4.3% |
| $25,000 to $34,999 | 8 | 1.8% |
| $35,000 to $49,999 | 87 | 19.9% |
| $50,000 to $74,999 | 90 | 20.5% |
| $75,000 to $99,999 | 38 | 8.7% |
| $100,000 to $149,999 | 78 | 17.8% |
| $150,000 to $199,999 | 50 | 11.4% |
| $200,000+ | 26 | 5.9% |
Family Income by Famaliy Size in Albany
5-person families (47 | 10.7%) account for the highest median family income in Albany with $106,563 per family, while 2-person families (284 | 64.8%) have the highest median income of $24,659 per family member.
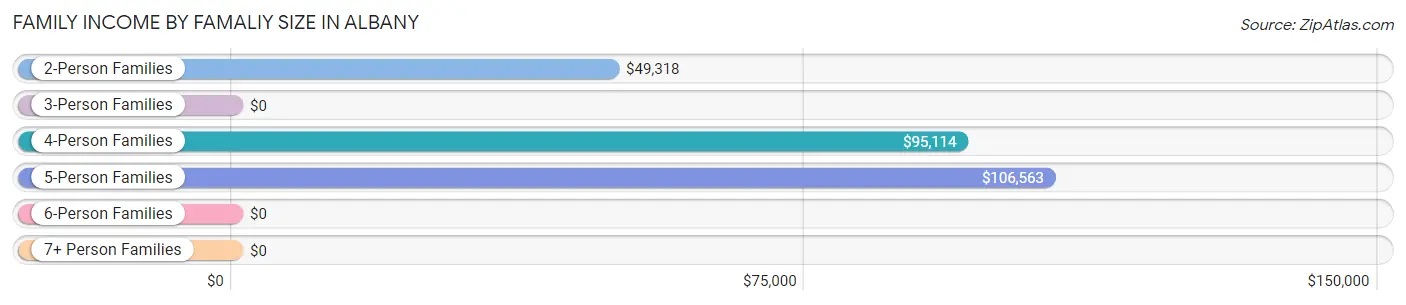
| Income Bracket | # Families | Median Income |
| 2-Person Families | 284 (64.8%) | $49,318 |
| 3-Person Families | 66 (15.1%) | $0 |
| 4-Person Families | 37 (8.5%) | $95,114 |
| 5-Person Families | 47 (10.7%) | $106,563 |
| 6-Person Families | 4 (0.9%) | $0 |
| 7+ Person Families | 0 (0.0%) | $0 |
| Total | 438 (100.0%) | $65,278 |
Family Income by Number of Earners in Albany
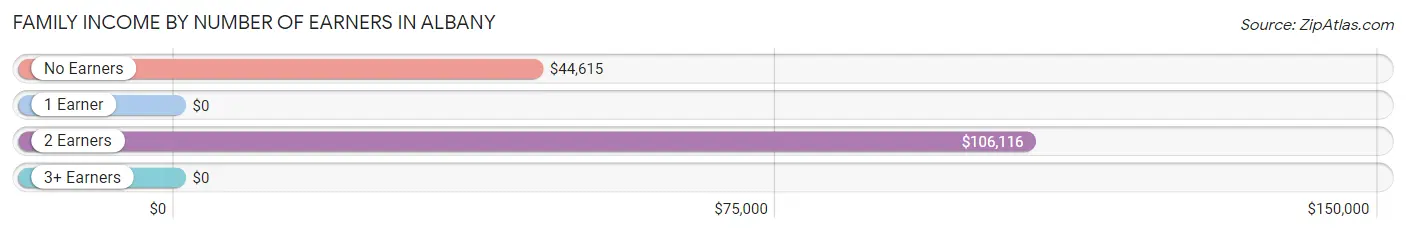
| Number of Earners | # Families | Median Income |
| No Earners | 110 (25.1%) | $44,615 |
| 1 Earner | 79 (18.0%) | $0 |
| 2 Earners | 193 (44.1%) | $106,116 |
| 3+ Earners | 56 (12.8%) | $0 |
| Total | 438 (100.0%) | $65,278 |
Household Income in Albany
Household Income Brackets in Albany
With 155 households falling in the category, the $35,000 to $49,999 income range is the most frequent in Albany, accounting for 22.3% of all households.
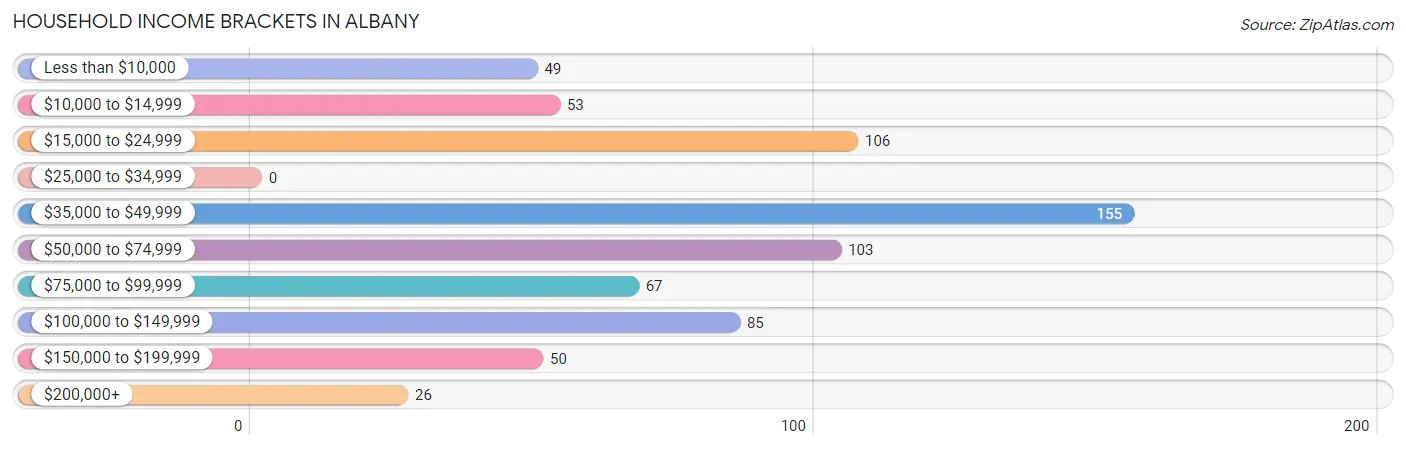
| Income Bracket | # Households | % Households |
| Less than $10,000 | 49 | 7.1% |
| $10,000 to $14,999 | 53 | 7.6% |
| $15,000 to $24,999 | 106 | 15.3% |
| $25,000 to $34,999 | 0 | 0.0% |
| $35,000 to $49,999 | 155 | 22.3% |
| $50,000 to $74,999 | 103 | 14.8% |
| $75,000 to $99,999 | 67 | 9.7% |
| $100,000 to $149,999 | 85 | 12.2% |
| $150,000 to $199,999 | 50 | 7.2% |
| $200,000+ | 26 | 3.7% |
Household Income by Householder Age in Albany
The median household income in Albany is $48,182, with the highest median household income of $62,500 found in the 45 to 64 years age bracket for the primary householder. A total of 176 households (25.4%) fall into this category. Meanwhile, the 15 to 24 years age bracket for the primary householder has the lowest median household income of $0, with 69 households (9.9%) in this group.
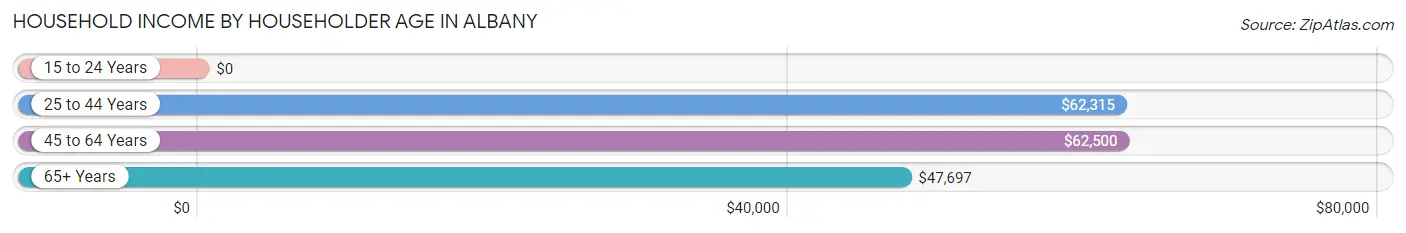
| Income Bracket | # Households | Median Income |
| 15 to 24 Years | 69 (9.9%) | $0 |
| 25 to 44 Years | 198 (28.5%) | $62,315 |
| 45 to 64 Years | 176 (25.4%) | $62,500 |
| 65+ Years | 251 (36.2%) | $47,697 |
| Total | 694 (100.0%) | $48,182 |
Poverty in Albany
Income Below Poverty by Sex and Age in Albany
With 12.1% poverty level for males and 20.5% for females among the residents of Albany, 16 and 17 year old males and 12 to 14 year old females are the most vulnerable to poverty, with 47 males (83.9%) and 11 females (100.0%) in their respective age groups living below the poverty level.
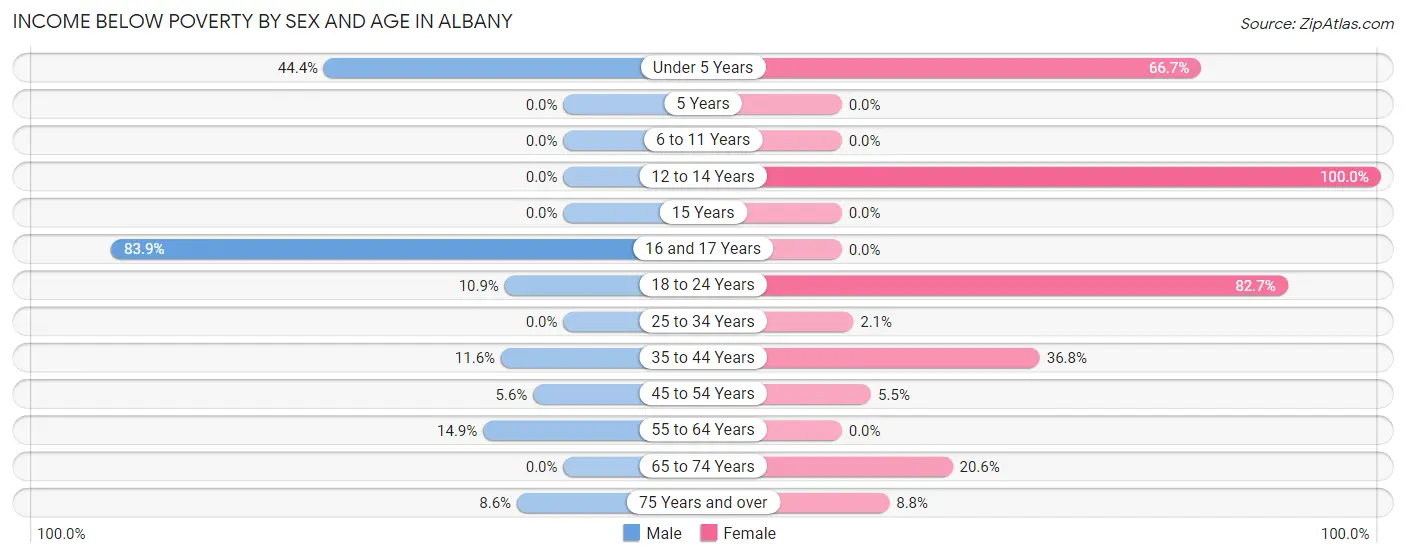
| Age Bracket | Male | Female |
| Under 5 Years | 12 (44.4%) | 22 (66.7%) |
| 5 Years | 0 (0.0%) | 0 (0.0%) |
| 6 to 11 Years | 0 (0.0%) | 0 (0.0%) |
| 12 to 14 Years | 0 (0.0%) | 11 (100.0%) |
| 15 Years | 0 (0.0%) | 0 (0.0%) |
| 16 and 17 Years | 47 (83.9%) | 0 (0.0%) |
| 18 to 24 Years | 11 (10.9%) | 67 (82.7%) |
| 25 to 34 Years | 0 (0.0%) | 2 (2.1%) |
| 35 to 44 Years | 8 (11.6%) | 25 (36.8%) |
| 45 to 54 Years | 7 (5.6%) | 6 (5.4%) |
| 55 to 64 Years | 7 (14.9%) | 0 (0.0%) |
| 65 to 74 Years | 0 (0.0%) | 30 (20.5%) |
| 75 Years and over | 5 (8.6%) | 6 (8.8%) |
| Total | 97 (12.1%) | 169 (20.5%) |
Income Above Poverty by Sex and Age in Albany
According to the poverty statistics in Albany, males aged 5 years and females aged 5 years are the age groups that are most secure financially, with 100.0% of males and 100.0% of females in these age groups living above the poverty line.
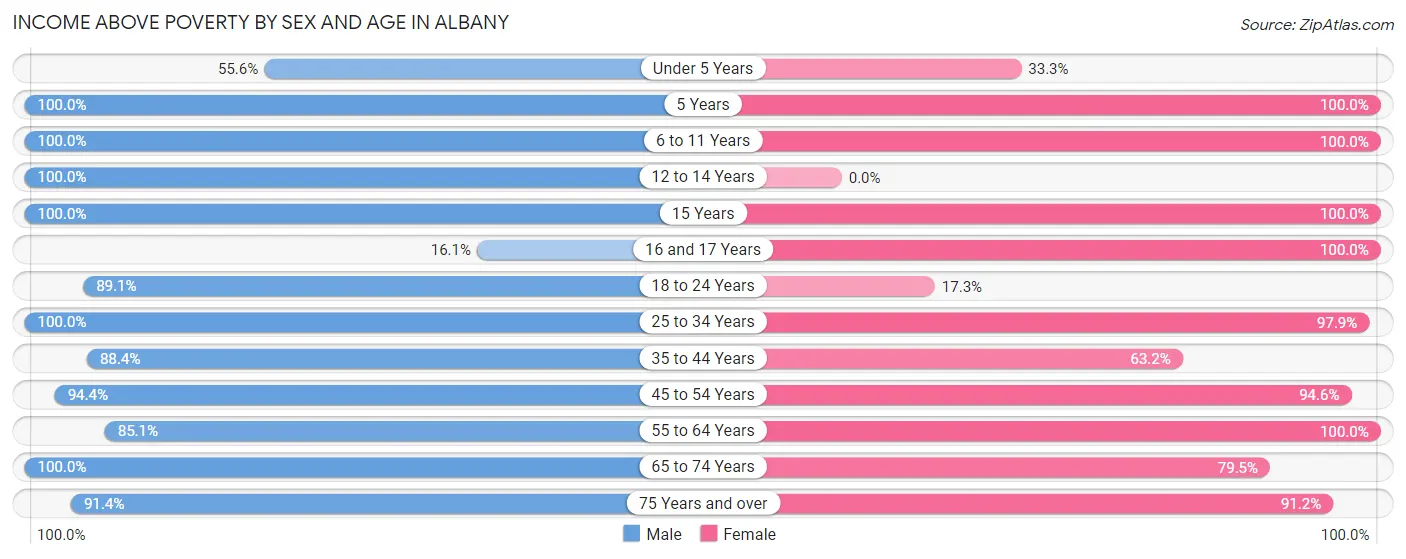
| Age Bracket | Male | Female |
| Under 5 Years | 15 (55.6%) | 11 (33.3%) |
| 5 Years | 36 (100.0%) | 5 (100.0%) |
| 6 to 11 Years | 22 (100.0%) | 76 (100.0%) |
| 12 to 14 Years | 3 (100.0%) | 0 (0.0%) |
| 15 Years | 52 (100.0%) | 17 (100.0%) |
| 16 and 17 Years | 9 (16.1%) | 8 (100.0%) |
| 18 to 24 Years | 90 (89.1%) | 14 (17.3%) |
| 25 to 34 Years | 74 (100.0%) | 92 (97.9%) |
| 35 to 44 Years | 61 (88.4%) | 43 (63.2%) |
| 45 to 54 Years | 118 (94.4%) | 104 (94.6%) |
| 55 to 64 Years | 40 (85.1%) | 107 (100.0%) |
| 65 to 74 Years | 129 (100.0%) | 116 (79.4%) |
| 75 Years and over | 53 (91.4%) | 62 (91.2%) |
| Total | 702 (87.9%) | 655 (79.5%) |
Income Below Poverty Among Married-Couple Families in Albany
The poverty statistics for married-couple families in Albany show that 3.6% or 13 of the total 362 families live below the poverty line. Families with 1 or 2 children have the highest poverty rate of 9.9%, comprising of 8 families. On the other hand, families with 3 or 4 children have the lowest poverty rate of 0.0%, which includes 0 families.
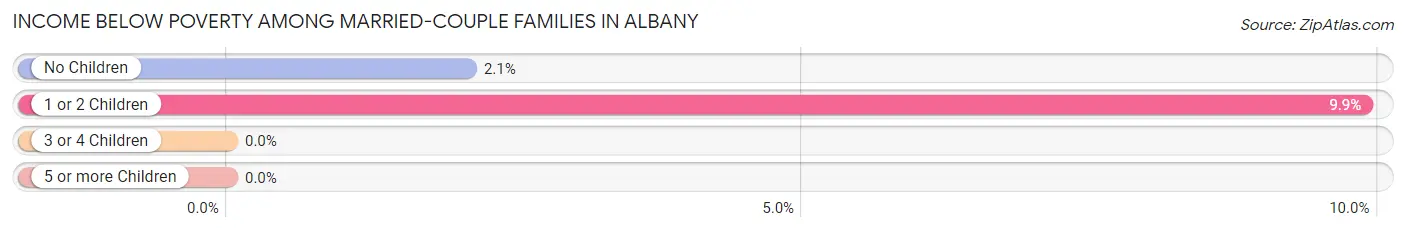
| Children | Above Poverty | Below Poverty |
| No Children | 235 (97.9%) | 5 (2.1%) |
| 1 or 2 Children | 73 (90.1%) | 8 (9.9%) |
| 3 or 4 Children | 41 (100.0%) | 0 (0.0%) |
| 5 or more Children | 0 (0.0%) | 0 (0.0%) |
| Total | 349 (96.4%) | 13 (3.6%) |
Income Below Poverty Among Single-Parent Households in Albany
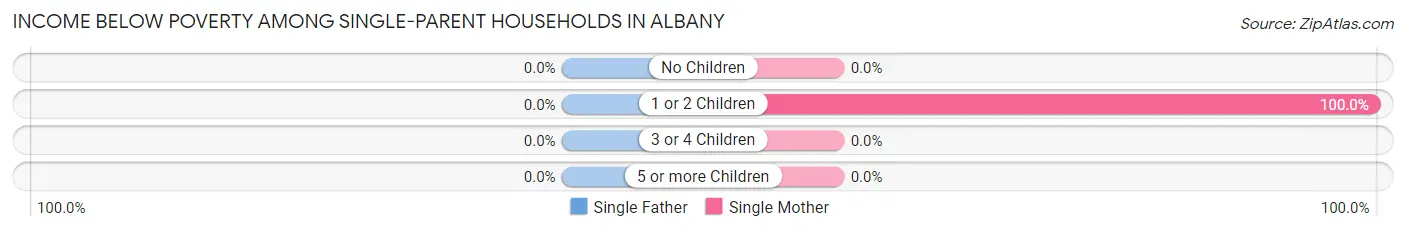
| Children | Single Father | Single Mother |
| No Children | 0 (0.0%) | 0 (0.0%) |
| 1 or 2 Children | 0 (0.0%) | 37 (100.0%) |
| 3 or 4 Children | 0 (0.0%) | 0 (0.0%) |
| 5 or more Children | 0 (0.0%) | 0 (0.0%) |
| Total | 0 (0.0%) | 37 (58.7%) |
Income Below Poverty Among Married-Couple vs Single-Parent Households in Albany
The poverty data for Albany shows that 13 of the married-couple family households (3.6%) and 37 of the single-parent households (48.7%) are living below the poverty level. Within the married-couple family households, those with 1 or 2 children have the highest poverty rate, with 8 households (9.9%) falling below the poverty line. Among the single-parent households, those with 1 or 2 children have the highest poverty rate, with 37 household (100.0%) living below poverty.
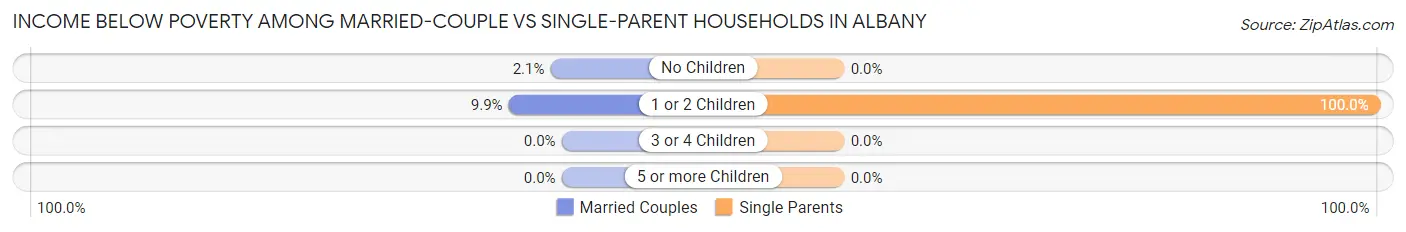
| Children | Married-Couple Families | Single-Parent Households |
| No Children | 5 (2.1%) | 0 (0.0%) |
| 1 or 2 Children | 8 (9.9%) | 37 (100.0%) |
| 3 or 4 Children | 0 (0.0%) | 0 (0.0%) |
| 5 or more Children | 0 (0.0%) | 0 (0.0%) |
| Total | 13 (3.6%) | 37 (48.7%) |
Race in Albany
The most populous races in Albany are White / Caucasian (1,396 | 84.9%), Hispanic or Latino (269 | 16.4%), and Two or more Races (129 | 7.9%).
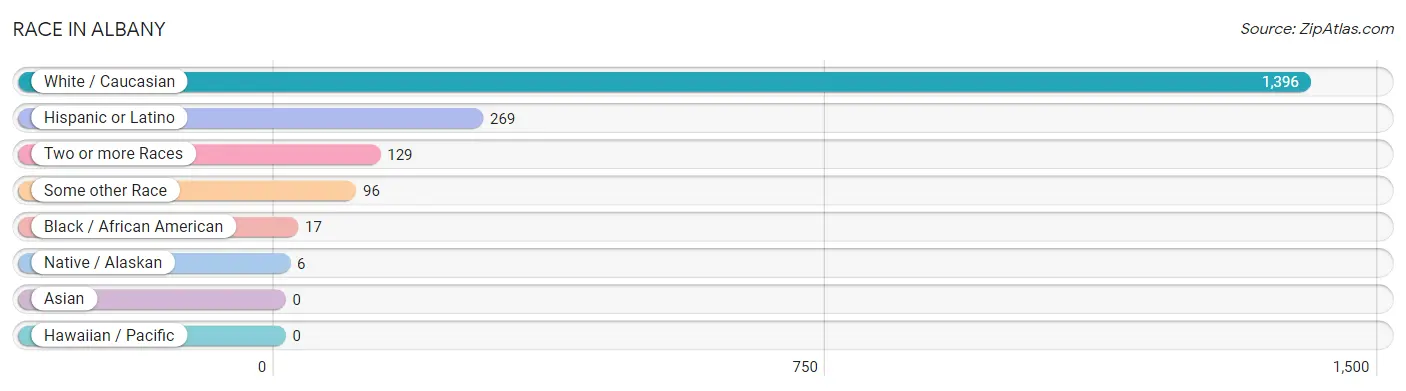
| Race | # Population | % Population |
| Asian | 0 | 0.0% |
| Black / African American | 17 | 1.0% |
| Hawaiian / Pacific | 0 | 0.0% |
| Hispanic or Latino | 269 | 16.4% |
| Native / Alaskan | 6 | 0.4% |
| White / Caucasian | 1,396 | 84.9% |
| Two or more Races | 129 | 7.9% |
| Some other Race | 96 | 5.8% |
| Total | 1,644 | 100.0% |
Ancestry in Albany
The most populous ancestries reported in Albany are Mexican (258 | 15.7%), American (219 | 13.3%), Irish (207 | 12.6%), German (155 | 9.4%), and English (128 | 7.8%), together accounting for 58.8% of all Albany residents.
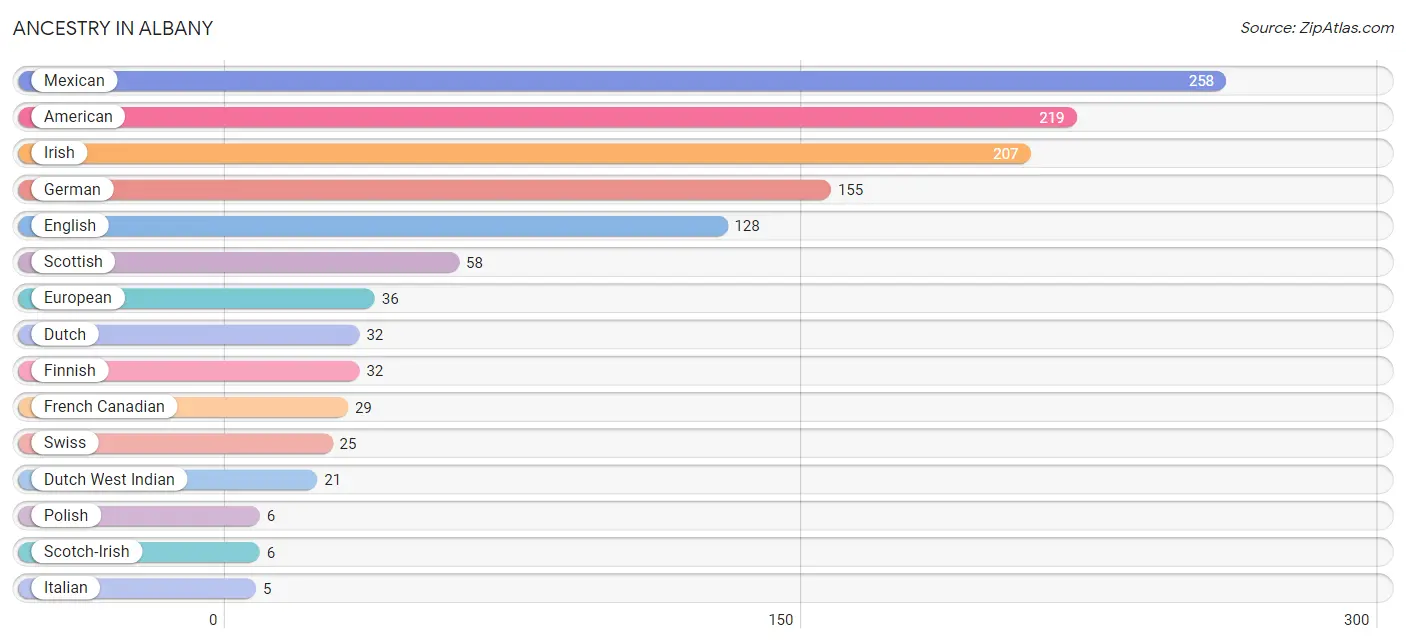
| Ancestry | # Population | % Population |
| American | 219 | 13.3% |
| Dutch | 32 | 1.9% |
| Dutch West Indian | 21 | 1.3% |
| English | 128 | 7.8% |
| European | 36 | 2.2% |
| Finnish | 32 | 1.9% |
| French Canadian | 29 | 1.8% |
| German | 155 | 9.4% |
| Irish | 207 | 12.6% |
| Italian | 5 | 0.3% |
| Mexican | 258 | 15.7% |
| Norwegian | 5 | 0.3% |
| Polish | 6 | 0.4% |
| Scotch-Irish | 6 | 0.4% |
| Scottish | 58 | 3.5% |
| Swedish | 5 | 0.3% |
| Swiss | 25 | 1.5% | View All 17 Rows |
Immigrants in Albany
The most numerous immigrant groups reported in Albany came from Central America (22 | 1.3%), Latin America (22 | 1.3%), and Mexico (22 | 1.3%), together accounting for 4.0% of all Albany residents.
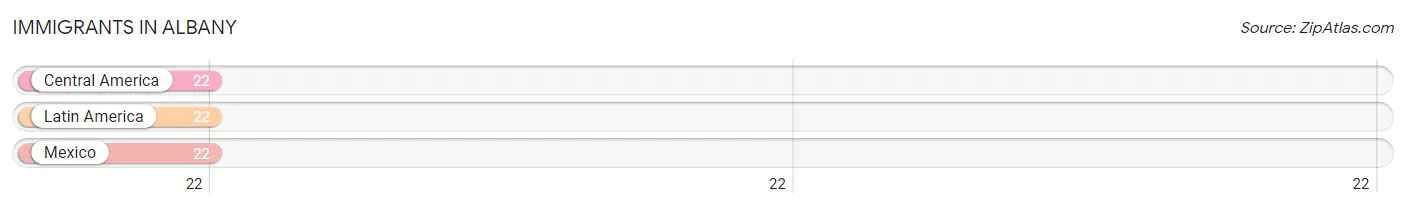
| Immigration Origin | # Population | % Population |
| Central America | 22 | 1.3% |
| Latin America | 22 | 1.3% |
| Mexico | 22 | 1.3% | View All 3 Rows |
Sex and Age in Albany
Sex and Age in Albany
The most populous age groups in Albany are 15 to 19 Years (145 | 17.7%) for men and 70 to 74 Years (83 | 10.1%) for women.
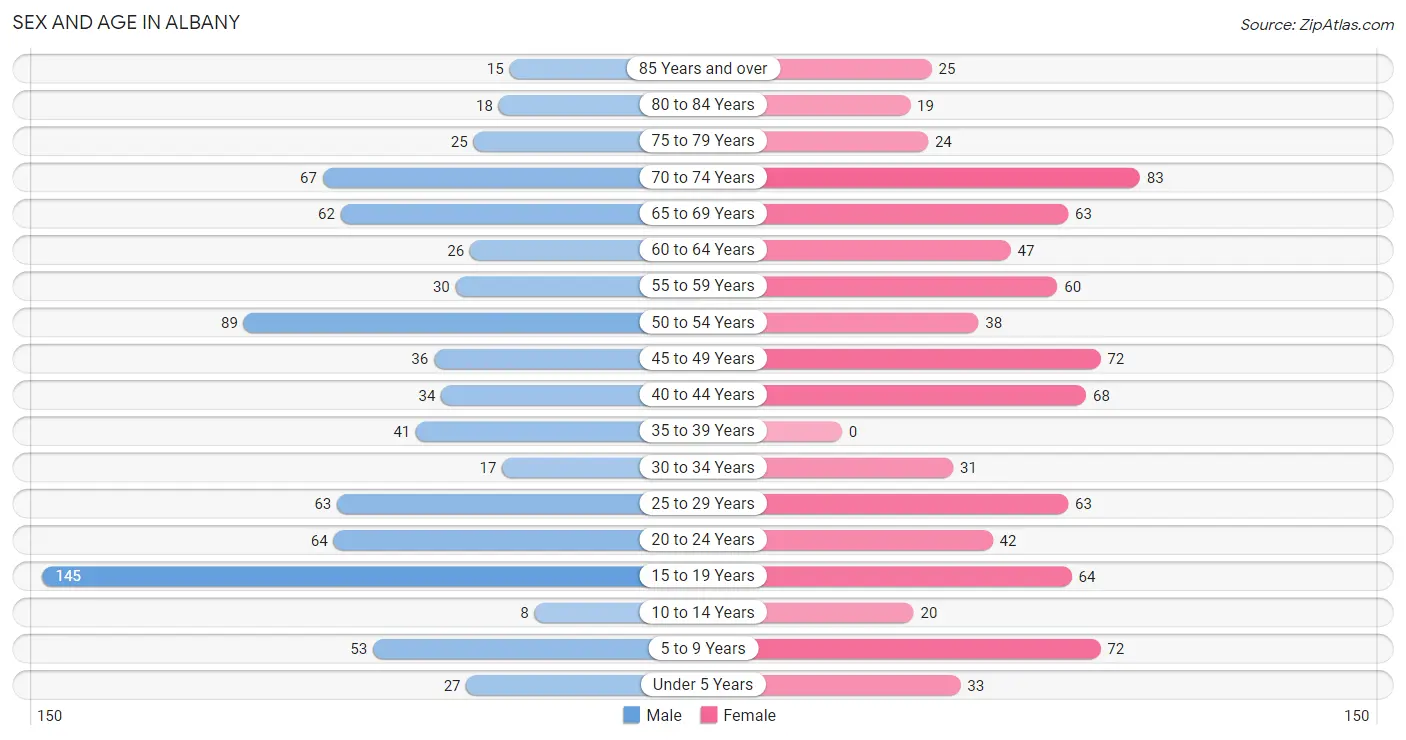
| Age Bracket | Male | Female |
| Under 5 Years | 27 (3.3%) | 33 (4.0%) |
| 5 to 9 Years | 53 (6.5%) | 72 (8.7%) |
| 10 to 14 Years | 8 (1.0%) | 20 (2.4%) |
| 15 to 19 Years | 145 (17.7%) | 64 (7.8%) |
| 20 to 24 Years | 64 (7.8%) | 42 (5.1%) |
| 25 to 29 Years | 63 (7.7%) | 63 (7.6%) |
| 30 to 34 Years | 17 (2.1%) | 31 (3.8%) |
| 35 to 39 Years | 41 (5.0%) | 0 (0.0%) |
| 40 to 44 Years | 34 (4.2%) | 68 (8.3%) |
| 45 to 49 Years | 36 (4.4%) | 72 (8.7%) |
| 50 to 54 Years | 89 (10.8%) | 38 (4.6%) |
| 55 to 59 Years | 30 (3.7%) | 60 (7.3%) |
| 60 to 64 Years | 26 (3.2%) | 47 (5.7%) |
| 65 to 69 Years | 62 (7.6%) | 63 (7.6%) |
| 70 to 74 Years | 67 (8.2%) | 83 (10.1%) |
| 75 to 79 Years | 25 (3.0%) | 24 (2.9%) |
| 80 to 84 Years | 18 (2.2%) | 19 (2.3%) |
| 85 Years and over | 15 (1.8%) | 25 (3.0%) |
| Total | 820 (100.0%) | 824 (100.0%) |
Families and Households in Albany
Median Family Size in Albany
The median family size in Albany is 2.89 persons per family, with married-couple families (362 | 82.7%) accounting for the largest median family size of 3.09 persons per family. On the other hand, single male/father families (13 | 3.0%) represent the smallest median family size with 1.62 persons per family.
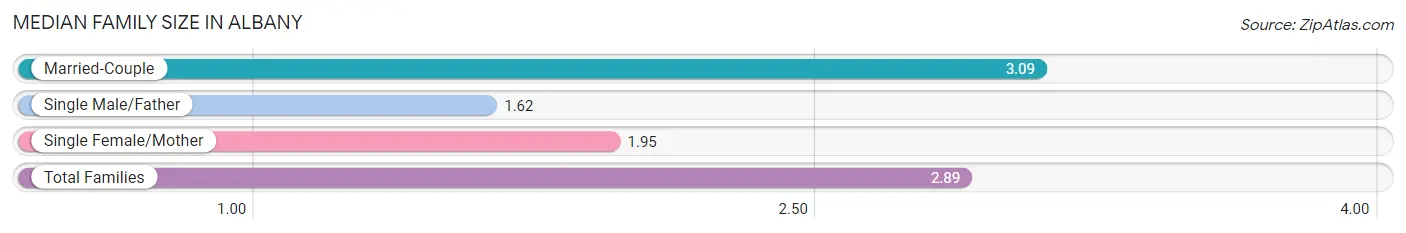
| Family Type | # Families | Family Size |
| Married-Couple | 362 (82.7%) | 3.09 |
| Single Male/Father | 13 (3.0%) | 1.62 |
| Single Female/Mother | 63 (14.4%) | 1.95 |
| Total Families | 438 (100.0%) | 2.89 |
Median Household Size in Albany
The median household size in Albany is 2.34 persons per household, with married-couple households (362 | 52.2%) accounting for the largest median household size of 3.12 persons per household. non-family households (256 | 36.9%) represent the smallest median household size with 1.18 persons per household.
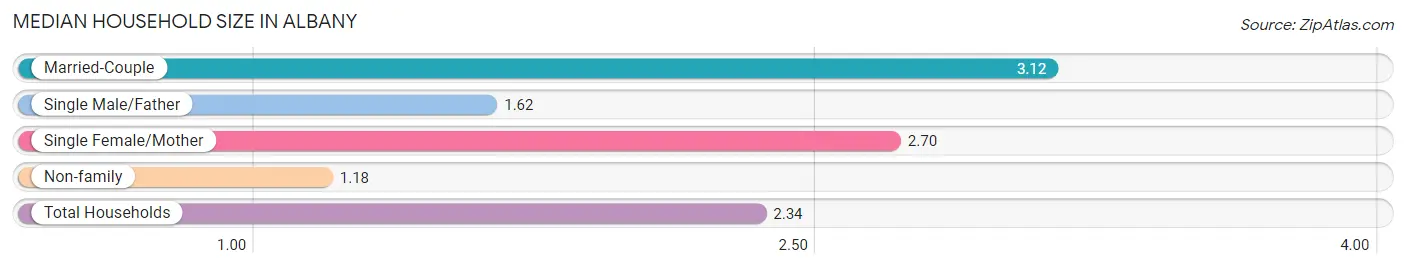
| Household Type | # Households | Household Size |
| Married-Couple | 362 (52.2%) | 3.12 |
| Single Male/Father | 13 (1.9%) | 1.62 |
| Single Female/Mother | 63 (9.1%) | 2.70 |
| Non-family | 256 (36.9%) | 1.18 |
| Total Households | 694 (100.0%) | 2.34 |
Household Size by Marriage Status in Albany
Out of a total of 694 households in Albany, 438 (63.1%) are family households, while 256 (36.9%) are nonfamily households. The most numerous type of family households are 2-person households, comprising 249, and the most common type of nonfamily households are 1-person households, comprising 205.
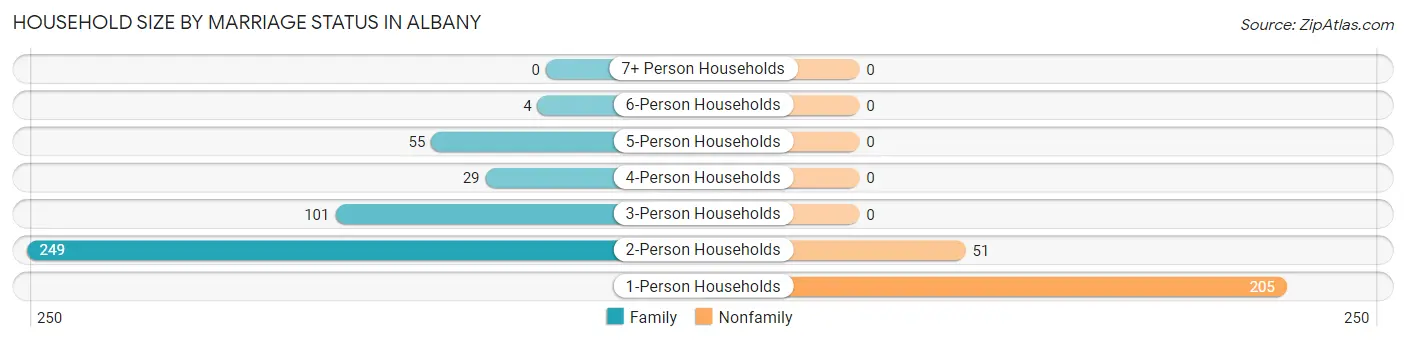
| Household Size | Family Households | Nonfamily Households |
| 1-Person Households | - | 205 (29.5%) |
| 2-Person Households | 249 (35.9%) | 51 (7.3%) |
| 3-Person Households | 101 (14.5%) | 0 (0.0%) |
| 4-Person Households | 29 (4.2%) | 0 (0.0%) |
| 5-Person Households | 55 (7.9%) | 0 (0.0%) |
| 6-Person Households | 4 (0.6%) | 0 (0.0%) |
| 7+ Person Households | 0 (0.0%) | 0 (0.0%) |
| Total | 438 (63.1%) | 256 (36.9%) |
Female Fertility in Albany
Fertility by Age in Albany
Average fertility rate in Albany is 157.0 births per 1,000 women. Women in the age bracket of 15 to 19 years have the highest fertility rate with 547.0 births per 1,000 women. Women in the age bracket of 15 to 19 years acount for 64.8% of all women with births.
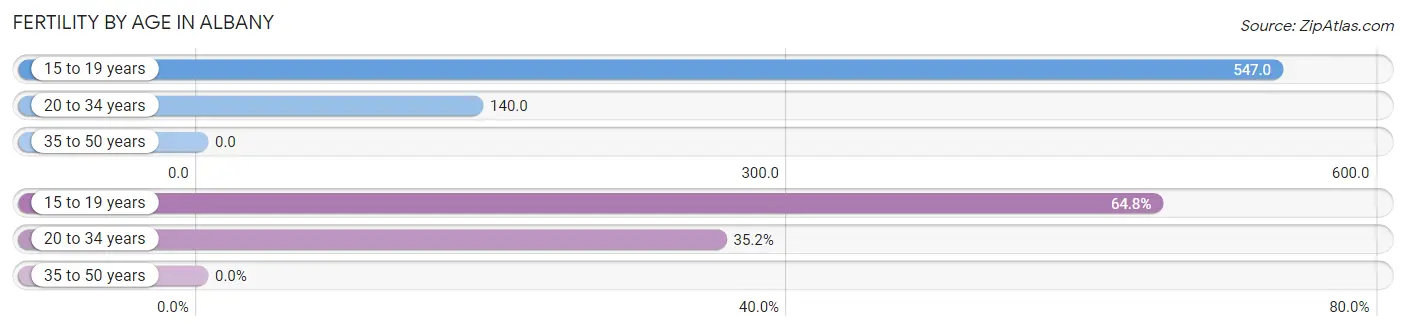
| Age Bracket | Women with Births | Births / 1,000 Women |
| 15 to 19 years | 35 (64.8%) | 547.0 |
| 20 to 34 years | 19 (35.2%) | 140.0 |
| 35 to 50 years | 0 (0.0%) | 0.0 |
| Total | 54 (100.0%) | 157.0 |
Fertility by Age by Marriage Status in Albany
35.2% of women with births (54) in Albany are married. The highest percentage of unmarried women with births falls into 15 to 19 years age bracket with 100.0% of them unmarried at the time of birth, while the lowest percentage of unmarried women with births belong to 20 to 34 years age bracket with 0.0% of them unmarried.
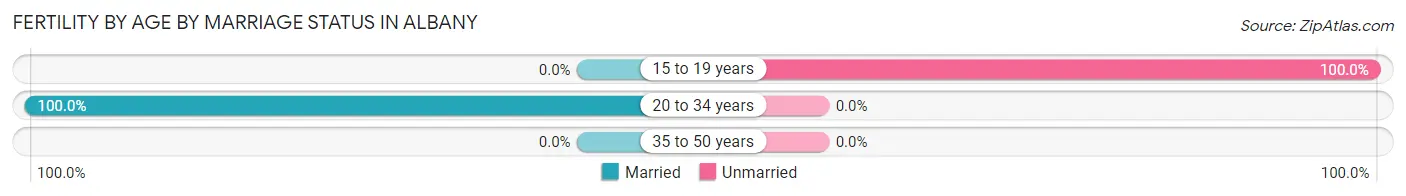
| Age Bracket | Married | Unmarried |
| 15 to 19 years | 0 (0.0%) | 35 (100.0%) |
| 20 to 34 years | 19 (100.0%) | 0 (0.0%) |
| 35 to 50 years | 0 (0.0%) | 0 (0.0%) |
| Total | 19 (35.2%) | 35 (64.8%) |
Fertility by Education in Albany
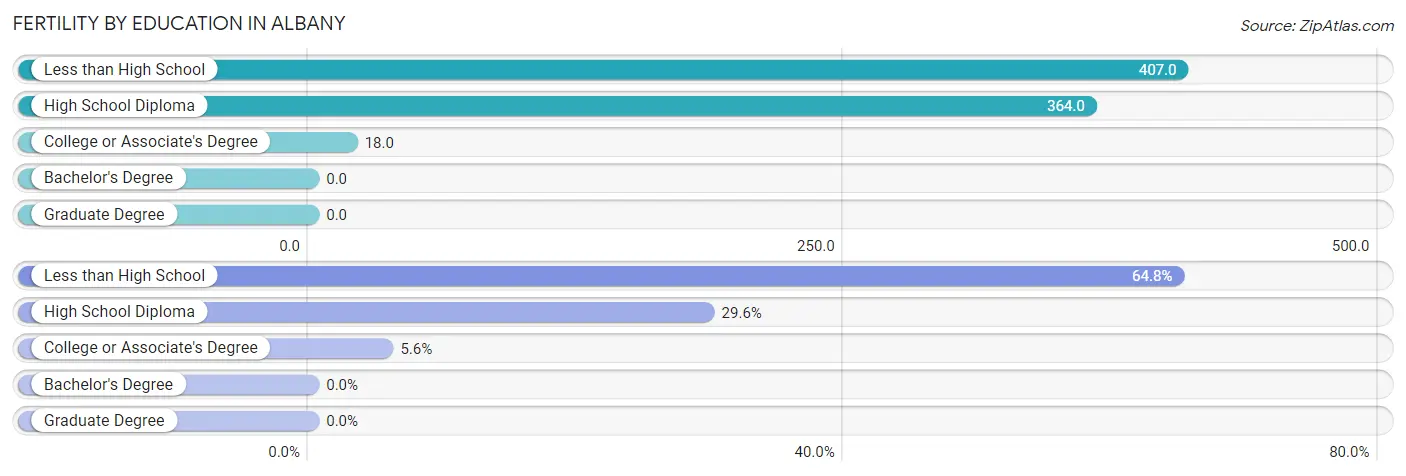
| Educational Attainment | Women with Births | Births / 1,000 Women |
| Less than High School | 35 (64.8%) | 407.0 |
| High School Diploma | 16 (29.6%) | 364.0 |
| College or Associate's Degree | 3 (5.6%) | 18.0 |
| Bachelor's Degree | 0 (0.0%) | 0.0 |
| Graduate Degree | 0 (0.0%) | 0.0 |
| Total | 54 (100.0%) | 157.0 |
Fertility by Education by Marriage Status in Albany
64.8% of women with births in Albany are unmarried. Women with the educational attainment of high school diploma are most likely to be married with 100.0% of them married at childbirth, while women with the educational attainment of less than high school are least likely to be married with 100.0% of them unmarried at childbirth.
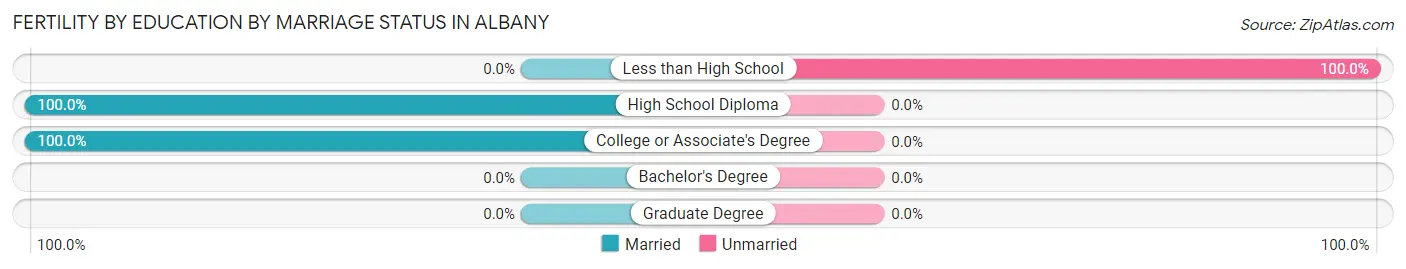
| Educational Attainment | Married | Unmarried |
| Less than High School | 0 (0.0%) | 35 (100.0%) |
| High School Diploma | 16 (100.0%) | 0 (0.0%) |
| College or Associate's Degree | 3 (100.0%) | 0 (0.0%) |
| Bachelor's Degree | 0 (0.0%) | 0 (0.0%) |
| Graduate Degree | 0 (0.0%) | 0 (0.0%) |
| Total | 19 (35.2%) | 35 (64.8%) |
Employment Characteristics in Albany
Employment by Class of Employer in Albany
Among the 738 employed individuals in Albany, private company employees (540 | 73.2%), local government employees (67 | 9.1%), and self-employed (not incorporated) (55 | 7.4%) make up the most common classes of employment.
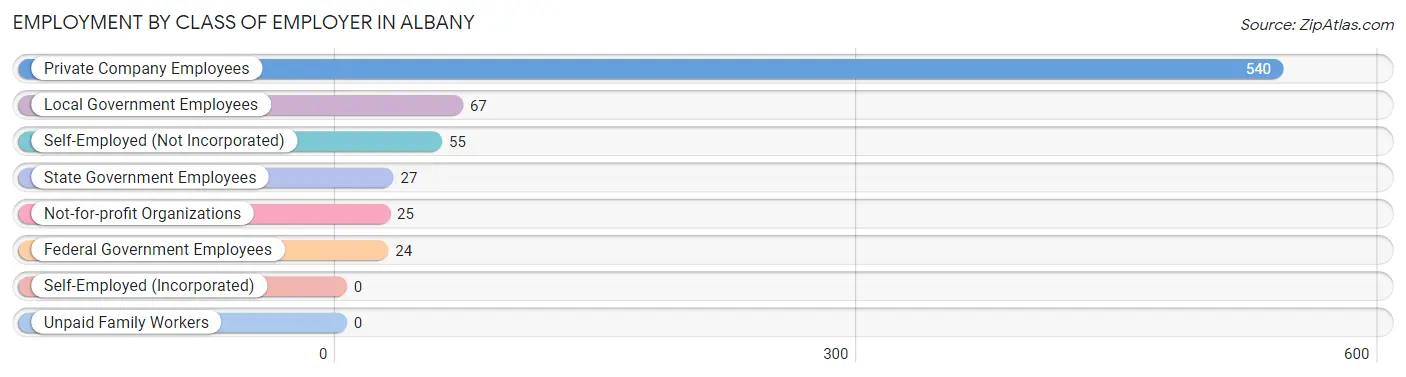
| Employer Class | # Employees | % Employees |
| Private Company Employees | 540 | 73.2% |
| Self-Employed (Incorporated) | 0 | 0.0% |
| Self-Employed (Not Incorporated) | 55 | 7.4% |
| Not-for-profit Organizations | 25 | 3.4% |
| Local Government Employees | 67 | 9.1% |
| State Government Employees | 27 | 3.7% |
| Federal Government Employees | 24 | 3.3% |
| Unpaid Family Workers | 0 | 0.0% |
| Total | 738 | 100.0% |
Employment Status by Age in Albany
According to the labor force statistics for Albany, out of the total population over 16 years of age (1,362), 62.3% or 849 individuals are in the labor force, with 11.7% or 99 of them unemployed. The age group with the highest labor force participation rate is 35 to 44 years, with 88.8% or 127 individuals in the labor force. Within the labor force, the 25 to 29 years age range has the highest percentage of unemployed individuals, with 18.3% or 19 of them being unemployed.
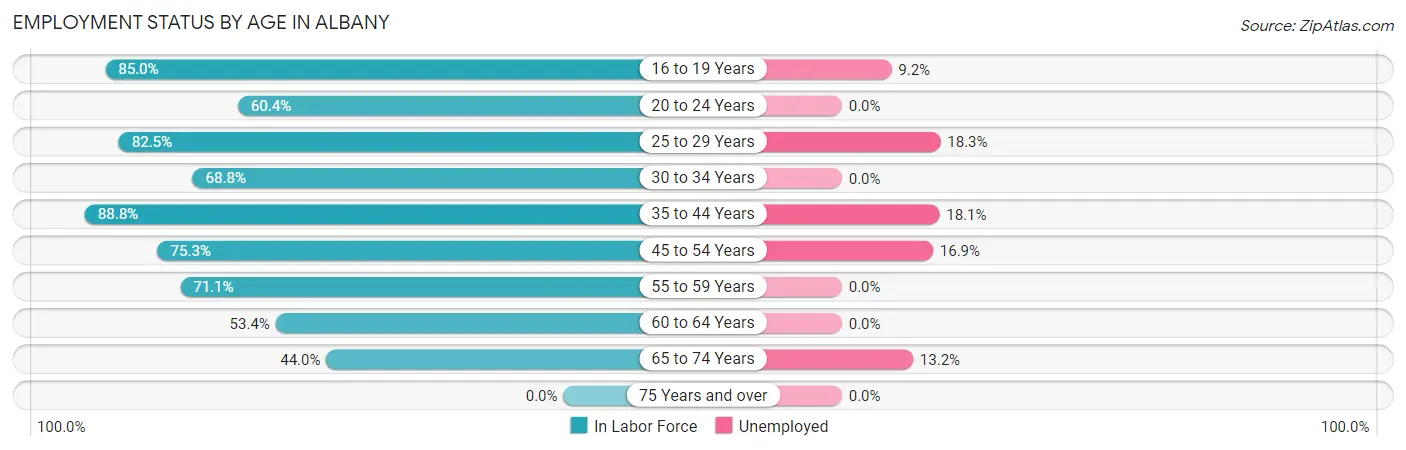
| Age Bracket | In Labor Force | Unemployed |
| 16 to 19 Years | 119 (85.0%) | 11 (9.2%) |
| 20 to 24 Years | 64 (60.4%) | 0 (0.0%) |
| 25 to 29 Years | 104 (82.5%) | 19 (18.3%) |
| 30 to 34 Years | 33 (68.8%) | 0 (0.0%) |
| 35 to 44 Years | 127 (88.8%) | 23 (18.1%) |
| 45 to 54 Years | 177 (75.3%) | 30 (16.9%) |
| 55 to 59 Years | 64 (71.1%) | 0 (0.0%) |
| 60 to 64 Years | 39 (53.4%) | 0 (0.0%) |
| 65 to 74 Years | 121 (44.0%) | 16 (13.2%) |
| 75 Years and over | 0 (0.0%) | 0 (0.0%) |
| Total | 849 (62.3%) | 99 (11.7%) |
Employment Status by Educational Attainment in Albany
According to labor force statistics for Albany, 76.1% of individuals (544) out of the total population between 25 and 64 years of age (715) are in the labor force, with 13.2% or 72 of them being unemployed. The group with the highest labor force participation rate are those with the educational attainment of college / associate degree, with 86.8% or 277 individuals in the labor force. Within the labor force, individuals with college / associate degree education have the highest percentage of unemployment, with 19.1% or 53 of them being unemployed.
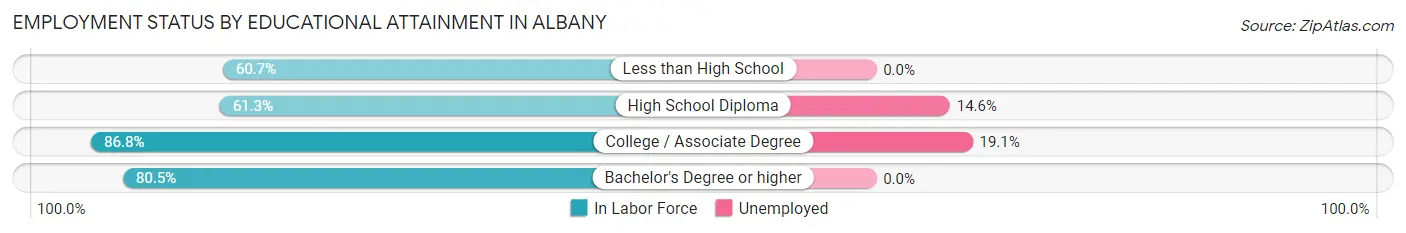
| Educational Attainment | In Labor Force | Unemployed |
| Less than High School | 34 (60.7%) | 0 (0.0%) |
| High School Diploma | 130 (61.3%) | 31 (14.6%) |
| College / Associate Degree | 277 (86.8%) | 61 (19.1%) |
| Bachelor's Degree or higher | 103 (80.5%) | 0 (0.0%) |
| Total | 544 (76.1%) | 94 (13.2%) |
Employment Occupations by Sex in Albany
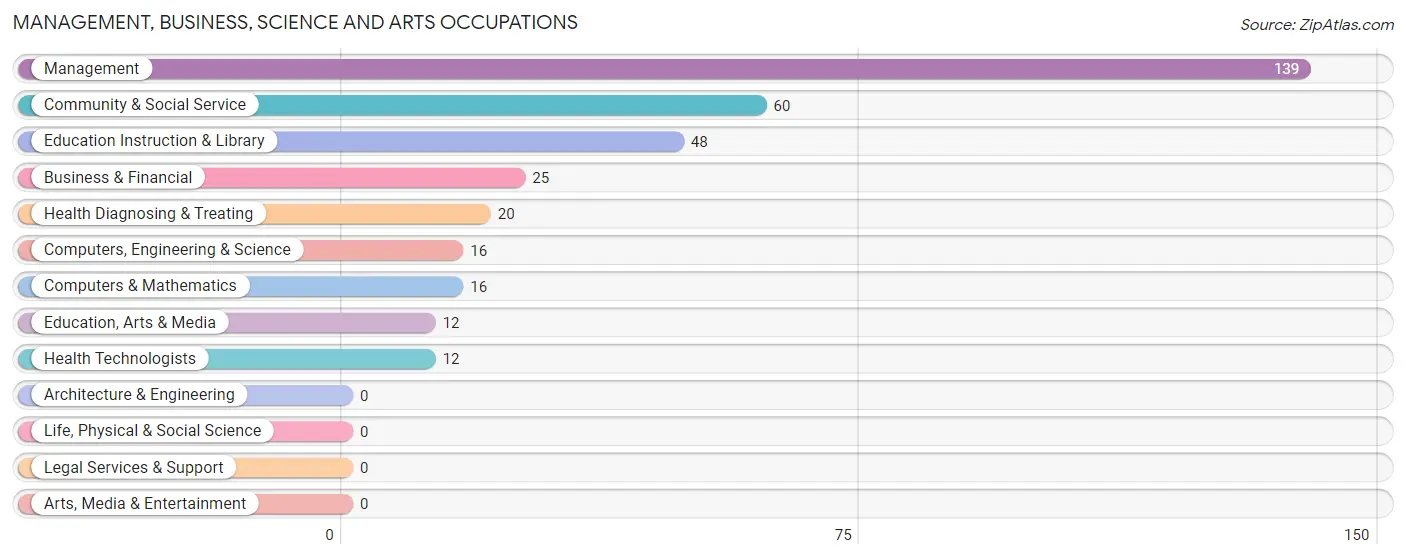
Management, Business, Science and Arts Occupations
The most common Management, Business, Science and Arts occupations in Albany are Management (139 | 18.6%), Community & Social Service (60 | 8.0%), Education Instruction & Library (48 | 6.4%), Business & Financial (25 | 3.3%), and Health Diagnosing & Treating (20 | 2.7%).
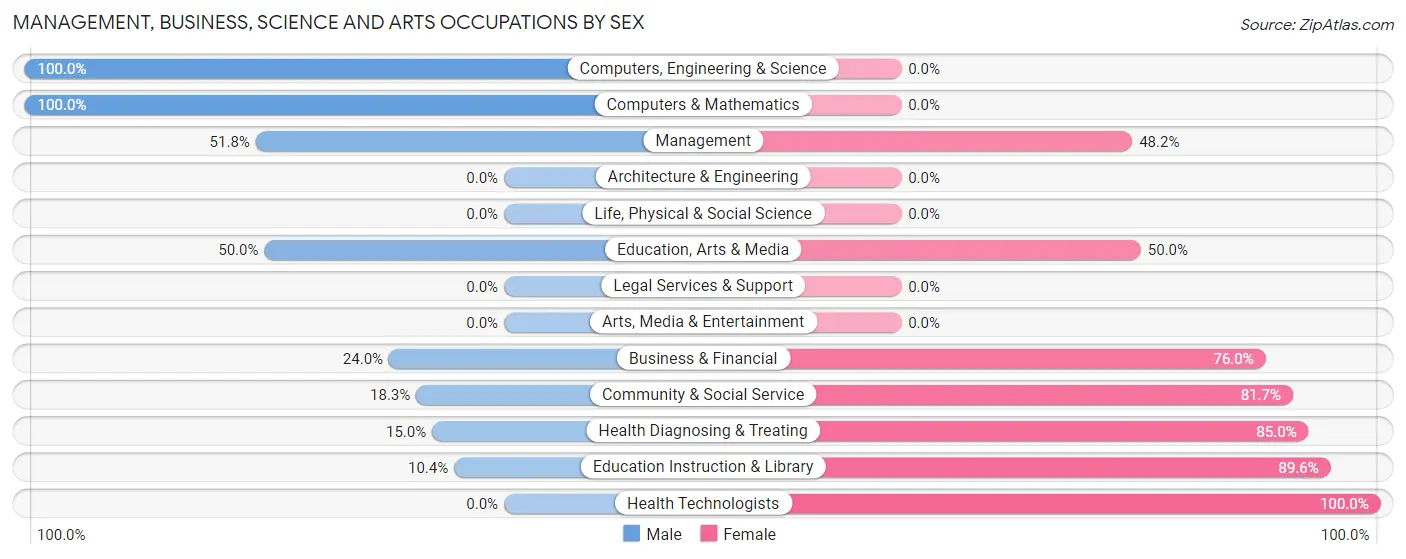
Management, Business, Science and Arts Occupations by Sex
Within the Management, Business, Science and Arts occupations in Albany, the most male-oriented occupations are Computers, Engineering & Science (100.0%), Computers & Mathematics (100.0%), and Management (51.8%), while the most female-oriented occupations are Health Technologists (100.0%), Education Instruction & Library (89.6%), and Health Diagnosing & Treating (85.0%).
| Occupation | Male | Female |
| Management | 72 (51.8%) | 67 (48.2%) |
| Business & Financial | 6 (24.0%) | 19 (76.0%) |
| Computers, Engineering & Science | 16 (100.0%) | 0 (0.0%) |
| Computers & Mathematics | 16 (100.0%) | 0 (0.0%) |
| Architecture & Engineering | 0 (0.0%) | 0 (0.0%) |
| Life, Physical & Social Science | 0 (0.0%) | 0 (0.0%) |
| Community & Social Service | 11 (18.3%) | 49 (81.7%) |
| Education, Arts & Media | 6 (50.0%) | 6 (50.0%) |
| Legal Services & Support | 0 (0.0%) | 0 (0.0%) |
| Education Instruction & Library | 5 (10.4%) | 43 (89.6%) |
| Arts, Media & Entertainment | 0 (0.0%) | 0 (0.0%) |
| Health Diagnosing & Treating | 3 (15.0%) | 17 (85.0%) |
| Health Technologists | 0 (0.0%) | 12 (100.0%) |
| Total (Category) | 108 (41.5%) | 152 (58.5%) |
| Total (Overall) | 407 (54.3%) | 342 (45.7%) |
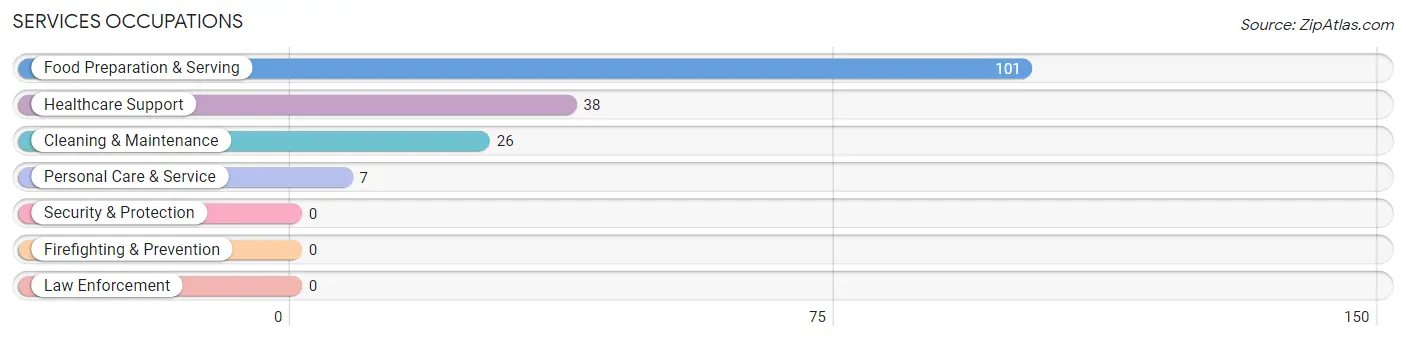
Services Occupations
The most common Services occupations in Albany are Food Preparation & Serving (101 | 13.5%), Healthcare Support (38 | 5.1%), Cleaning & Maintenance (26 | 3.5%), and Personal Care & Service (7 | 0.9%).
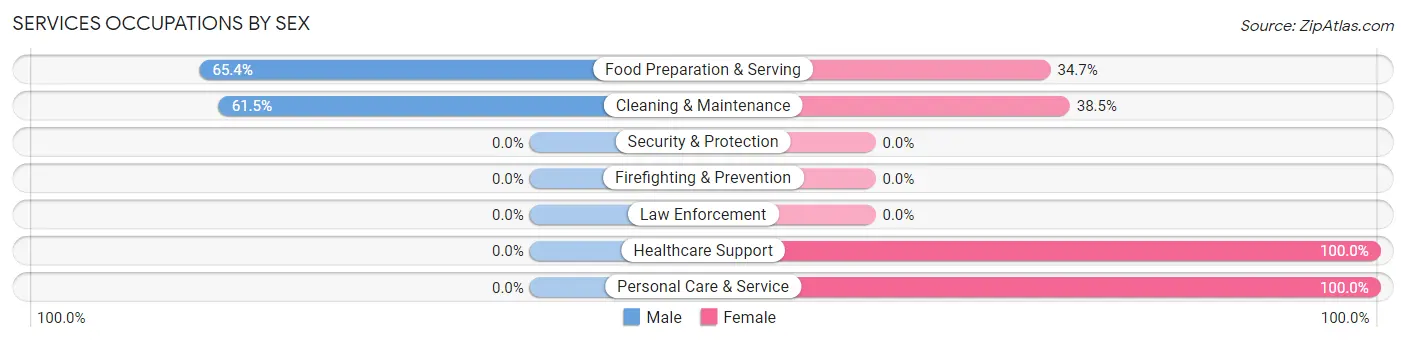
Services Occupations by Sex
Within the Services occupations in Albany, the most male-oriented occupations are Food Preparation & Serving (65.3%), and Cleaning & Maintenance (61.5%), while the most female-oriented occupations are Healthcare Support (100.0%), Personal Care & Service (100.0%), and Cleaning & Maintenance (38.5%).
| Occupation | Male | Female |
| Healthcare Support | 0 (0.0%) | 38 (100.0%) |
| Security & Protection | 0 (0.0%) | 0 (0.0%) |
| Firefighting & Prevention | 0 (0.0%) | 0 (0.0%) |
| Law Enforcement | 0 (0.0%) | 0 (0.0%) |
| Food Preparation & Serving | 66 (65.3%) | 35 (34.6%) |
| Cleaning & Maintenance | 16 (61.5%) | 10 (38.5%) |
| Personal Care & Service | 0 (0.0%) | 7 (100.0%) |
| Total (Category) | 82 (47.7%) | 90 (52.3%) |
| Total (Overall) | 407 (54.3%) | 342 (45.7%) |
Sales and Office Occupations
The most common Sales and Office occupations in Albany are Office & Administration (97 | 13.0%), and Sales & Related (65 | 8.7%).
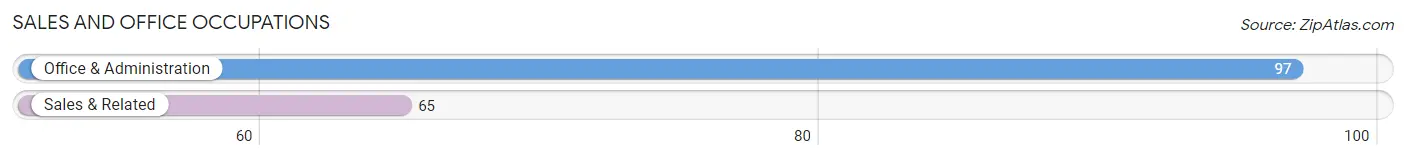
Sales and Office Occupations by Sex
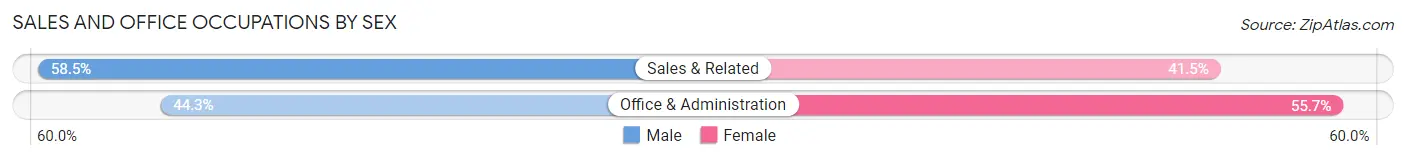
| Occupation | Male | Female |
| Sales & Related | 38 (58.5%) | 27 (41.5%) |
| Office & Administration | 43 (44.3%) | 54 (55.7%) |
| Total (Category) | 81 (50.0%) | 81 (50.0%) |
| Total (Overall) | 407 (54.3%) | 342 (45.7%) |
Natural Resources, Construction and Maintenance Occupations
The most common Natural Resources, Construction and Maintenance occupations in Albany are Construction & Extraction (45 | 6.0%), and Farming, Fishing & Forestry (3 | 0.4%).
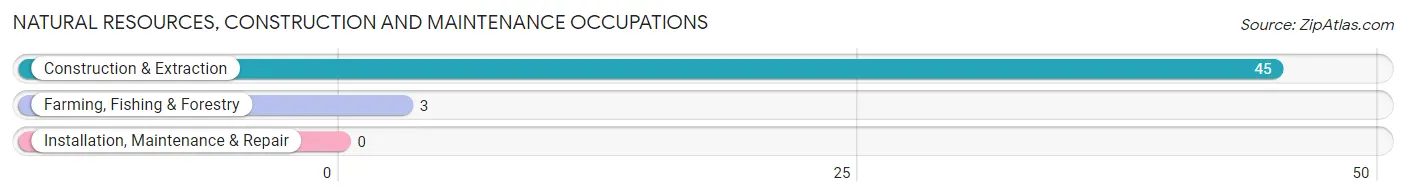
Natural Resources, Construction and Maintenance Occupations by Sex
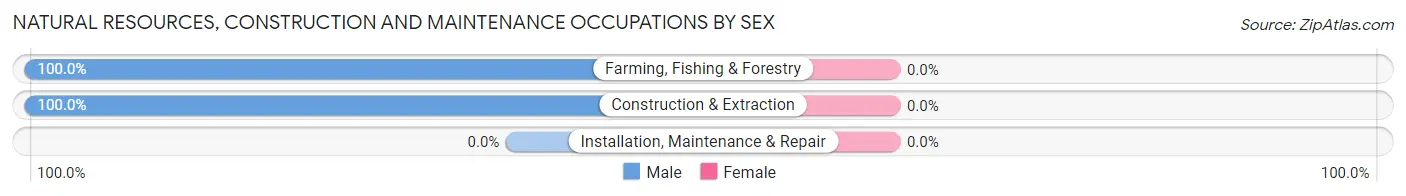
| Occupation | Male | Female |
| Farming, Fishing & Forestry | 3 (100.0%) | 0 (0.0%) |
| Construction & Extraction | 45 (100.0%) | 0 (0.0%) |
| Installation, Maintenance & Repair | 0 (0.0%) | 0 (0.0%) |
| Total (Category) | 48 (100.0%) | 0 (0.0%) |
| Total (Overall) | 407 (54.3%) | 342 (45.7%) |
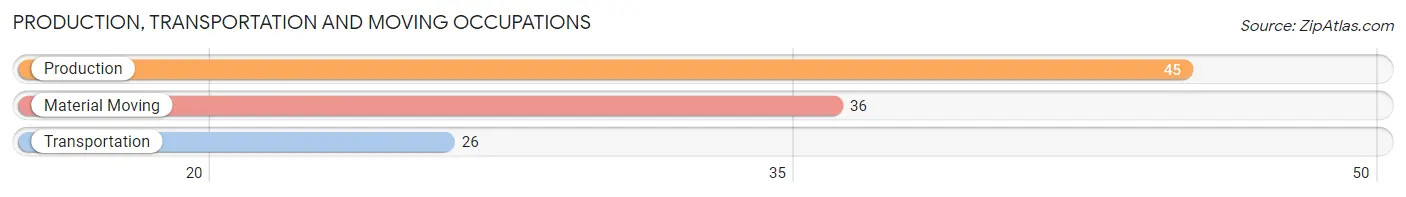
Production, Transportation and Moving Occupations
The most common Production, Transportation and Moving occupations in Albany are Production (45 | 6.0%), Material Moving (36 | 4.8%), and Transportation (26 | 3.5%).
Production, Transportation and Moving Occupations by Sex
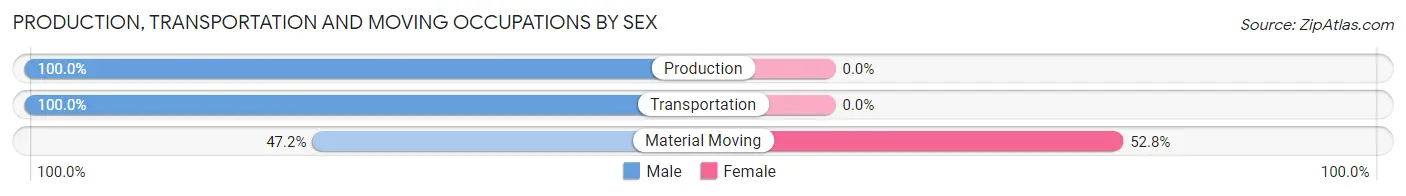
| Occupation | Male | Female |
| Production | 45 (100.0%) | 0 (0.0%) |
| Transportation | 26 (100.0%) | 0 (0.0%) |
| Material Moving | 17 (47.2%) | 19 (52.8%) |
| Total (Category) | 88 (82.2%) | 19 (17.8%) |
| Total (Overall) | 407 (54.3%) | 342 (45.7%) |
Employment Industries by Sex in Albany
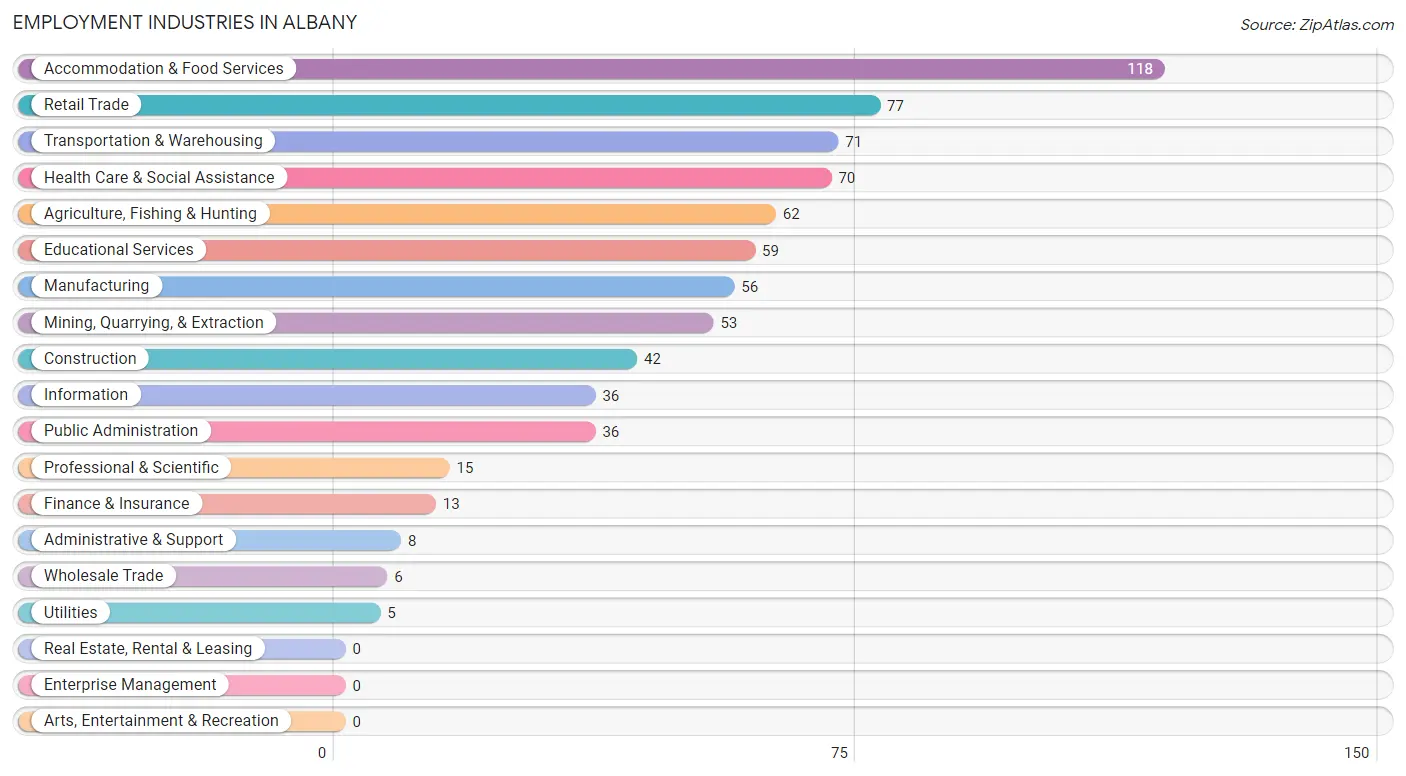
Employment Industries in Albany
The major employment industries in Albany include Accommodation & Food Services (118 | 15.8%), Retail Trade (77 | 10.3%), Transportation & Warehousing (71 | 9.5%), Health Care & Social Assistance (70 | 9.3%), and Agriculture, Fishing & Hunting (62 | 8.3%).
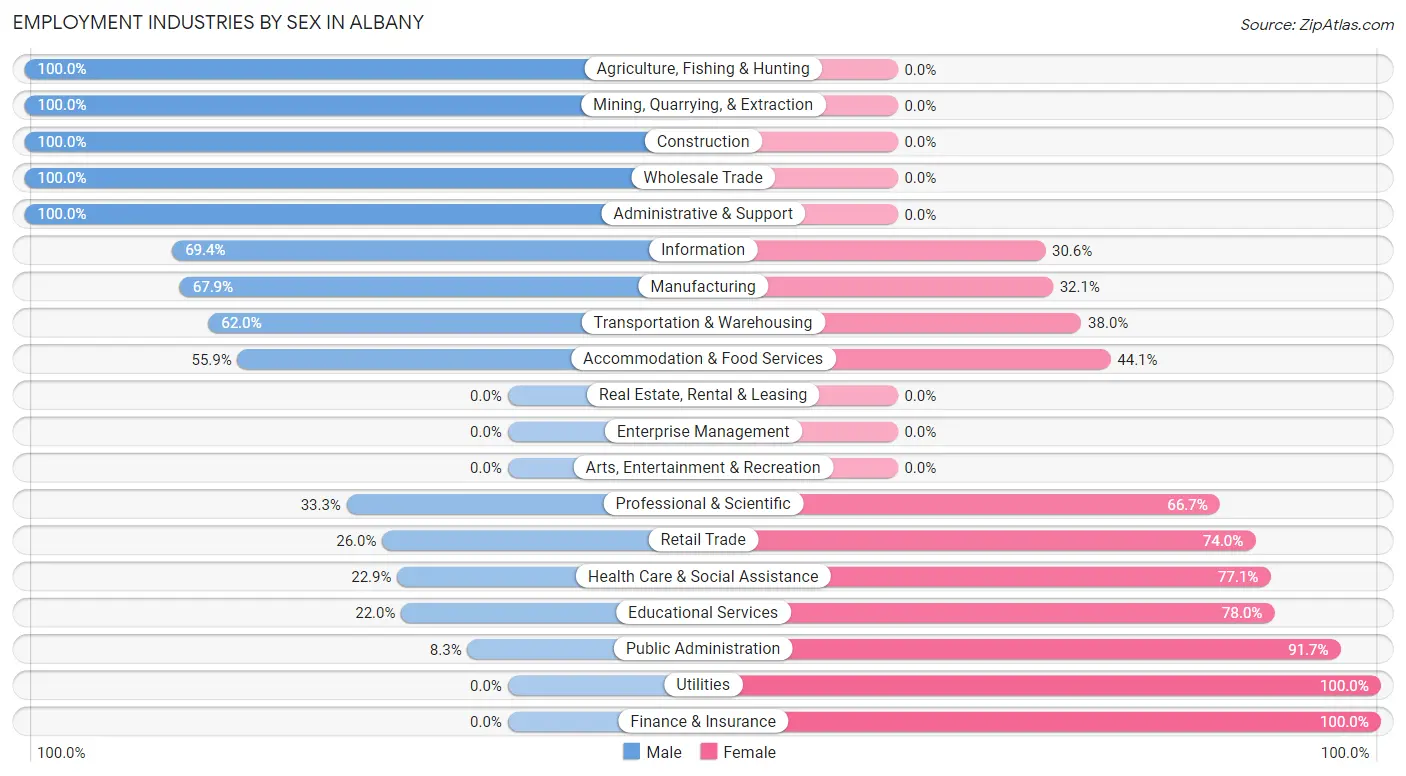
Employment Industries by Sex in Albany
The Albany industries that see more men than women are Agriculture, Fishing & Hunting (100.0%), Mining, Quarrying, & Extraction (100.0%), and Construction (100.0%), whereas the industries that tend to have a higher number of women are Utilities (100.0%), Finance & Insurance (100.0%), and Public Administration (91.7%).
| Industry | Male | Female |
| Agriculture, Fishing & Hunting | 62 (100.0%) | 0 (0.0%) |
| Mining, Quarrying, & Extraction | 53 (100.0%) | 0 (0.0%) |
| Construction | 42 (100.0%) | 0 (0.0%) |
| Manufacturing | 38 (67.9%) | 18 (32.1%) |
| Wholesale Trade | 6 (100.0%) | 0 (0.0%) |
| Retail Trade | 20 (26.0%) | 57 (74.0%) |
| Transportation & Warehousing | 44 (62.0%) | 27 (38.0%) |
| Utilities | 0 (0.0%) | 5 (100.0%) |
| Information | 25 (69.4%) | 11 (30.6%) |
| Finance & Insurance | 0 (0.0%) | 13 (100.0%) |
| Real Estate, Rental & Leasing | 0 (0.0%) | 0 (0.0%) |
| Professional & Scientific | 5 (33.3%) | 10 (66.7%) |
| Enterprise Management | 0 (0.0%) | 0 (0.0%) |
| Administrative & Support | 8 (100.0%) | 0 (0.0%) |
| Educational Services | 13 (22.0%) | 46 (78.0%) |
| Health Care & Social Assistance | 16 (22.9%) | 54 (77.1%) |
| Arts, Entertainment & Recreation | 0 (0.0%) | 0 (0.0%) |
| Accommodation & Food Services | 66 (55.9%) | 52 (44.1%) |
| Public Administration | 3 (8.3%) | 33 (91.7%) |
| Total | 407 (54.3%) | 342 (45.7%) |
Education in Albany
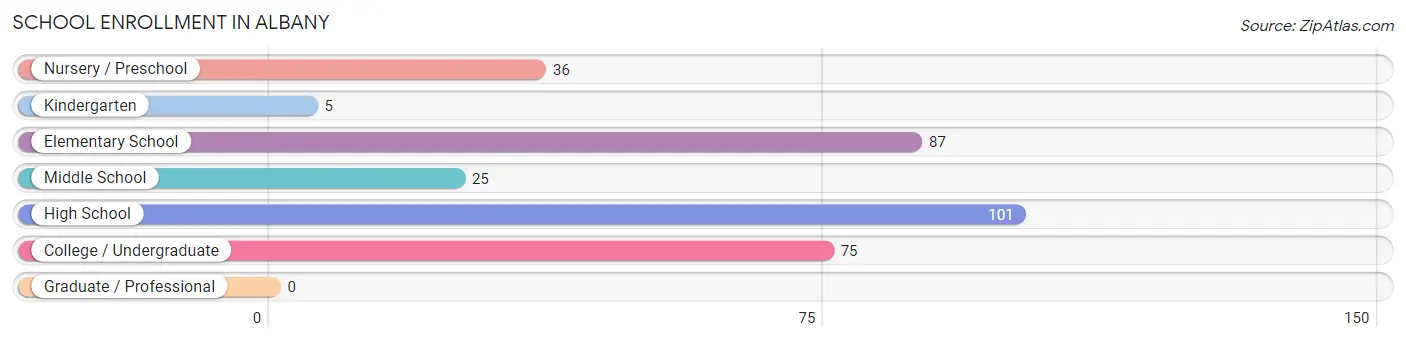
School Enrollment in Albany
The most common levels of schooling among the 329 students in Albany are high school (101 | 30.7%), elementary school (87 | 26.4%), and college / undergraduate (75 | 22.8%).
| School Level | # Students | % Students |
| Nursery / Preschool | 36 | 10.9% |
| Kindergarten | 5 | 1.5% |
| Elementary School | 87 | 26.4% |
| Middle School | 25 | 7.6% |
| High School | 101 | 30.7% |
| College / Undergraduate | 75 | 22.8% |
| Graduate / Professional | 0 | 0.0% |
| Total | 329 | 100.0% |
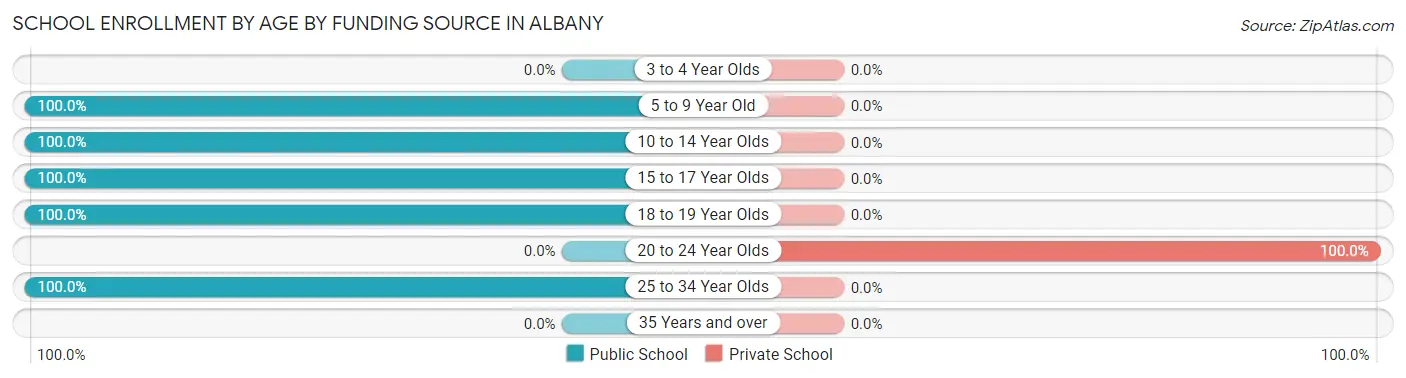
School Enrollment by Age by Funding Source in Albany
Out of a total of 329 students who are enrolled in schools in Albany, 48 (14.6%) attend a private institution, while the remaining 281 (85.4%) are enrolled in public schools. The age group of 20 to 24 year olds has the highest likelihood of being enrolled in private schools, with 48 (100.0% in the age bracket) enrolled. Conversely, the age group of 5 to 9 year old has the lowest likelihood of being enrolled in a private school, with 125 (100.0% in the age bracket) attending a public institution.
| Age Bracket | Public School | Private School |
| 3 to 4 Year Olds | 0 (0.0%) | 0 (0.0%) |
| 5 to 9 Year Old | 125 (100.0%) | 0 (0.0%) |
| 10 to 14 Year Olds | 28 (100.0%) | 0 (0.0%) |
| 15 to 17 Year Olds | 86 (100.0%) | 0 (0.0%) |
| 18 to 19 Year Olds | 38 (100.0%) | 0 (0.0%) |
| 20 to 24 Year Olds | 0 (0.0%) | 48 (100.0%) |
| 25 to 34 Year Olds | 4 (100.0%) | 0 (0.0%) |
| 35 Years and over | 0 (0.0%) | 0 (0.0%) |
| Total | 281 (85.4%) | 48 (14.6%) |
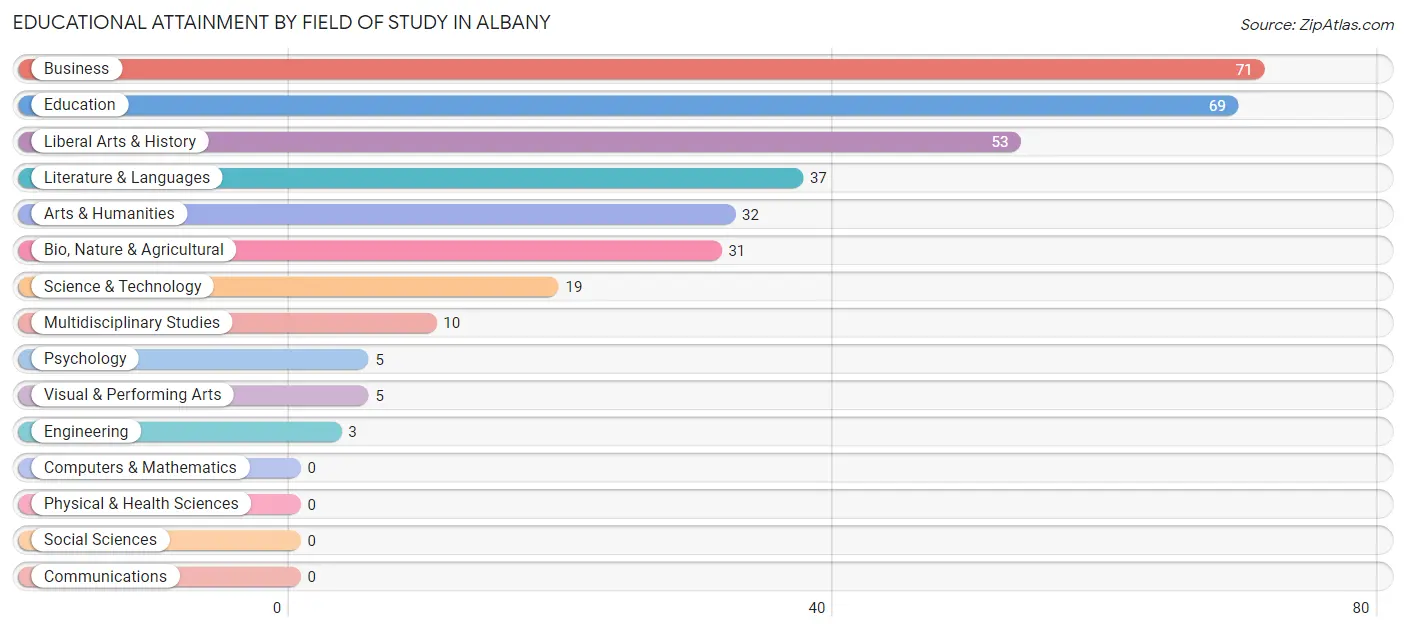
Educational Attainment by Field of Study in Albany
Business (71 | 21.2%), education (69 | 20.6%), liberal arts & history (53 | 15.8%), literature & languages (37 | 11.0%), and arts & humanities (32 | 9.6%) are the most common fields of study among 335 individuals in Albany who have obtained a bachelor's degree or higher.
| Field of Study | # Graduates | % Graduates |
| Computers & Mathematics | 0 | 0.0% |
| Bio, Nature & Agricultural | 31 | 9.2% |
| Physical & Health Sciences | 0 | 0.0% |
| Psychology | 5 | 1.5% |
| Social Sciences | 0 | 0.0% |
| Engineering | 3 | 0.9% |
| Multidisciplinary Studies | 10 | 3.0% |
| Science & Technology | 19 | 5.7% |
| Business | 71 | 21.2% |
| Education | 69 | 20.6% |
| Literature & Languages | 37 | 11.0% |
| Liberal Arts & History | 53 | 15.8% |
| Visual & Performing Arts | 5 | 1.5% |
| Communications | 0 | 0.0% |
| Arts & Humanities | 32 | 9.6% |
| Total | 335 | 100.0% |
Transportation & Commute in Albany
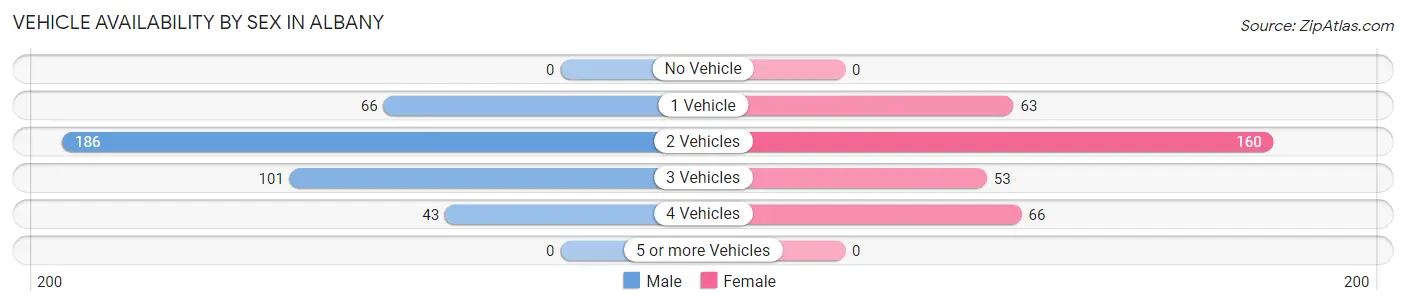
Vehicle Availability by Sex in Albany
The most prevalent vehicle ownership categories in Albany are males with 2 vehicles (186, accounting for 47.0%) and females with 2 vehicles (160, making up 54.4%).
| Vehicles Available | Male | Female |
| No Vehicle | 0 (0.0%) | 0 (0.0%) |
| 1 Vehicle | 66 (16.7%) | 63 (18.4%) |
| 2 Vehicles | 186 (47.0%) | 160 (46.8%) |
| 3 Vehicles | 101 (25.5%) | 53 (15.5%) |
| 4 Vehicles | 43 (10.9%) | 66 (19.3%) |
| 5 or more Vehicles | 0 (0.0%) | 0 (0.0%) |
| Total | 396 (100.0%) | 342 (100.0%) |
Commute Time in Albany
The most frequently occuring commute durations in Albany are 5 to 9 minutes (194 commuters, 28.8%), less than 5 minutes (167 commuters, 24.8%), and 45 to 59 minutes (77 commuters, 11.4%).
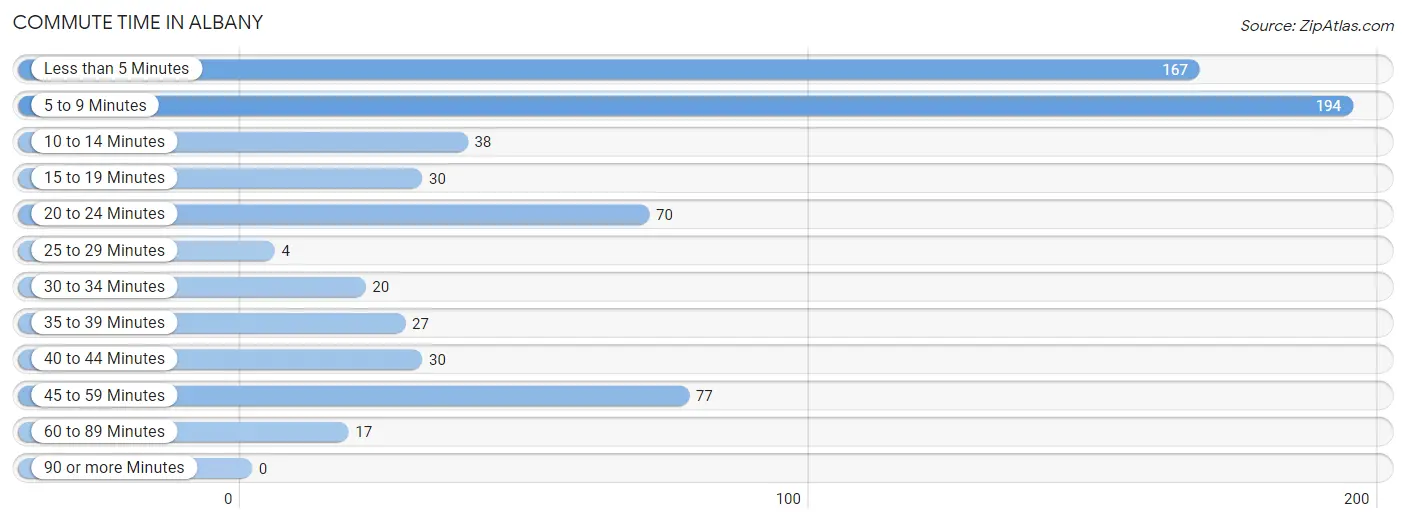
| Commute Time | # Commuters | % Commuters |
| Less than 5 Minutes | 167 | 24.8% |
| 5 to 9 Minutes | 194 | 28.8% |
| 10 to 14 Minutes | 38 | 5.6% |
| 15 to 19 Minutes | 30 | 4.4% |
| 20 to 24 Minutes | 70 | 10.4% |
| 25 to 29 Minutes | 4 | 0.6% |
| 30 to 34 Minutes | 20 | 3.0% |
| 35 to 39 Minutes | 27 | 4.0% |
| 40 to 44 Minutes | 30 | 4.4% |
| 45 to 59 Minutes | 77 | 11.4% |
| 60 to 89 Minutes | 17 | 2.5% |
| 90 or more Minutes | 0 | 0.0% |
Commute Time by Sex in Albany
The most common commute times in Albany are less than 5 minutes (90 commuters, 23.4%) for males and 5 to 9 minutes (150 commuters, 51.7%) for females.
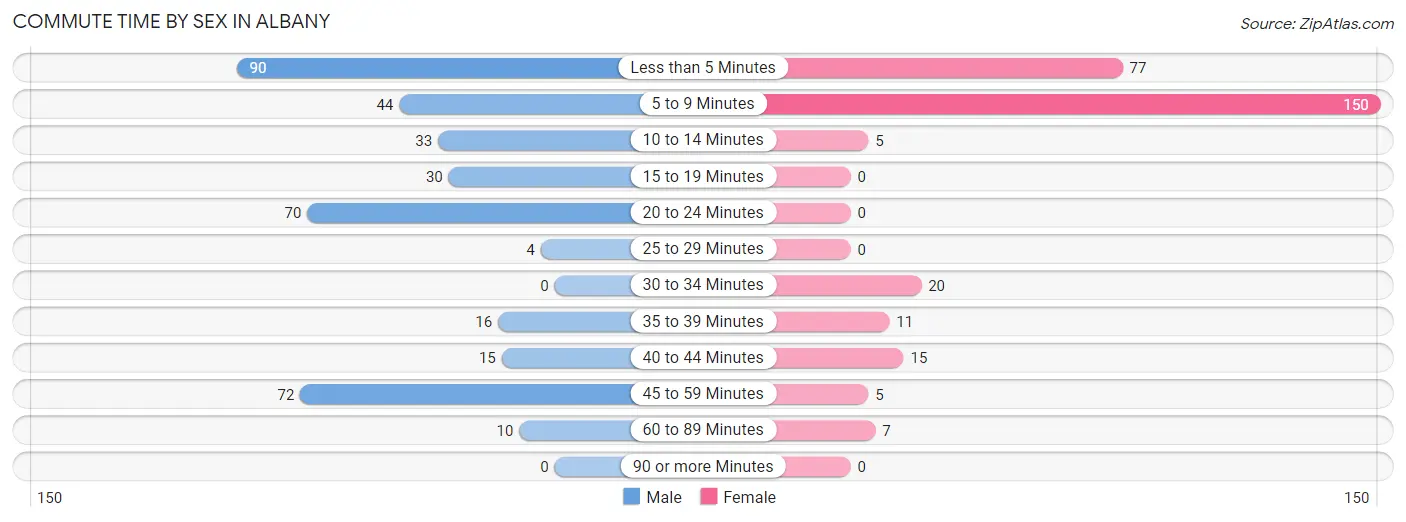
| Commute Time | Male | Female |
| Less than 5 Minutes | 90 (23.4%) | 77 (26.6%) |
| 5 to 9 Minutes | 44 (11.5%) | 150 (51.7%) |
| 10 to 14 Minutes | 33 (8.6%) | 5 (1.7%) |
| 15 to 19 Minutes | 30 (7.8%) | 0 (0.0%) |
| 20 to 24 Minutes | 70 (18.2%) | 0 (0.0%) |
| 25 to 29 Minutes | 4 (1.0%) | 0 (0.0%) |
| 30 to 34 Minutes | 0 (0.0%) | 20 (6.9%) |
| 35 to 39 Minutes | 16 (4.2%) | 11 (3.8%) |
| 40 to 44 Minutes | 15 (3.9%) | 15 (5.2%) |
| 45 to 59 Minutes | 72 (18.8%) | 5 (1.7%) |
| 60 to 89 Minutes | 10 (2.6%) | 7 (2.4%) |
| 90 or more Minutes | 0 (0.0%) | 0 (0.0%) |
Time of Departure to Work by Sex in Albany
The most frequent times of departure to work in Albany are 7:30 AM to 7:59 AM (88, 22.9%) for males and 7:30 AM to 7:59 AM (98, 33.8%) for females.
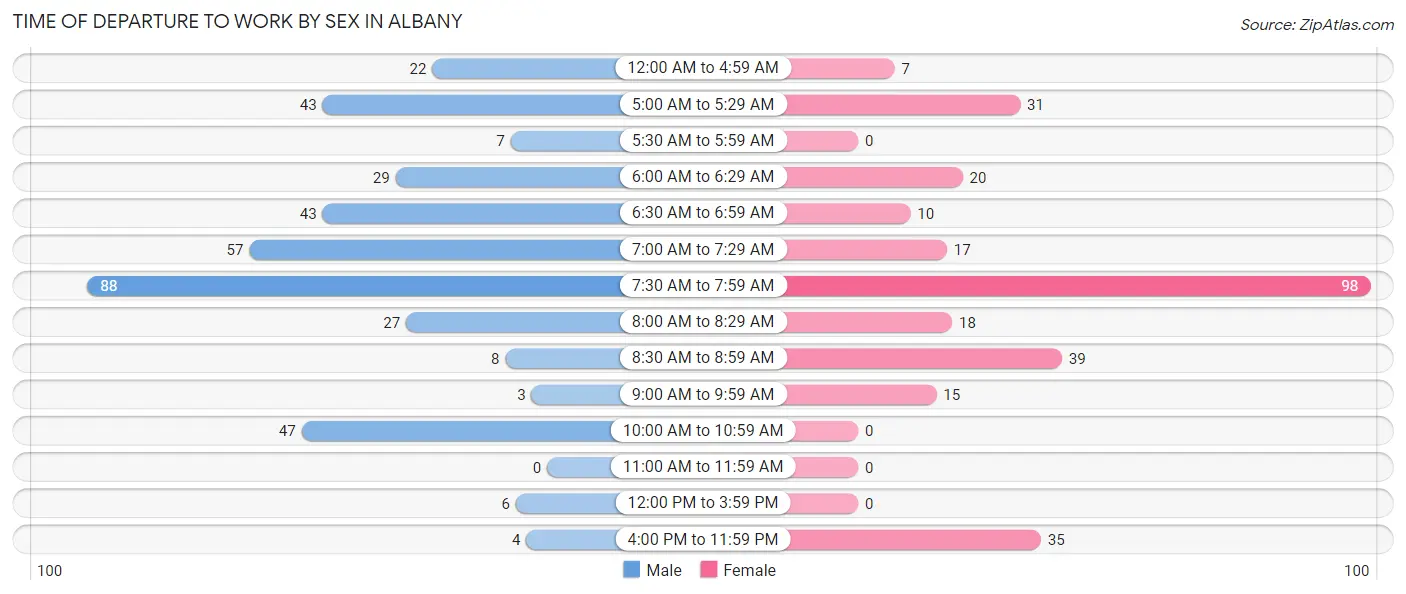
| Time of Departure | Male | Female |
| 12:00 AM to 4:59 AM | 22 (5.7%) | 7 (2.4%) |
| 5:00 AM to 5:29 AM | 43 (11.2%) | 31 (10.7%) |
| 5:30 AM to 5:59 AM | 7 (1.8%) | 0 (0.0%) |
| 6:00 AM to 6:29 AM | 29 (7.5%) | 20 (6.9%) |
| 6:30 AM to 6:59 AM | 43 (11.2%) | 10 (3.5%) |
| 7:00 AM to 7:29 AM | 57 (14.8%) | 17 (5.9%) |
| 7:30 AM to 7:59 AM | 88 (22.9%) | 98 (33.8%) |
| 8:00 AM to 8:29 AM | 27 (7.0%) | 18 (6.2%) |
| 8:30 AM to 8:59 AM | 8 (2.1%) | 39 (13.5%) |
| 9:00 AM to 9:59 AM | 3 (0.8%) | 15 (5.2%) |
| 10:00 AM to 10:59 AM | 47 (12.2%) | 0 (0.0%) |
| 11:00 AM to 11:59 AM | 0 (0.0%) | 0 (0.0%) |
| 12:00 PM to 3:59 PM | 6 (1.6%) | 0 (0.0%) |
| 4:00 PM to 11:59 PM | 4 (1.0%) | 35 (12.1%) |
| Total | 384 (100.0%) | 290 (100.0%) |
Housing Occupancy in Albany
Occupancy by Ownership in Albany
Of the total 694 dwellings in Albany, owner-occupied units account for 523 (75.4%), while renter-occupied units make up 171 (24.6%).
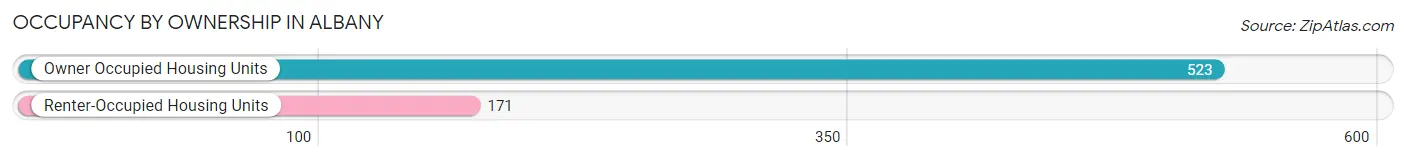
| Occupancy | # Housing Units | % Housing Units |
| Owner Occupied Housing Units | 523 | 75.4% |
| Renter-Occupied Housing Units | 171 | 24.6% |
| Total Occupied Housing Units | 694 | 100.0% |
Occupancy by Household Size in Albany
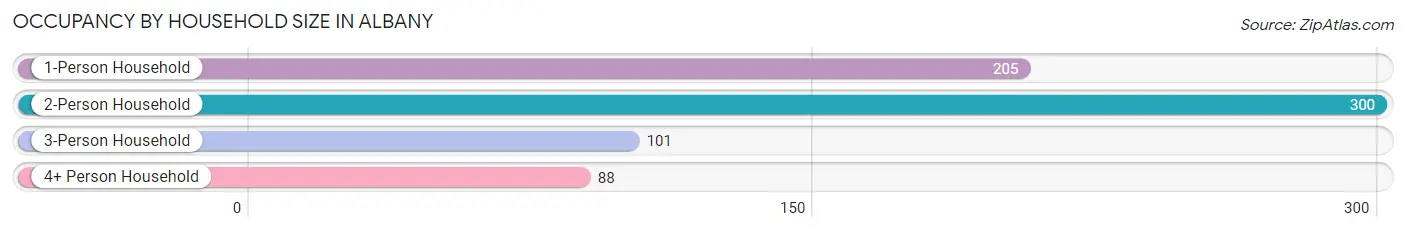
| Household Size | # Housing Units | % Housing Units |
| 1-Person Household | 205 | 29.5% |
| 2-Person Household | 300 | 43.2% |
| 3-Person Household | 101 | 14.5% |
| 4+ Person Household | 88 | 12.7% |
| Total Housing Units | 694 | 100.0% |
Occupancy by Ownership by Household Size in Albany
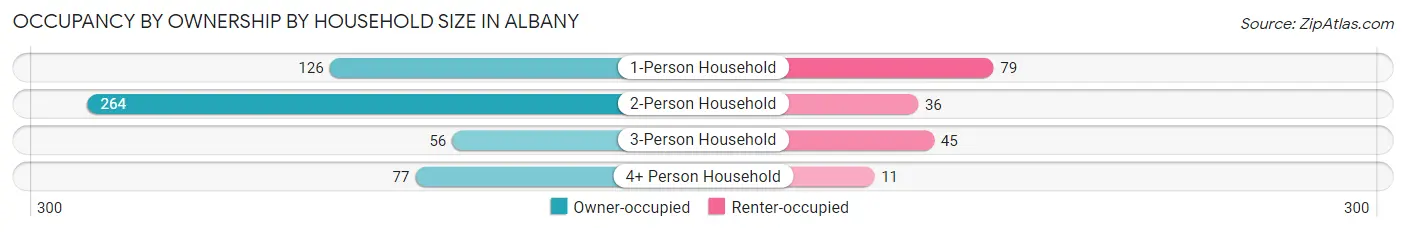
| Household Size | Owner-occupied | Renter-occupied |
| 1-Person Household | 126 (61.5%) | 79 (38.5%) |
| 2-Person Household | 264 (88.0%) | 36 (12.0%) |
| 3-Person Household | 56 (55.4%) | 45 (44.6%) |
| 4+ Person Household | 77 (87.5%) | 11 (12.5%) |
| Total Housing Units | 523 (75.4%) | 171 (24.6%) |
Occupancy by Educational Attainment in Albany
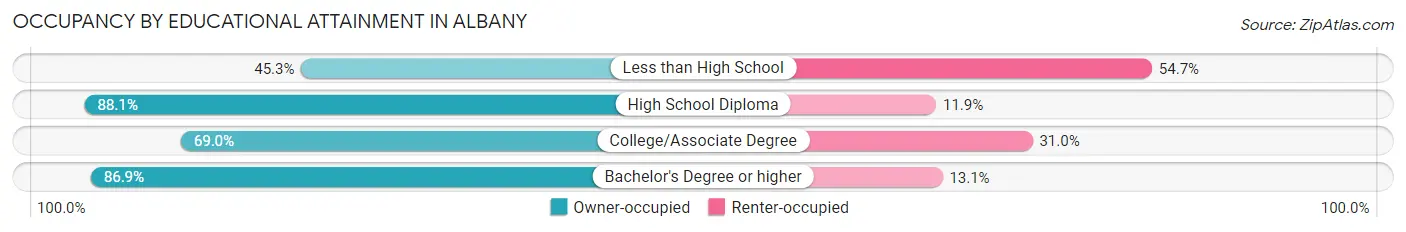
| Household Size | Owner-occupied | Renter-occupied |
| Less than High School | 34 (45.3%) | 41 (54.7%) |
| High School Diploma | 141 (88.1%) | 19 (11.9%) |
| College/Associate Degree | 196 (69.0%) | 88 (31.0%) |
| Bachelor's Degree or higher | 152 (86.9%) | 23 (13.1%) |
Occupancy by Age of Householder in Albany
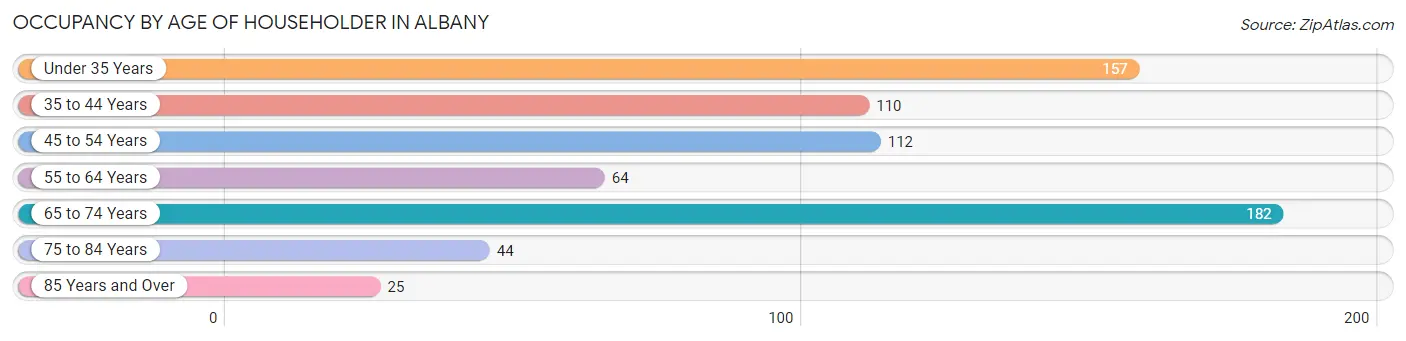
| Age Bracket | # Households | % Households |
| Under 35 Years | 157 | 22.6% |
| 35 to 44 Years | 110 | 15.9% |
| 45 to 54 Years | 112 | 16.1% |
| 55 to 64 Years | 64 | 9.2% |
| 65 to 74 Years | 182 | 26.2% |
| 75 to 84 Years | 44 | 6.3% |
| 85 Years and Over | 25 | 3.6% |
| Total | 694 | 100.0% |
Housing Finances in Albany
Median Income by Occupancy in Albany
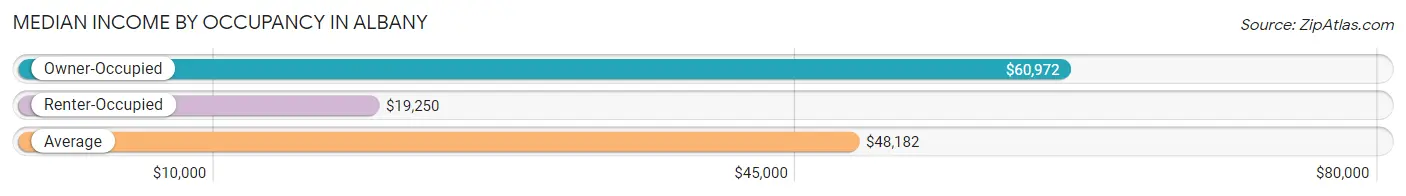
| Occupancy Type | # Households | Median Income |
| Owner-Occupied | 523 (75.4%) | $60,972 |
| Renter-Occupied | 171 (24.6%) | $19,250 |
| Average | 694 (100.0%) | $48,182 |
Occupancy by Householder Income Bracket in Albany
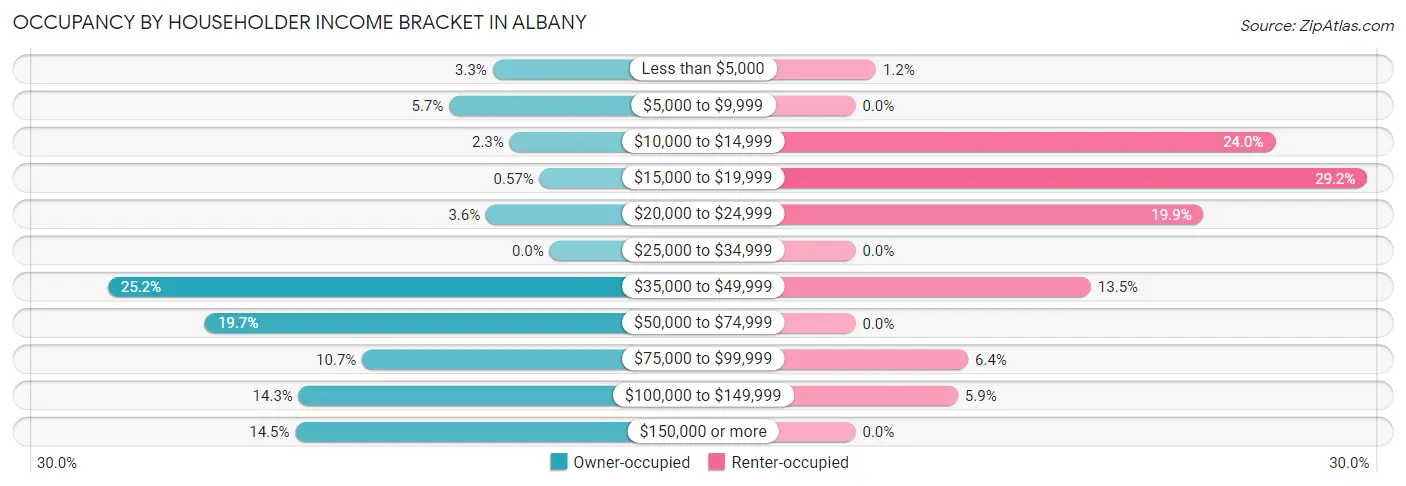
| Income Bracket | Owner-occupied | Renter-occupied |
| Less than $5,000 | 17 (3.3%) | 2 (1.2%) |
| $5,000 to $9,999 | 30 (5.7%) | 0 (0.0%) |
| $10,000 to $14,999 | 12 (2.3%) | 41 (24.0%) |
| $15,000 to $19,999 | 3 (0.6%) | 50 (29.2%) |
| $20,000 to $24,999 | 19 (3.6%) | 34 (19.9%) |
| $25,000 to $34,999 | 0 (0.0%) | 0 (0.0%) |
| $35,000 to $49,999 | 132 (25.2%) | 23 (13.5%) |
| $50,000 to $74,999 | 103 (19.7%) | 0 (0.0%) |
| $75,000 to $99,999 | 56 (10.7%) | 11 (6.4%) |
| $100,000 to $149,999 | 75 (14.3%) | 10 (5.9%) |
| $150,000 or more | 76 (14.5%) | 0 (0.0%) |
| Total | 523 (100.0%) | 171 (100.0%) |
Monthly Housing Cost Tiers in Albany
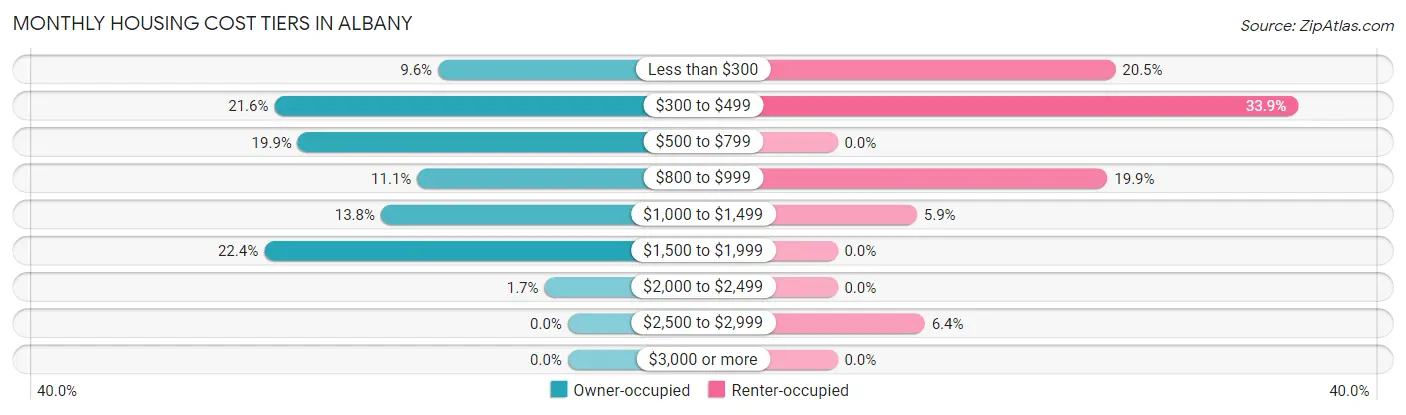
| Monthly Cost | Owner-occupied | Renter-occupied |
| Less than $300 | 50 (9.6%) | 35 (20.5%) |
| $300 to $499 | 113 (21.6%) | 58 (33.9%) |
| $500 to $799 | 104 (19.9%) | 0 (0.0%) |
| $800 to $999 | 58 (11.1%) | 34 (19.9%) |
| $1,000 to $1,499 | 72 (13.8%) | 10 (5.9%) |
| $1,500 to $1,999 | 117 (22.4%) | 0 (0.0%) |
| $2,000 to $2,499 | 9 (1.7%) | 0 (0.0%) |
| $2,500 to $2,999 | 0 (0.0%) | 11 (6.4%) |
| $3,000 or more | 0 (0.0%) | 0 (0.0%) |
| Total | 523 (100.0%) | 171 (100.0%) |
Physical Housing Characteristics in Albany
Housing Structures in Albany
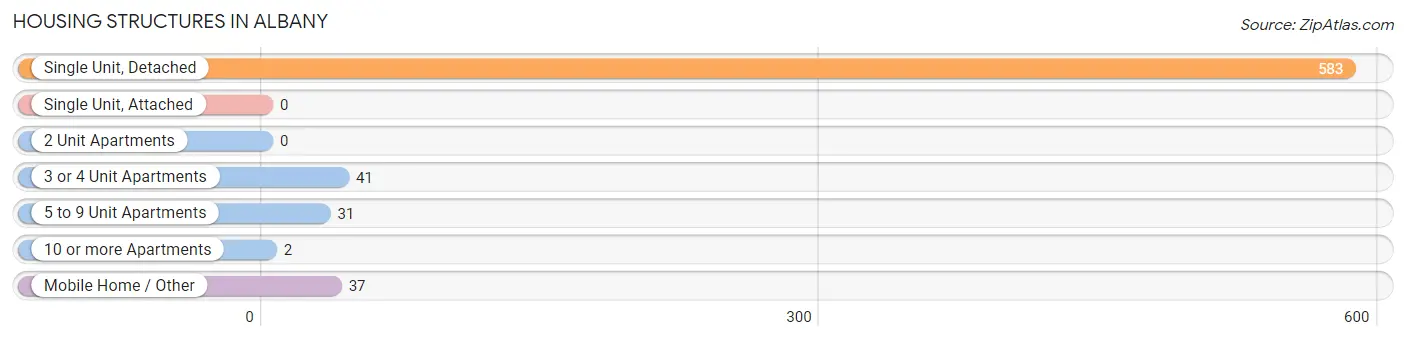
| Structure Type | # Housing Units | % Housing Units |
| Single Unit, Detached | 583 | 84.0% |
| Single Unit, Attached | 0 | 0.0% |
| 2 Unit Apartments | 0 | 0.0% |
| 3 or 4 Unit Apartments | 41 | 5.9% |
| 5 to 9 Unit Apartments | 31 | 4.5% |
| 10 or more Apartments | 2 | 0.3% |
| Mobile Home / Other | 37 | 5.3% |
| Total | 694 | 100.0% |
Housing Structures by Occupancy in Albany
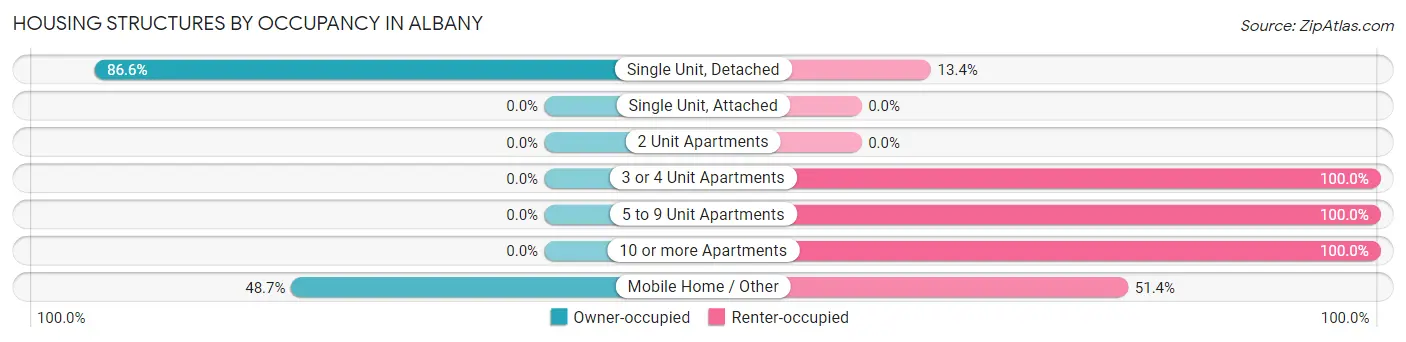
| Structure Type | Owner-occupied | Renter-occupied |
| Single Unit, Detached | 505 (86.6%) | 78 (13.4%) |
| Single Unit, Attached | 0 (0.0%) | 0 (0.0%) |
| 2 Unit Apartments | 0 (0.0%) | 0 (0.0%) |
| 3 or 4 Unit Apartments | 0 (0.0%) | 41 (100.0%) |
| 5 to 9 Unit Apartments | 0 (0.0%) | 31 (100.0%) |
| 10 or more Apartments | 0 (0.0%) | 2 (100.0%) |
| Mobile Home / Other | 18 (48.6%) | 19 (51.3%) |
| Total | 523 (75.4%) | 171 (24.6%) |
Housing Structures by Number of Rooms in Albany
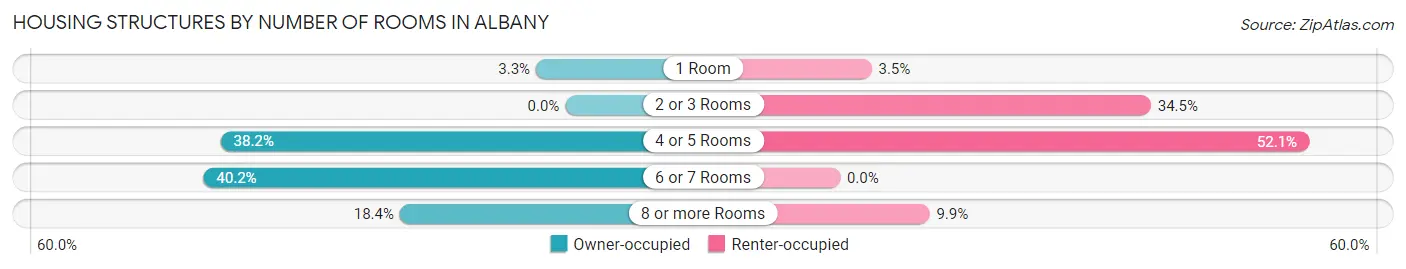
| Number of Rooms | Owner-occupied | Renter-occupied |
| 1 Room | 17 (3.3%) | 6 (3.5%) |
| 2 or 3 Rooms | 0 (0.0%) | 59 (34.5%) |
| 4 or 5 Rooms | 200 (38.2%) | 89 (52.0%) |
| 6 or 7 Rooms | 210 (40.2%) | 0 (0.0%) |
| 8 or more Rooms | 96 (18.4%) | 17 (9.9%) |
| Total | 523 (100.0%) | 171 (100.0%) |
Housing Structure by Heating Type in Albany
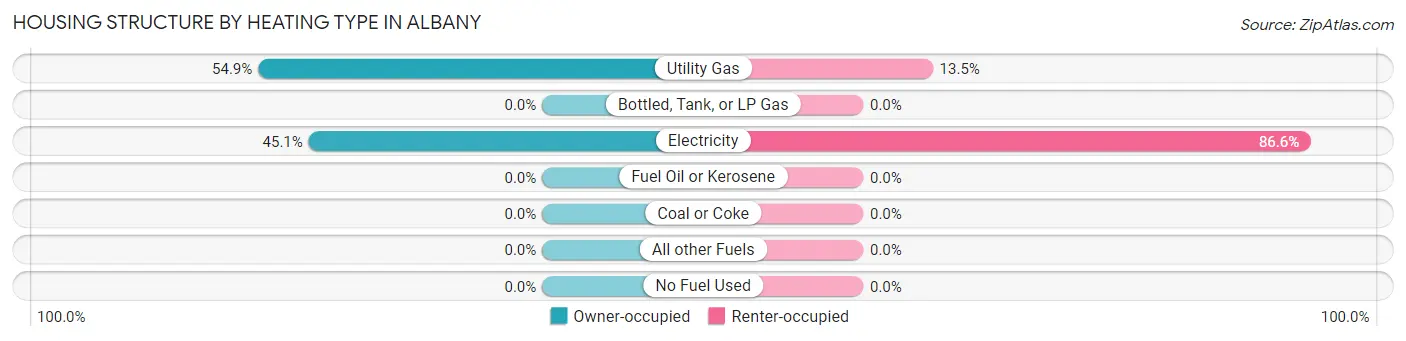
| Heating Type | Owner-occupied | Renter-occupied |
| Utility Gas | 287 (54.9%) | 23 (13.5%) |
| Bottled, Tank, or LP Gas | 0 (0.0%) | 0 (0.0%) |
| Electricity | 236 (45.1%) | 148 (86.6%) |
| Fuel Oil or Kerosene | 0 (0.0%) | 0 (0.0%) |
| Coal or Coke | 0 (0.0%) | 0 (0.0%) |
| All other Fuels | 0 (0.0%) | 0 (0.0%) |
| No Fuel Used | 0 (0.0%) | 0 (0.0%) |
| Total | 523 (100.0%) | 171 (100.0%) |
Household Vehicle Usage in Albany
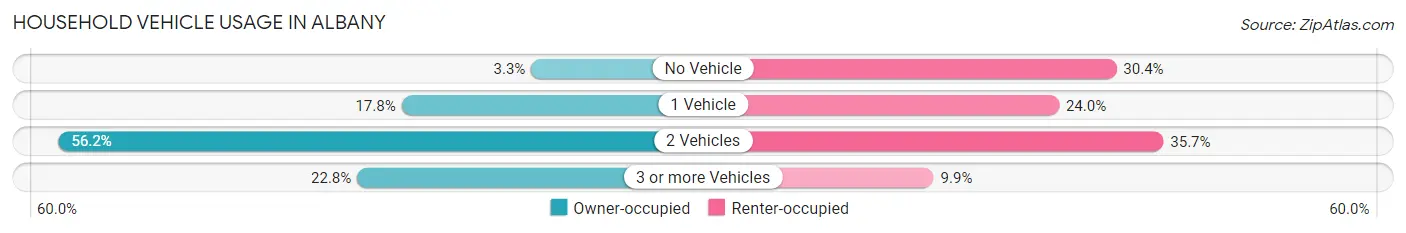
| Vehicles per Household | Owner-occupied | Renter-occupied |
| No Vehicle | 17 (3.3%) | 52 (30.4%) |
| 1 Vehicle | 93 (17.8%) | 41 (24.0%) |
| 2 Vehicles | 294 (56.2%) | 61 (35.7%) |
| 3 or more Vehicles | 119 (22.8%) | 17 (9.9%) |
| Total | 523 (100.0%) | 171 (100.0%) |
Real Estate & Mortgages in Albany
Real Estate and Mortgage Overview in Albany
| Characteristic | Without Mortgage | With Mortgage |
| Housing Units | 353 | 170 |
| Median Property Value | $112,000 | $184,700 |
| Median Household Income | $48,239 | $44 |
| Monthly Housing Costs | $532 | $0 |
| Real Estate Taxes | $1,403 | $0 |
Property Value by Mortgage Status in Albany
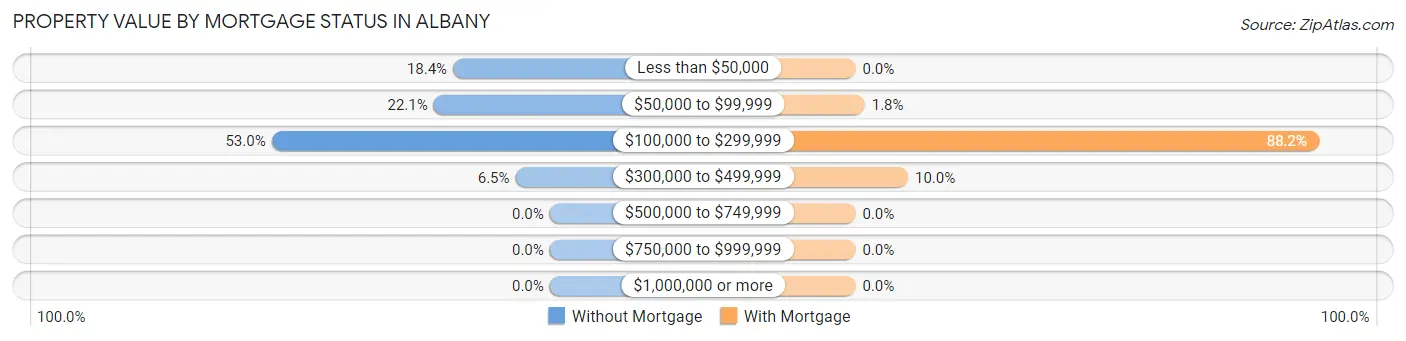
| Property Value | Without Mortgage | With Mortgage |
| Less than $50,000 | 65 (18.4%) | 0 (0.0%) |
| $50,000 to $99,999 | 78 (22.1%) | 3 (1.8%) |
| $100,000 to $299,999 | 187 (53.0%) | 150 (88.2%) |
| $300,000 to $499,999 | 23 (6.5%) | 17 (10.0%) |
| $500,000 to $749,999 | 0 (0.0%) | 0 (0.0%) |
| $750,000 to $999,999 | 0 (0.0%) | 0 (0.0%) |
| $1,000,000 or more | 0 (0.0%) | 0 (0.0%) |
| Total | 353 (100.0%) | 170 (100.0%) |
Household Income by Mortgage Status in Albany
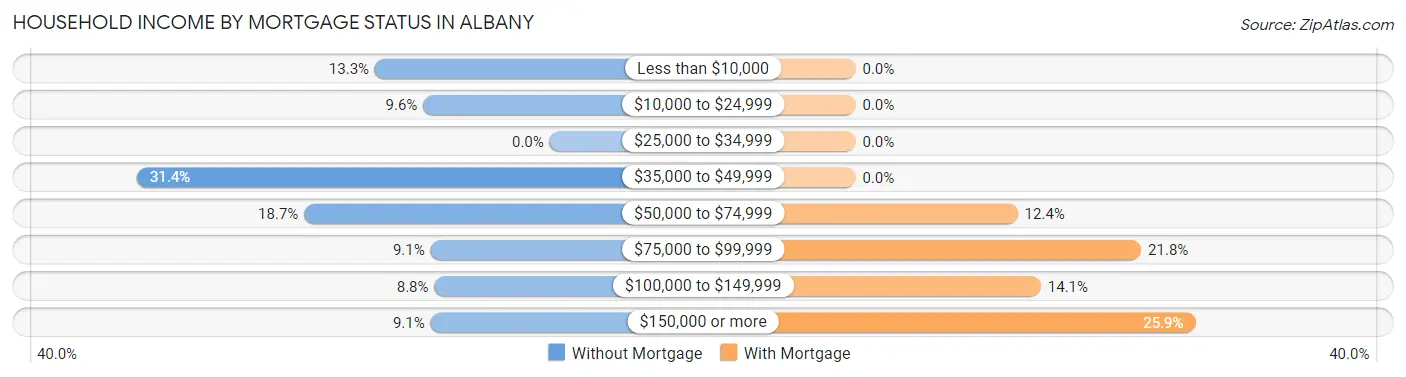
| Household Income | Without Mortgage | With Mortgage |
| Less than $10,000 | 47 (13.3%) | 0 (0.0%) |
| $10,000 to $24,999 | 34 (9.6%) | 0 (0.0%) |
| $25,000 to $34,999 | 0 (0.0%) | 0 (0.0%) |
| $35,000 to $49,999 | 111 (31.4%) | 0 (0.0%) |
| $50,000 to $74,999 | 66 (18.7%) | 21 (12.3%) |
| $75,000 to $99,999 | 32 (9.1%) | 37 (21.8%) |
| $100,000 to $149,999 | 31 (8.8%) | 24 (14.1%) |
| $150,000 or more | 32 (9.1%) | 44 (25.9%) |
| Total | 353 (100.0%) | 170 (100.0%) |
Property Value to Household Income Ratio in Albany
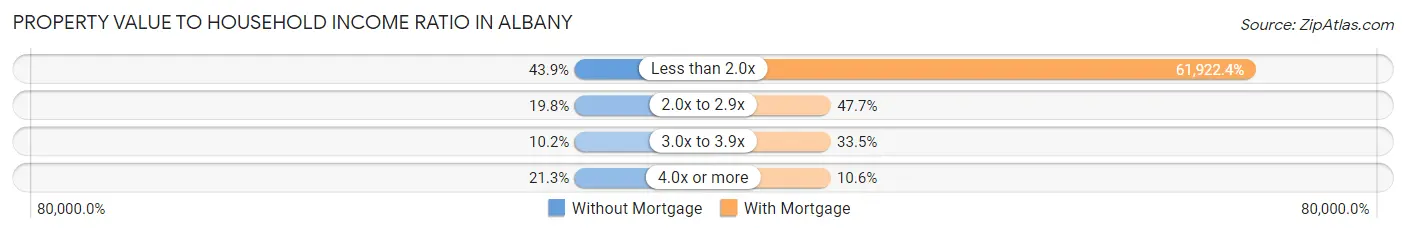
| Value-to-Income Ratio | Without Mortgage | With Mortgage |
| Less than 2.0x | 155 (43.9%) | 105,268 (61,922.3%) |
| 2.0x to 2.9x | 70 (19.8%) | 81 (47.6%) |
| 3.0x to 3.9x | 36 (10.2%) | 57 (33.5%) |
| 4.0x or more | 75 (21.2%) | 18 (10.6%) |
| Total | 353 (100.0%) | 170 (100.0%) |
Real Estate Taxes by Mortgage Status in Albany
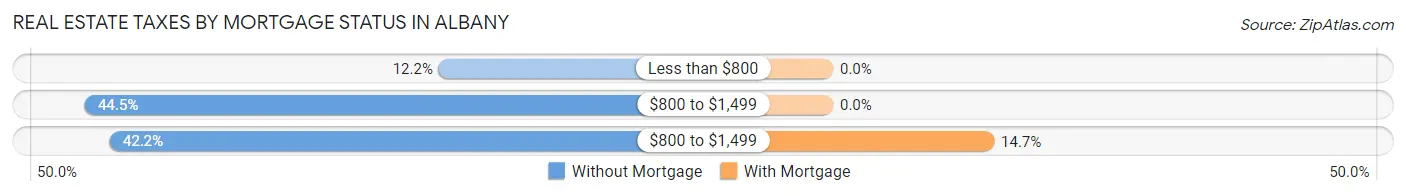
| Property Taxes | Without Mortgage | With Mortgage |
| Less than $800 | 43 (12.2%) | 0 (0.0%) |
| $800 to $1,499 | 157 (44.5%) | 0 (0.0%) |
| $800 to $1,499 | 149 (42.2%) | 25 (14.7%) |
| Total | 353 (100.0%) | 170 (100.0%) |
Health & Disability in Albany
Health Insurance Coverage by Age in Albany
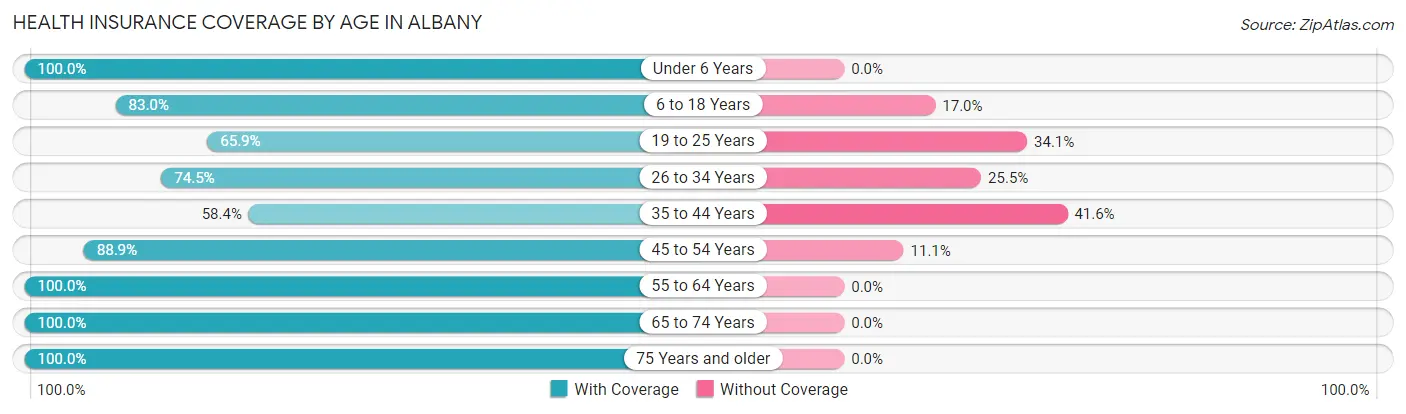
| Age Bracket | With Coverage | Without Coverage |
| Under 6 Years | 101 (100.0%) | 0 (0.0%) |
| 6 to 18 Years | 264 (83.0%) | 54 (17.0%) |
| 19 to 25 Years | 87 (65.9%) | 45 (34.1%) |
| 26 to 34 Years | 108 (74.5%) | 37 (25.5%) |
| 35 to 44 Years | 80 (58.4%) | 57 (41.6%) |
| 45 to 54 Years | 209 (88.9%) | 26 (11.1%) |
| 55 to 64 Years | 154 (100.0%) | 0 (0.0%) |
| 65 to 74 Years | 275 (100.0%) | 0 (0.0%) |
| 75 Years and older | 126 (100.0%) | 0 (0.0%) |
| Total | 1,404 (86.5%) | 219 (13.5%) |
Health Insurance Coverage by Citizenship Status in Albany
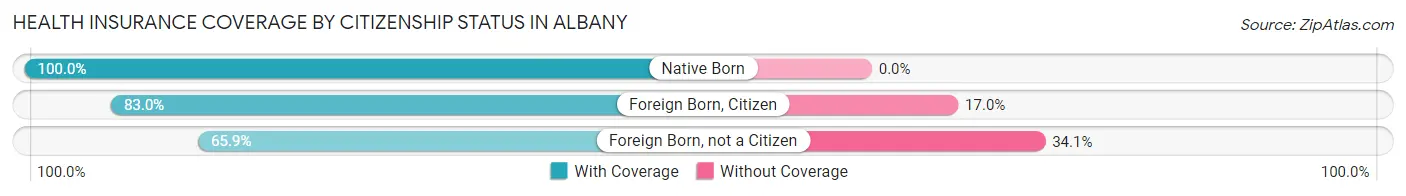
| Citizenship Status | With Coverage | Without Coverage |
| Native Born | 101 (100.0%) | 0 (0.0%) |
| Foreign Born, Citizen | 264 (83.0%) | 54 (17.0%) |
| Foreign Born, not a Citizen | 87 (65.9%) | 45 (34.1%) |
Health Insurance Coverage by Household Income in Albany
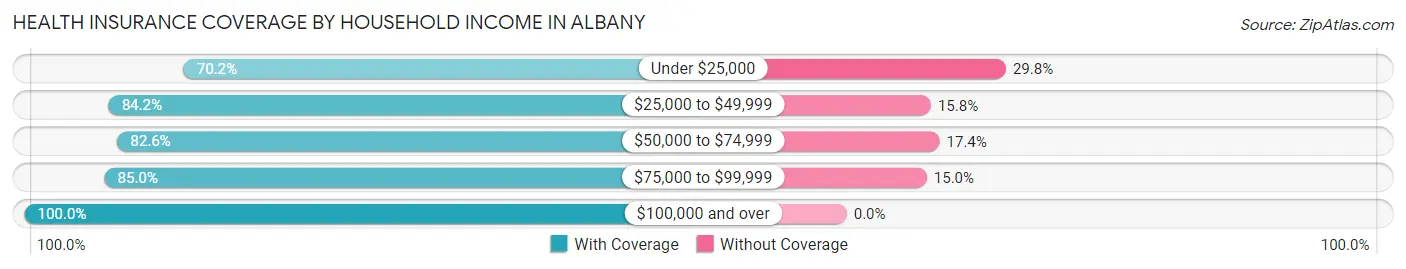
| Household Income | With Coverage | Without Coverage |
| Under $25,000 | 247 (70.2%) | 105 (29.8%) |
| $25,000 to $49,999 | 203 (84.2%) | 38 (15.8%) |
| $50,000 to $74,999 | 247 (82.6%) | 52 (17.4%) |
| $75,000 to $99,999 | 136 (85.0%) | 24 (15.0%) |
| $100,000 and over | 571 (100.0%) | 0 (0.0%) |
Public vs Private Health Insurance Coverage by Age in Albany
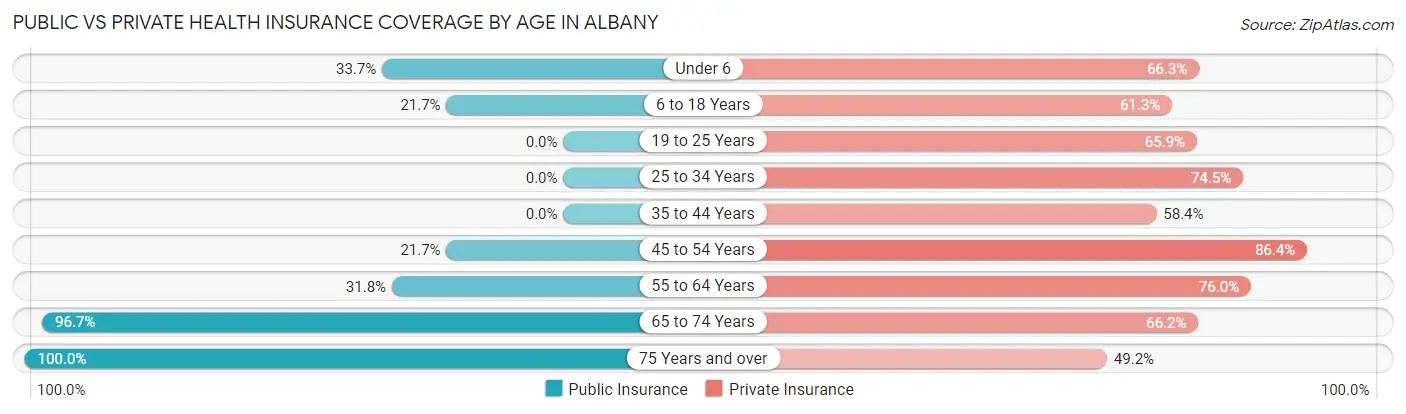
| Age Bracket | Public Insurance | Private Insurance |
| Under 6 | 34 (33.7%) | 67 (66.3%) |
| 6 to 18 Years | 69 (21.7%) | 195 (61.3%) |
| 19 to 25 Years | 0 (0.0%) | 87 (65.9%) |
| 25 to 34 Years | 0 (0.0%) | 108 (74.5%) |
| 35 to 44 Years | 0 (0.0%) | 80 (58.4%) |
| 45 to 54 Years | 51 (21.7%) | 203 (86.4%) |
| 55 to 64 Years | 49 (31.8%) | 117 (76.0%) |
| 65 to 74 Years | 266 (96.7%) | 182 (66.2%) |
| 75 Years and over | 126 (100.0%) | 62 (49.2%) |
| Total | 595 (36.7%) | 1,101 (67.8%) |
Disability Status by Sex by Age in Albany
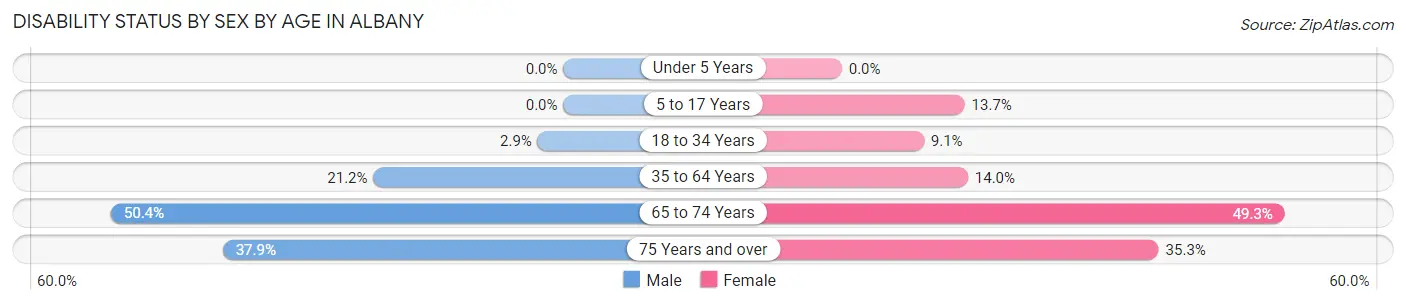
| Age Bracket | Male | Female |
| Under 5 Years | 0 (0.0%) | 0 (0.0%) |
| 5 to 17 Years | 0 (0.0%) | 16 (13.7%) |
| 18 to 34 Years | 5 (2.9%) | 16 (9.1%) |
| 35 to 64 Years | 51 (21.2%) | 40 (14.0%) |
| 65 to 74 Years | 65 (50.4%) | 72 (49.3%) |
| 75 Years and over | 22 (37.9%) | 24 (35.3%) |
Disability Class by Sex by Age in Albany
Disability Class: Hearing Difficulty
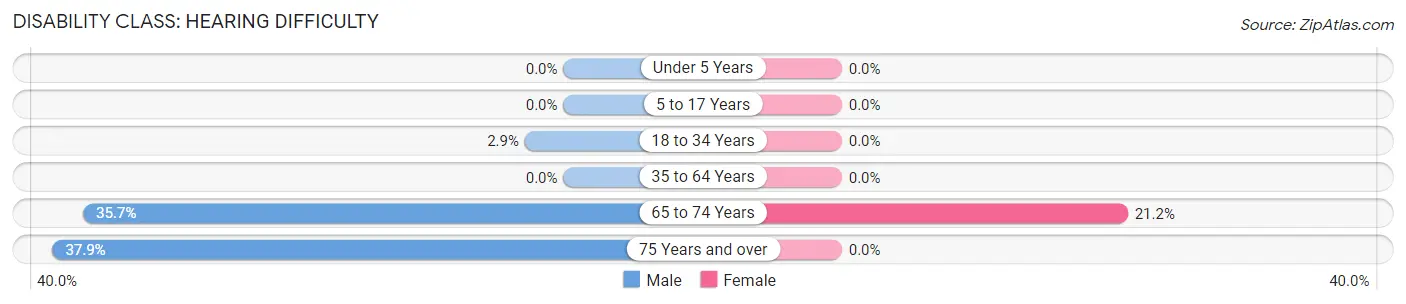
| Age Bracket | Male | Female |
| Under 5 Years | 0 (0.0%) | 0 (0.0%) |
| 5 to 17 Years | 0 (0.0%) | 0 (0.0%) |
| 18 to 34 Years | 5 (2.9%) | 0 (0.0%) |
| 35 to 64 Years | 0 (0.0%) | 0 (0.0%) |
| 65 to 74 Years | 46 (35.7%) | 31 (21.2%) |
| 75 Years and over | 22 (37.9%) | 0 (0.0%) |
Disability Class: Vision Difficulty
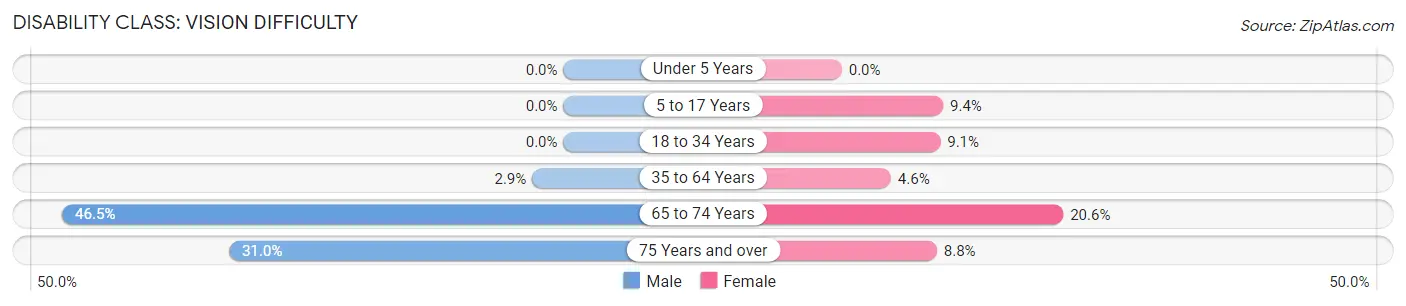
| Age Bracket | Male | Female |
| Under 5 Years | 0 (0.0%) | 0 (0.0%) |
| 5 to 17 Years | 0 (0.0%) | 11 (9.4%) |
| 18 to 34 Years | 0 (0.0%) | 16 (9.1%) |
| 35 to 64 Years | 7 (2.9%) | 13 (4.6%) |
| 65 to 74 Years | 60 (46.5%) | 30 (20.5%) |
| 75 Years and over | 18 (31.0%) | 6 (8.8%) |
Disability Class: Cognitive Difficulty
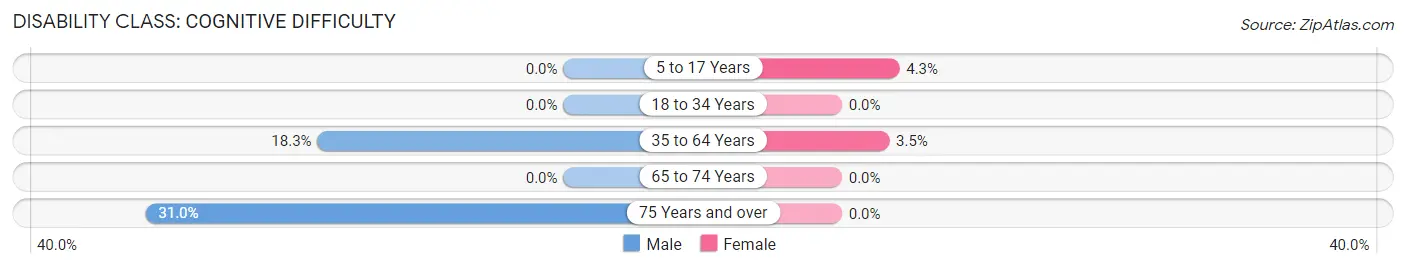
| Age Bracket | Male | Female |
| 5 to 17 Years | 0 (0.0%) | 5 (4.3%) |
| 18 to 34 Years | 0 (0.0%) | 0 (0.0%) |
| 35 to 64 Years | 44 (18.3%) | 10 (3.5%) |
| 65 to 74 Years | 0 (0.0%) | 0 (0.0%) |
| 75 Years and over | 18 (31.0%) | 0 (0.0%) |
Disability Class: Ambulatory Difficulty
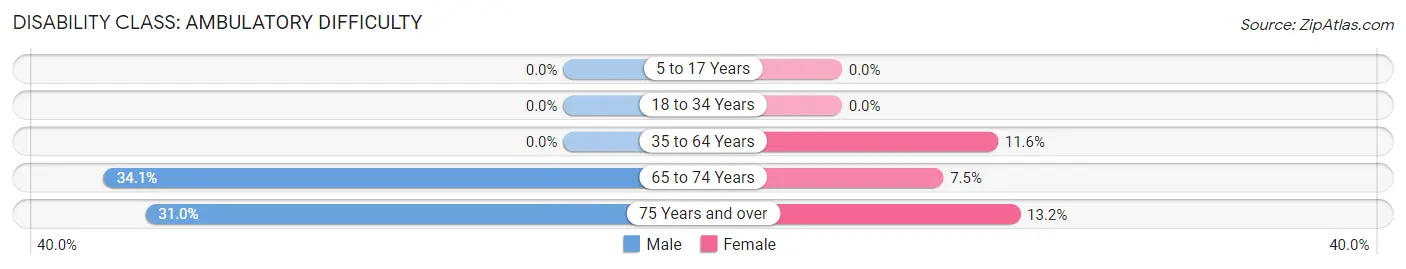
| Age Bracket | Male | Female |
| 5 to 17 Years | 0 (0.0%) | 0 (0.0%) |
| 18 to 34 Years | 0 (0.0%) | 0 (0.0%) |
| 35 to 64 Years | 0 (0.0%) | 33 (11.6%) |
| 65 to 74 Years | 44 (34.1%) | 11 (7.5%) |
| 75 Years and over | 18 (31.0%) | 9 (13.2%) |
Disability Class: Self-Care Difficulty
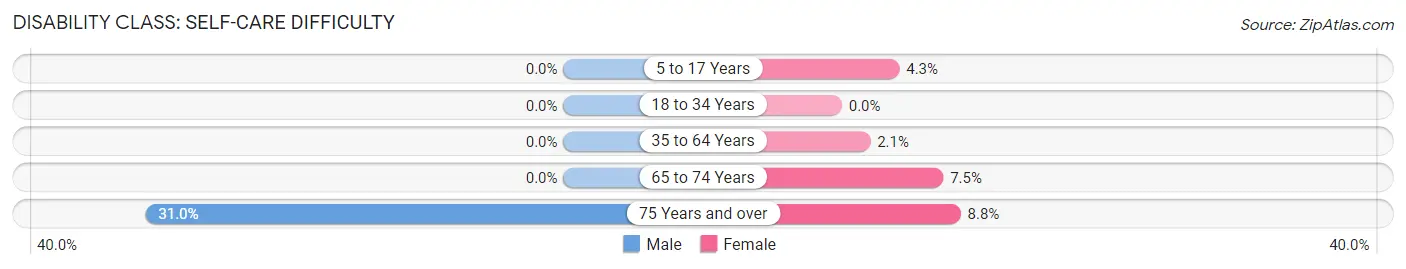
| Age Bracket | Male | Female |
| 5 to 17 Years | 0 (0.0%) | 5 (4.3%) |
| 18 to 34 Years | 0 (0.0%) | 0 (0.0%) |
| 35 to 64 Years | 0 (0.0%) | 6 (2.1%) |
| 65 to 74 Years | 0 (0.0%) | 11 (7.5%) |
| 75 Years and over | 18 (31.0%) | 6 (8.8%) |
Technology Access in Albany
Computing Device Access in Albany
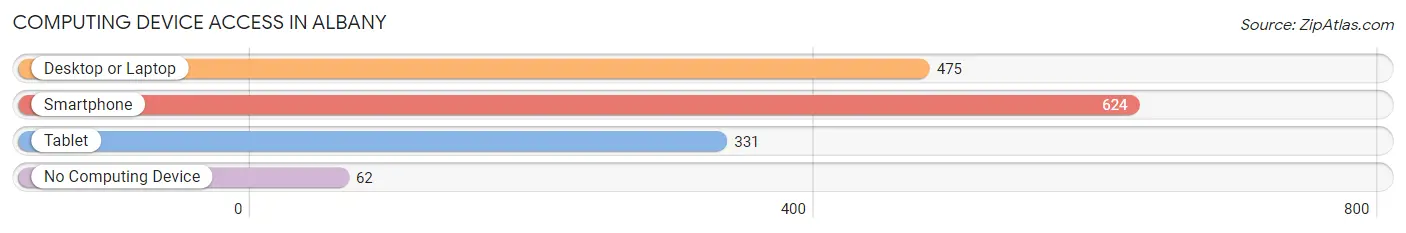
| Device Type | # Households | % Households |
| Desktop or Laptop | 475 | 68.4% |
| Smartphone | 624 | 89.9% |
| Tablet | 331 | 47.7% |
| No Computing Device | 62 | 8.9% |
| Total | 694 | 100.0% |
Internet Access in Albany
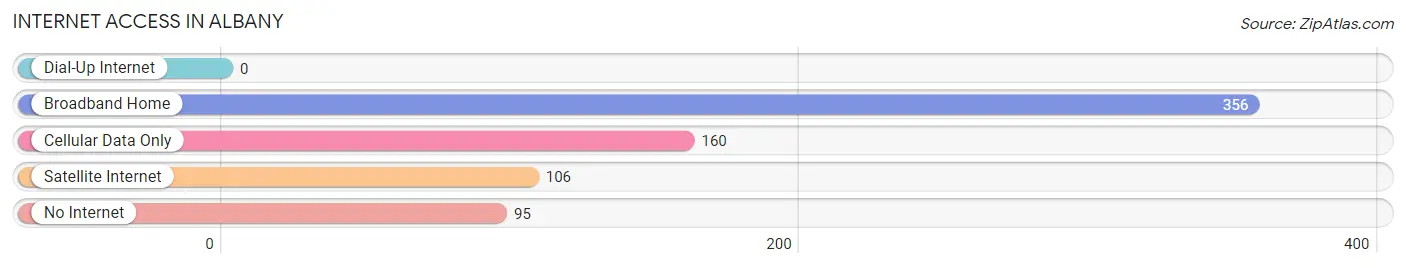
| Internet Type | # Households | % Households |
| Dial-Up Internet | 0 | 0.0% |
| Broadband Home | 356 | 51.3% |
| Cellular Data Only | 160 | 23.1% |
| Satellite Internet | 106 | 15.3% |
| No Internet | 95 | 13.7% |
| Total | 694 | 100.0% |
Albany Summary
Albany is a small town located in Shackelford County, Texas, United States. It is situated on the banks of the Clear Fork of the Brazos River, approximately 100 miles west of Fort Worth. The population was 1,082 at the 2010 census.
History
Albany was founded in 1876 by a group of settlers from the nearby town of Fort Griffin. The town was named after Albany, New York, the hometown of one of the settlers. The town was incorporated in 1882 and soon became a center of commerce for the surrounding area.
In the late 19th century, Albany was a bustling town with a variety of businesses, including a hotel, a bank, a livery stable, a blacksmith shop, a cotton gin, and a saloon. The town also had a school, a post office, and a newspaper.
In the early 20th century, Albany experienced a period of growth and prosperity. The town was home to several businesses, including a cotton gin, a flour mill, a creamery, a lumber yard, and a brickyard. The town also had a movie theater, a hospital, and a library.
Geography
Albany is located at the intersection of U.S. Route 180 and State Highway 6, approximately 100 miles west of Fort Worth. The town is situated on the banks of the Clear Fork of the Brazos River. The terrain is mostly flat, with some rolling hills in the area.
The climate in Albany is semi-arid, with hot summers and mild winters. The average annual temperature is 68°F, and the average annual precipitation is 22 inches.
Economy
The economy of Albany is largely based on agriculture. The town is home to several farms, which produce cotton, wheat, corn, and hay. The town also has a few small businesses, including a grocery store, a hardware store, and a restaurant.
Demographics
As of the 2010 census, the population of Albany was 1,082. The racial makeup of the town was 94.3% White, 0.7% African American, 0.2% Native American, 0.2% Asian, 0.1% Pacific Islander, 3.2% from other races, and 1.4% from two or more races. Hispanic or Latino of any race were 6.2% of the population.
The median household income in Albany was $31,250, and the median family income was $37,500. The per capita income was $17,845. About 16.2% of families and 19.2% of the population were below the poverty line, including 25.2% of those under age 18 and 10.2% of those age 65 or over.
Common Questions
What is Per Capita Income in Albany?
Per Capita income in Albany is $31,189.
What is the Median Family Income in Albany?
Median Family Income in Albany is $65,278.
What is the Median Household income in Albany?
Median Household Income in Albany is $48,182.
What is Income or Wage Gap in Albany?
Income or Wage Gap in Albany is 31.9%.
Women in Albany earn 68.1 cents for every dollar earned by a man.
What is Inequality or Gini Index in Albany?
Inequality or Gini Index in Albany is 0.47.
What is the Total Population of Albany?
Total Population of Albany is 1,644.
What is the Total Male Population of Albany?
Total Male Population of Albany is 820.
What is the Total Female Population of Albany?
Total Female Population of Albany is 824.
What is the Ratio of Males per 100 Females in Albany?
There are 99.51 Males per 100 Females in Albany.
What is the Ratio of Females per 100 Males in Albany?
There are 100.49 Females per 100 Males in Albany.
What is the Median Population Age in Albany?
Median Population Age in Albany is 44.1 Years.
What is the Average Family Size in Albany
Average Family Size in Albany is 2.9 People.
What is the Average Household Size in Albany
Average Household Size in Albany is 2.3 People.
How Large is the Labor Force in Albany?
There are 849 People in the Labor Forcein in Albany.
What is the Percentage of People in the Labor Force in Albany?
62.3% of People are in the Labor Force in Albany.
What is the Unemployment Rate in Albany?
Unemployment Rate in Albany is 11.7%.