Alba, TX Map & Demographics
Alba Map
Alba Overview
$28,675
PER CAPITA INCOME
$70,982
AVG FAMILY INCOME
$45,313
AVG HOUSEHOLD INCOME
66.9%
WAGE / INCOME GAP [ % ]
33.1¢/ $1
WAGE / INCOME GAP [ $ ]
0.42
INEQUALITY / GINI INDEX
538
TOTAL POPULATION
255
MALE POPULATION
283
FEMALE POPULATION
90.11
MALES / 100 FEMALES
110.98
FEMALES / 100 MALES
56.0
MEDIAN AGE
3.0
AVG FAMILY SIZE
2.4
AVG HOUSEHOLD SIZE
182
LABOR FORCE [ PEOPLE ]
40.0%
PERCENT IN LABOR FORCE
2.2%
UNEMPLOYMENT RATE
Alba Zip Codes
Alba Area Codes
Income in Alba
Income Overview in Alba
Per Capita Income in Alba is $28,675, while median incomes of families and households are $70,982 and $45,313 respectively.
| Characteristic | Number | Measure |
| Per Capita Income | 538 | $28,675 |
| Median Family Income | 133 | $70,982 |
| Mean Family Income | 133 | $83,454 |
| Median Household Income | 229 | $45,313 |
| Mean Household Income | 229 | $65,252 |
| Income Deficit | 133 | $0 |
| Wage / Income Gap (%) | 538 | 66.91% |
| Wage / Income Gap ($) | 538 | 33.09¢ per $1 |
| Gini / Inequality Index | 538 | 0.42 |
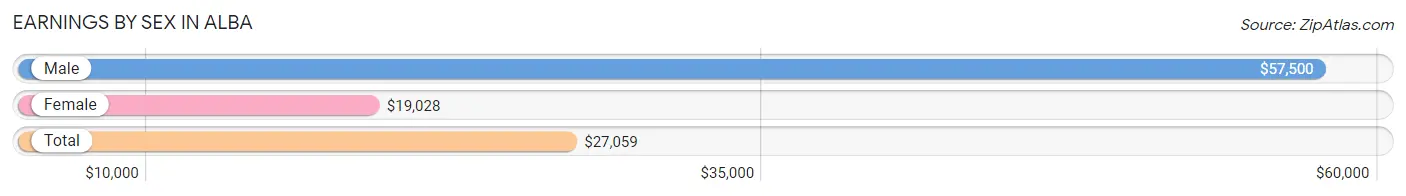
Earnings by Sex in Alba
Average Earnings in Alba are $27,059, $57,500 for men and $19,028 for women, a difference of 66.9%.
| Sex | Number | Average Earnings |
| Male | 74 (37.8%) | $57,500 |
| Female | 122 (62.2%) | $19,028 |
| Total | 196 (100.0%) | $27,059 |
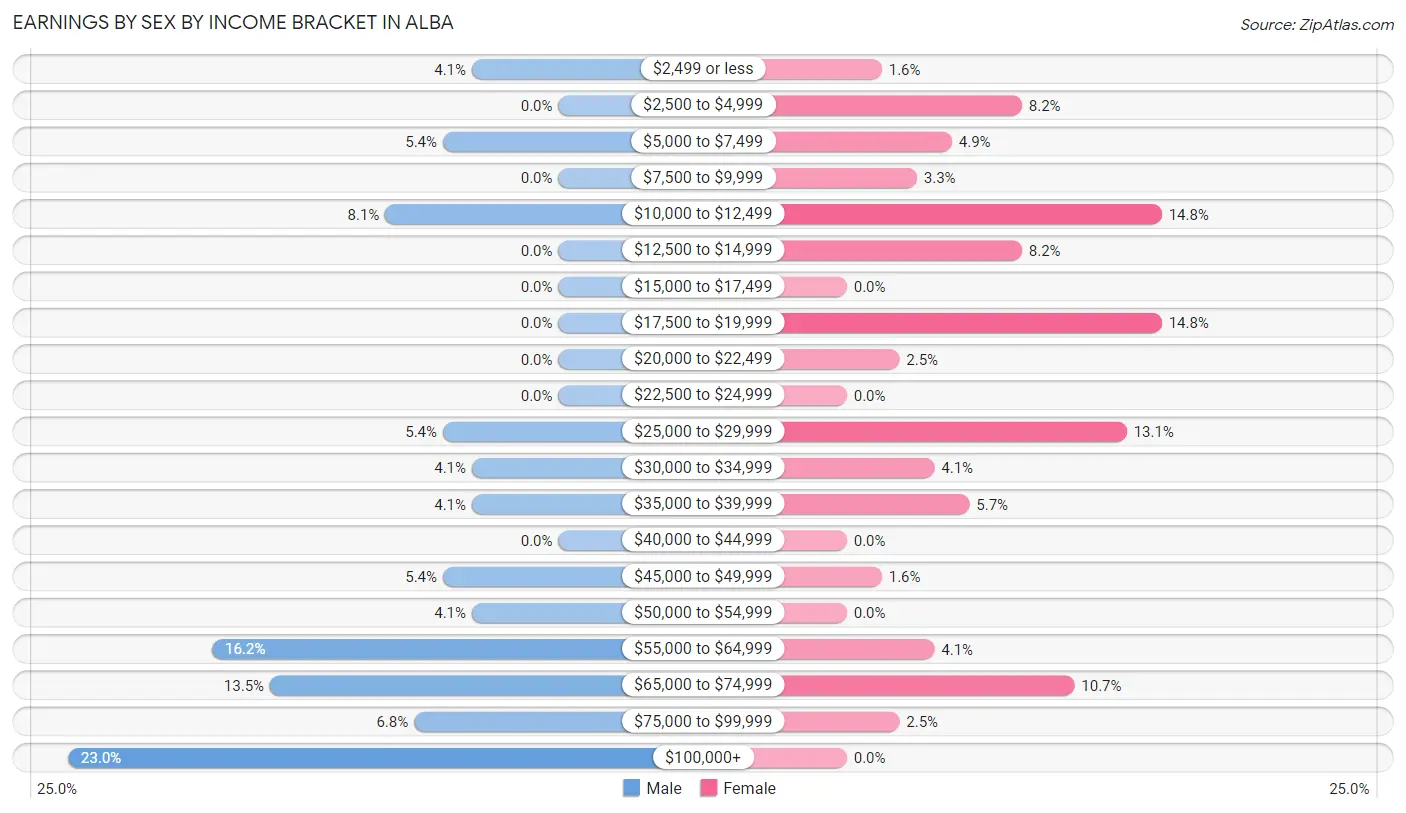
Earnings by Sex by Income Bracket in Alba
The most common earnings brackets in Alba are $100,000+ for men (17 | 23.0%) and $10,000 to $12,499 for women (18 | 14.7%).
| Income | Male | Female |
| $2,499 or less | 3 (4.1%) | 2 (1.6%) |
| $2,500 to $4,999 | 0 (0.0%) | 10 (8.2%) |
| $5,000 to $7,499 | 4 (5.4%) | 6 (4.9%) |
| $7,500 to $9,999 | 0 (0.0%) | 4 (3.3%) |
| $10,000 to $12,499 | 6 (8.1%) | 18 (14.7%) |
| $12,500 to $14,999 | 0 (0.0%) | 10 (8.2%) |
| $15,000 to $17,499 | 0 (0.0%) | 0 (0.0%) |
| $17,500 to $19,999 | 0 (0.0%) | 18 (14.7%) |
| $20,000 to $22,499 | 0 (0.0%) | 3 (2.5%) |
| $22,500 to $24,999 | 0 (0.0%) | 0 (0.0%) |
| $25,000 to $29,999 | 4 (5.4%) | 16 (13.1%) |
| $30,000 to $34,999 | 3 (4.1%) | 5 (4.1%) |
| $35,000 to $39,999 | 3 (4.1%) | 7 (5.7%) |
| $40,000 to $44,999 | 0 (0.0%) | 0 (0.0%) |
| $45,000 to $49,999 | 4 (5.4%) | 2 (1.6%) |
| $50,000 to $54,999 | 3 (4.1%) | 0 (0.0%) |
| $55,000 to $64,999 | 12 (16.2%) | 5 (4.1%) |
| $65,000 to $74,999 | 10 (13.5%) | 13 (10.7%) |
| $75,000 to $99,999 | 5 (6.8%) | 3 (2.5%) |
| $100,000+ | 17 (23.0%) | 0 (0.0%) |
| Total | 74 (100.0%) | 122 (100.0%) |
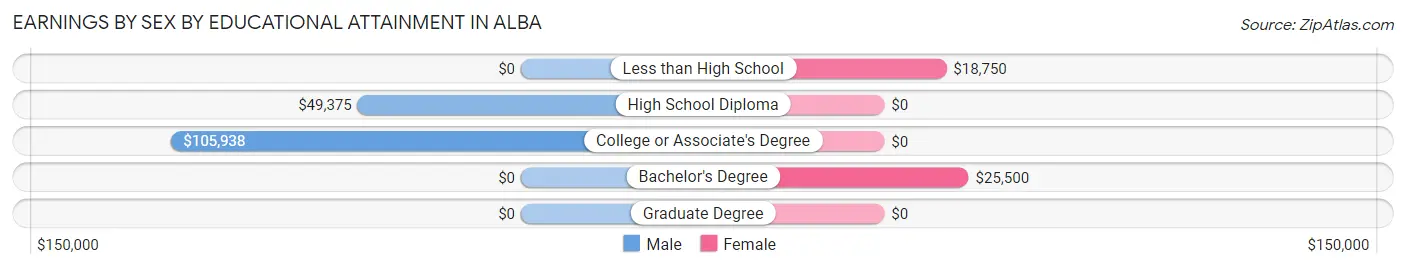
Earnings by Sex by Educational Attainment in Alba
Average earnings in Alba are $63,125 for men and $21,250 for women, a difference of 66.3%. Men with an educational attainment of college or associate's degree enjoy the highest average annual earnings of $105,938, while those with high school diploma education earn the least with $49,375. Women with an educational attainment of bachelor's degree earn the most with the average annual earnings of $25,500, while those with less than high school education have the smallest earnings of $18,750.
| Educational Attainment | Male Income | Female Income |
| Less than High School | - | - |
| High School Diploma | $49,375 | $0 |
| College or Associate's Degree | $105,938 | $0 |
| Bachelor's Degree | - | - |
| Graduate Degree | - | - |
| Total | $63,125 | $21,250 |
Family Income in Alba
Family Income Brackets in Alba
According to the Alba family income data, there are 32 families falling into the $50,000 to $74,999 income range, which is the most common income bracket and makes up 24.1% of all families.
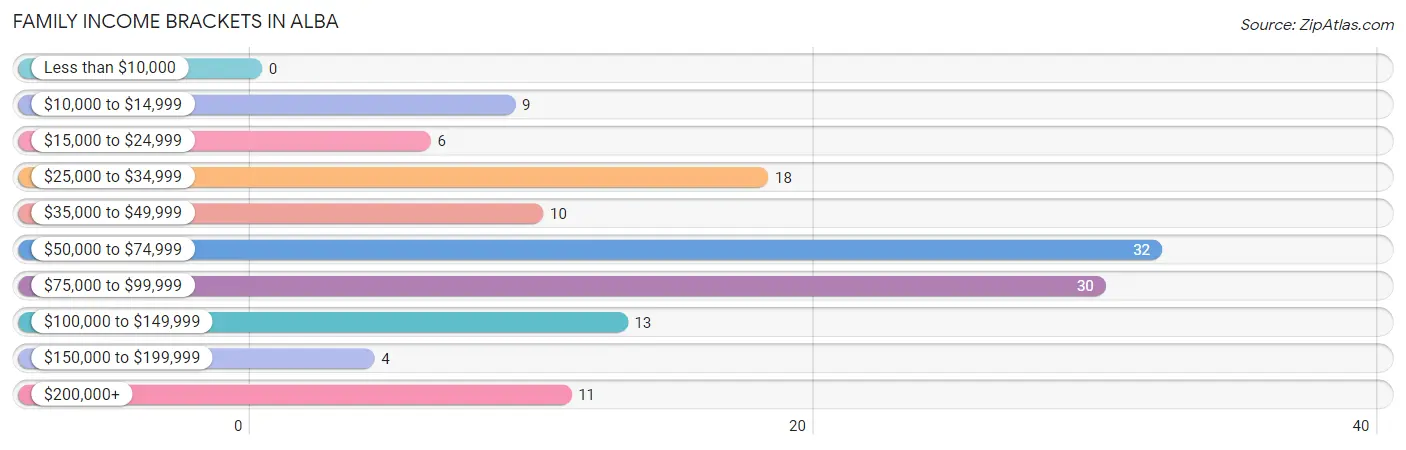
| Income Bracket | # Families | % Families |
| Less than $10,000 | 0 | 0.0% |
| $10,000 to $14,999 | 9 | 6.8% |
| $15,000 to $24,999 | 6 | 4.5% |
| $25,000 to $34,999 | 18 | 13.5% |
| $35,000 to $49,999 | 10 | 7.5% |
| $50,000 to $74,999 | 32 | 24.1% |
| $75,000 to $99,999 | 30 | 22.6% |
| $100,000 to $149,999 | 13 | 9.8% |
| $150,000 to $199,999 | 4 | 3.0% |
| $200,000+ | 11 | 8.3% |
Family Income by Famaliy Size in Alba
5-person families (14 | 10.5%) account for the highest median family income in Alba with $117,500 per family, while 3-person families (23 | 17.3%) have the highest median income of $26,319 per family member.
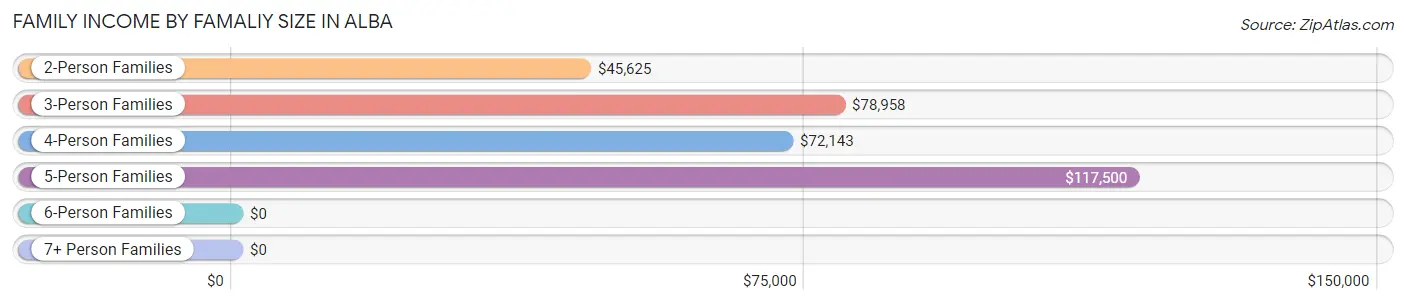
| Income Bracket | # Families | Median Income |
| 2-Person Families | 80 (60.2%) | $45,625 |
| 3-Person Families | 23 (17.3%) | $78,958 |
| 4-Person Families | 12 (9.0%) | $72,143 |
| 5-Person Families | 14 (10.5%) | $117,500 |
| 6-Person Families | 3 (2.3%) | $0 |
| 7+ Person Families | 1 (0.7%) | $0 |
| Total | 133 (100.0%) | $70,982 |
Family Income by Number of Earners in Alba
The median family income in Alba is $70,982, with families comprising 3+ earners (20) having the highest median family income of $98,750, while families with no earners (33) have the lowest median family income of $54,375, accounting for 15.0% and 24.8% of families, respectively.
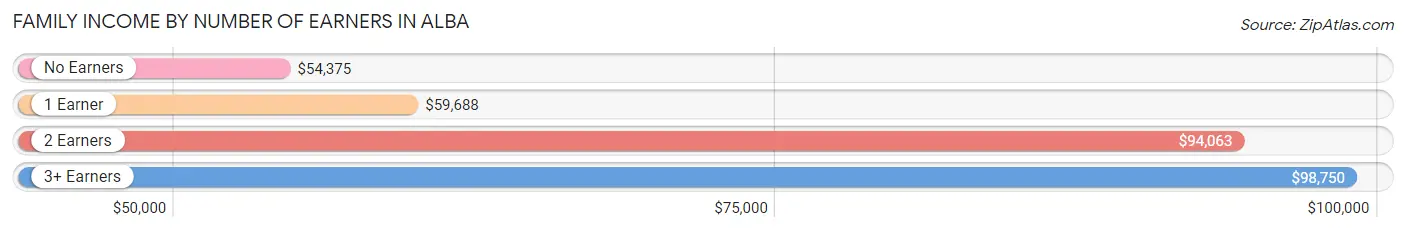
| Number of Earners | # Families | Median Income |
| No Earners | 33 (24.8%) | $54,375 |
| 1 Earner | 49 (36.8%) | $59,688 |
| 2 Earners | 31 (23.3%) | $94,063 |
| 3+ Earners | 20 (15.0%) | $98,750 |
| Total | 133 (100.0%) | $70,982 |
Household Income in Alba
Household Income Brackets in Alba
With 46 households falling in the category, the $50,000 to $74,999 income range is the most frequent in Alba, accounting for 20.1% of all households. In contrast, only 3 households (1.3%) fall into the less than $10,000 income bracket, making it the least populous group.
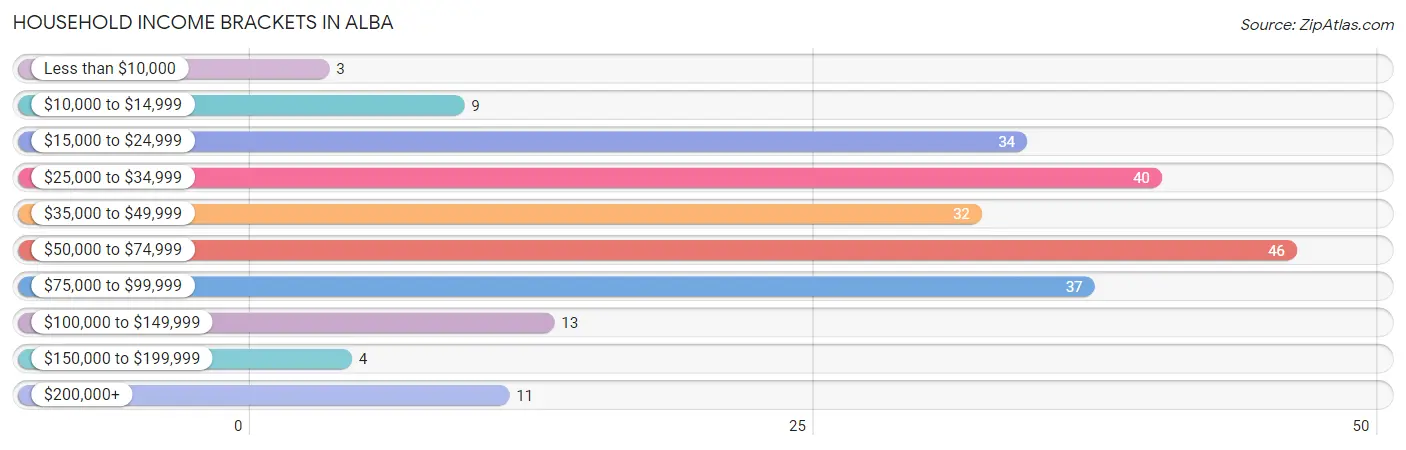
| Income Bracket | # Households | % Households |
| Less than $10,000 | 3 | 1.3% |
| $10,000 to $14,999 | 9 | 3.9% |
| $15,000 to $24,999 | 34 | 14.8% |
| $25,000 to $34,999 | 40 | 17.5% |
| $35,000 to $49,999 | 32 | 14.0% |
| $50,000 to $74,999 | 46 | 20.1% |
| $75,000 to $99,999 | 37 | 16.2% |
| $100,000 to $149,999 | 13 | 5.7% |
| $150,000 to $199,999 | 4 | 1.7% |
| $200,000+ | 11 | 4.8% |
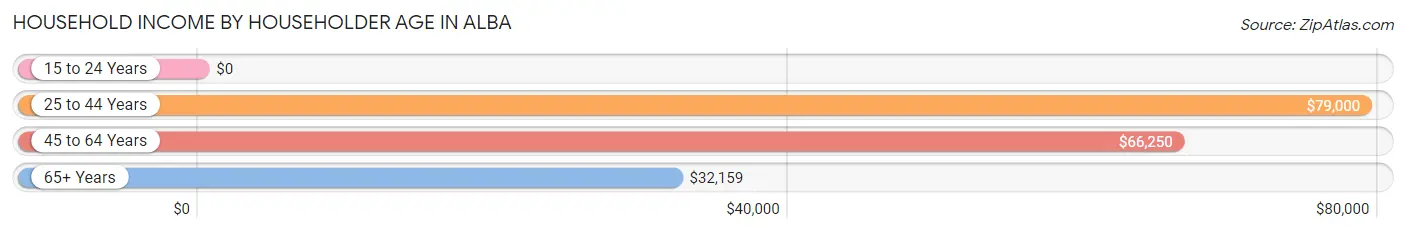
Household Income by Householder Age in Alba
The median household income in Alba is $45,313, with the highest median household income of $79,000 found in the 25 to 44 years age bracket for the primary householder. A total of 34 households (14.8%) fall into this category. Meanwhile, the 15 to 24 years age bracket for the primary householder has the lowest median household income of $0, with 3 households (1.3%) in this group.
| Income Bracket | # Households | Median Income |
| 15 to 24 Years | 3 (1.3%) | $0 |
| 25 to 44 Years | 34 (14.8%) | $79,000 |
| 45 to 64 Years | 102 (44.5%) | $66,250 |
| 65+ Years | 90 (39.3%) | $32,159 |
| Total | 229 (100.0%) | $45,313 |
Poverty in Alba
Income Below Poverty by Sex and Age in Alba
With 19.2% poverty level for males and 5.0% for females among the residents of Alba, 55 to 64 year old males and 16 and 17 year old females are the most vulnerable to poverty, with 38 males (51.3%) and 1 females (100.0%) in their respective age groups living below the poverty level.
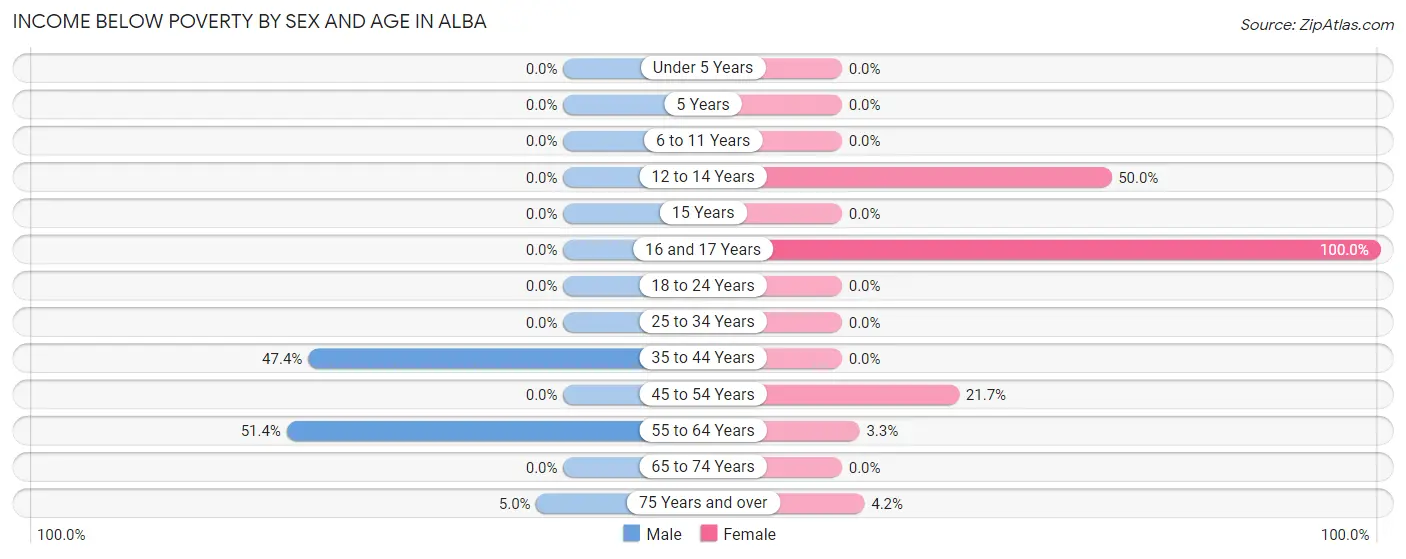
| Age Bracket | Male | Female |
| Under 5 Years | 0 (0.0%) | 0 (0.0%) |
| 5 Years | 0 (0.0%) | 0 (0.0%) |
| 6 to 11 Years | 0 (0.0%) | 0 (0.0%) |
| 12 to 14 Years | 0 (0.0%) | 4 (50.0%) |
| 15 Years | 0 (0.0%) | 0 (0.0%) |
| 16 and 17 Years | 0 (0.0%) | 1 (100.0%) |
| 18 to 24 Years | 0 (0.0%) | 0 (0.0%) |
| 25 to 34 Years | 0 (0.0%) | 0 (0.0%) |
| 35 to 44 Years | 9 (47.4%) | 0 (0.0%) |
| 45 to 54 Years | 0 (0.0%) | 5 (21.7%) |
| 55 to 64 Years | 38 (51.3%) | 2 (3.3%) |
| 65 to 74 Years | 0 (0.0%) | 0 (0.0%) |
| 75 Years and over | 2 (5.0%) | 2 (4.2%) |
| Total | 49 (19.2%) | 14 (5.0%) |
Income Above Poverty by Sex and Age in Alba
According to the poverty statistics in Alba, males aged under 5 years and females aged under 5 years are the age groups that are most secure financially, with 100.0% of males and 100.0% of females in these age groups living above the poverty line.
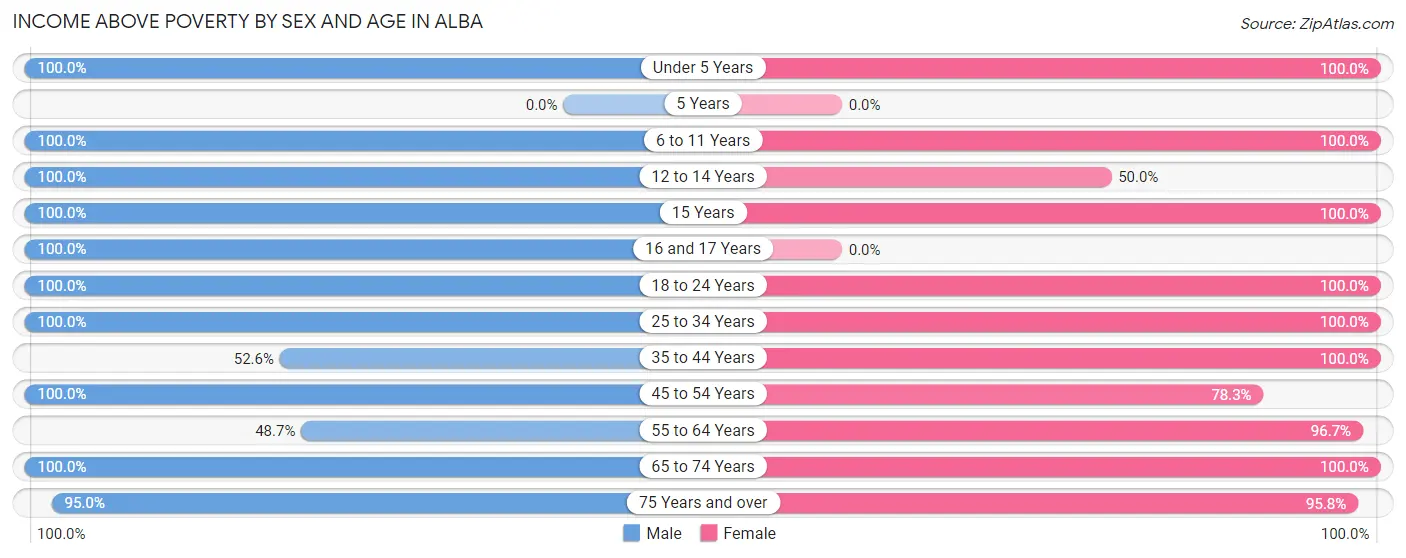
| Age Bracket | Male | Female |
| Under 5 Years | 6 (100.0%) | 16 (100.0%) |
| 5 Years | 0 (0.0%) | 0 (0.0%) |
| 6 to 11 Years | 15 (100.0%) | 3 (100.0%) |
| 12 to 14 Years | 20 (100.0%) | 4 (50.0%) |
| 15 Years | 3 (100.0%) | 12 (100.0%) |
| 16 and 17 Years | 9 (100.0%) | 0 (0.0%) |
| 18 to 24 Years | 10 (100.0%) | 36 (100.0%) |
| 25 to 34 Years | 5 (100.0%) | 13 (100.0%) |
| 35 to 44 Years | 10 (52.6%) | 39 (100.0%) |
| 45 to 54 Years | 29 (100.0%) | 18 (78.3%) |
| 55 to 64 Years | 36 (48.6%) | 59 (96.7%) |
| 65 to 74 Years | 25 (100.0%) | 23 (100.0%) |
| 75 Years and over | 38 (95.0%) | 46 (95.8%) |
| Total | 206 (80.8%) | 269 (95.1%) |
Income Below Poverty Among Married-Couple Families in Alba
The poverty statistics for married-couple families in Alba show that 2.0% or 2 of the total 101 families live below the poverty line. Families with no children have the highest poverty rate of 2.9%, comprising of 2 families. On the other hand, families with 1 or 2 children have the lowest poverty rate of 0.0%, which includes 0 families.
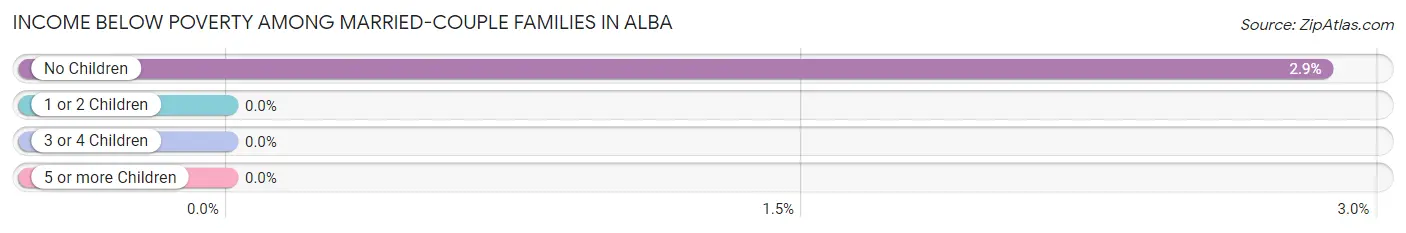
| Children | Above Poverty | Below Poverty |
| No Children | 68 (97.1%) | 2 (2.9%) |
| 1 or 2 Children | 25 (100.0%) | 0 (0.0%) |
| 3 or 4 Children | 6 (100.0%) | 0 (0.0%) |
| 5 or more Children | 0 (0.0%) | 0 (0.0%) |
| Total | 99 (98.0%) | 2 (2.0%) |
Income Below Poverty Among Single-Parent Households in Alba
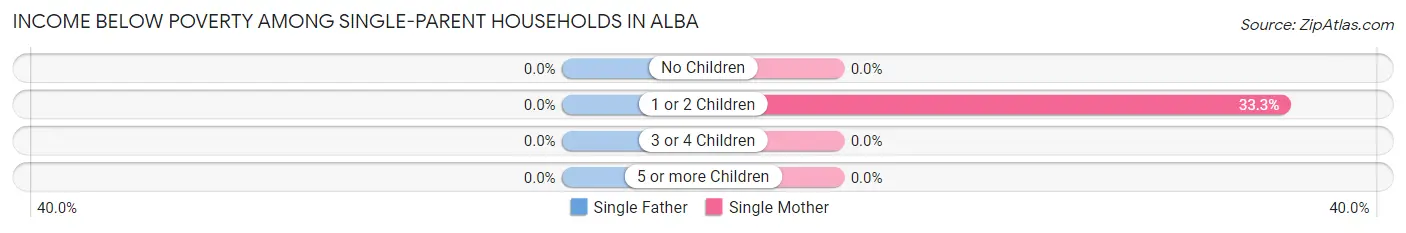
| Children | Single Father | Single Mother |
| No Children | 0 (0.0%) | 0 (0.0%) |
| 1 or 2 Children | 0 (0.0%) | 7 (33.3%) |
| 3 or 4 Children | 0 (0.0%) | 0 (0.0%) |
| 5 or more Children | 0 (0.0%) | 0 (0.0%) |
| Total | 0 (0.0%) | 7 (26.9%) |
Income Below Poverty Among Married-Couple vs Single-Parent Households in Alba
The poverty data for Alba shows that 2 of the married-couple family households (2.0%) and 7 of the single-parent households (21.9%) are living below the poverty level. Within the married-couple family households, those with no children have the highest poverty rate, with 2 households (2.9%) falling below the poverty line. Among the single-parent households, those with 1 or 2 children have the highest poverty rate, with 7 household (33.3%) living below poverty.
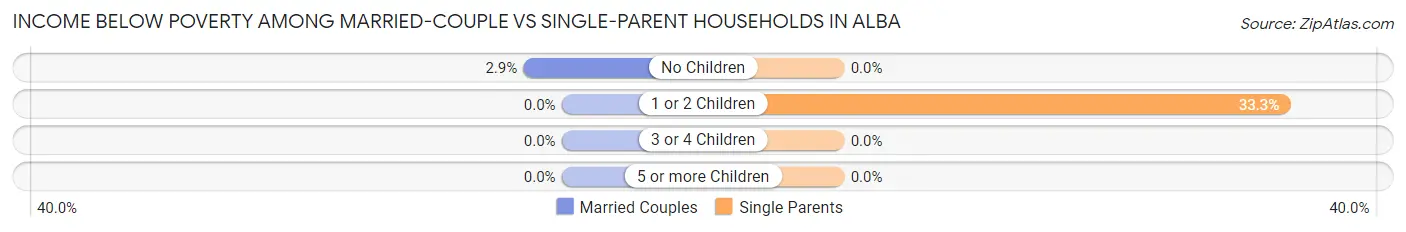
| Children | Married-Couple Families | Single-Parent Households |
| No Children | 2 (2.9%) | 0 (0.0%) |
| 1 or 2 Children | 0 (0.0%) | 7 (33.3%) |
| 3 or 4 Children | 0 (0.0%) | 0 (0.0%) |
| 5 or more Children | 0 (0.0%) | 0 (0.0%) |
| Total | 2 (2.0%) | 7 (21.9%) |
Race in Alba
The most populous races in Alba are White / Caucasian (453 | 84.2%), Two or more Races (38 | 7.1%), and Black / African American (29 | 5.4%).
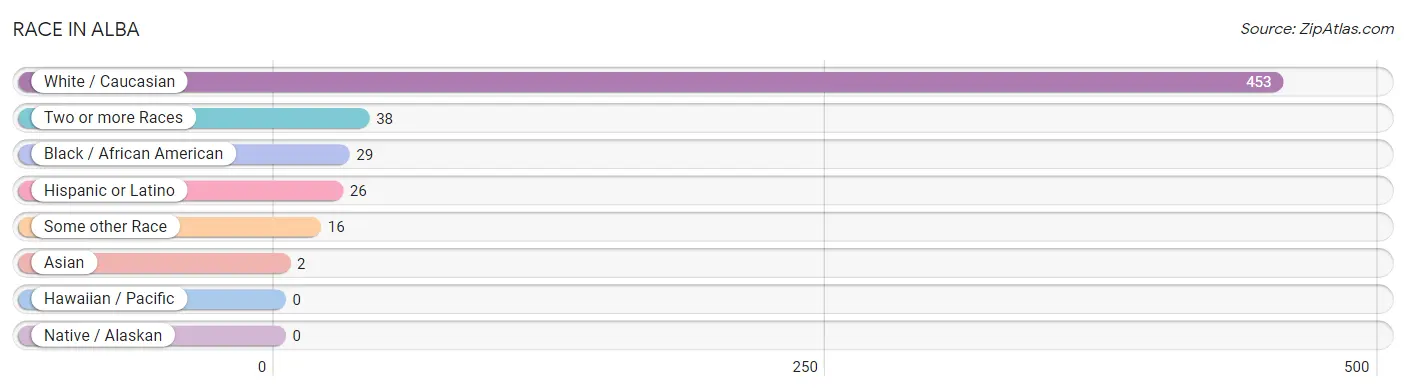
| Race | # Population | % Population |
| Asian | 2 | 0.4% |
| Black / African American | 29 | 5.4% |
| Hawaiian / Pacific | 0 | 0.0% |
| Hispanic or Latino | 26 | 4.8% |
| Native / Alaskan | 0 | 0.0% |
| White / Caucasian | 453 | 84.2% |
| Two or more Races | 38 | 7.1% |
| Some other Race | 16 | 3.0% |
| Total | 538 | 100.0% |
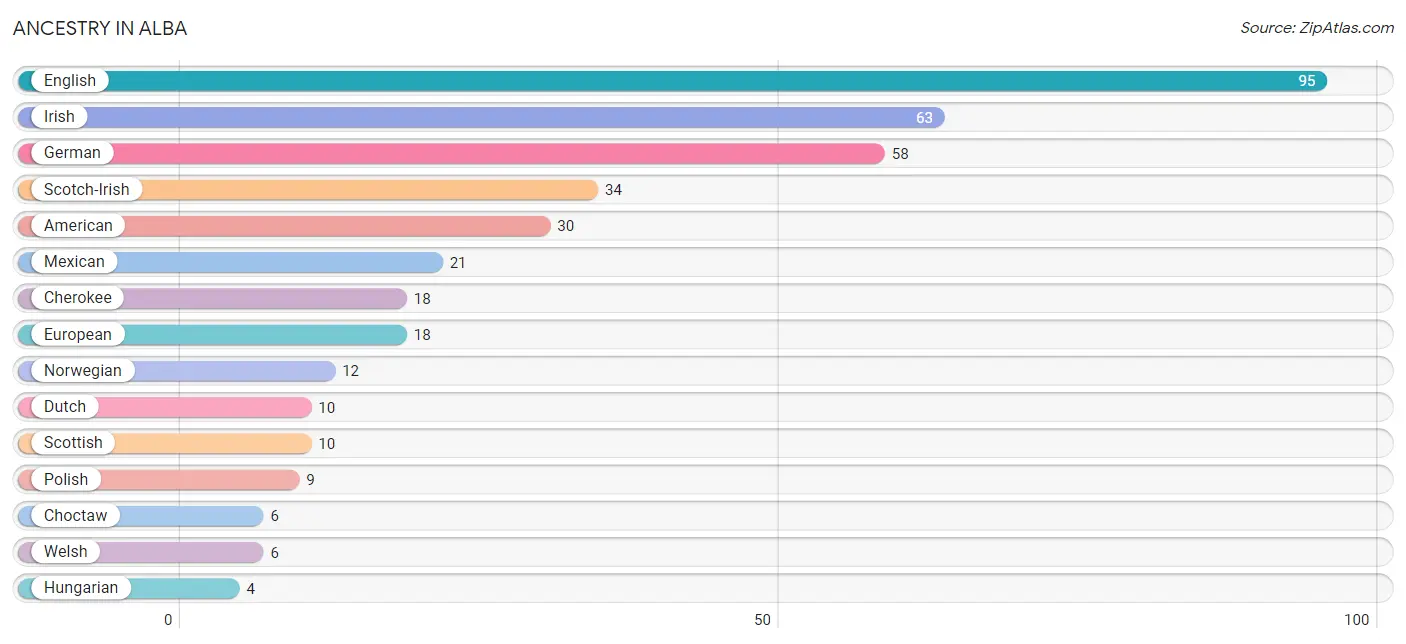
Ancestry in Alba
The most populous ancestries reported in Alba are English (95 | 17.7%), Irish (63 | 11.7%), German (58 | 10.8%), Scotch-Irish (34 | 6.3%), and American (30 | 5.6%), together accounting for 52.0% of all Alba residents.
| Ancestry | # Population | % Population |
| American | 30 | 5.6% |
| Apache | 3 | 0.6% |
| British | 2 | 0.4% |
| Cherokee | 18 | 3.4% |
| Choctaw | 6 | 1.1% |
| Dominican | 2 | 0.4% |
| Dutch | 10 | 1.9% |
| English | 95 | 17.7% |
| European | 18 | 3.4% |
| French | 2 | 0.4% |
| French Canadian | 3 | 0.6% |
| German | 58 | 10.8% |
| Hungarian | 4 | 0.7% |
| Indian (Asian) | 2 | 0.4% |
| Irish | 63 | 11.7% |
| Mexican | 21 | 3.9% |
| Norwegian | 12 | 2.2% |
| Polish | 9 | 1.7% |
| Portuguese | 2 | 0.4% |
| Russian | 2 | 0.4% |
| Scotch-Irish | 34 | 6.3% |
| Scottish | 10 | 1.9% |
| Spaniard | 3 | 0.6% |
| Swedish | 3 | 0.6% |
| Ute | 3 | 0.6% |
| Welsh | 6 | 1.1% |
| Yugoslavian | 3 | 0.6% | View All 27 Rows |
Immigrants in Alba
The most numerous immigrant groups reported in Alba came from Central America (3 | 0.6%), Latin America (3 | 0.6%), Mexico (3 | 0.6%), Asia (2 | 0.4%), and China (2 | 0.4%), together accounting for 2.4% of all Alba residents.
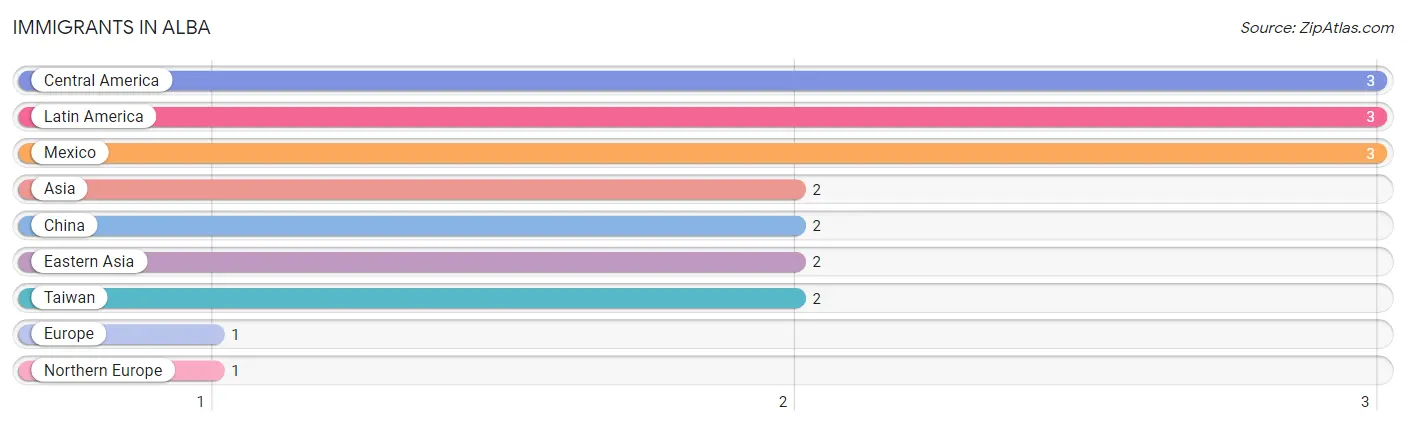
| Immigration Origin | # Population | % Population |
| Asia | 2 | 0.4% |
| Central America | 3 | 0.6% |
| China | 2 | 0.4% |
| Eastern Asia | 2 | 0.4% |
| Europe | 1 | 0.2% |
| Latin America | 3 | 0.6% |
| Mexico | 3 | 0.6% |
| Northern Europe | 1 | 0.2% |
| Taiwan | 2 | 0.4% | View All 9 Rows |
Sex and Age in Alba
Sex and Age in Alba
The most populous age groups in Alba are 60 to 64 Years (65 | 25.5%) for men and 60 to 64 Years (35 | 12.4%) for women.
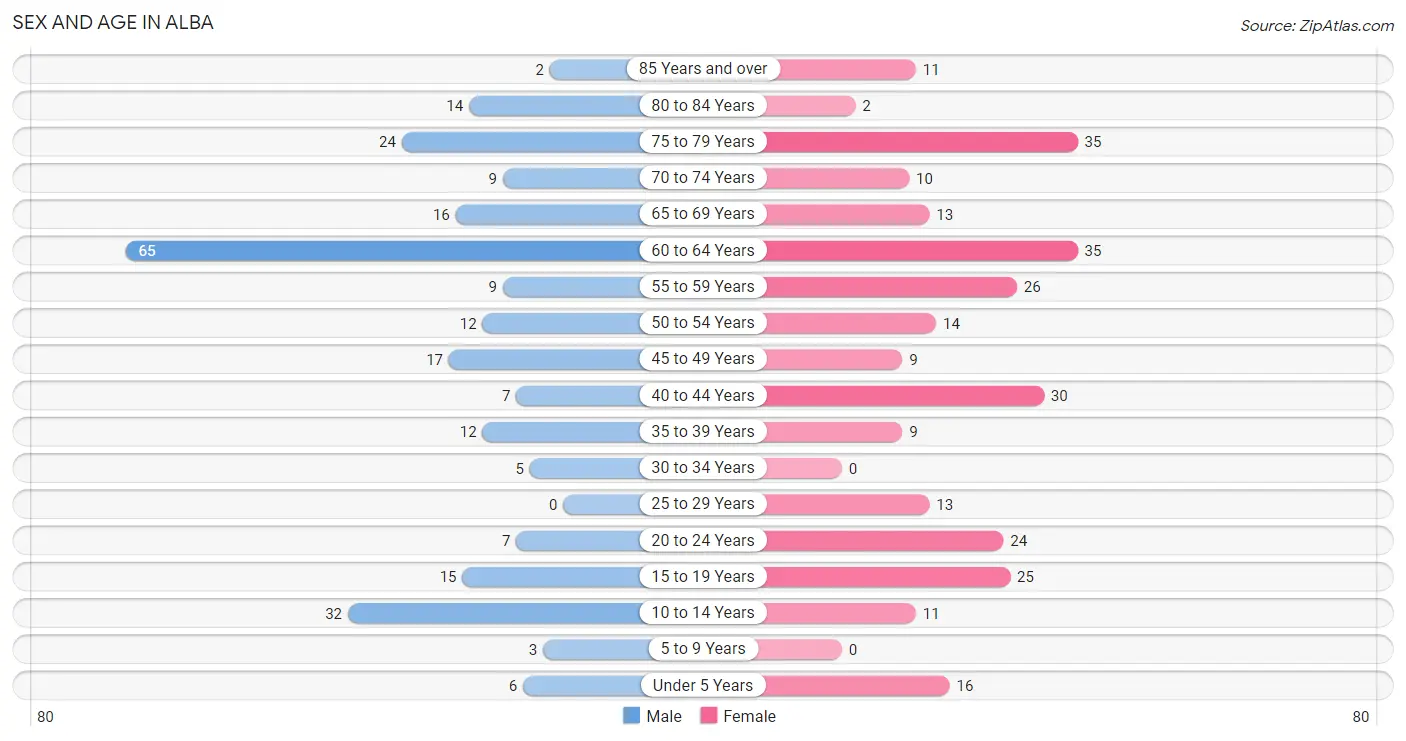
| Age Bracket | Male | Female |
| Under 5 Years | 6 (2.4%) | 16 (5.7%) |
| 5 to 9 Years | 3 (1.2%) | 0 (0.0%) |
| 10 to 14 Years | 32 (12.6%) | 11 (3.9%) |
| 15 to 19 Years | 15 (5.9%) | 25 (8.8%) |
| 20 to 24 Years | 7 (2.8%) | 24 (8.5%) |
| 25 to 29 Years | 0 (0.0%) | 13 (4.6%) |
| 30 to 34 Years | 5 (2.0%) | 0 (0.0%) |
| 35 to 39 Years | 12 (4.7%) | 9 (3.2%) |
| 40 to 44 Years | 7 (2.8%) | 30 (10.6%) |
| 45 to 49 Years | 17 (6.7%) | 9 (3.2%) |
| 50 to 54 Years | 12 (4.7%) | 14 (5.0%) |
| 55 to 59 Years | 9 (3.5%) | 26 (9.2%) |
| 60 to 64 Years | 65 (25.5%) | 35 (12.4%) |
| 65 to 69 Years | 16 (6.3%) | 13 (4.6%) |
| 70 to 74 Years | 9 (3.5%) | 10 (3.5%) |
| 75 to 79 Years | 24 (9.4%) | 35 (12.4%) |
| 80 to 84 Years | 14 (5.5%) | 2 (0.7%) |
| 85 Years and over | 2 (0.8%) | 11 (3.9%) |
| Total | 255 (100.0%) | 283 (100.0%) |
Families and Households in Alba
Median Family Size in Alba
The median family size in Alba is 2.97 persons per family, with married-couple families (101 | 75.9%) accounting for the largest median family size of 3.03 persons per family. On the other hand, single female/mother families (26 | 19.6%) represent the smallest median family size with 2.77 persons per family.
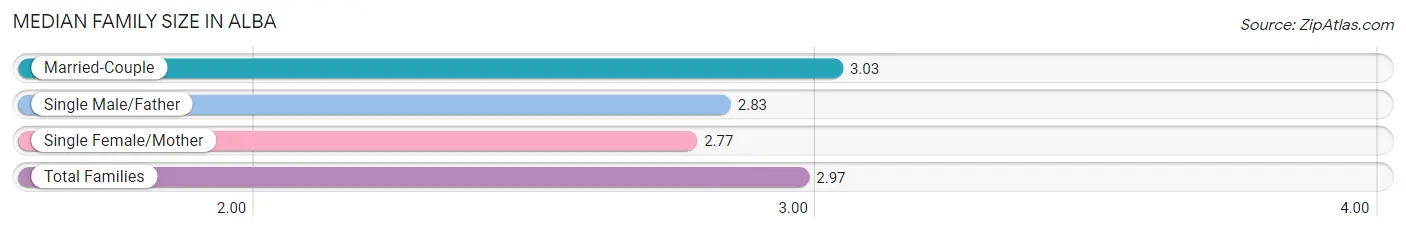
| Family Type | # Families | Family Size |
| Married-Couple | 101 (75.9%) | 3.03 |
| Single Male/Father | 6 (4.5%) | 2.83 |
| Single Female/Mother | 26 (19.6%) | 2.77 |
| Total Families | 133 (100.0%) | 2.97 |
Median Household Size in Alba
The median household size in Alba is 2.35 persons per household, with single female/mother households (26 | 11.4%) accounting for the largest median household size of 3.23 persons per household. non-family households (96 | 41.9%) represent the smallest median household size with 1.36 persons per household.
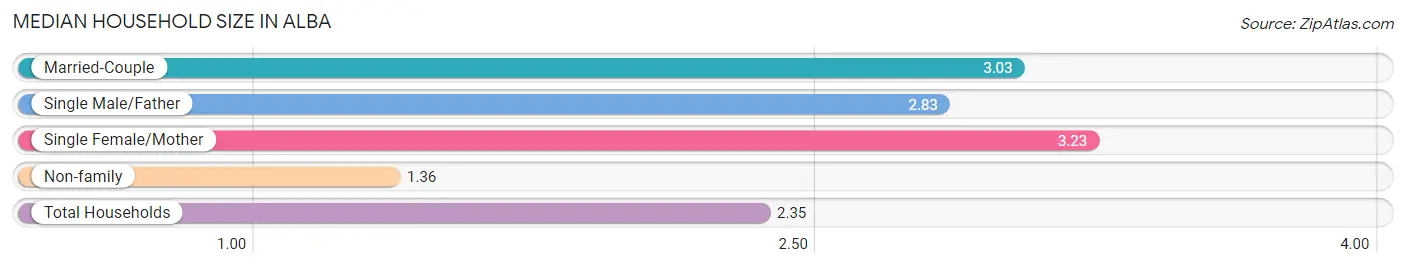
| Household Type | # Households | Household Size |
| Married-Couple | 101 (44.1%) | 3.03 |
| Single Male/Father | 6 (2.6%) | 2.83 |
| Single Female/Mother | 26 (11.4%) | 3.23 |
| Non-family | 96 (41.9%) | 1.36 |
| Total Households | 229 (100.0%) | 2.35 |
Household Size by Marriage Status in Alba
Out of a total of 229 households in Alba, 133 (58.1%) are family households, while 96 (41.9%) are nonfamily households. The most numerous type of family households are 2-person households, comprising 70, and the most common type of nonfamily households are 1-person households, comprising 83.
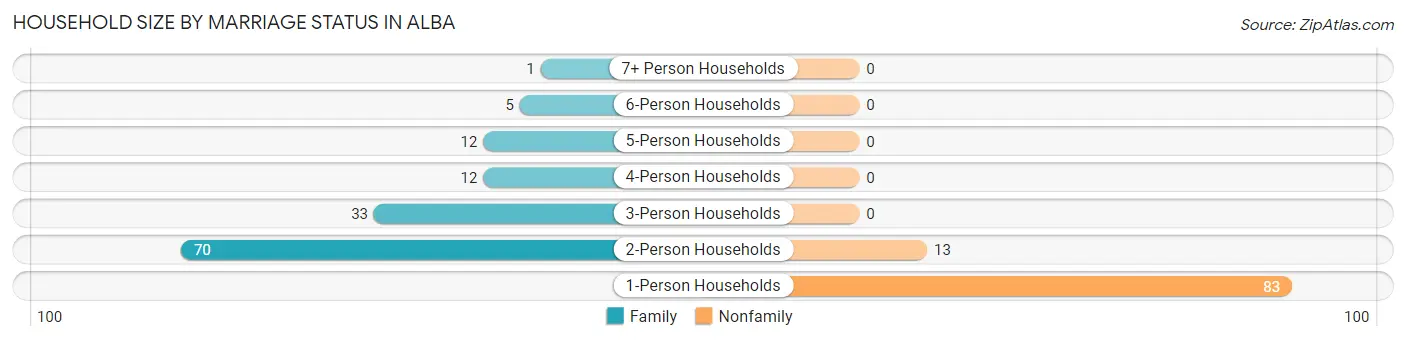
| Household Size | Family Households | Nonfamily Households |
| 1-Person Households | - | 83 (36.2%) |
| 2-Person Households | 70 (30.6%) | 13 (5.7%) |
| 3-Person Households | 33 (14.4%) | 0 (0.0%) |
| 4-Person Households | 12 (5.2%) | 0 (0.0%) |
| 5-Person Households | 12 (5.2%) | 0 (0.0%) |
| 6-Person Households | 5 (2.2%) | 0 (0.0%) |
| 7+ Person Households | 1 (0.4%) | 0 (0.0%) |
| Total | 133 (58.1%) | 96 (41.9%) |
Female Fertility in Alba
Fertility by Age in Alba
Average fertility rate in Alba is 33.0 births per 1,000 women. Women in the age bracket of 20 to 34 years have the highest fertility rate with 108.0 births per 1,000 women. Women in the age bracket of 20 to 34 years acount for 100.0% of all women with births.
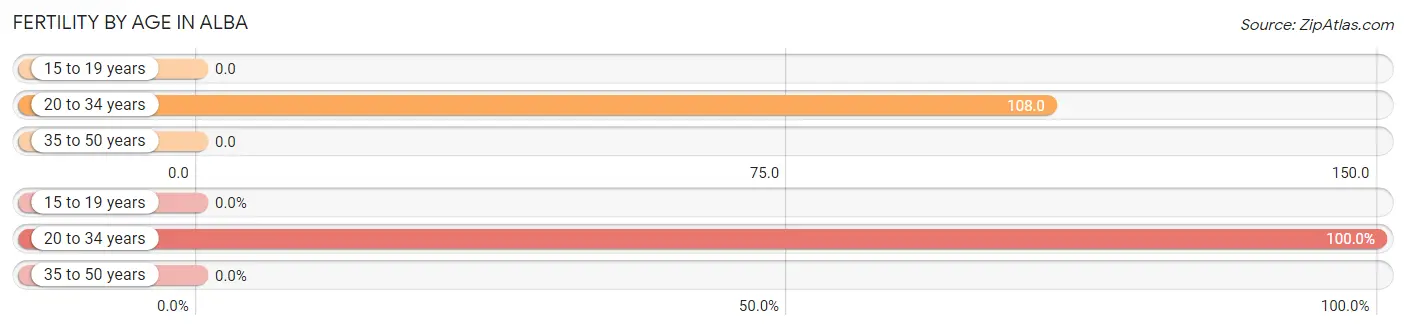
| Age Bracket | Women with Births | Births / 1,000 Women |
| 15 to 19 years | 0 (0.0%) | 0.0 |
| 20 to 34 years | 4 (100.0%) | 108.0 |
| 35 to 50 years | 0 (0.0%) | 0.0 |
| Total | 4 (100.0%) | 33.0 |
Fertility by Age by Marriage Status in Alba
25.0% of women with births (4) in Alba are married. The highest percentage of unmarried women with births falls into 20 to 34 years age bracket with 75.0% of them unmarried at the time of birth, while the lowest percentage of unmarried women with births belong to 20 to 34 years age bracket with 75.0% of them unmarried.
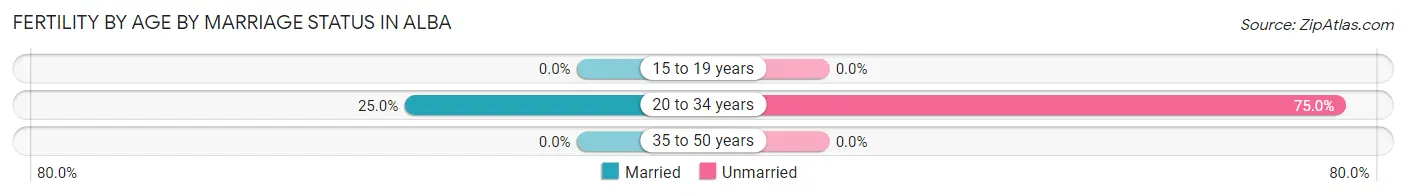
| Age Bracket | Married | Unmarried |
| 15 to 19 years | 0 (0.0%) | 0 (0.0%) |
| 20 to 34 years | 1 (25.0%) | 3 (75.0%) |
| 35 to 50 years | 0 (0.0%) | 0 (0.0%) |
| Total | 1 (25.0%) | 3 (75.0%) |
Fertility by Education in Alba
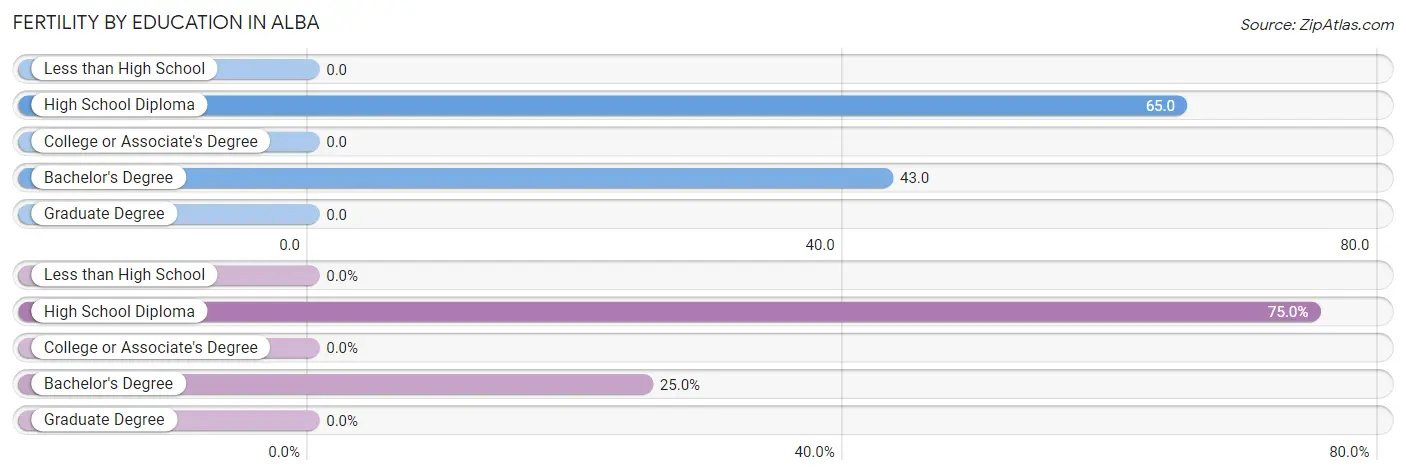
| Educational Attainment | Women with Births | Births / 1,000 Women |
| Less than High School | 0 (0.0%) | 0.0 |
| High School Diploma | 3 (75.0%) | 65.0 |
| College or Associate's Degree | 0 (0.0%) | 0.0 |
| Bachelor's Degree | 1 (25.0%) | 43.0 |
| Graduate Degree | 0 (0.0%) | 0.0 |
| Total | 4 (100.0%) | 33.0 |
Fertility by Education by Marriage Status in Alba
75.0% of women with births in Alba are unmarried. Women with the educational attainment of bachelor's degree are most likely to be married with 100.0% of them married at childbirth, while women with the educational attainment of high school diploma are least likely to be married with 100.0% of them unmarried at childbirth.
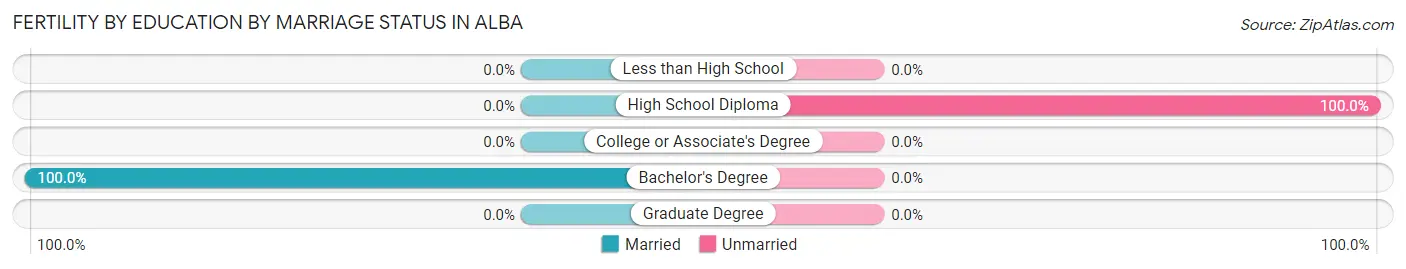
| Educational Attainment | Married | Unmarried |
| Less than High School | 0 (0.0%) | 0 (0.0%) |
| High School Diploma | 0 (0.0%) | 3 (100.0%) |
| College or Associate's Degree | 0 (0.0%) | 0 (0.0%) |
| Bachelor's Degree | 1 (100.0%) | 0 (0.0%) |
| Graduate Degree | 0 (0.0%) | 0 (0.0%) |
| Total | 1 (25.0%) | 3 (75.0%) |
Employment Characteristics in Alba
Employment by Class of Employer in Alba
Among the 178 employed individuals in Alba, private company employees (134 | 75.3%), self-employed (not incorporated) (14 | 7.9%), and local government employees (14 | 7.9%) make up the most common classes of employment.
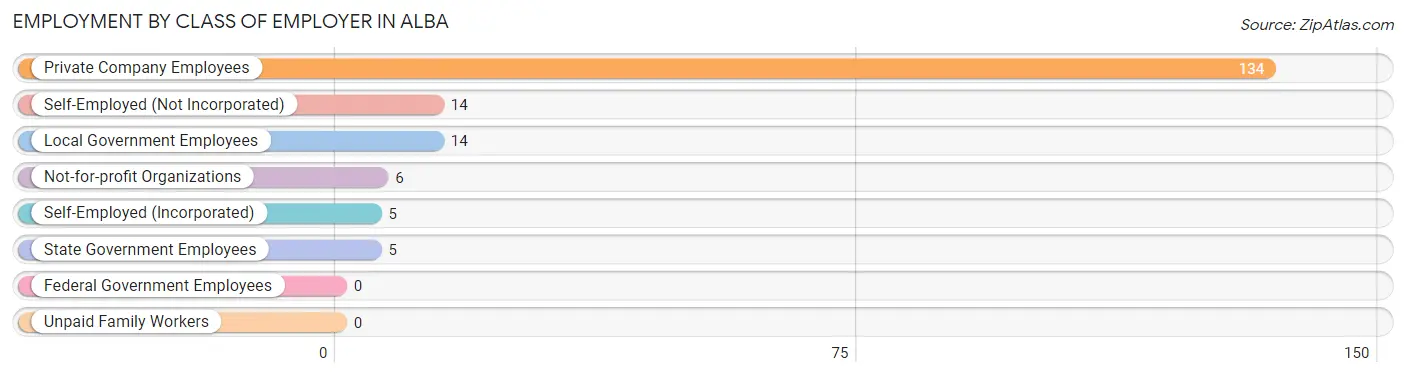
| Employer Class | # Employees | % Employees |
| Private Company Employees | 134 | 75.3% |
| Self-Employed (Incorporated) | 5 | 2.8% |
| Self-Employed (Not Incorporated) | 14 | 7.9% |
| Not-for-profit Organizations | 6 | 3.4% |
| Local Government Employees | 14 | 7.9% |
| State Government Employees | 5 | 2.8% |
| Federal Government Employees | 0 | 0.0% |
| Unpaid Family Workers | 0 | 0.0% |
| Total | 178 | 100.0% |
Employment Status by Age in Alba
According to the labor force statistics for Alba, out of the total population over 16 years of age (455), 40.0% or 182 individuals are in the labor force, with 2.2% or 4 of them unemployed. The age group with the highest labor force participation rate is 30 to 34 years, with 100.0% or 5 individuals in the labor force. Within the labor force, the 55 to 59 years age range has the highest percentage of unemployed individuals, with 15.8% or 3 of them being unemployed.
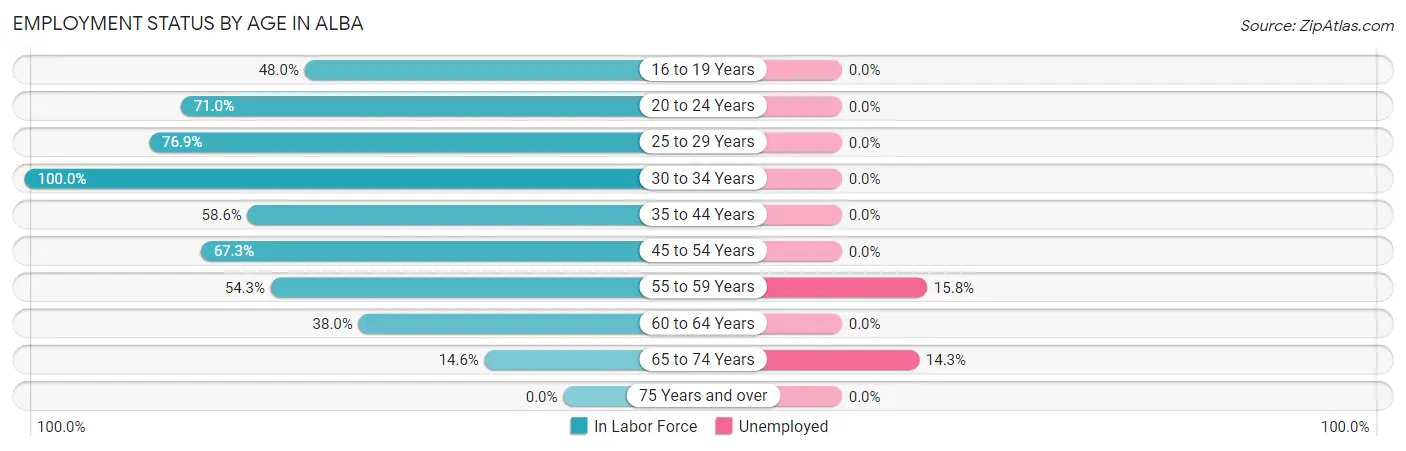
| Age Bracket | In Labor Force | Unemployed |
| 16 to 19 Years | 12 (48.0%) | 0 (0.0%) |
| 20 to 24 Years | 22 (71.0%) | 0 (0.0%) |
| 25 to 29 Years | 10 (76.9%) | 0 (0.0%) |
| 30 to 34 Years | 5 (100.0%) | 0 (0.0%) |
| 35 to 44 Years | 34 (58.6%) | 0 (0.0%) |
| 45 to 54 Years | 35 (67.3%) | 0 (0.0%) |
| 55 to 59 Years | 19 (54.3%) | 3 (15.8%) |
| 60 to 64 Years | 38 (38.0%) | 0 (0.0%) |
| 65 to 74 Years | 7 (14.6%) | 1 (14.3%) |
| 75 Years and over | 0 (0.0%) | 0 (0.0%) |
| Total | 182 (40.0%) | 4 (2.2%) |
Employment Status by Educational Attainment in Alba
According to labor force statistics for Alba, 53.6% of individuals (141) out of the total population between 25 and 64 years of age (263) are in the labor force, with 2.1% or 3 of them being unemployed. The group with the highest labor force participation rate are those with the educational attainment of bachelor's degree or higher, with 80.6% or 25 individuals in the labor force. Within the labor force, individuals with high school diploma education have the highest percentage of unemployment, with 4.5% or 3 of them being unemployed.
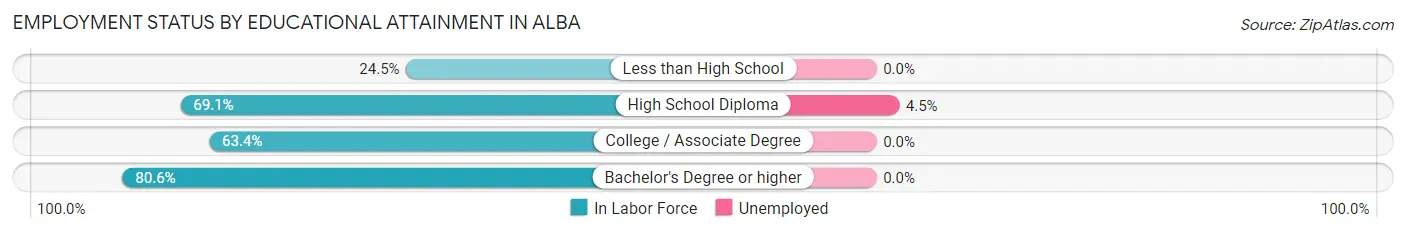
| Educational Attainment | In Labor Force | Unemployed |
| Less than High School | 23 (24.5%) | 0 (0.0%) |
| High School Diploma | 67 (69.1%) | 4 (4.5%) |
| College / Associate Degree | 26 (63.4%) | 0 (0.0%) |
| Bachelor's Degree or higher | 25 (80.6%) | 0 (0.0%) |
| Total | 141 (53.6%) | 6 (2.1%) |
Employment Occupations by Sex in Alba
Management, Business, Science and Arts Occupations
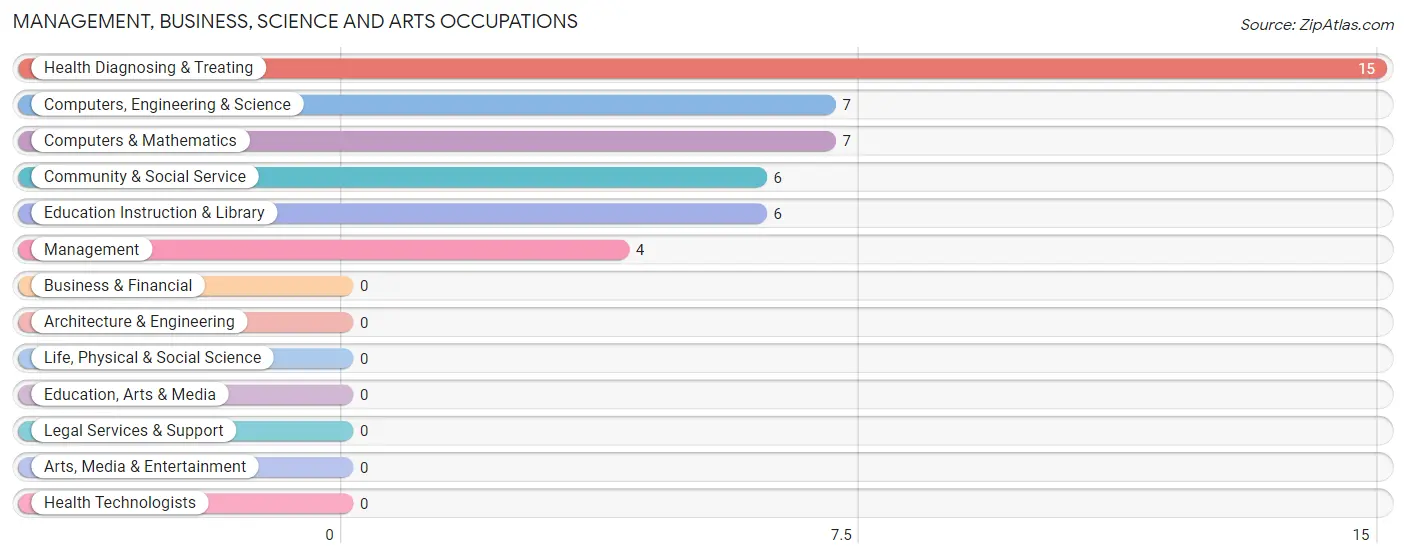
The most common Management, Business, Science and Arts occupations in Alba are Health Diagnosing & Treating (15 | 8.4%), Computers, Engineering & Science (7 | 3.9%), Computers & Mathematics (7 | 3.9%), Community & Social Service (6 | 3.4%), and Education Instruction & Library (6 | 3.4%).
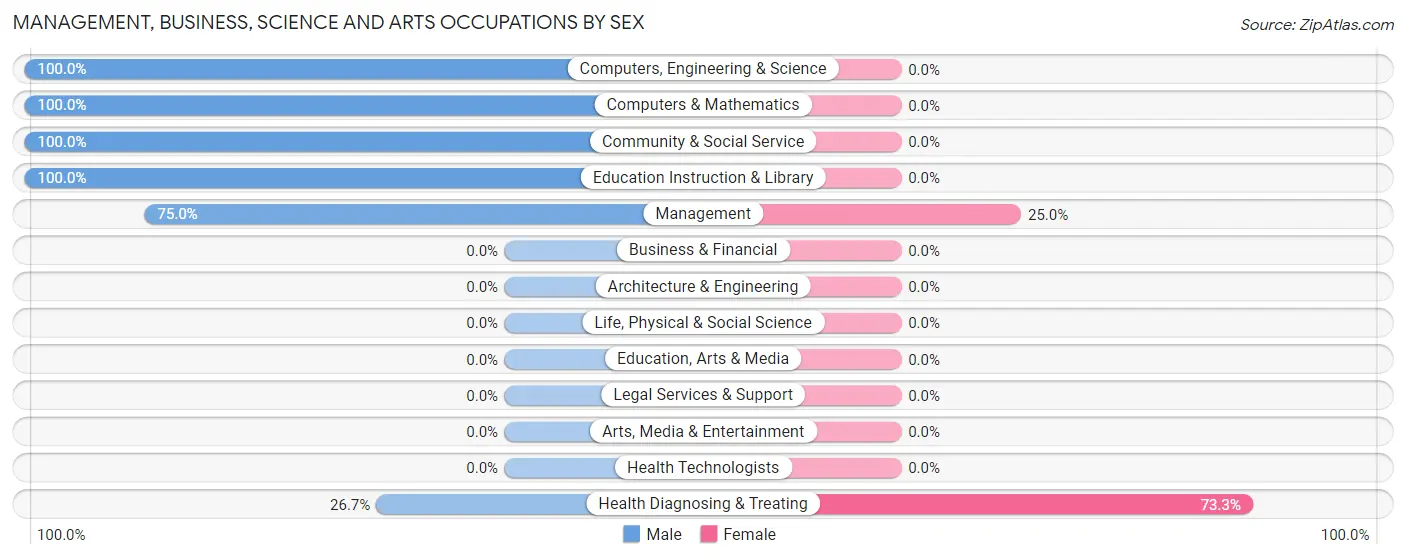
Management, Business, Science and Arts Occupations by Sex
Within the Management, Business, Science and Arts occupations in Alba, the most male-oriented occupations are Computers, Engineering & Science (100.0%), Computers & Mathematics (100.0%), and Community & Social Service (100.0%), while the most female-oriented occupations are Health Diagnosing & Treating (73.3%), and Management (25.0%).
| Occupation | Male | Female |
| Management | 3 (75.0%) | 1 (25.0%) |
| Business & Financial | 0 (0.0%) | 0 (0.0%) |
| Computers, Engineering & Science | 7 (100.0%) | 0 (0.0%) |
| Computers & Mathematics | 7 (100.0%) | 0 (0.0%) |
| Architecture & Engineering | 0 (0.0%) | 0 (0.0%) |
| Life, Physical & Social Science | 0 (0.0%) | 0 (0.0%) |
| Community & Social Service | 6 (100.0%) | 0 (0.0%) |
| Education, Arts & Media | 0 (0.0%) | 0 (0.0%) |
| Legal Services & Support | 0 (0.0%) | 0 (0.0%) |
| Education Instruction & Library | 6 (100.0%) | 0 (0.0%) |
| Arts, Media & Entertainment | 0 (0.0%) | 0 (0.0%) |
| Health Diagnosing & Treating | 4 (26.7%) | 11 (73.3%) |
| Health Technologists | 0 (0.0%) | 0 (0.0%) |
| Total (Category) | 20 (62.5%) | 12 (37.5%) |
| Total (Overall) | 66 (37.1%) | 112 (62.9%) |
Services Occupations
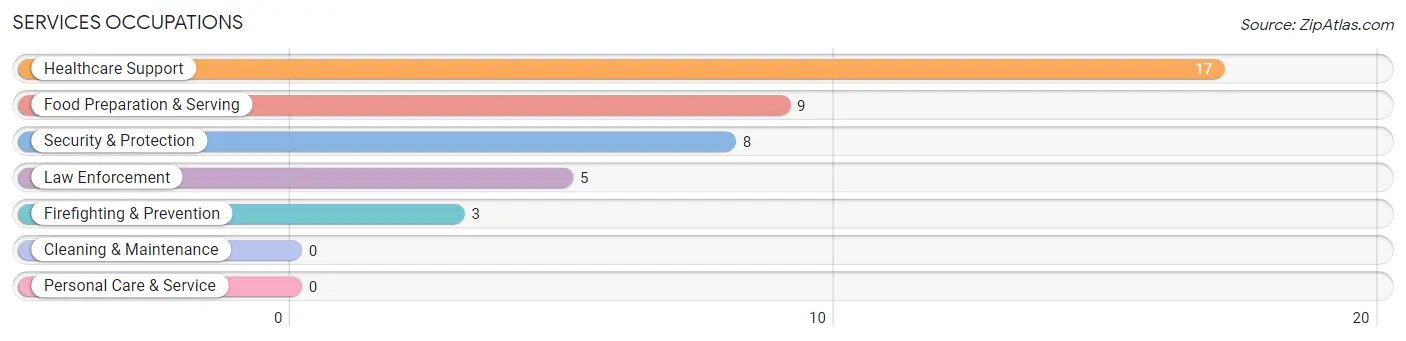
The most common Services occupations in Alba are Healthcare Support (17 | 9.6%), Food Preparation & Serving (9 | 5.1%), Security & Protection (8 | 4.5%), Law Enforcement (5 | 2.8%), and Firefighting & Prevention (3 | 1.7%).
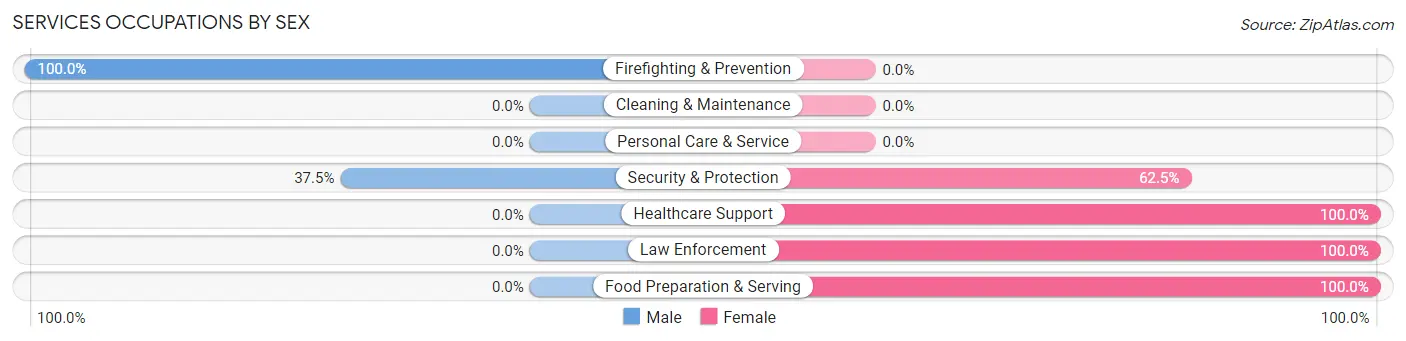
Services Occupations by Sex
Within the Services occupations in Alba, the most male-oriented occupations are Firefighting & Prevention (100.0%), and Security & Protection (37.5%), while the most female-oriented occupations are Healthcare Support (100.0%), Law Enforcement (100.0%), and Food Preparation & Serving (100.0%).
| Occupation | Male | Female |
| Healthcare Support | 0 (0.0%) | 17 (100.0%) |
| Security & Protection | 3 (37.5%) | 5 (62.5%) |
| Firefighting & Prevention | 3 (100.0%) | 0 (0.0%) |
| Law Enforcement | 0 (0.0%) | 5 (100.0%) |
| Food Preparation & Serving | 0 (0.0%) | 9 (100.0%) |
| Cleaning & Maintenance | 0 (0.0%) | 0 (0.0%) |
| Personal Care & Service | 0 (0.0%) | 0 (0.0%) |
| Total (Category) | 3 (8.8%) | 31 (91.2%) |
| Total (Overall) | 66 (37.1%) | 112 (62.9%) |
Sales and Office Occupations
The most common Sales and Office occupations in Alba are Sales & Related (38 | 21.3%), and Office & Administration (2 | 1.1%).
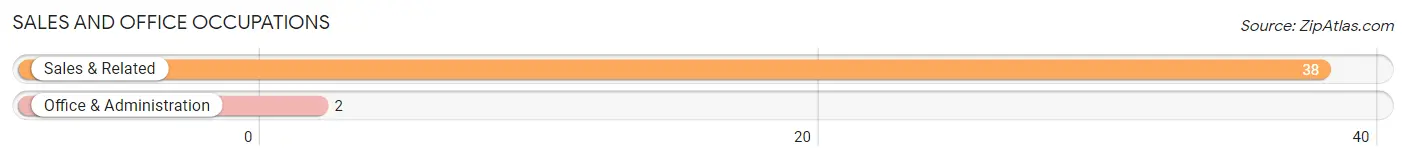
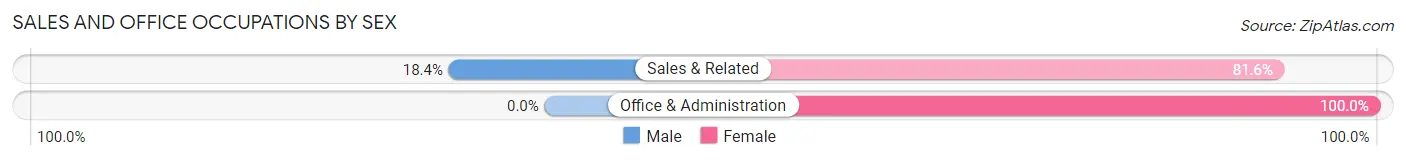
Sales and Office Occupations by Sex
| Occupation | Male | Female |
| Sales & Related | 7 (18.4%) | 31 (81.6%) |
| Office & Administration | 0 (0.0%) | 2 (100.0%) |
| Total (Category) | 7 (17.5%) | 33 (82.5%) |
| Total (Overall) | 66 (37.1%) | 112 (62.9%) |
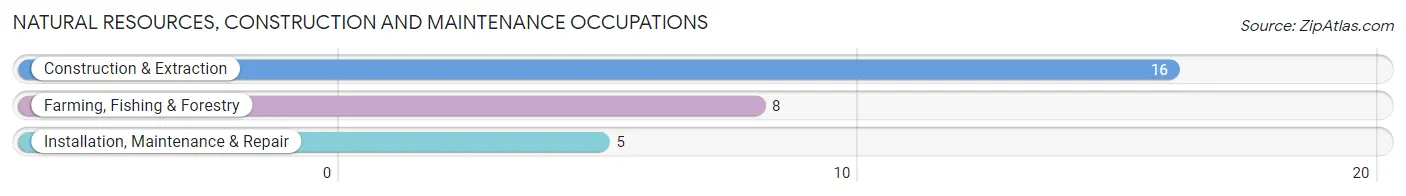
Natural Resources, Construction and Maintenance Occupations
The most common Natural Resources, Construction and Maintenance occupations in Alba are Construction & Extraction (16 | 9.0%), Farming, Fishing & Forestry (8 | 4.5%), and Installation, Maintenance & Repair (5 | 2.8%).
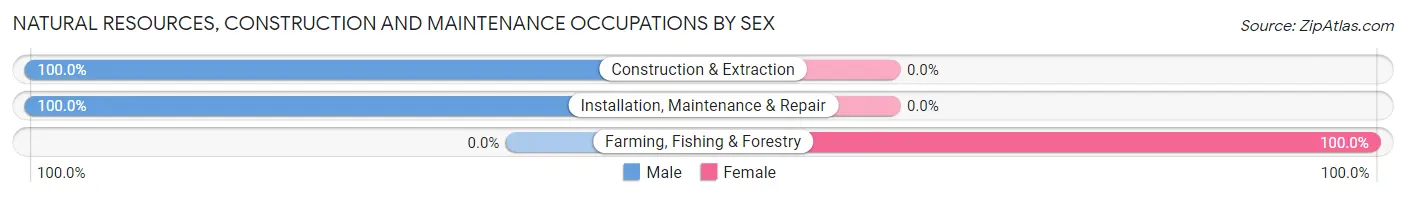
Natural Resources, Construction and Maintenance Occupations by Sex
| Occupation | Male | Female |
| Farming, Fishing & Forestry | 0 (0.0%) | 8 (100.0%) |
| Construction & Extraction | 16 (100.0%) | 0 (0.0%) |
| Installation, Maintenance & Repair | 5 (100.0%) | 0 (0.0%) |
| Total (Category) | 21 (72.4%) | 8 (27.6%) |
| Total (Overall) | 66 (37.1%) | 112 (62.9%) |
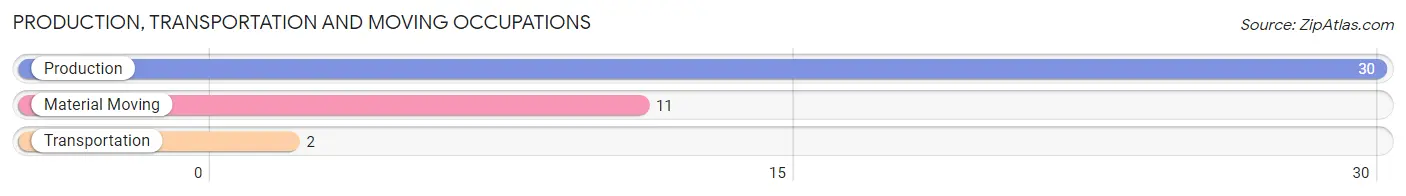
Production, Transportation and Moving Occupations
The most common Production, Transportation and Moving occupations in Alba are Production (30 | 16.9%), Material Moving (11 | 6.2%), and Transportation (2 | 1.1%).
Production, Transportation and Moving Occupations by Sex
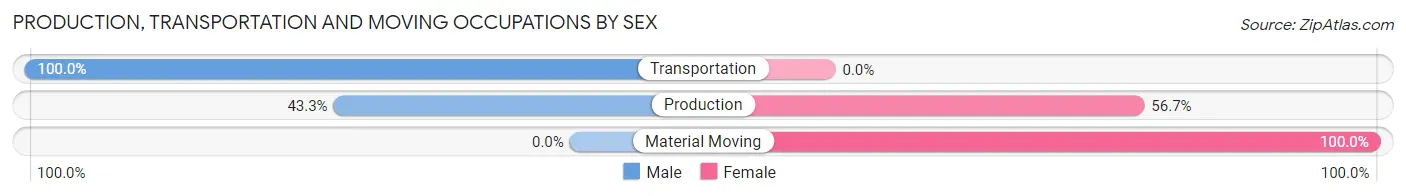
| Occupation | Male | Female |
| Production | 13 (43.3%) | 17 (56.7%) |
| Transportation | 2 (100.0%) | 0 (0.0%) |
| Material Moving | 0 (0.0%) | 11 (100.0%) |
| Total (Category) | 15 (34.9%) | 28 (65.1%) |
| Total (Overall) | 66 (37.1%) | 112 (62.9%) |
Employment Industries by Sex in Alba
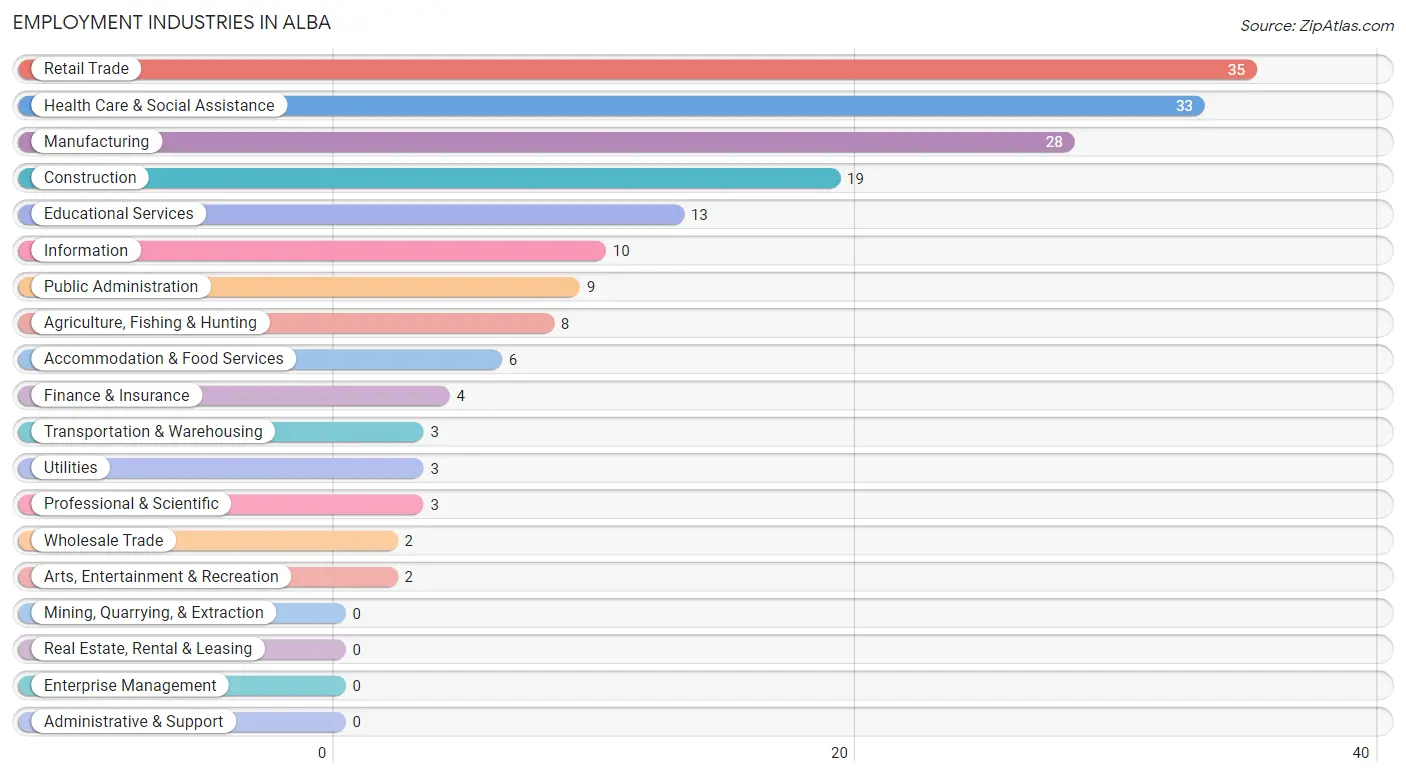
Employment Industries in Alba
The major employment industries in Alba include Retail Trade (35 | 19.7%), Health Care & Social Assistance (33 | 18.5%), Manufacturing (28 | 15.7%), Construction (19 | 10.7%), and Educational Services (13 | 7.3%).
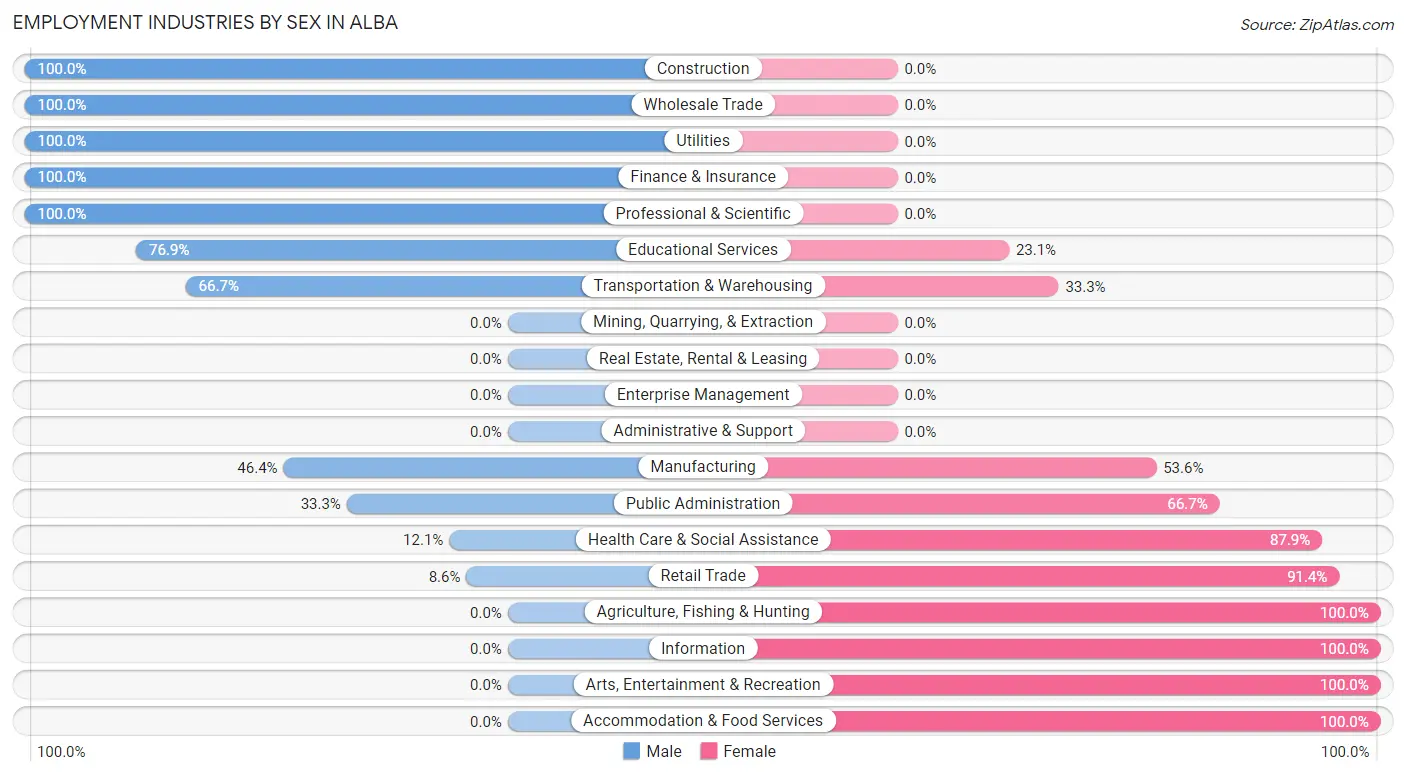
Employment Industries by Sex in Alba
The Alba industries that see more men than women are Construction (100.0%), Wholesale Trade (100.0%), and Utilities (100.0%), whereas the industries that tend to have a higher number of women are Agriculture, Fishing & Hunting (100.0%), Information (100.0%), and Arts, Entertainment & Recreation (100.0%).
| Industry | Male | Female |
| Agriculture, Fishing & Hunting | 0 (0.0%) | 8 (100.0%) |
| Mining, Quarrying, & Extraction | 0 (0.0%) | 0 (0.0%) |
| Construction | 19 (100.0%) | 0 (0.0%) |
| Manufacturing | 13 (46.4%) | 15 (53.6%) |
| Wholesale Trade | 2 (100.0%) | 0 (0.0%) |
| Retail Trade | 3 (8.6%) | 32 (91.4%) |
| Transportation & Warehousing | 2 (66.7%) | 1 (33.3%) |
| Utilities | 3 (100.0%) | 0 (0.0%) |
| Information | 0 (0.0%) | 10 (100.0%) |
| Finance & Insurance | 4 (100.0%) | 0 (0.0%) |
| Real Estate, Rental & Leasing | 0 (0.0%) | 0 (0.0%) |
| Professional & Scientific | 3 (100.0%) | 0 (0.0%) |
| Enterprise Management | 0 (0.0%) | 0 (0.0%) |
| Administrative & Support | 0 (0.0%) | 0 (0.0%) |
| Educational Services | 10 (76.9%) | 3 (23.1%) |
| Health Care & Social Assistance | 4 (12.1%) | 29 (87.9%) |
| Arts, Entertainment & Recreation | 0 (0.0%) | 2 (100.0%) |
| Accommodation & Food Services | 0 (0.0%) | 6 (100.0%) |
| Public Administration | 3 (33.3%) | 6 (66.7%) |
| Total | 66 (37.1%) | 112 (62.9%) |
Education in Alba
School Enrollment in Alba
The most common levels of schooling among the 95 students in Alba are middle school (49 | 51.6%), high school (21 | 22.1%), and college / undergraduate (19 | 20.0%).
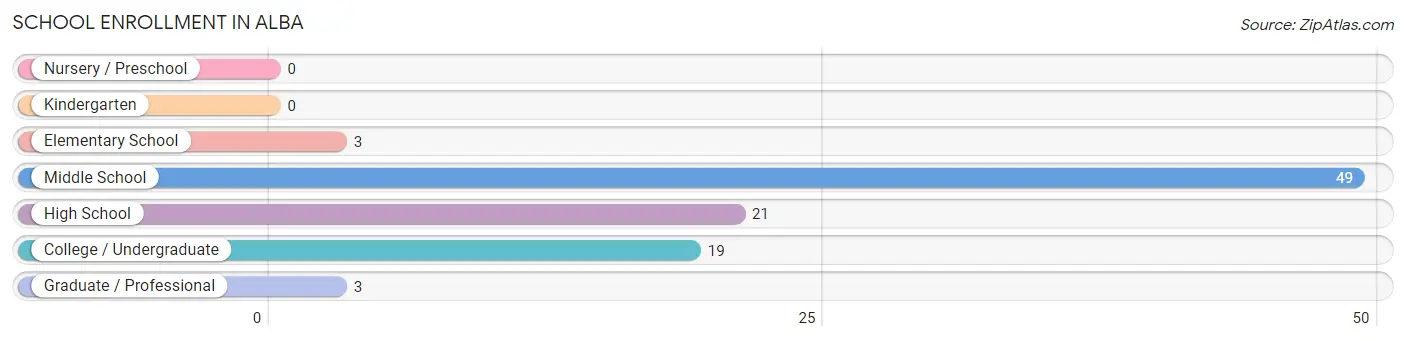
| School Level | # Students | % Students |
| Nursery / Preschool | 0 | 0.0% |
| Kindergarten | 0 | 0.0% |
| Elementary School | 3 | 3.2% |
| Middle School | 49 | 51.6% |
| High School | 21 | 22.1% |
| College / Undergraduate | 19 | 20.0% |
| Graduate / Professional | 3 | 3.2% |
| Total | 95 | 100.0% |
School Enrollment by Age by Funding Source in Alba
Out of a total of 95 students who are enrolled in schools in Alba, 9 (9.5%) attend a private institution, while the remaining 86 (90.5%) are enrolled in public schools. The age group of 5 to 9 year old has the highest likelihood of being enrolled in private schools, with 2 (66.7% in the age bracket) enrolled. Conversely, the age group of 18 to 19 year olds has the lowest likelihood of being enrolled in a private school, with 6 (100.0% in the age bracket) attending a public institution.
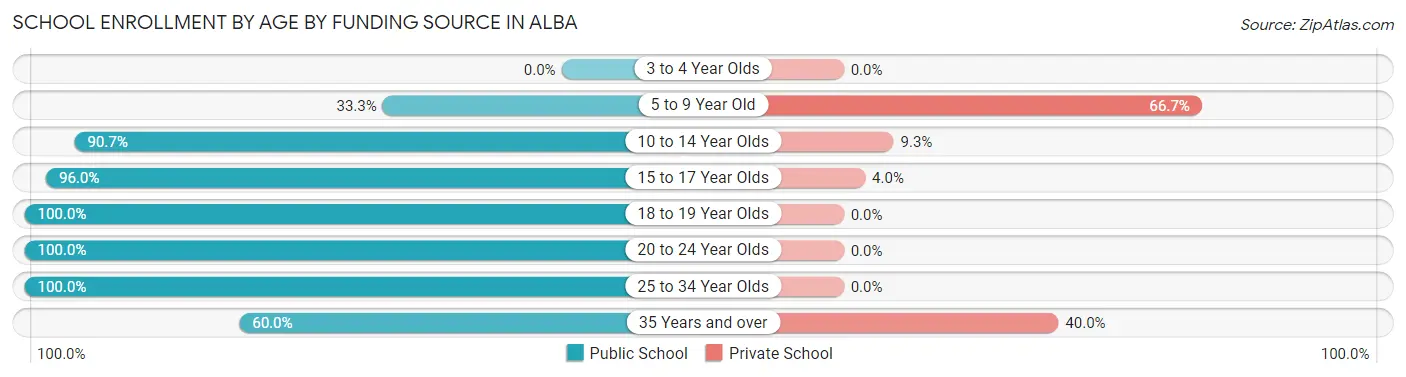
| Age Bracket | Public School | Private School |
| 3 to 4 Year Olds | 0 (0.0%) | 0 (0.0%) |
| 5 to 9 Year Old | 1 (33.3%) | 2 (66.7%) |
| 10 to 14 Year Olds | 39 (90.7%) | 4 (9.3%) |
| 15 to 17 Year Olds | 24 (96.0%) | 1 (4.0%) |
| 18 to 19 Year Olds | 6 (100.0%) | 0 (0.0%) |
| 20 to 24 Year Olds | 12 (100.0%) | 0 (0.0%) |
| 25 to 34 Year Olds | 1 (100.0%) | 0 (0.0%) |
| 35 Years and over | 3 (60.0%) | 2 (40.0%) |
| Total | 86 (90.5%) | 9 (9.5%) |
Educational Attainment by Field of Study in Alba
Business (26 | 41.3%), liberal arts & history (11 | 17.5%), engineering (10 | 15.9%), education (9 | 14.3%), and bio, nature & agricultural (4 | 6.4%) are the most common fields of study among 63 individuals in Alba who have obtained a bachelor's degree or higher.
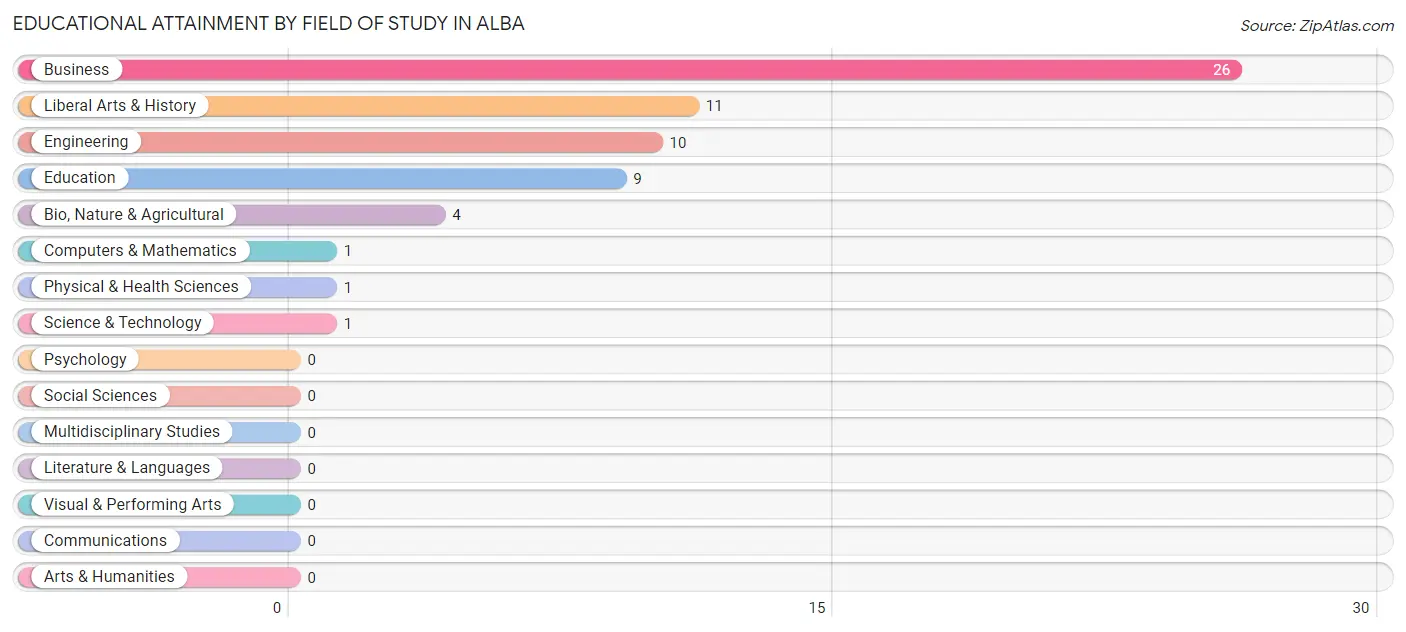
| Field of Study | # Graduates | % Graduates |
| Computers & Mathematics | 1 | 1.6% |
| Bio, Nature & Agricultural | 4 | 6.4% |
| Physical & Health Sciences | 1 | 1.6% |
| Psychology | 0 | 0.0% |
| Social Sciences | 0 | 0.0% |
| Engineering | 10 | 15.9% |
| Multidisciplinary Studies | 0 | 0.0% |
| Science & Technology | 1 | 1.6% |
| Business | 26 | 41.3% |
| Education | 9 | 14.3% |
| Literature & Languages | 0 | 0.0% |
| Liberal Arts & History | 11 | 17.5% |
| Visual & Performing Arts | 0 | 0.0% |
| Communications | 0 | 0.0% |
| Arts & Humanities | 0 | 0.0% |
| Total | 63 | 100.0% |
Transportation & Commute in Alba
Vehicle Availability by Sex in Alba
The most prevalent vehicle ownership categories in Alba are males with 2 vehicles (28, accounting for 42.4%) and females with 2 vehicles (51, making up 25.0%).
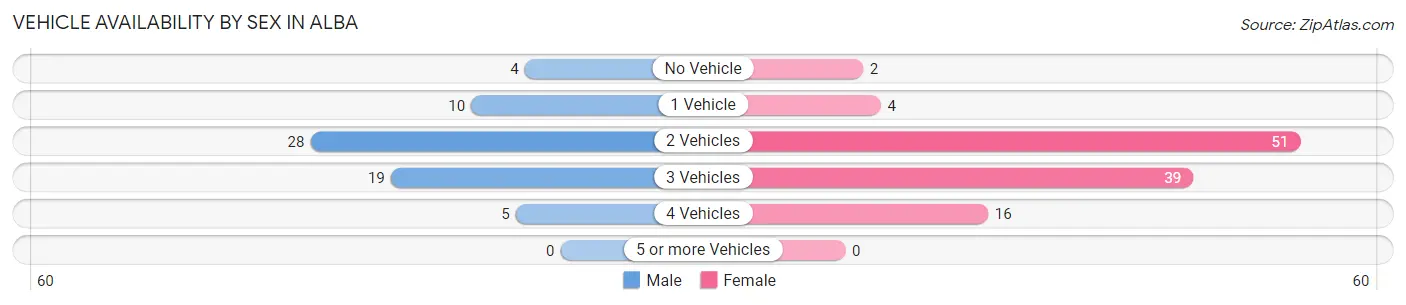
| Vehicles Available | Male | Female |
| No Vehicle | 4 (6.1%) | 2 (1.8%) |
| 1 Vehicle | 10 (15.1%) | 4 (3.6%) |
| 2 Vehicles | 28 (42.4%) | 51 (45.5%) |
| 3 Vehicles | 19 (28.8%) | 39 (34.8%) |
| 4 Vehicles | 5 (7.6%) | 16 (14.3%) |
| 5 or more Vehicles | 0 (0.0%) | 0 (0.0%) |
| Total | 66 (100.0%) | 112 (100.0%) |
Commute Time in Alba
The most frequently occuring commute durations in Alba are 15 to 19 minutes (46 commuters, 26.6%), 60 to 89 minutes (37 commuters, 21.4%), and less than 5 minutes (19 commuters, 11.0%).
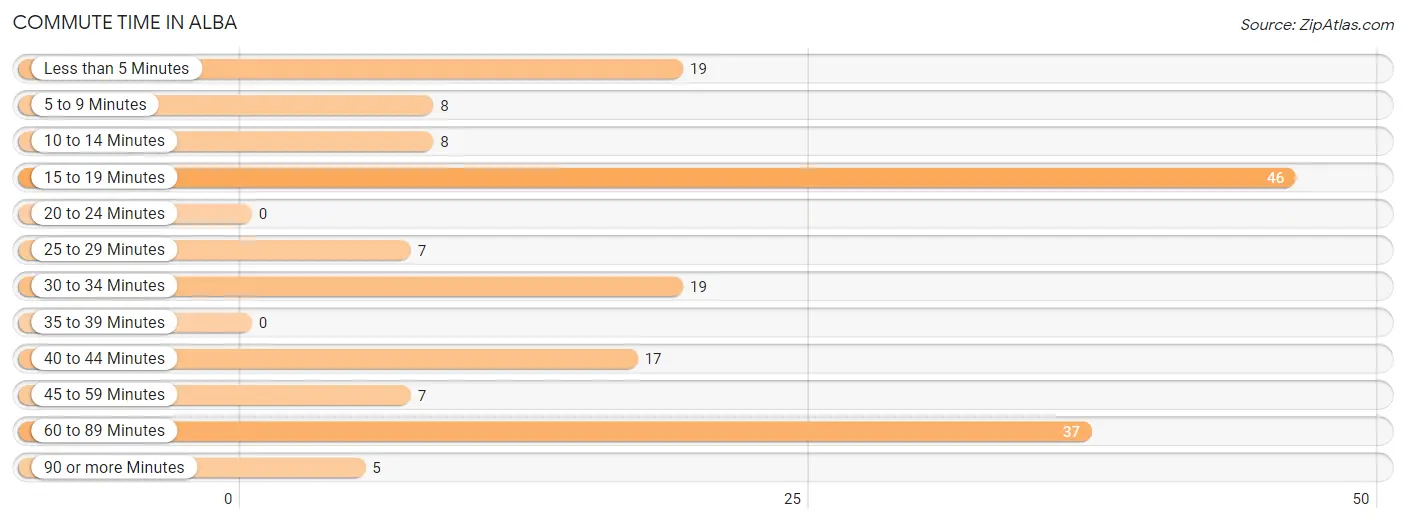
| Commute Time | # Commuters | % Commuters |
| Less than 5 Minutes | 19 | 11.0% |
| 5 to 9 Minutes | 8 | 4.6% |
| 10 to 14 Minutes | 8 | 4.6% |
| 15 to 19 Minutes | 46 | 26.6% |
| 20 to 24 Minutes | 0 | 0.0% |
| 25 to 29 Minutes | 7 | 4.1% |
| 30 to 34 Minutes | 19 | 11.0% |
| 35 to 39 Minutes | 0 | 0.0% |
| 40 to 44 Minutes | 17 | 9.8% |
| 45 to 59 Minutes | 7 | 4.1% |
| 60 to 89 Minutes | 37 | 21.4% |
| 90 or more Minutes | 5 | 2.9% |
Commute Time by Sex in Alba
The most common commute times in Alba are 60 to 89 minutes (23 commuters, 36.5%) for males and 15 to 19 minutes (34 commuters, 30.9%) for females.
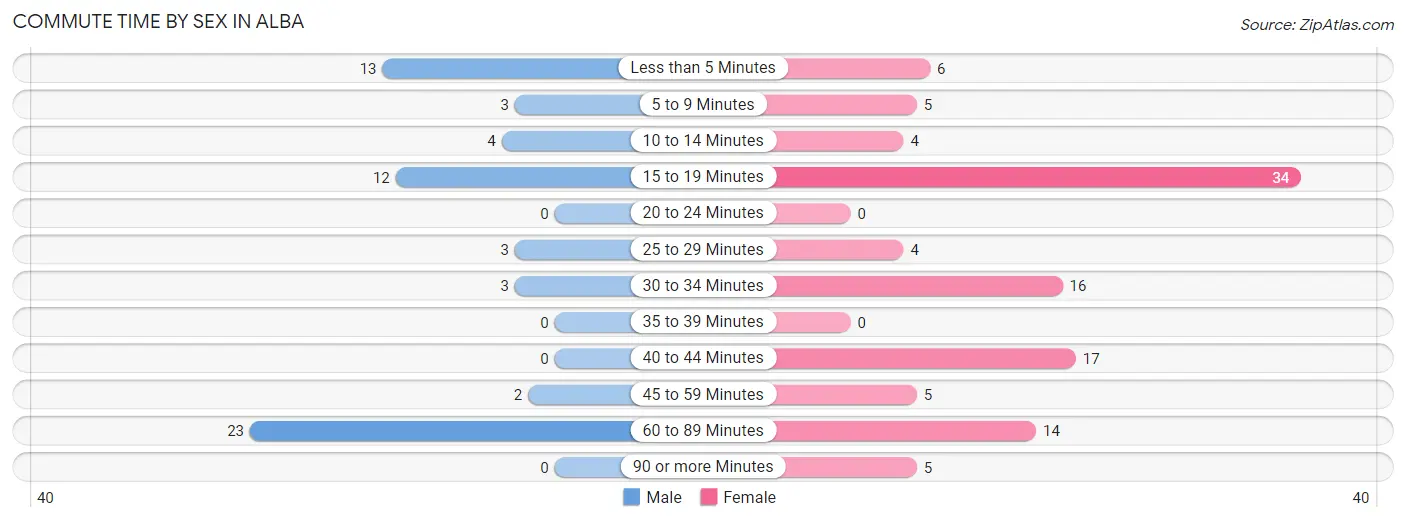
| Commute Time | Male | Female |
| Less than 5 Minutes | 13 (20.6%) | 6 (5.4%) |
| 5 to 9 Minutes | 3 (4.8%) | 5 (4.5%) |
| 10 to 14 Minutes | 4 (6.4%) | 4 (3.6%) |
| 15 to 19 Minutes | 12 (19.1%) | 34 (30.9%) |
| 20 to 24 Minutes | 0 (0.0%) | 0 (0.0%) |
| 25 to 29 Minutes | 3 (4.8%) | 4 (3.6%) |
| 30 to 34 Minutes | 3 (4.8%) | 16 (14.5%) |
| 35 to 39 Minutes | 0 (0.0%) | 0 (0.0%) |
| 40 to 44 Minutes | 0 (0.0%) | 17 (15.4%) |
| 45 to 59 Minutes | 2 (3.2%) | 5 (4.5%) |
| 60 to 89 Minutes | 23 (36.5%) | 14 (12.7%) |
| 90 or more Minutes | 0 (0.0%) | 5 (4.5%) |
Time of Departure to Work by Sex in Alba
The most frequent times of departure to work in Alba are 5:30 AM to 5:59 AM (14, 22.2%) for males and 7:00 AM to 7:29 AM (34, 30.9%) for females.
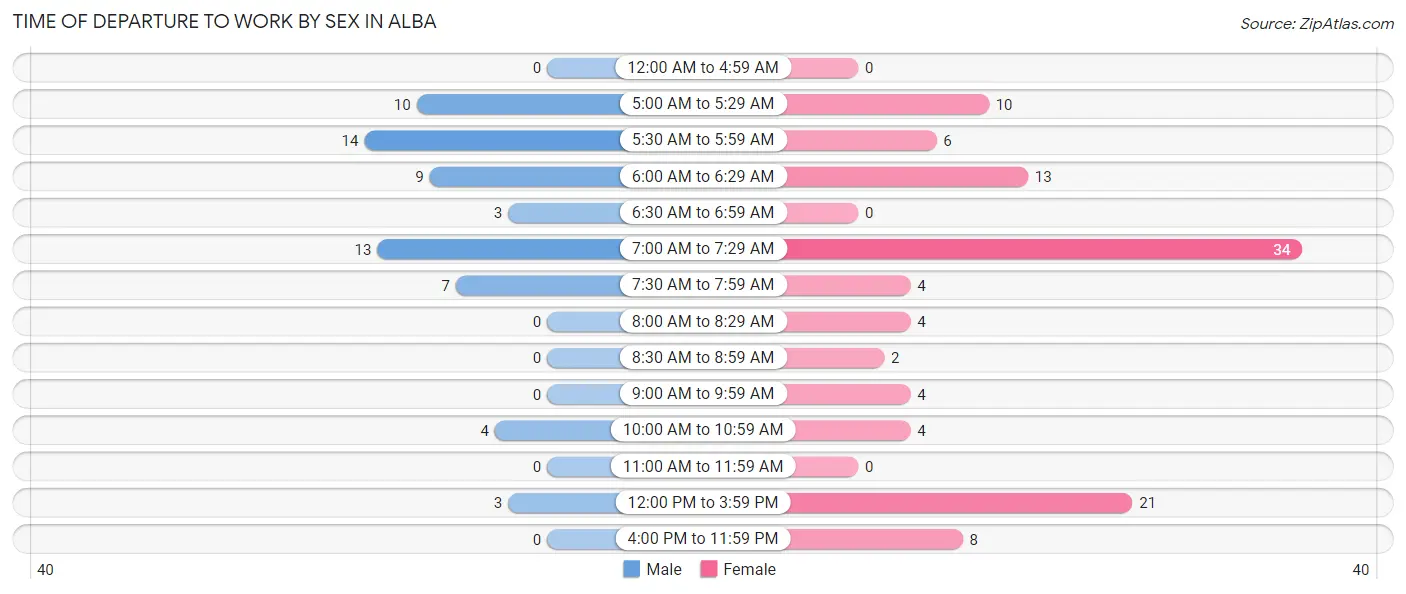
| Time of Departure | Male | Female |
| 12:00 AM to 4:59 AM | 0 (0.0%) | 0 (0.0%) |
| 5:00 AM to 5:29 AM | 10 (15.9%) | 10 (9.1%) |
| 5:30 AM to 5:59 AM | 14 (22.2%) | 6 (5.4%) |
| 6:00 AM to 6:29 AM | 9 (14.3%) | 13 (11.8%) |
| 6:30 AM to 6:59 AM | 3 (4.8%) | 0 (0.0%) |
| 7:00 AM to 7:29 AM | 13 (20.6%) | 34 (30.9%) |
| 7:30 AM to 7:59 AM | 7 (11.1%) | 4 (3.6%) |
| 8:00 AM to 8:29 AM | 0 (0.0%) | 4 (3.6%) |
| 8:30 AM to 8:59 AM | 0 (0.0%) | 2 (1.8%) |
| 9:00 AM to 9:59 AM | 0 (0.0%) | 4 (3.6%) |
| 10:00 AM to 10:59 AM | 4 (6.4%) | 4 (3.6%) |
| 11:00 AM to 11:59 AM | 0 (0.0%) | 0 (0.0%) |
| 12:00 PM to 3:59 PM | 3 (4.8%) | 21 (19.1%) |
| 4:00 PM to 11:59 PM | 0 (0.0%) | 8 (7.3%) |
| Total | 63 (100.0%) | 110 (100.0%) |
Housing Occupancy in Alba
Occupancy by Ownership in Alba
Of the total 229 dwellings in Alba, owner-occupied units account for 193 (84.3%), while renter-occupied units make up 36 (15.7%).
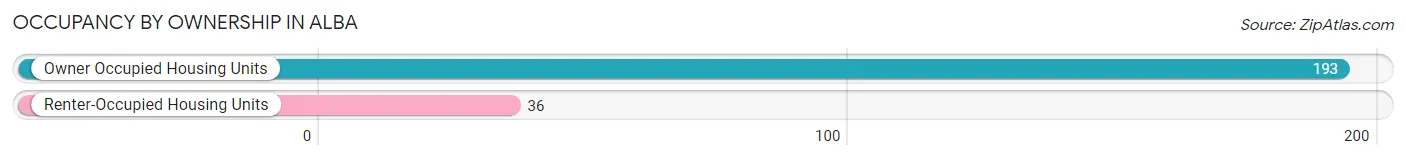
| Occupancy | # Housing Units | % Housing Units |
| Owner Occupied Housing Units | 193 | 84.3% |
| Renter-Occupied Housing Units | 36 | 15.7% |
| Total Occupied Housing Units | 229 | 100.0% |
Occupancy by Household Size in Alba
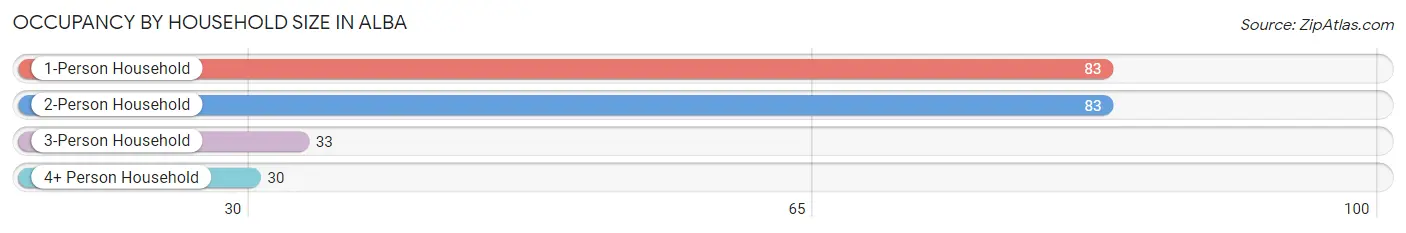
| Household Size | # Housing Units | % Housing Units |
| 1-Person Household | 83 | 36.2% |
| 2-Person Household | 83 | 36.2% |
| 3-Person Household | 33 | 14.4% |
| 4+ Person Household | 30 | 13.1% |
| Total Housing Units | 229 | 100.0% |
Occupancy by Ownership by Household Size in Alba
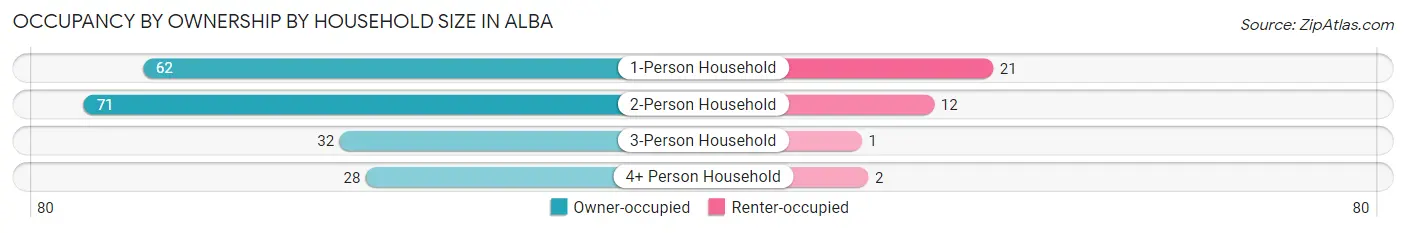
| Household Size | Owner-occupied | Renter-occupied |
| 1-Person Household | 62 (74.7%) | 21 (25.3%) |
| 2-Person Household | 71 (85.5%) | 12 (14.5%) |
| 3-Person Household | 32 (97.0%) | 1 (3.0%) |
| 4+ Person Household | 28 (93.3%) | 2 (6.7%) |
| Total Housing Units | 193 (84.3%) | 36 (15.7%) |
Occupancy by Educational Attainment in Alba
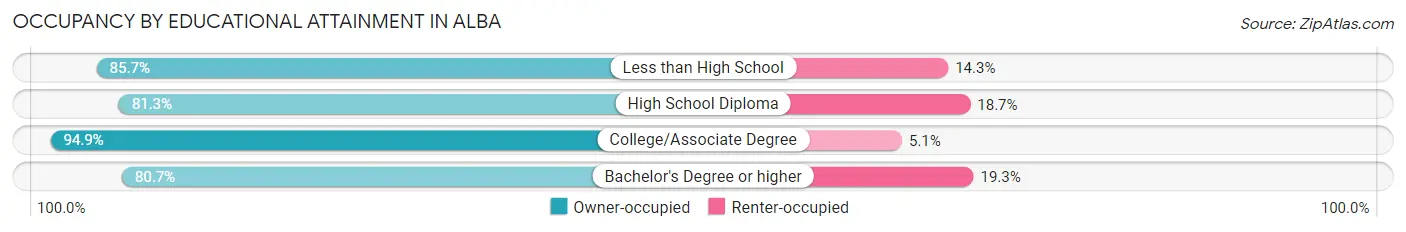
| Household Size | Owner-occupied | Renter-occupied |
| Less than High School | 36 (85.7%) | 6 (14.3%) |
| High School Diploma | 74 (81.3%) | 17 (18.7%) |
| College/Associate Degree | 37 (94.9%) | 2 (5.1%) |
| Bachelor's Degree or higher | 46 (80.7%) | 11 (19.3%) |
Occupancy by Age of Householder in Alba
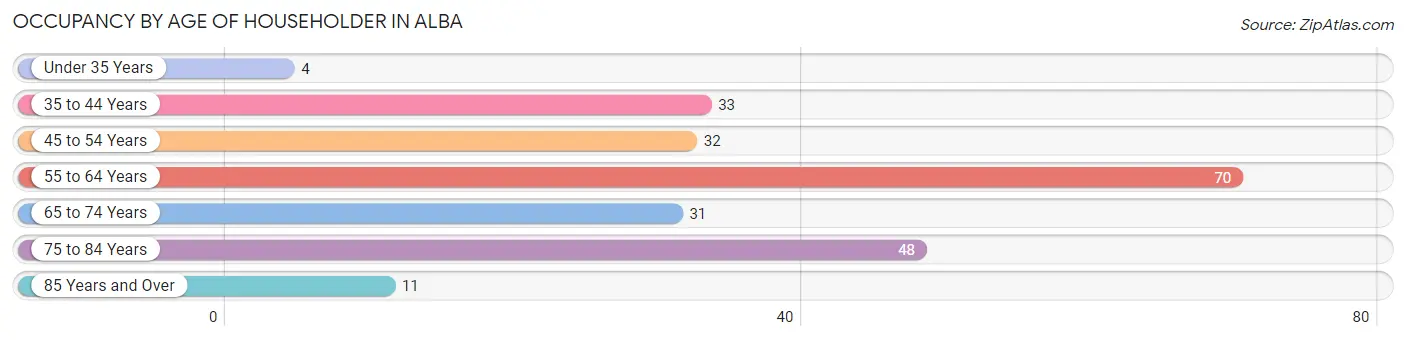
| Age Bracket | # Households | % Households |
| Under 35 Years | 4 | 1.8% |
| 35 to 44 Years | 33 | 14.4% |
| 45 to 54 Years | 32 | 14.0% |
| 55 to 64 Years | 70 | 30.6% |
| 65 to 74 Years | 31 | 13.5% |
| 75 to 84 Years | 48 | 21.0% |
| 85 Years and Over | 11 | 4.8% |
| Total | 229 | 100.0% |
Housing Finances in Alba
Median Income by Occupancy in Alba
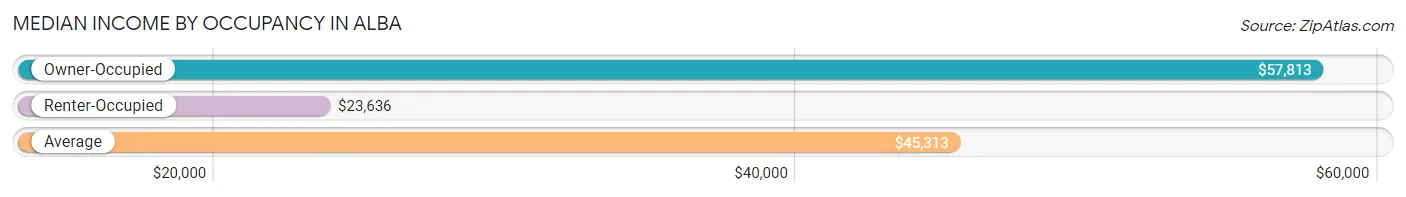
| Occupancy Type | # Households | Median Income |
| Owner-Occupied | 193 (84.3%) | $57,813 |
| Renter-Occupied | 36 (15.7%) | $23,636 |
| Average | 229 (100.0%) | $45,313 |
Occupancy by Householder Income Bracket in Alba
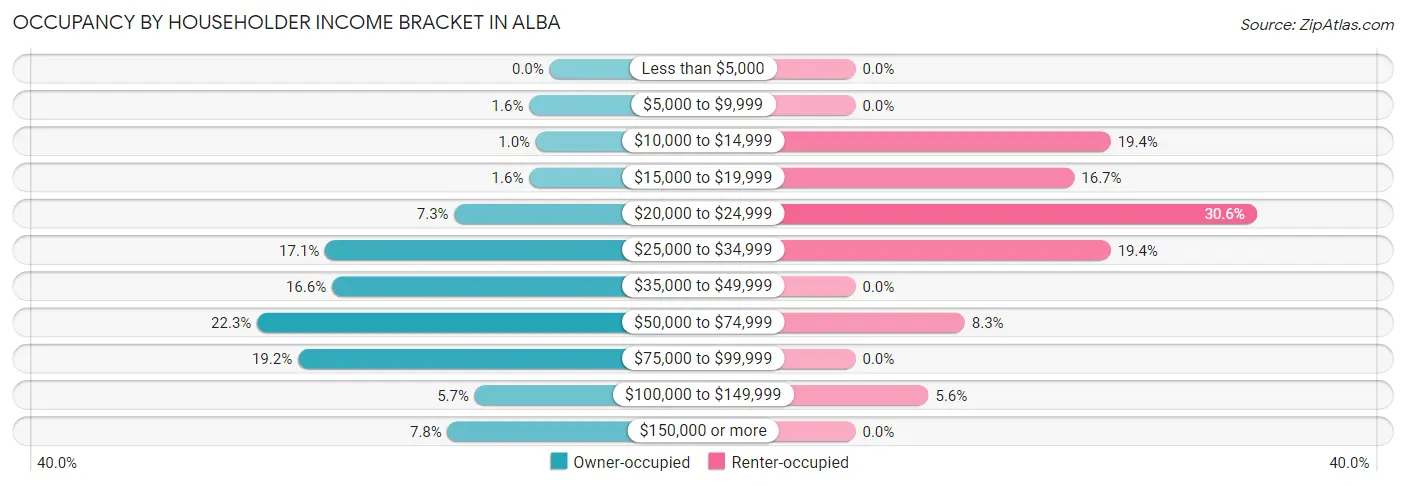
| Income Bracket | Owner-occupied | Renter-occupied |
| Less than $5,000 | 0 (0.0%) | 0 (0.0%) |
| $5,000 to $9,999 | 3 (1.5%) | 0 (0.0%) |
| $10,000 to $14,999 | 2 (1.0%) | 7 (19.4%) |
| $15,000 to $19,999 | 3 (1.5%) | 6 (16.7%) |
| $20,000 to $24,999 | 14 (7.2%) | 11 (30.6%) |
| $25,000 to $34,999 | 33 (17.1%) | 7 (19.4%) |
| $35,000 to $49,999 | 32 (16.6%) | 0 (0.0%) |
| $50,000 to $74,999 | 43 (22.3%) | 3 (8.3%) |
| $75,000 to $99,999 | 37 (19.2%) | 0 (0.0%) |
| $100,000 to $149,999 | 11 (5.7%) | 2 (5.6%) |
| $150,000 or more | 15 (7.8%) | 0 (0.0%) |
| Total | 193 (100.0%) | 36 (100.0%) |
Monthly Housing Cost Tiers in Alba
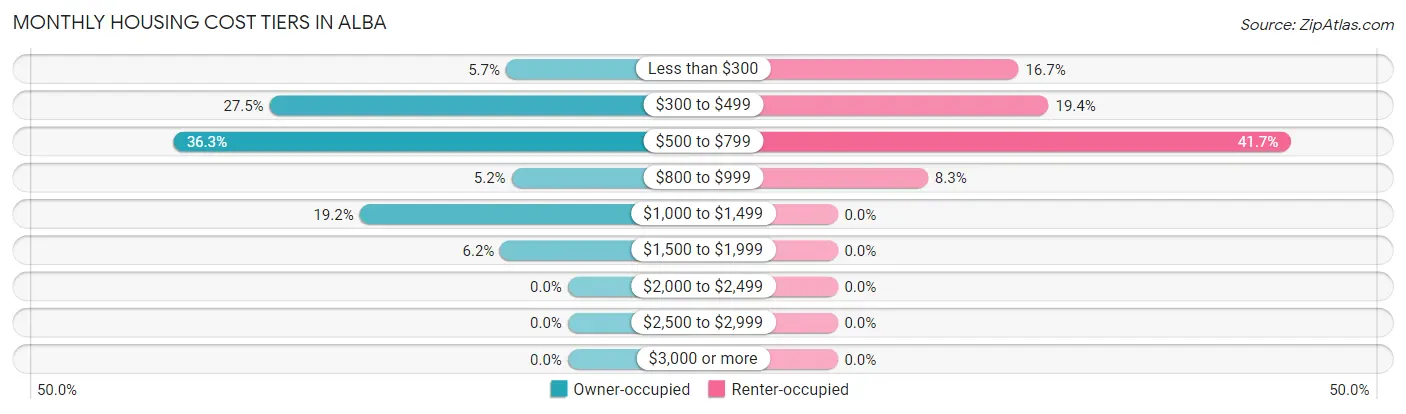
| Monthly Cost | Owner-occupied | Renter-occupied |
| Less than $300 | 11 (5.7%) | 6 (16.7%) |
| $300 to $499 | 53 (27.5%) | 7 (19.4%) |
| $500 to $799 | 70 (36.3%) | 15 (41.7%) |
| $800 to $999 | 10 (5.2%) | 3 (8.3%) |
| $1,000 to $1,499 | 37 (19.2%) | 0 (0.0%) |
| $1,500 to $1,999 | 12 (6.2%) | 0 (0.0%) |
| $2,000 to $2,499 | 0 (0.0%) | 0 (0.0%) |
| $2,500 to $2,999 | 0 (0.0%) | 0 (0.0%) |
| $3,000 or more | 0 (0.0%) | 0 (0.0%) |
| Total | 193 (100.0%) | 36 (100.0%) |
Physical Housing Characteristics in Alba
Housing Structures in Alba
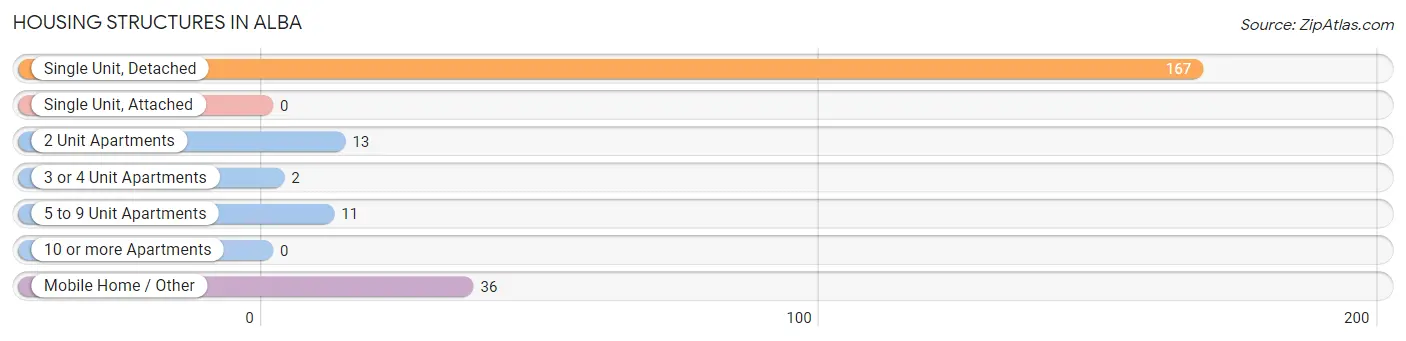
| Structure Type | # Housing Units | % Housing Units |
| Single Unit, Detached | 167 | 72.9% |
| Single Unit, Attached | 0 | 0.0% |
| 2 Unit Apartments | 13 | 5.7% |
| 3 or 4 Unit Apartments | 2 | 0.9% |
| 5 to 9 Unit Apartments | 11 | 4.8% |
| 10 or more Apartments | 0 | 0.0% |
| Mobile Home / Other | 36 | 15.7% |
| Total | 229 | 100.0% |
Housing Structures by Occupancy in Alba
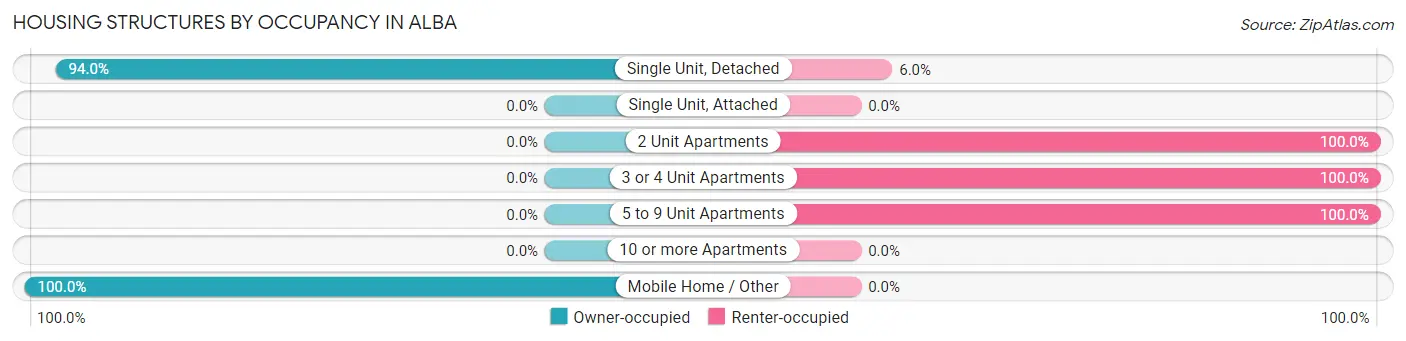
| Structure Type | Owner-occupied | Renter-occupied |
| Single Unit, Detached | 157 (94.0%) | 10 (6.0%) |
| Single Unit, Attached | 0 (0.0%) | 0 (0.0%) |
| 2 Unit Apartments | 0 (0.0%) | 13 (100.0%) |
| 3 or 4 Unit Apartments | 0 (0.0%) | 2 (100.0%) |
| 5 to 9 Unit Apartments | 0 (0.0%) | 11 (100.0%) |
| 10 or more Apartments | 0 (0.0%) | 0 (0.0%) |
| Mobile Home / Other | 36 (100.0%) | 0 (0.0%) |
| Total | 193 (84.3%) | 36 (15.7%) |
Housing Structures by Number of Rooms in Alba
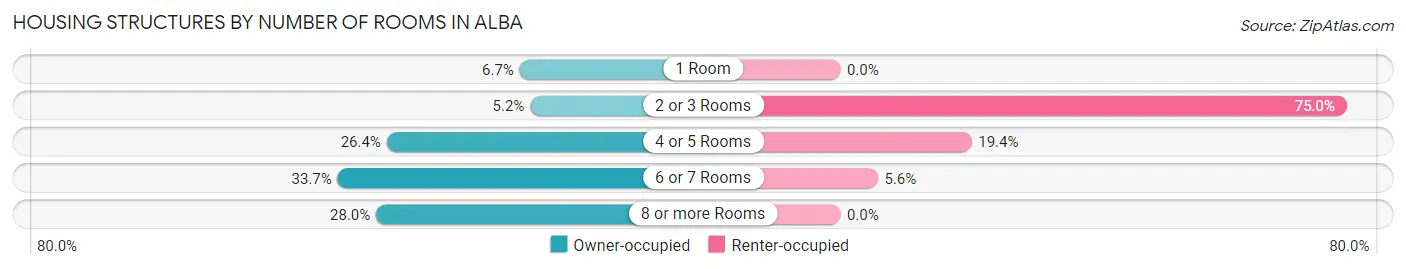
| Number of Rooms | Owner-occupied | Renter-occupied |
| 1 Room | 13 (6.7%) | 0 (0.0%) |
| 2 or 3 Rooms | 10 (5.2%) | 27 (75.0%) |
| 4 or 5 Rooms | 51 (26.4%) | 7 (19.4%) |
| 6 or 7 Rooms | 65 (33.7%) | 2 (5.6%) |
| 8 or more Rooms | 54 (28.0%) | 0 (0.0%) |
| Total | 193 (100.0%) | 36 (100.0%) |
Housing Structure by Heating Type in Alba
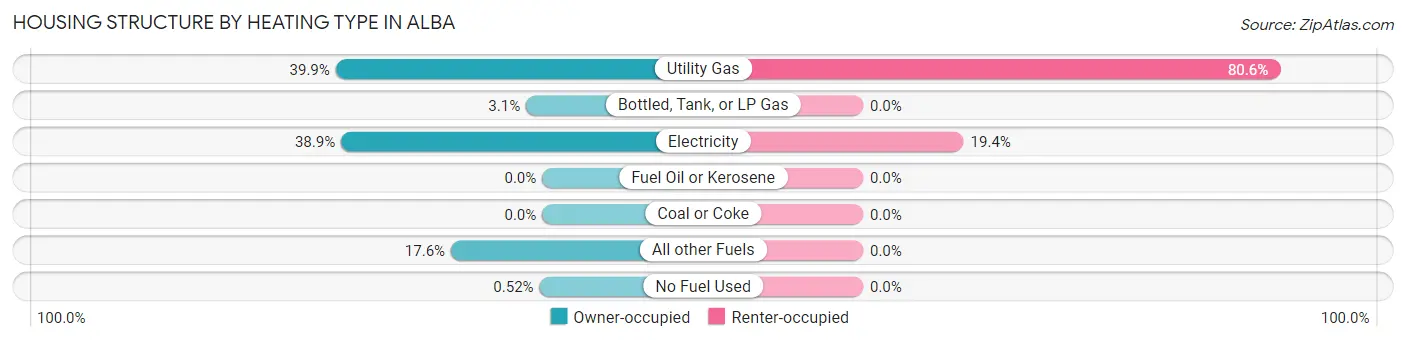
| Heating Type | Owner-occupied | Renter-occupied |
| Utility Gas | 77 (39.9%) | 29 (80.6%) |
| Bottled, Tank, or LP Gas | 6 (3.1%) | 0 (0.0%) |
| Electricity | 75 (38.9%) | 7 (19.4%) |
| Fuel Oil or Kerosene | 0 (0.0%) | 0 (0.0%) |
| Coal or Coke | 0 (0.0%) | 0 (0.0%) |
| All other Fuels | 34 (17.6%) | 0 (0.0%) |
| No Fuel Used | 1 (0.5%) | 0 (0.0%) |
| Total | 193 (100.0%) | 36 (100.0%) |
Household Vehicle Usage in Alba
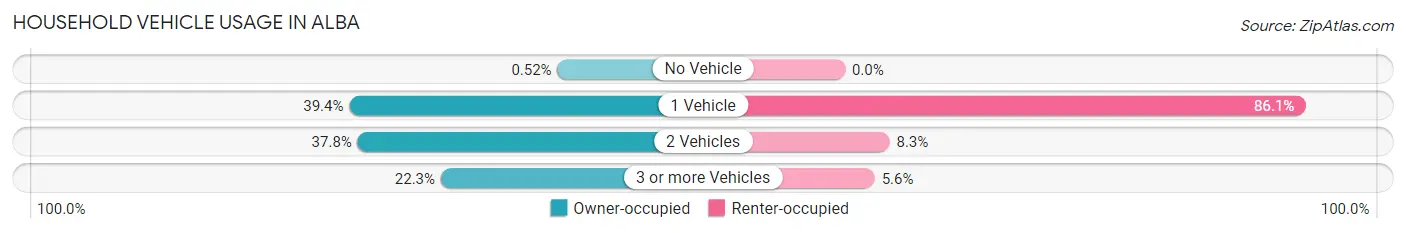
| Vehicles per Household | Owner-occupied | Renter-occupied |
| No Vehicle | 1 (0.5%) | 0 (0.0%) |
| 1 Vehicle | 76 (39.4%) | 31 (86.1%) |
| 2 Vehicles | 73 (37.8%) | 3 (8.3%) |
| 3 or more Vehicles | 43 (22.3%) | 2 (5.6%) |
| Total | 193 (100.0%) | 36 (100.0%) |
Real Estate & Mortgages in Alba
Real Estate and Mortgage Overview in Alba
| Characteristic | Without Mortgage | With Mortgage |
| Housing Units | 140 | 53 |
| Median Property Value | $107,500 | $119,300 |
| Median Household Income | $55,000 | $8 |
| Monthly Housing Costs | $519 | $0 |
| Real Estate Taxes | $1,449 | $6 |
Property Value by Mortgage Status in Alba
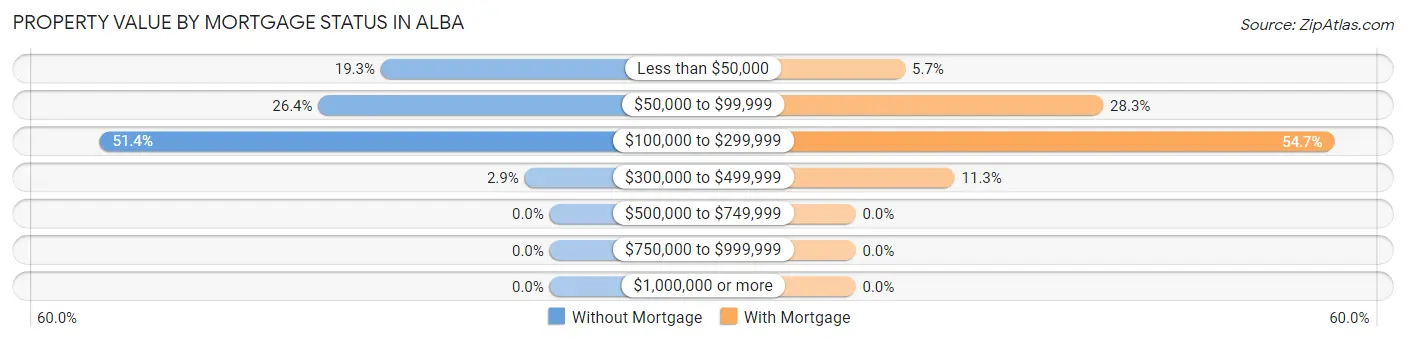
| Property Value | Without Mortgage | With Mortgage |
| Less than $50,000 | 27 (19.3%) | 3 (5.7%) |
| $50,000 to $99,999 | 37 (26.4%) | 15 (28.3%) |
| $100,000 to $299,999 | 72 (51.4%) | 29 (54.7%) |
| $300,000 to $499,999 | 4 (2.9%) | 6 (11.3%) |
| $500,000 to $749,999 | 0 (0.0%) | 0 (0.0%) |
| $750,000 to $999,999 | 0 (0.0%) | 0 (0.0%) |
| $1,000,000 or more | 0 (0.0%) | 0 (0.0%) |
| Total | 140 (100.0%) | 53 (100.0%) |
Household Income by Mortgage Status in Alba
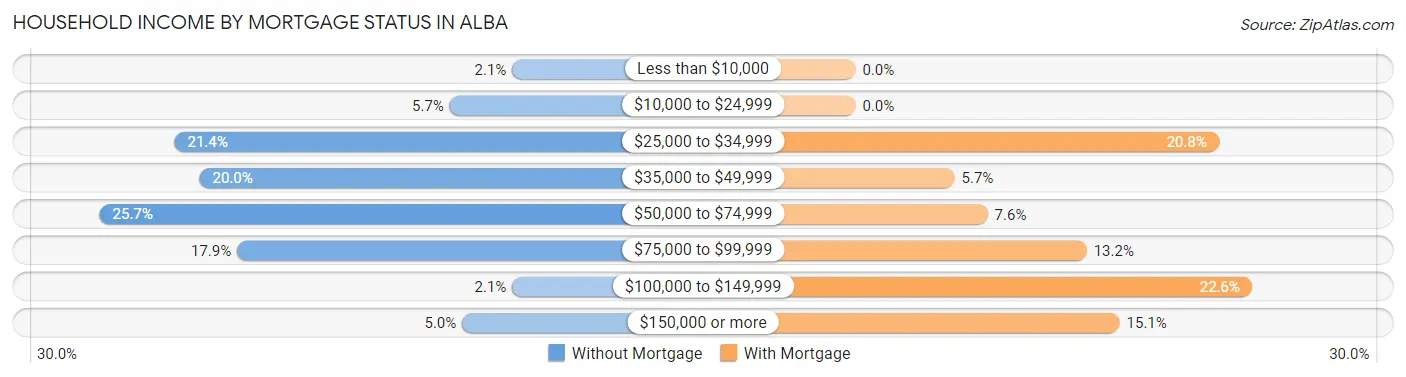
| Household Income | Without Mortgage | With Mortgage |
| Less than $10,000 | 3 (2.1%) | 0 (0.0%) |
| $10,000 to $24,999 | 8 (5.7%) | 0 (0.0%) |
| $25,000 to $34,999 | 30 (21.4%) | 11 (20.7%) |
| $35,000 to $49,999 | 28 (20.0%) | 3 (5.7%) |
| $50,000 to $74,999 | 36 (25.7%) | 4 (7.5%) |
| $75,000 to $99,999 | 25 (17.9%) | 7 (13.2%) |
| $100,000 to $149,999 | 3 (2.1%) | 12 (22.6%) |
| $150,000 or more | 7 (5.0%) | 8 (15.1%) |
| Total | 140 (100.0%) | 53 (100.0%) |
Property Value to Household Income Ratio in Alba
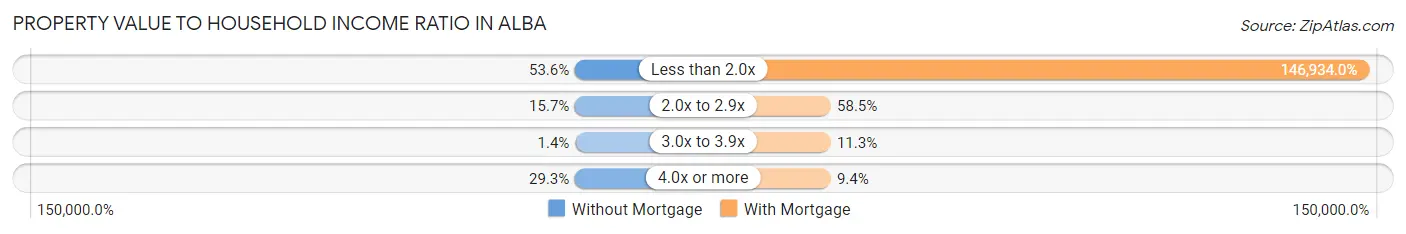
| Value-to-Income Ratio | Without Mortgage | With Mortgage |
| Less than 2.0x | 75 (53.6%) | 77,875 (146,934.0%) |
| 2.0x to 2.9x | 22 (15.7%) | 31 (58.5%) |
| 3.0x to 3.9x | 2 (1.4%) | 6 (11.3%) |
| 4.0x or more | 41 (29.3%) | 5 (9.4%) |
| Total | 140 (100.0%) | 53 (100.0%) |
Real Estate Taxes by Mortgage Status in Alba
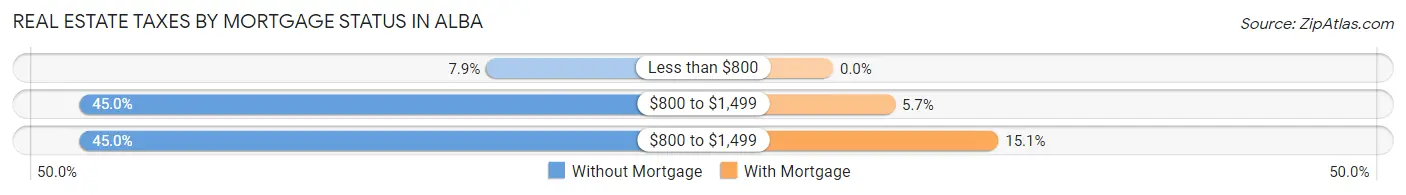
| Property Taxes | Without Mortgage | With Mortgage |
| Less than $800 | 11 (7.9%) | 0 (0.0%) |
| $800 to $1,499 | 63 (45.0%) | 3 (5.7%) |
| $800 to $1,499 | 63 (45.0%) | 8 (15.1%) |
| Total | 140 (100.0%) | 53 (100.0%) |
Health & Disability in Alba
Health Insurance Coverage by Age in Alba
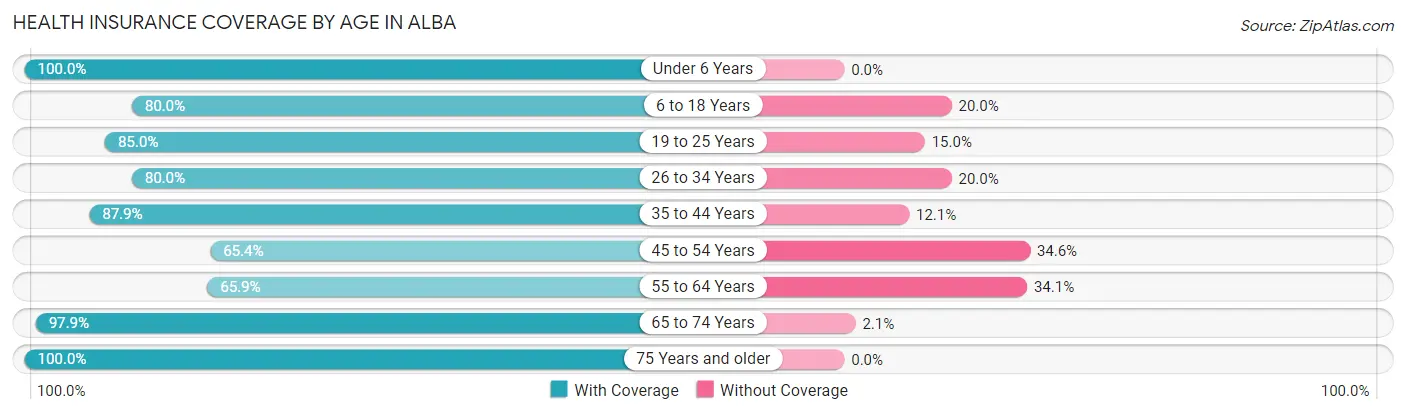
| Age Bracket | With Coverage | Without Coverage |
| Under 6 Years | 22 (100.0%) | 0 (0.0%) |
| 6 to 18 Years | 64 (80.0%) | 16 (20.0%) |
| 19 to 25 Years | 34 (85.0%) | 6 (15.0%) |
| 26 to 34 Years | 12 (80.0%) | 3 (20.0%) |
| 35 to 44 Years | 51 (87.9%) | 7 (12.1%) |
| 45 to 54 Years | 34 (65.4%) | 18 (34.6%) |
| 55 to 64 Years | 89 (65.9%) | 46 (34.1%) |
| 65 to 74 Years | 47 (97.9%) | 1 (2.1%) |
| 75 Years and older | 88 (100.0%) | 0 (0.0%) |
| Total | 441 (82.0%) | 97 (18.0%) |
Health Insurance Coverage by Citizenship Status in Alba
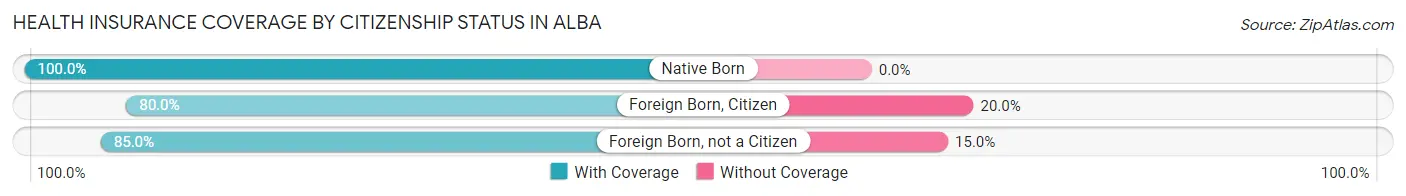
| Citizenship Status | With Coverage | Without Coverage |
| Native Born | 22 (100.0%) | 0 (0.0%) |
| Foreign Born, Citizen | 64 (80.0%) | 16 (20.0%) |
| Foreign Born, not a Citizen | 34 (85.0%) | 6 (15.0%) |
Health Insurance Coverage by Household Income in Alba
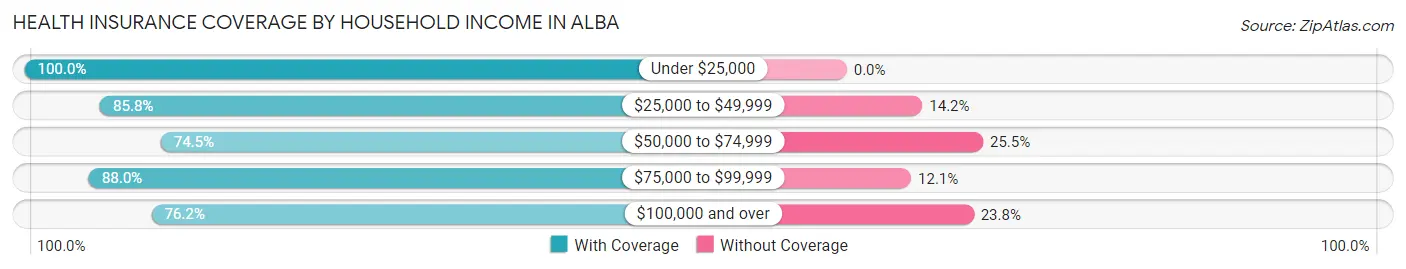
| Household Income | With Coverage | Without Coverage |
| Under $25,000 | 54 (100.0%) | 0 (0.0%) |
| $25,000 to $49,999 | 97 (85.8%) | 16 (14.2%) |
| $50,000 to $74,999 | 108 (74.5%) | 37 (25.5%) |
| $75,000 to $99,999 | 73 (87.9%) | 10 (12.0%) |
| $100,000 and over | 109 (76.2%) | 34 (23.8%) |
Public vs Private Health Insurance Coverage by Age in Alba
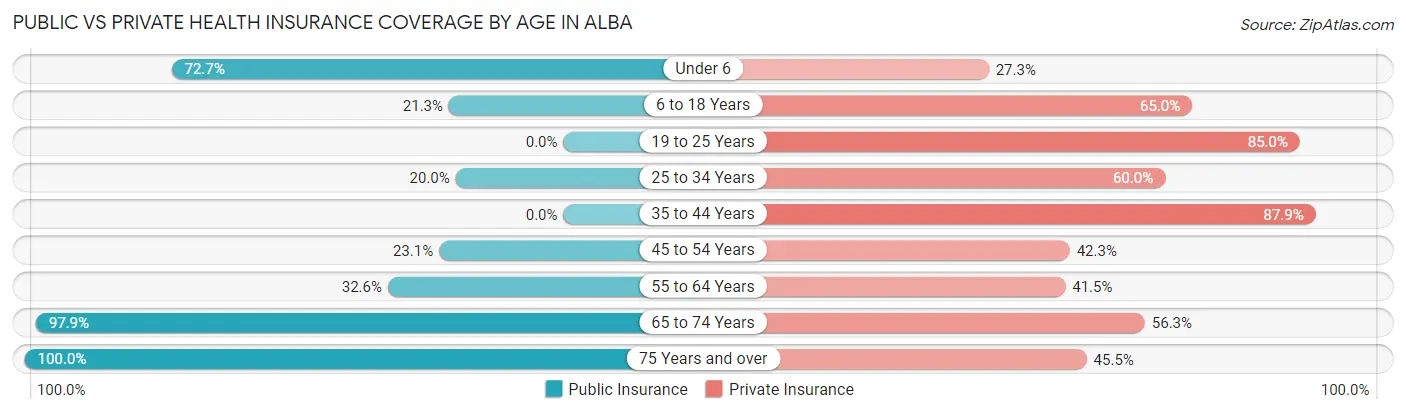
| Age Bracket | Public Insurance | Private Insurance |
| Under 6 | 16 (72.7%) | 6 (27.3%) |
| 6 to 18 Years | 17 (21.2%) | 52 (65.0%) |
| 19 to 25 Years | 0 (0.0%) | 34 (85.0%) |
| 25 to 34 Years | 3 (20.0%) | 9 (60.0%) |
| 35 to 44 Years | 0 (0.0%) | 51 (87.9%) |
| 45 to 54 Years | 12 (23.1%) | 22 (42.3%) |
| 55 to 64 Years | 44 (32.6%) | 56 (41.5%) |
| 65 to 74 Years | 47 (97.9%) | 27 (56.2%) |
| 75 Years and over | 88 (100.0%) | 40 (45.5%) |
| Total | 227 (42.2%) | 297 (55.2%) |
Disability Status by Sex by Age in Alba
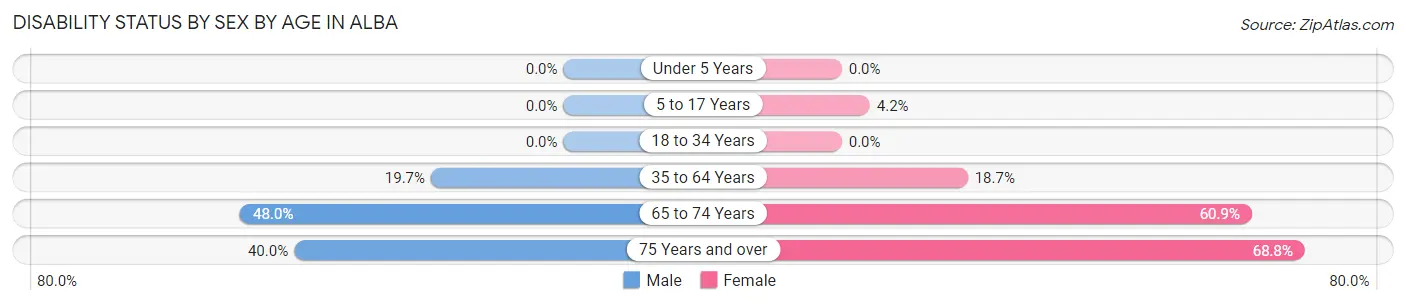
| Age Bracket | Male | Female |
| Under 5 Years | 0 (0.0%) | 0 (0.0%) |
| 5 to 17 Years | 0 (0.0%) | 1 (4.2%) |
| 18 to 34 Years | 0 (0.0%) | 0 (0.0%) |
| 35 to 64 Years | 24 (19.7%) | 23 (18.7%) |
| 65 to 74 Years | 12 (48.0%) | 14 (60.9%) |
| 75 Years and over | 16 (40.0%) | 33 (68.8%) |
Disability Class by Sex by Age in Alba
Disability Class: Hearing Difficulty
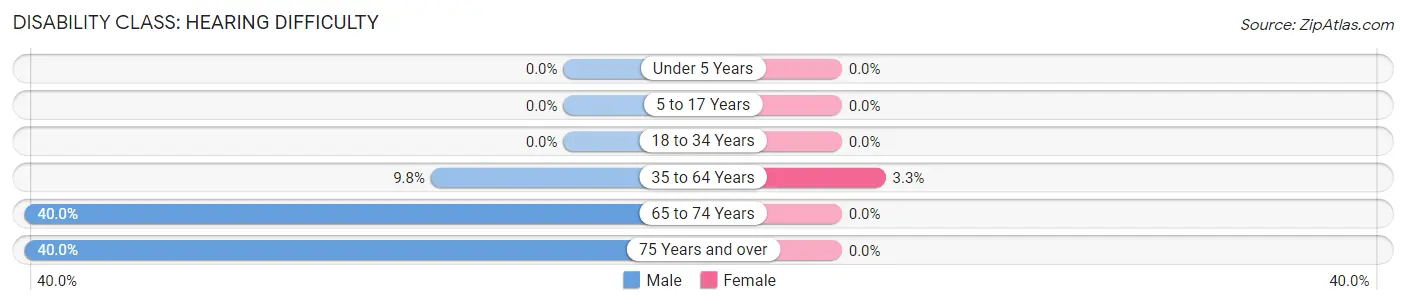
| Age Bracket | Male | Female |
| Under 5 Years | 0 (0.0%) | 0 (0.0%) |
| 5 to 17 Years | 0 (0.0%) | 0 (0.0%) |
| 18 to 34 Years | 0 (0.0%) | 0 (0.0%) |
| 35 to 64 Years | 12 (9.8%) | 4 (3.3%) |
| 65 to 74 Years | 10 (40.0%) | 0 (0.0%) |
| 75 Years and over | 16 (40.0%) | 0 (0.0%) |
Disability Class: Vision Difficulty
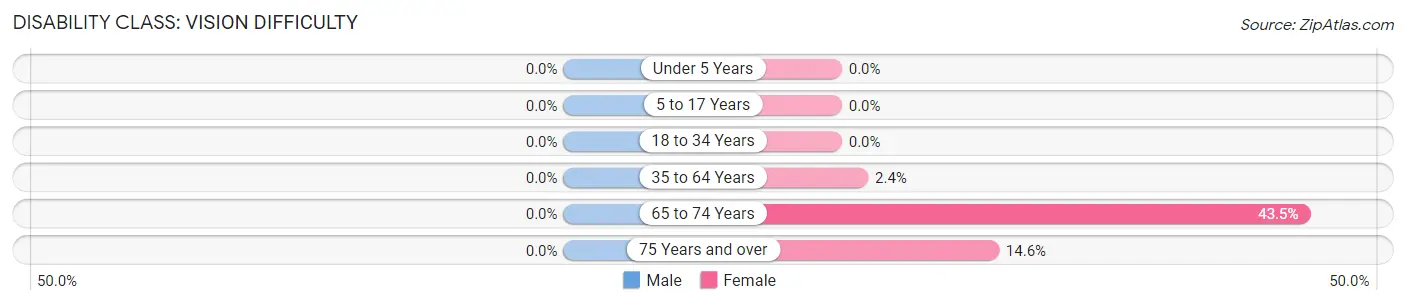
| Age Bracket | Male | Female |
| Under 5 Years | 0 (0.0%) | 0 (0.0%) |
| 5 to 17 Years | 0 (0.0%) | 0 (0.0%) |
| 18 to 34 Years | 0 (0.0%) | 0 (0.0%) |
| 35 to 64 Years | 0 (0.0%) | 3 (2.4%) |
| 65 to 74 Years | 0 (0.0%) | 10 (43.5%) |
| 75 Years and over | 0 (0.0%) | 7 (14.6%) |
Disability Class: Cognitive Difficulty
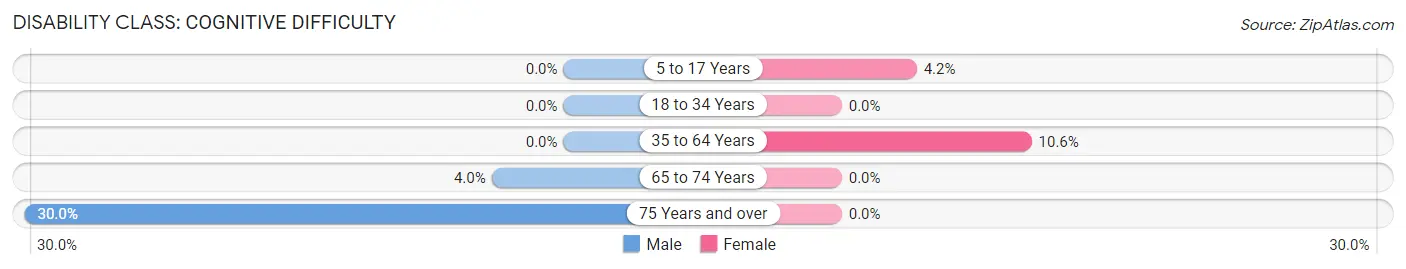
| Age Bracket | Male | Female |
| 5 to 17 Years | 0 (0.0%) | 1 (4.2%) |
| 18 to 34 Years | 0 (0.0%) | 0 (0.0%) |
| 35 to 64 Years | 0 (0.0%) | 13 (10.6%) |
| 65 to 74 Years | 1 (4.0%) | 0 (0.0%) |
| 75 Years and over | 12 (30.0%) | 0 (0.0%) |
Disability Class: Ambulatory Difficulty
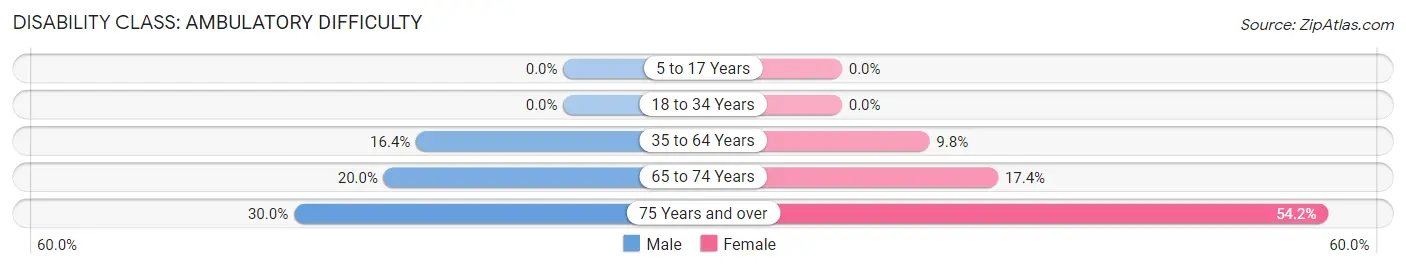
| Age Bracket | Male | Female |
| 5 to 17 Years | 0 (0.0%) | 0 (0.0%) |
| 18 to 34 Years | 0 (0.0%) | 0 (0.0%) |
| 35 to 64 Years | 20 (16.4%) | 12 (9.8%) |
| 65 to 74 Years | 5 (20.0%) | 4 (17.4%) |
| 75 Years and over | 12 (30.0%) | 26 (54.2%) |
Disability Class: Self-Care Difficulty
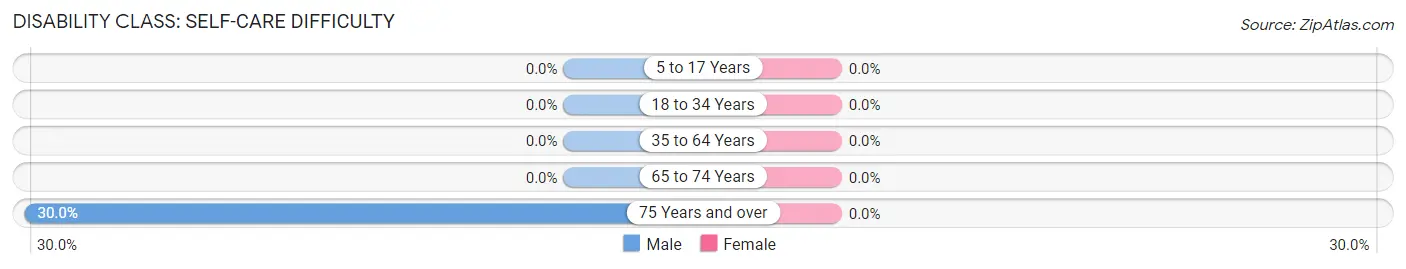
| Age Bracket | Male | Female |
| 5 to 17 Years | 0 (0.0%) | 0 (0.0%) |
| 18 to 34 Years | 0 (0.0%) | 0 (0.0%) |
| 35 to 64 Years | 0 (0.0%) | 0 (0.0%) |
| 65 to 74 Years | 0 (0.0%) | 0 (0.0%) |
| 75 Years and over | 12 (30.0%) | 0 (0.0%) |
Technology Access in Alba
Computing Device Access in Alba
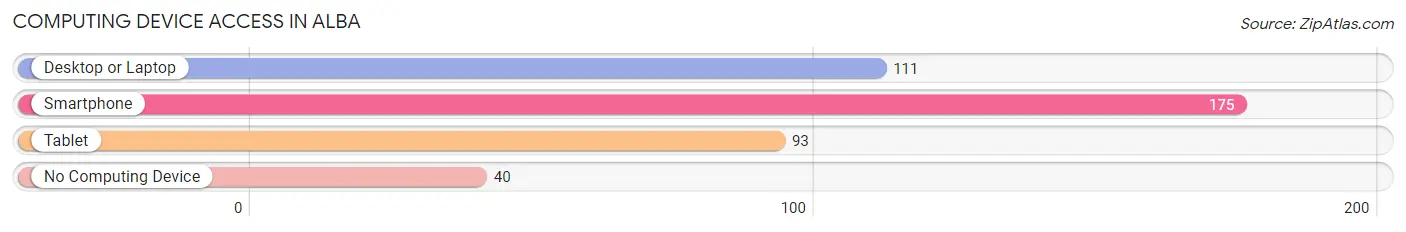
| Device Type | # Households | % Households |
| Desktop or Laptop | 111 | 48.5% |
| Smartphone | 175 | 76.4% |
| Tablet | 93 | 40.6% |
| No Computing Device | 40 | 17.5% |
| Total | 229 | 100.0% |
Internet Access in Alba
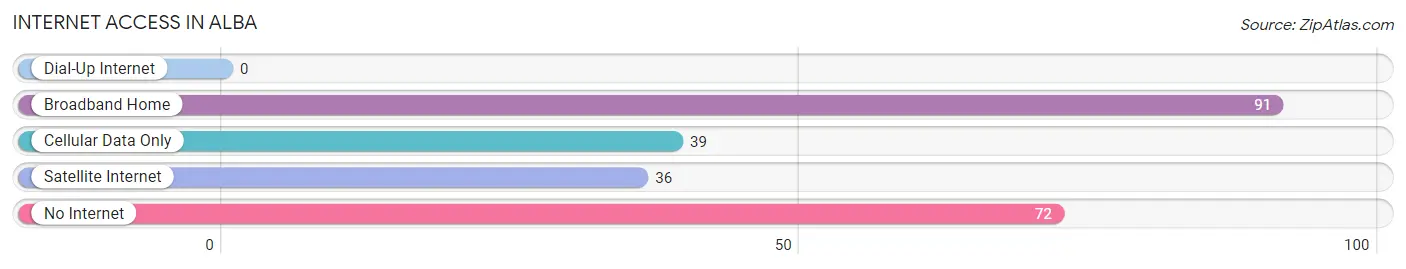
| Internet Type | # Households | % Households |
| Dial-Up Internet | 0 | 0.0% |
| Broadband Home | 91 | 39.7% |
| Cellular Data Only | 39 | 17.0% |
| Satellite Internet | 36 | 15.7% |
| No Internet | 72 | 31.4% |
| Total | 229 | 100.0% |
Alba Summary
Alba, Texas is a small town located in Wood County, Texas. It is situated in the northeast corner of the state, about 90 miles east of Dallas. The town was founded in 1873 and has a population of approximately 1,000 people.
History
Alba was founded in 1873 by a group of settlers from the nearby town of Quitman. The town was named after the daughter of one of the settlers, Alba Smith. The town was originally a farming community, but in the early 1900s, the discovery of oil in the area led to a boom in the local economy. The town quickly grew and by the 1920s, it had become a thriving center of commerce.
In the 1950s, Alba began to experience a decline in population as many of its residents moved away to larger cities. However, the town has managed to remain a vibrant community and has seen a resurgence in recent years.
Geography
Alba is located in the northeast corner of Texas, about 90 miles east of Dallas. The town is situated in the Piney Woods region of the state, which is characterized by rolling hills and dense forests. The town is located on the banks of the Sabine River, which provides a natural border between Texas and Louisiana.
The climate in Alba is humid subtropical, with hot summers and mild winters. The average annual temperature is around 70 degrees Fahrenheit.
Economy
Alba’s economy is largely based on agriculture and timber production. The town is home to several large farms, which produce a variety of crops, including cotton, corn, soybeans, and wheat. The timber industry is also an important part of the local economy, with several sawmills located in the area.
In addition to agriculture and timber, Alba is also home to several small businesses, including restaurants, retail stores, and service providers. The town is also home to a small manufacturing sector, which produces a variety of products, including furniture and clothing.
Demographics
As of the 2010 census, Alba had a population of 1,000 people. The racial makeup of the town was 95.2% White, 0.7% African American, 0.3% Native American, 0.2% Asian, and 3.6% from other races. The median household income was $35,000, and the median age was 38.
Alba is a small, rural town with a strong sense of community. The town is home to several churches, a public library, and a variety of recreational activities. The town is also home to a number of festivals and events throughout the year, including the annual Alba County Fair.
Common Questions
What is Per Capita Income in Alba?
Per Capita income in Alba is $28,675.
What is the Median Family Income in Alba?
Median Family Income in Alba is $70,982.
What is the Median Household income in Alba?
Median Household Income in Alba is $45,313.
What is Income or Wage Gap in Alba?
Income or Wage Gap in Alba is 66.9%.
Women in Alba earn 33.1 cents for every dollar earned by a man.
What is Inequality or Gini Index in Alba?
Inequality or Gini Index in Alba is 0.42.
What is the Total Population of Alba?
Total Population of Alba is 538.
What is the Total Male Population of Alba?
Total Male Population of Alba is 255.
What is the Total Female Population of Alba?
Total Female Population of Alba is 283.
What is the Ratio of Males per 100 Females in Alba?
There are 90.11 Males per 100 Females in Alba.
What is the Ratio of Females per 100 Males in Alba?
There are 110.98 Females per 100 Males in Alba.
What is the Median Population Age in Alba?
Median Population Age in Alba is 56.0 Years.
What is the Average Family Size in Alba
Average Family Size in Alba is 3.0 People.
What is the Average Household Size in Alba
Average Household Size in Alba is 2.4 People.
How Large is the Labor Force in Alba?
There are 182 People in the Labor Forcein in Alba.
What is the Percentage of People in the Labor Force in Alba?
40.0% of People are in the Labor Force in Alba.
What is the Unemployment Rate in Alba?
Unemployment Rate in Alba is 2.2%.