Woodruff, SC Map & Demographics
Woodruff Map
Woodruff Overview
$29,436
PER CAPITA INCOME
$71,212
AVG FAMILY INCOME
$68,451
AVG HOUSEHOLD INCOME
18.8%
WAGE / INCOME GAP [ % ]
81.2¢/ $1
WAGE / INCOME GAP [ $ ]
0.29
INEQUALITY / GINI INDEX
4,262
TOTAL POPULATION
2,223
MALE POPULATION
2,039
FEMALE POPULATION
109.02
MALES / 100 FEMALES
91.72
FEMALES / 100 MALES
37.3
MEDIAN AGE
3.2
AVG FAMILY SIZE
2.4
AVG HOUSEHOLD SIZE
2,301
LABOR FORCE [ PEOPLE ]
65.0%
PERCENT IN LABOR FORCE
6.3%
UNEMPLOYMENT RATE
Woodruff Zip Codes
Woodruff Area Codes
Income in Woodruff
Income Overview in Woodruff
Per Capita Income in Woodruff is $29,436, while median incomes of families and households are $71,212 and $68,451 respectively.
| Characteristic | Number | Measure |
| Per Capita Income | 4,262 | $29,436 |
| Median Family Income | 892 | $71,212 |
| Mean Family Income | 892 | $74,975 |
| Median Household Income | 1,722 | $68,451 |
| Mean Household Income | 1,722 | $65,400 |
| Income Deficit | 892 | $0 |
| Wage / Income Gap (%) | 4,262 | 18.79% |
| Wage / Income Gap ($) | 4,262 | 81.21¢ per $1 |
| Gini / Inequality Index | 4,262 | 0.29 |
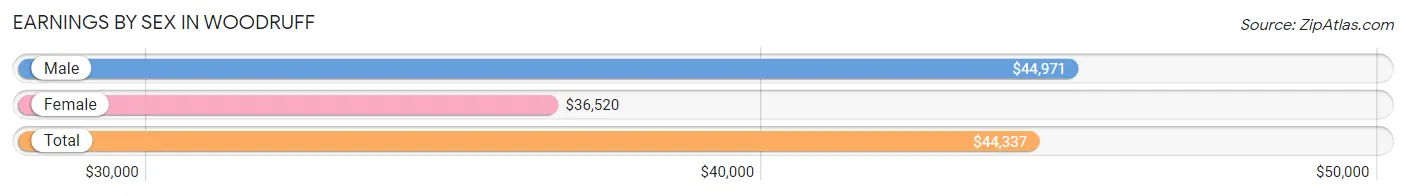
Earnings by Sex in Woodruff
Average Earnings in Woodruff are $44,337, $44,971 for men and $36,520 for women, a difference of 18.8%.
| Sex | Number | Average Earnings |
| Male | 1,283 (57.3%) | $44,971 |
| Female | 956 (42.7%) | $36,520 |
| Total | 2,239 (100.0%) | $44,337 |
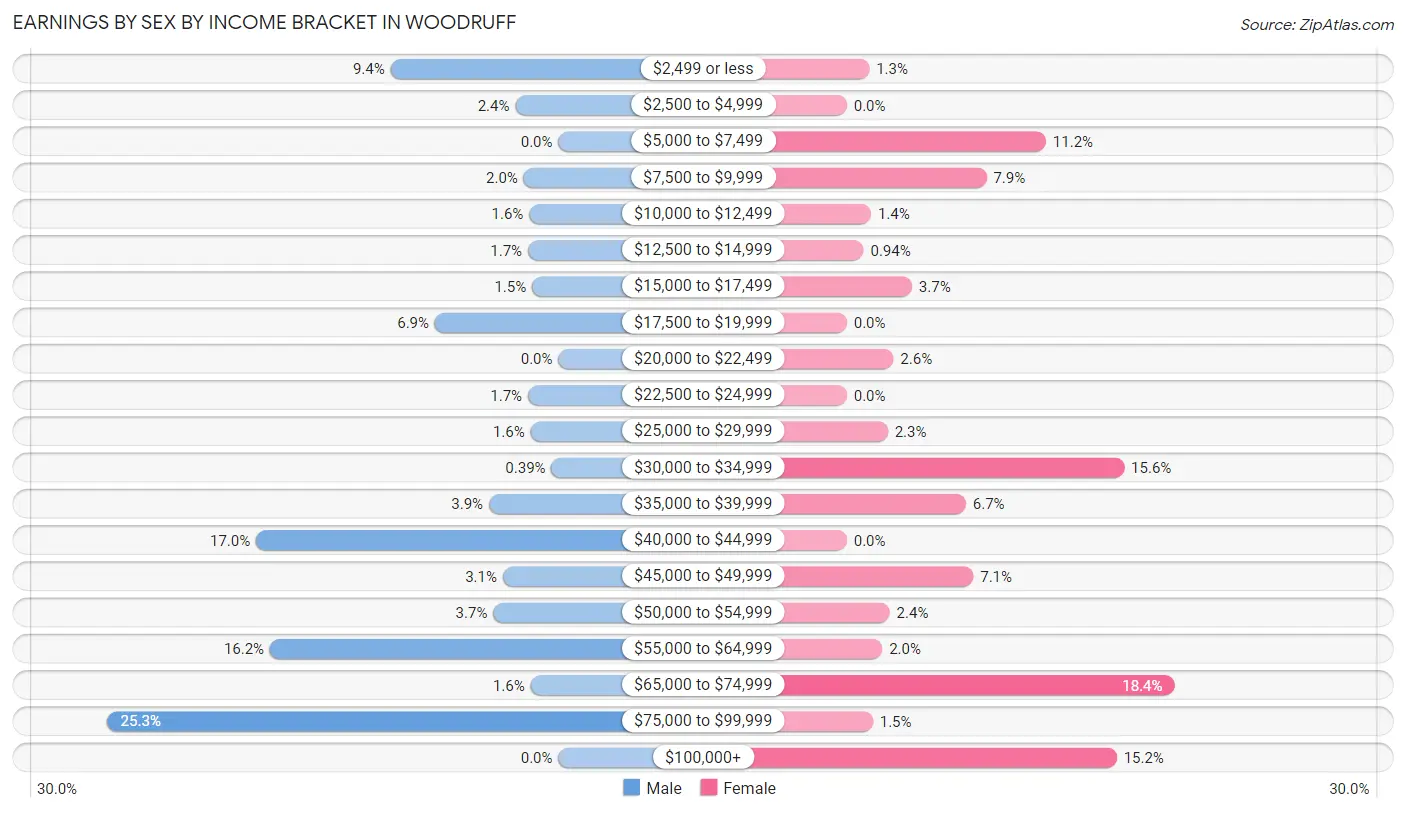
Earnings by Sex by Income Bracket in Woodruff
The most common earnings brackets in Woodruff are $75,000 to $99,999 for men (325 | 25.3%) and $65,000 to $74,999 for women (176 | 18.4%).
| Income | Male | Female |
| $2,499 or less | 121 (9.4%) | 12 (1.3%) |
| $2,500 to $4,999 | 31 (2.4%) | 0 (0.0%) |
| $5,000 to $7,499 | 0 (0.0%) | 107 (11.2%) |
| $7,500 to $9,999 | 25 (1.9%) | 75 (7.9%) |
| $10,000 to $12,499 | 21 (1.6%) | 13 (1.4%) |
| $12,500 to $14,999 | 22 (1.7%) | 9 (0.9%) |
| $15,000 to $17,499 | 19 (1.5%) | 35 (3.7%) |
| $17,500 to $19,999 | 89 (6.9%) | 0 (0.0%) |
| $20,000 to $22,499 | 0 (0.0%) | 25 (2.6%) |
| $22,500 to $24,999 | 22 (1.7%) | 0 (0.0%) |
| $25,000 to $29,999 | 20 (1.6%) | 22 (2.3%) |
| $30,000 to $34,999 | 5 (0.4%) | 149 (15.6%) |
| $35,000 to $39,999 | 50 (3.9%) | 64 (6.7%) |
| $40,000 to $44,999 | 218 (17.0%) | 0 (0.0%) |
| $45,000 to $49,999 | 40 (3.1%) | 68 (7.1%) |
| $50,000 to $54,999 | 47 (3.7%) | 23 (2.4%) |
| $55,000 to $64,999 | 208 (16.2%) | 19 (2.0%) |
| $65,000 to $74,999 | 20 (1.6%) | 176 (18.4%) |
| $75,000 to $99,999 | 325 (25.3%) | 14 (1.5%) |
| $100,000+ | 0 (0.0%) | 145 (15.2%) |
| Total | 1,283 (100.0%) | 956 (100.0%) |
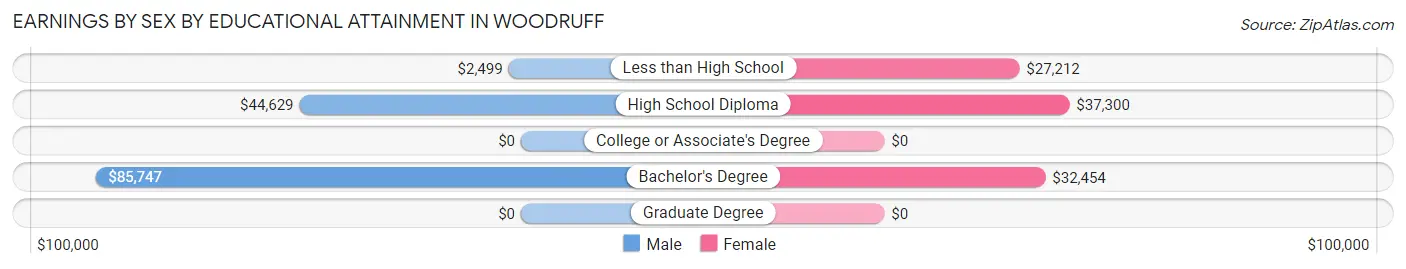
Earnings by Sex by Educational Attainment in Woodruff
Average earnings in Woodruff are $59,375 for men and $46,471 for women, a difference of 21.7%. Men with an educational attainment of bachelor's degree enjoy the highest average annual earnings of $85,747, while those with less than high school education earn the least with $2,499. Women with an educational attainment of high school diploma earn the most with the average annual earnings of $37,300, while those with less than high school education have the smallest earnings of $27,212.
| Educational Attainment | Male Income | Female Income |
| Less than High School | $2,499 | $27,212 |
| High School Diploma | $44,629 | $37,300 |
| College or Associate's Degree | - | - |
| Bachelor's Degree | $85,747 | $32,454 |
| Graduate Degree | - | - |
| Total | $59,375 | $46,471 |
Family Income in Woodruff
Family Income Brackets in Woodruff
According to the Woodruff family income data, there are 228 families falling into the $75,000 to $99,999 income range, which is the most common income bracket and makes up 25.6% of all families.
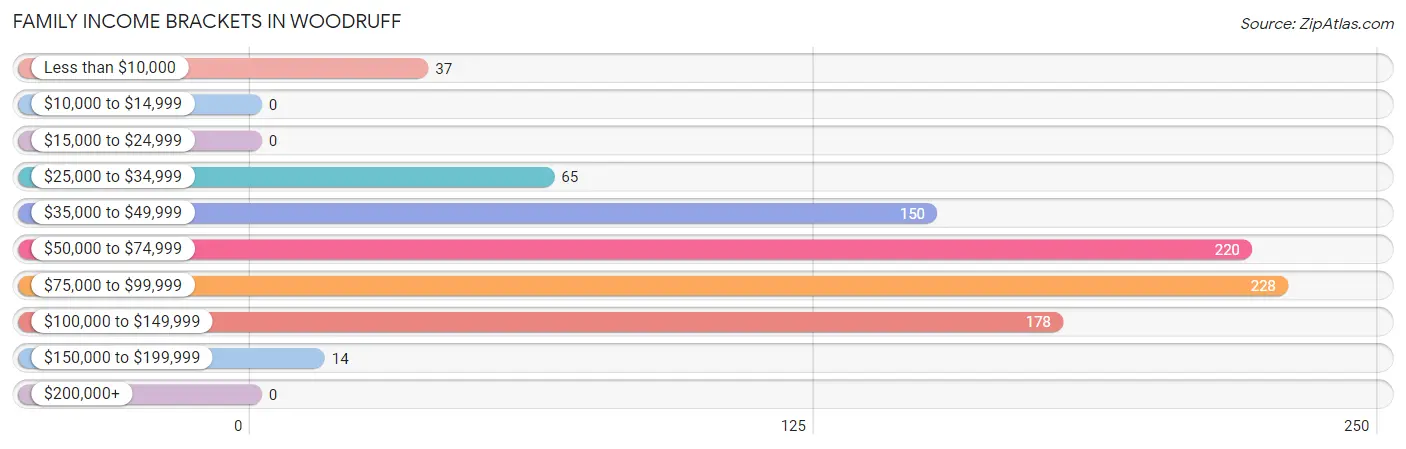
| Income Bracket | # Families | % Families |
| Less than $10,000 | 37 | 4.1% |
| $10,000 to $14,999 | 0 | 0.0% |
| $15,000 to $24,999 | 0 | 0.0% |
| $25,000 to $34,999 | 65 | 7.3% |
| $35,000 to $49,999 | 150 | 16.8% |
| $50,000 to $74,999 | 220 | 24.7% |
| $75,000 to $99,999 | 228 | 25.6% |
| $100,000 to $149,999 | 178 | 20.0% |
| $150,000 to $199,999 | 14 | 1.6% |
| $200,000+ | 0 | 0.0% |
Family Income by Famaliy Size in Woodruff
4-person families (165 | 18.5%) account for the highest median family income in Woodruff with $121,042 per family, while 2-person families (454 | 50.9%) have the highest median income of $33,774 per family member.
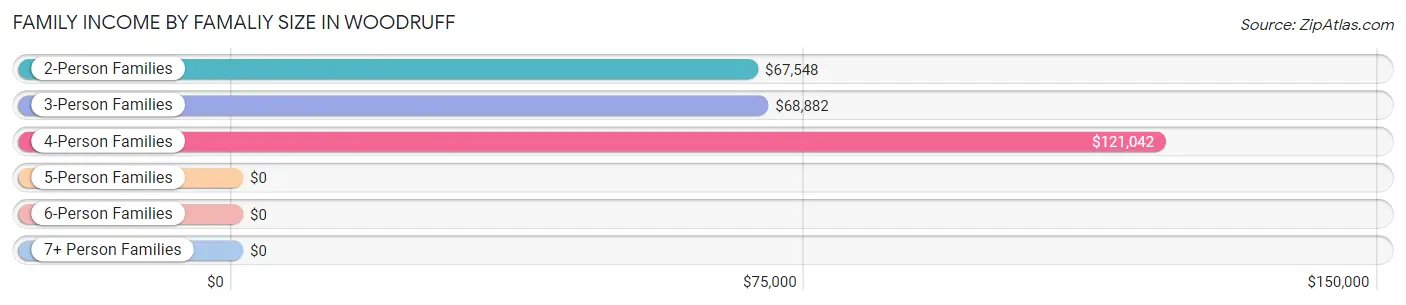
| Income Bracket | # Families | Median Income |
| 2-Person Families | 454 (50.9%) | $67,548 |
| 3-Person Families | 187 (21.0%) | $68,882 |
| 4-Person Families | 165 (18.5%) | $121,042 |
| 5-Person Families | 15 (1.7%) | $0 |
| 6-Person Families | 71 (8.0%) | $0 |
| 7+ Person Families | 0 (0.0%) | $0 |
| Total | 892 (100.0%) | $71,212 |
Family Income by Number of Earners in Woodruff
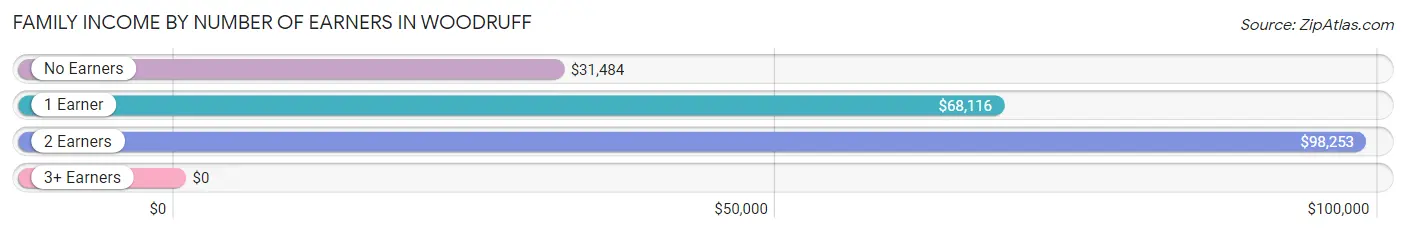
| Number of Earners | # Families | Median Income |
| No Earners | 39 (4.4%) | $31,484 |
| 1 Earner | 499 (55.9%) | $68,116 |
| 2 Earners | 305 (34.2%) | $98,253 |
| 3+ Earners | 49 (5.5%) | $0 |
| Total | 892 (100.0%) | $71,212 |
Household Income in Woodruff
Household Income Brackets in Woodruff
With 530 households falling in the category, the $75,000 to $99,999 income range is the most frequent in Woodruff, accounting for 30.8% of all households.
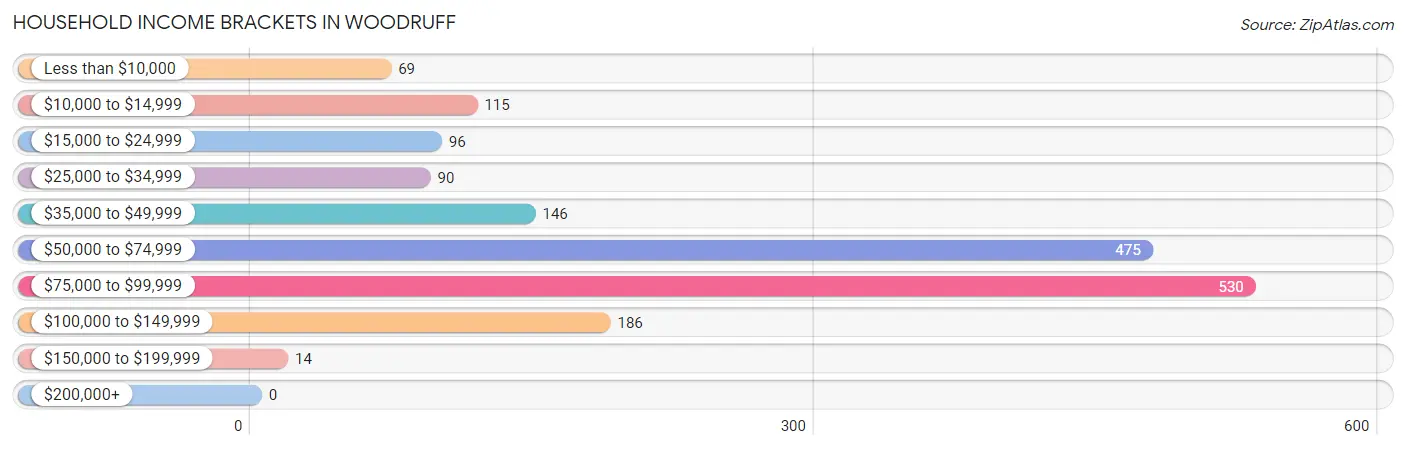
| Income Bracket | # Households | % Households |
| Less than $10,000 | 69 | 4.0% |
| $10,000 to $14,999 | 115 | 6.7% |
| $15,000 to $24,999 | 96 | 5.6% |
| $25,000 to $34,999 | 90 | 5.2% |
| $35,000 to $49,999 | 146 | 8.5% |
| $50,000 to $74,999 | 475 | 27.6% |
| $75,000 to $99,999 | 530 | 30.8% |
| $100,000 to $149,999 | 186 | 10.8% |
| $150,000 to $199,999 | 14 | 0.8% |
| $200,000+ | 0 | 0.0% |
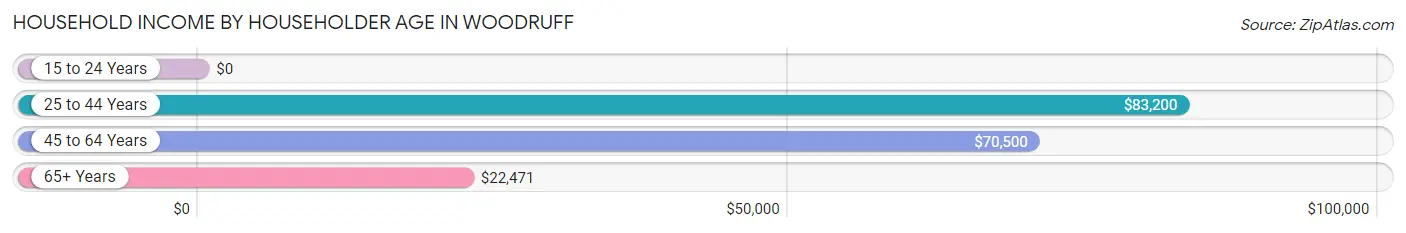
Household Income by Householder Age in Woodruff
The median household income in Woodruff is $68,451, with the highest median household income of $83,200 found in the 25 to 44 years age bracket for the primary householder. A total of 617 households (35.8%) fall into this category. Meanwhile, the 15 to 24 years age bracket for the primary householder has the lowest median household income of $0, with 102 households (5.9%) in this group.
| Income Bracket | # Households | Median Income |
| 15 to 24 Years | 102 (5.9%) | $0 |
| 25 to 44 Years | 617 (35.8%) | $83,200 |
| 45 to 64 Years | 690 (40.1%) | $70,500 |
| 65+ Years | 313 (18.2%) | $22,471 |
| Total | 1,722 (100.0%) | $68,451 |
Poverty in Woodruff
Income Below Poverty by Sex and Age in Woodruff
With 10.1% poverty level for males and 15.2% for females among the residents of Woodruff, 16 and 17 year old males and 18 to 24 year old females are the most vulnerable to poverty, with 25 males (22.1%) and 89 females (61.0%) in their respective age groups living below the poverty level.
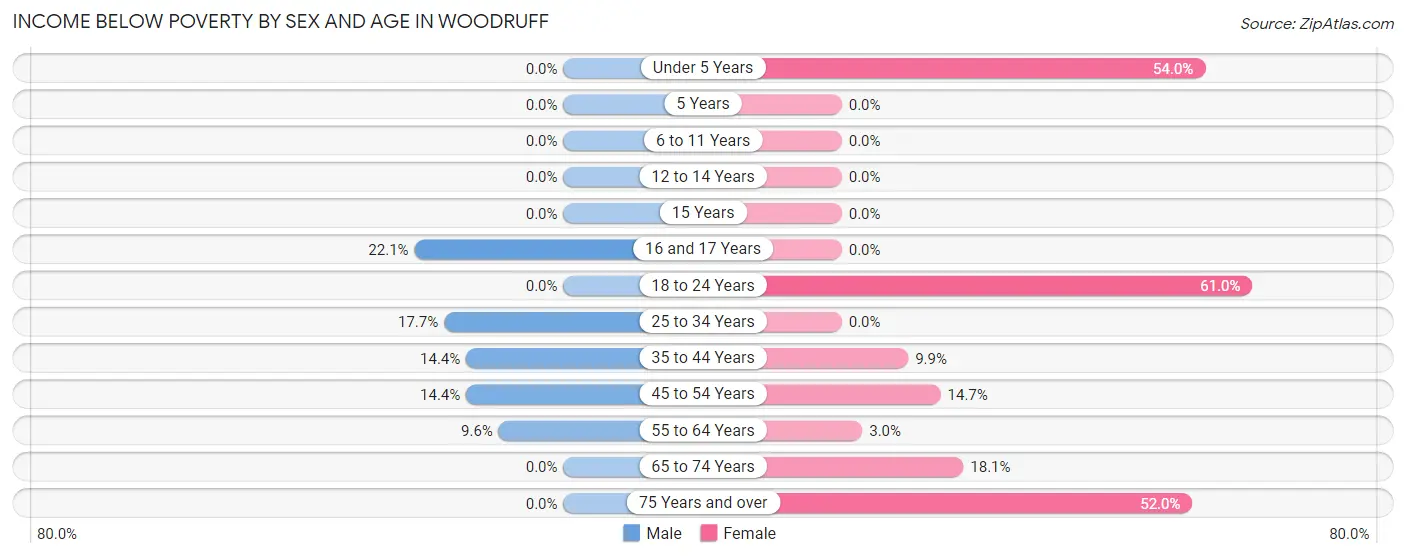
| Age Bracket | Male | Female |
| Under 5 Years | 0 (0.0%) | 41 (53.9%) |
| 5 Years | 0 (0.0%) | 0 (0.0%) |
| 6 to 11 Years | 0 (0.0%) | 0 (0.0%) |
| 12 to 14 Years | 0 (0.0%) | 0 (0.0%) |
| 15 Years | 0 (0.0%) | 0 (0.0%) |
| 16 and 17 Years | 25 (22.1%) | 0 (0.0%) |
| 18 to 24 Years | 0 (0.0%) | 89 (61.0%) |
| 25 to 34 Years | 70 (17.7%) | 0 (0.0%) |
| 35 to 44 Years | 82 (14.4%) | 14 (9.9%) |
| 45 to 54 Years | 26 (14.4%) | 49 (14.7%) |
| 55 to 64 Years | 19 (9.6%) | 9 (3.0%) |
| 65 to 74 Years | 0 (0.0%) | 37 (18.0%) |
| 75 Years and over | 0 (0.0%) | 51 (52.0%) |
| Total | 222 (10.1%) | 290 (15.2%) |
Income Above Poverty by Sex and Age in Woodruff
According to the poverty statistics in Woodruff, males aged under 5 years and females aged 5 years are the age groups that are most secure financially, with 100.0% of males and 100.0% of females in these age groups living above the poverty line.
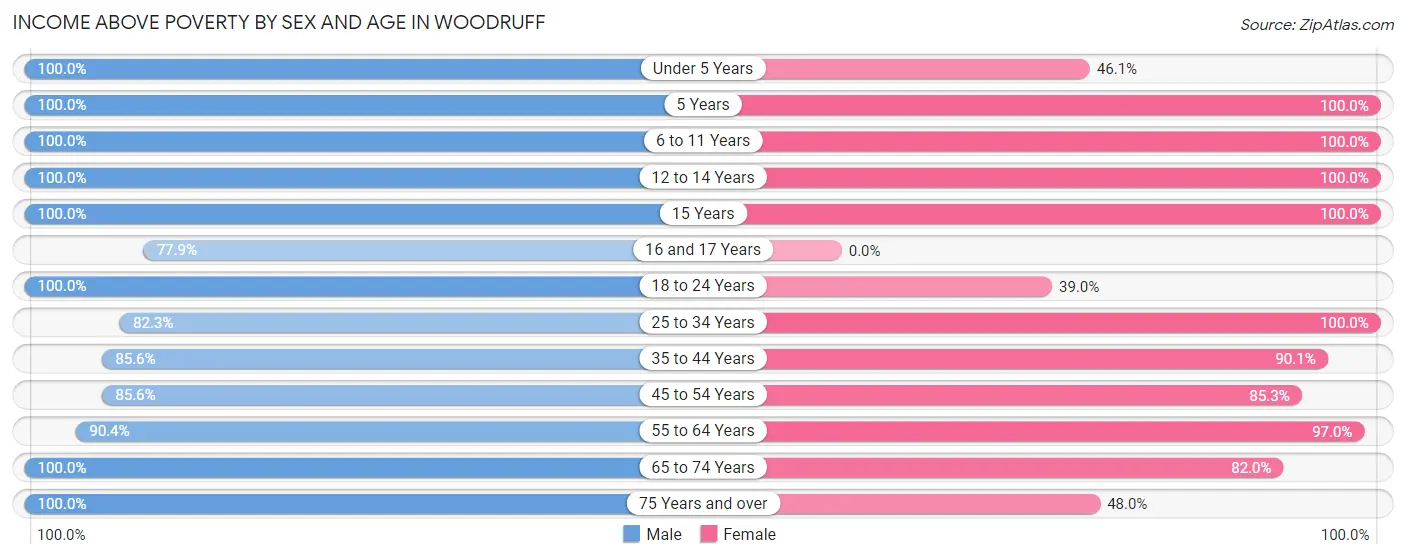
| Age Bracket | Male | Female |
| Under 5 Years | 137 (100.0%) | 35 (46.1%) |
| 5 Years | 88 (100.0%) | 44 (100.0%) |
| 6 to 11 Years | 79 (100.0%) | 196 (100.0%) |
| 12 to 14 Years | 28 (100.0%) | 14 (100.0%) |
| 15 Years | 19 (100.0%) | 22 (100.0%) |
| 16 and 17 Years | 88 (77.9%) | 0 (0.0%) |
| 18 to 24 Years | 291 (100.0%) | 57 (39.0%) |
| 25 to 34 Years | 325 (82.3%) | 339 (100.0%) |
| 35 to 44 Years | 486 (85.6%) | 128 (90.1%) |
| 45 to 54 Years | 154 (85.6%) | 285 (85.3%) |
| 55 to 64 Years | 179 (90.4%) | 287 (97.0%) |
| 65 to 74 Years | 61 (100.0%) | 168 (82.0%) |
| 75 Years and over | 39 (100.0%) | 47 (48.0%) |
| Total | 1,974 (89.9%) | 1,622 (84.8%) |
Income Below Poverty Among Married-Couple Families in Woodruff
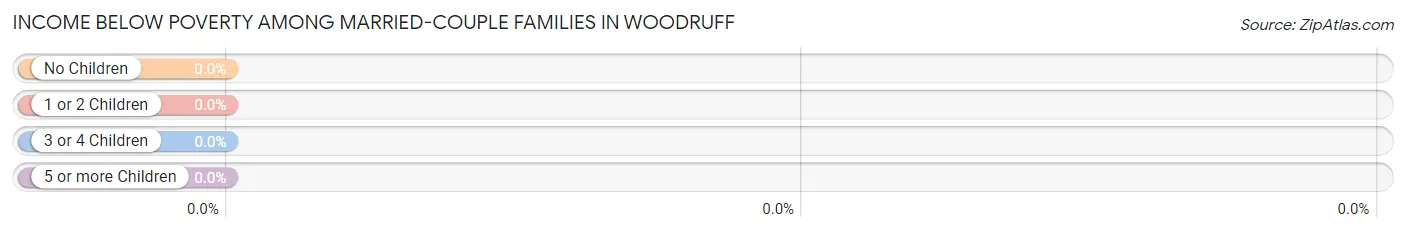
| Children | Above Poverty | Below Poverty |
| No Children | 160 (100.0%) | 0 (0.0%) |
| 1 or 2 Children | 91 (100.0%) | 0 (0.0%) |
| 3 or 4 Children | 86 (100.0%) | 0 (0.0%) |
| 5 or more Children | 0 (0.0%) | 0 (0.0%) |
| Total | 337 (100.0%) | 0 (0.0%) |
Income Below Poverty Among Single-Parent Households in Woodruff
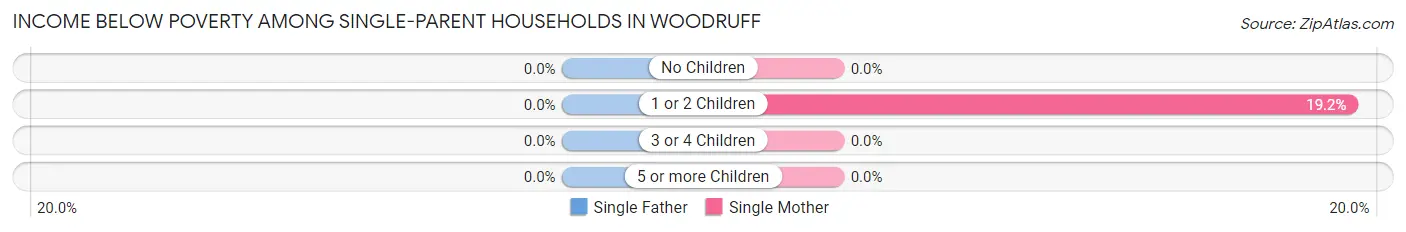
| Children | Single Father | Single Mother |
| No Children | 0 (0.0%) | 0 (0.0%) |
| 1 or 2 Children | 0 (0.0%) | 37 (19.2%) |
| 3 or 4 Children | 0 (0.0%) | 0 (0.0%) |
| 5 or more Children | 0 (0.0%) | 0 (0.0%) |
| Total | 0 (0.0%) | 37 (8.2%) |
Income Below Poverty Among Married-Couple vs Single-Parent Households in Woodruff
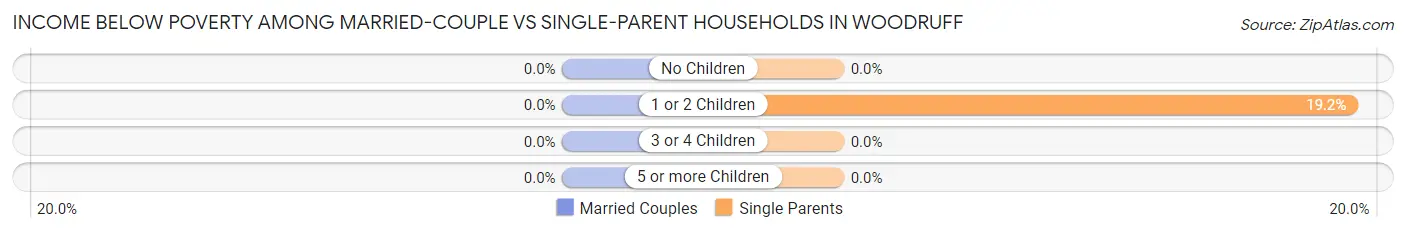
| Children | Married-Couple Families | Single-Parent Households |
| No Children | 0 (0.0%) | 0 (0.0%) |
| 1 or 2 Children | 0 (0.0%) | 37 (19.2%) |
| 3 or 4 Children | 0 (0.0%) | 0 (0.0%) |
| 5 or more Children | 0 (0.0%) | 0 (0.0%) |
| Total | 0 (0.0%) | 37 (6.7%) |
Race in Woodruff
The most populous races in Woodruff are White / Caucasian (2,923 | 68.6%), Black / African American (1,066 | 25.0%), and Some other Race (201 | 4.7%).
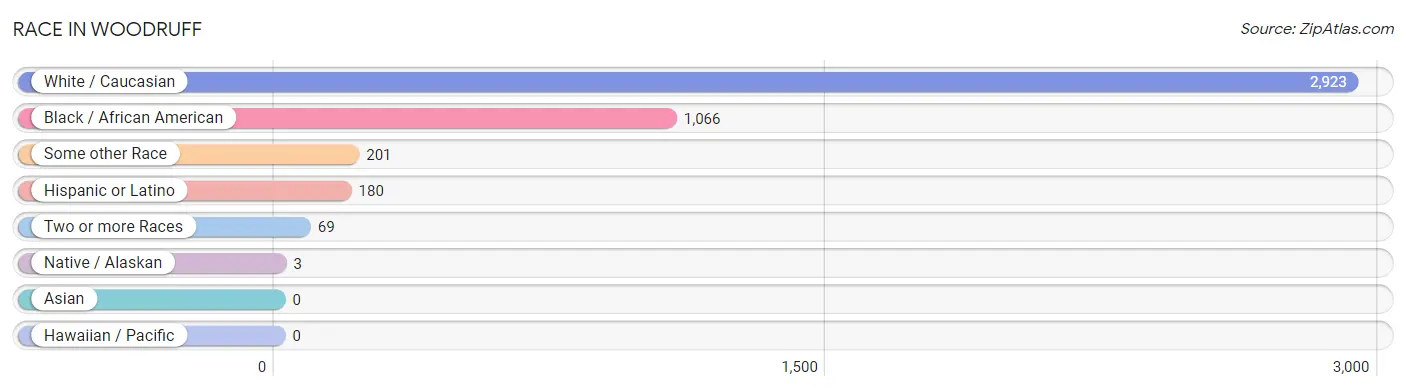
| Race | # Population | % Population |
| Asian | 0 | 0.0% |
| Black / African American | 1,066 | 25.0% |
| Hawaiian / Pacific | 0 | 0.0% |
| Hispanic or Latino | 180 | 4.2% |
| Native / Alaskan | 3 | 0.1% |
| White / Caucasian | 2,923 | 68.6% |
| Two or more Races | 69 | 1.6% |
| Some other Race | 201 | 4.7% |
| Total | 4,262 | 100.0% |
Ancestry in Woodruff
The most populous ancestries reported in Woodruff are German (697 | 16.4%), Irish (469 | 11.0%), English (195 | 4.6%), American (166 | 3.9%), and Central American (121 | 2.8%), together accounting for 38.7% of all Woodruff residents.
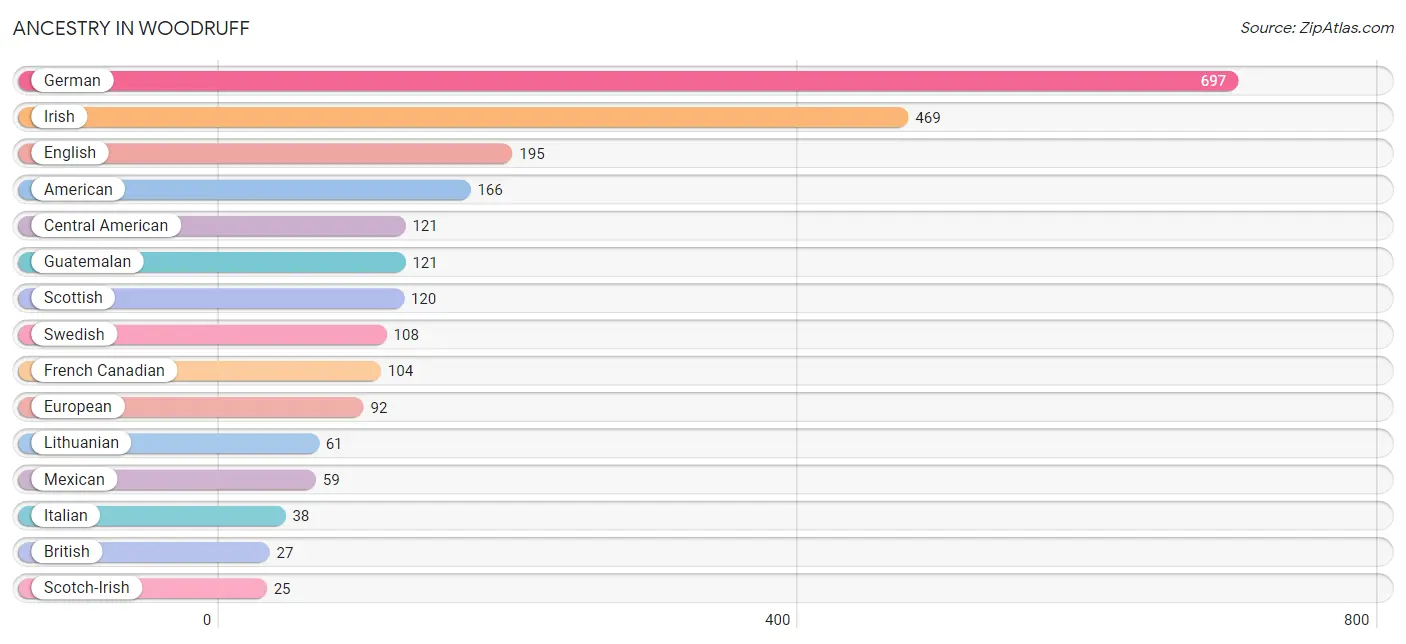
| Ancestry | # Population | % Population |
| African | 20 | 0.5% |
| American | 166 | 3.9% |
| British | 27 | 0.6% |
| Central American | 121 | 2.8% |
| Eastern European | 16 | 0.4% |
| English | 195 | 4.6% |
| European | 92 | 2.2% |
| French | 13 | 0.3% |
| French Canadian | 104 | 2.4% |
| German | 697 | 16.4% |
| Guatemalan | 121 | 2.8% |
| Irish | 469 | 11.0% |
| Italian | 38 | 0.9% |
| Lithuanian | 61 | 1.4% |
| Mexican | 59 | 1.4% |
| Scotch-Irish | 25 | 0.6% |
| Scottish | 120 | 2.8% |
| Subsaharan African | 20 | 0.5% |
| Swedish | 108 | 2.5% | View All 19 Rows |
Immigrants in Woodruff
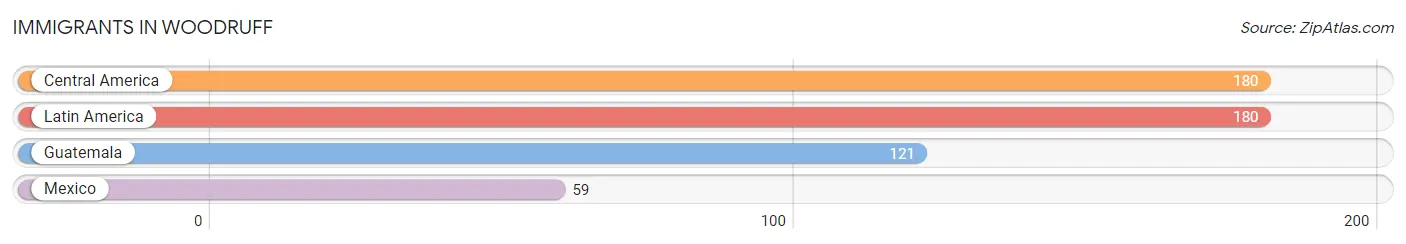
The most numerous immigrant groups reported in Woodruff came from Central America (180 | 4.2%), Latin America (180 | 4.2%), Guatemala (121 | 2.8%), and Mexico (59 | 1.4%), together accounting for 12.7% of all Woodruff residents.
| Immigration Origin | # Population | % Population |
| Central America | 180 | 4.2% |
| Guatemala | 121 | 2.8% |
| Latin America | 180 | 4.2% |
| Mexico | 59 | 1.4% | View All 4 Rows |
Sex and Age in Woodruff
Sex and Age in Woodruff
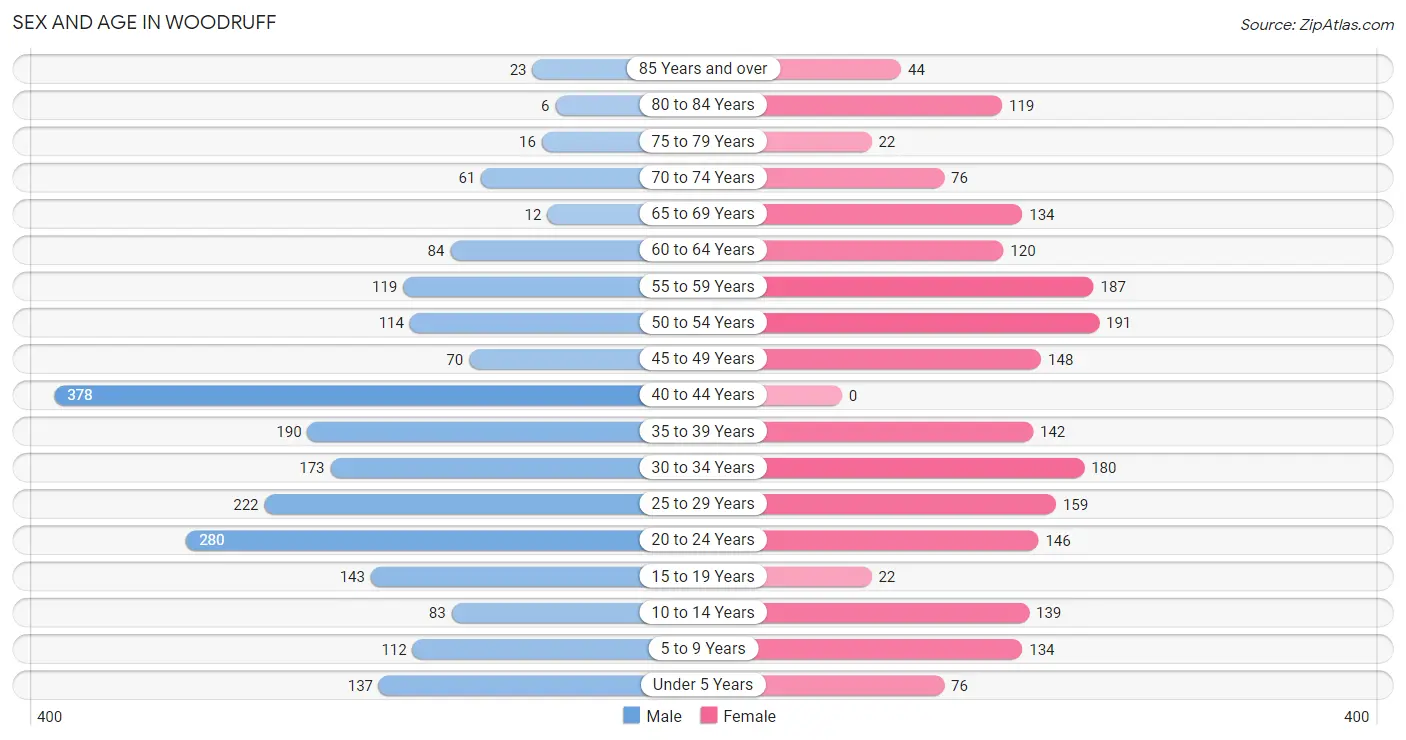
The most populous age groups in Woodruff are 40 to 44 Years (378 | 17.0%) for men and 50 to 54 Years (191 | 9.4%) for women.
| Age Bracket | Male | Female |
| Under 5 Years | 137 (6.2%) | 76 (3.7%) |
| 5 to 9 Years | 112 (5.0%) | 134 (6.6%) |
| 10 to 14 Years | 83 (3.7%) | 139 (6.8%) |
| 15 to 19 Years | 143 (6.4%) | 22 (1.1%) |
| 20 to 24 Years | 280 (12.6%) | 146 (7.2%) |
| 25 to 29 Years | 222 (10.0%) | 159 (7.8%) |
| 30 to 34 Years | 173 (7.8%) | 180 (8.8%) |
| 35 to 39 Years | 190 (8.6%) | 142 (7.0%) |
| 40 to 44 Years | 378 (17.0%) | 0 (0.0%) |
| 45 to 49 Years | 70 (3.2%) | 148 (7.3%) |
| 50 to 54 Years | 114 (5.1%) | 191 (9.4%) |
| 55 to 59 Years | 119 (5.3%) | 187 (9.2%) |
| 60 to 64 Years | 84 (3.8%) | 120 (5.9%) |
| 65 to 69 Years | 12 (0.5%) | 134 (6.6%) |
| 70 to 74 Years | 61 (2.7%) | 76 (3.7%) |
| 75 to 79 Years | 16 (0.7%) | 22 (1.1%) |
| 80 to 84 Years | 6 (0.3%) | 119 (5.8%) |
| 85 Years and over | 23 (1.0%) | 44 (2.2%) |
| Total | 2,223 (100.0%) | 2,039 (100.0%) |
Families and Households in Woodruff
Median Family Size in Woodruff
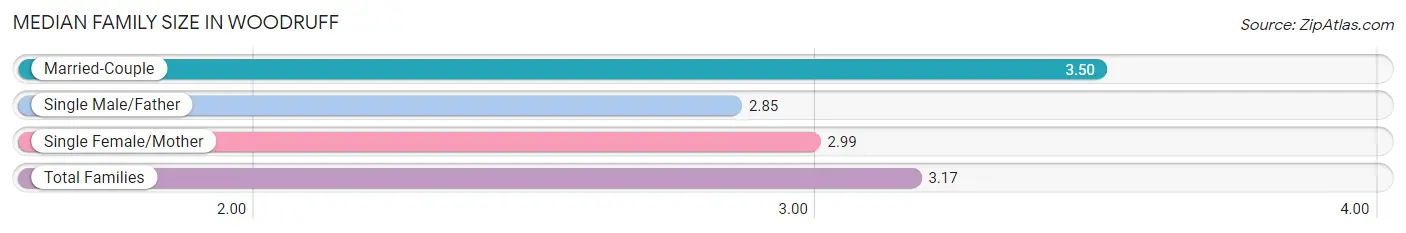
The median family size in Woodruff is 3.17 persons per family, with married-couple families (337 | 37.8%) accounting for the largest median family size of 3.5 persons per family. On the other hand, single male/father families (102 | 11.4%) represent the smallest median family size with 2.85 persons per family.
| Family Type | # Families | Family Size |
| Married-Couple | 337 (37.8%) | 3.50 |
| Single Male/Father | 102 (11.4%) | 2.85 |
| Single Female/Mother | 453 (50.8%) | 2.99 |
| Total Families | 892 (100.0%) | 3.17 |
Median Household Size in Woodruff
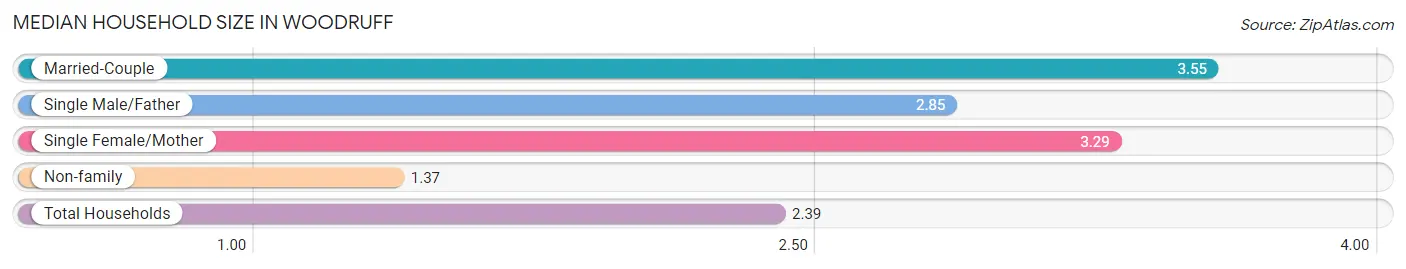
The median household size in Woodruff is 2.39 persons per household, with married-couple households (337 | 19.6%) accounting for the largest median household size of 3.55 persons per household. non-family households (830 | 48.2%) represent the smallest median household size with 1.37 persons per household.
| Household Type | # Households | Household Size |
| Married-Couple | 337 (19.6%) | 3.55 |
| Single Male/Father | 102 (5.9%) | 2.85 |
| Single Female/Mother | 453 (26.3%) | 3.29 |
| Non-family | 830 (48.2%) | 1.37 |
| Total Households | 1,722 (100.0%) | 2.39 |
Household Size by Marriage Status in Woodruff
Out of a total of 1,722 households in Woodruff, 892 (51.8%) are family households, while 830 (48.2%) are nonfamily households. The most numerous type of family households are 2-person households, comprising 393, and the most common type of nonfamily households are 1-person households, comprising 632.
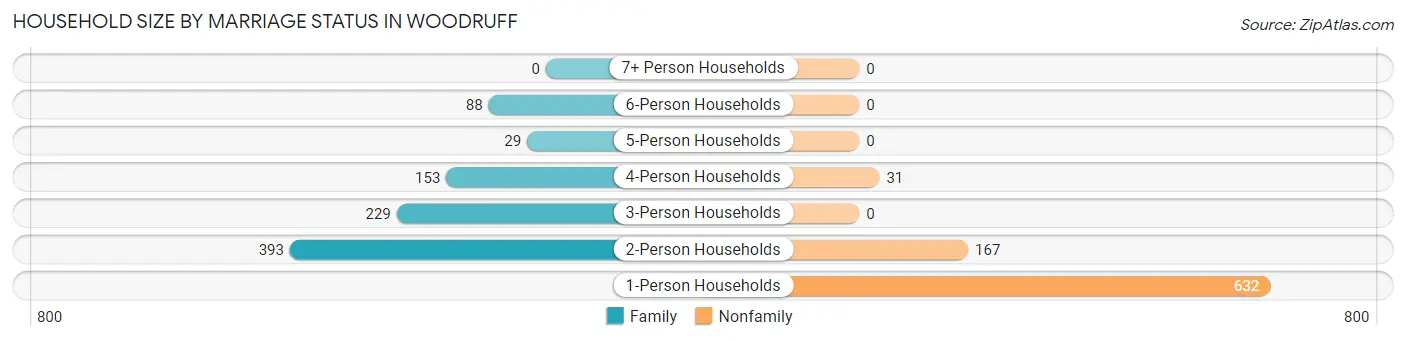
| Household Size | Family Households | Nonfamily Households |
| 1-Person Households | - | 632 (36.7%) |
| 2-Person Households | 393 (22.8%) | 167 (9.7%) |
| 3-Person Households | 229 (13.3%) | 0 (0.0%) |
| 4-Person Households | 153 (8.9%) | 31 (1.8%) |
| 5-Person Households | 29 (1.7%) | 0 (0.0%) |
| 6-Person Households | 88 (5.1%) | 0 (0.0%) |
| 7+ Person Households | 0 (0.0%) | 0 (0.0%) |
| Total | 892 (51.8%) | 830 (48.2%) |
Female Fertility in Woodruff
Fertility by Age in Woodruff
Average fertility rate in Woodruff is 16.0 births per 1,000 women. Women in the age bracket of 20 to 34 years have the highest fertility rate with 27.0 births per 1,000 women. Women in the age bracket of 20 to 34 years acount for 100.0% of all women with births.
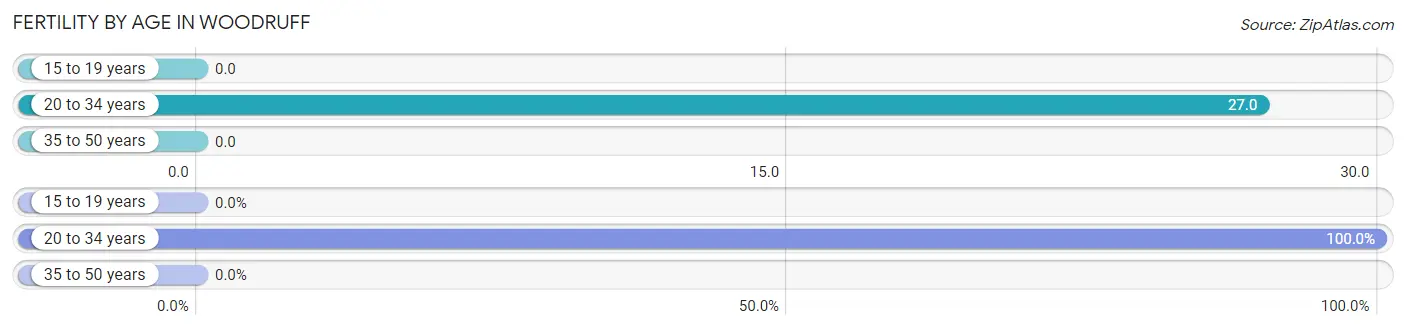
| Age Bracket | Women with Births | Births / 1,000 Women |
| 15 to 19 years | 0 (0.0%) | 0.0 |
| 20 to 34 years | 13 (100.0%) | 27.0 |
| 35 to 50 years | 0 (0.0%) | 0.0 |
| Total | 13 (100.0%) | 16.0 |
Fertility by Age by Marriage Status in Woodruff
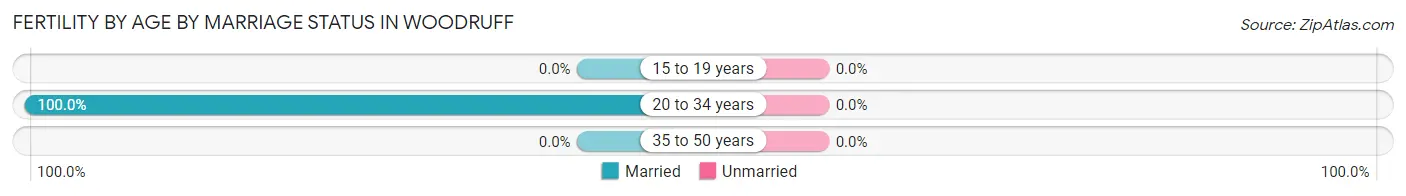
| Age Bracket | Married | Unmarried |
| 15 to 19 years | 0 (0.0%) | 0 (0.0%) |
| 20 to 34 years | 13 (100.0%) | 0 (0.0%) |
| 35 to 50 years | 0 (0.0%) | 0 (0.0%) |
| Total | 13 (100.0%) | 0 (0.0%) |
Fertility by Education in Woodruff
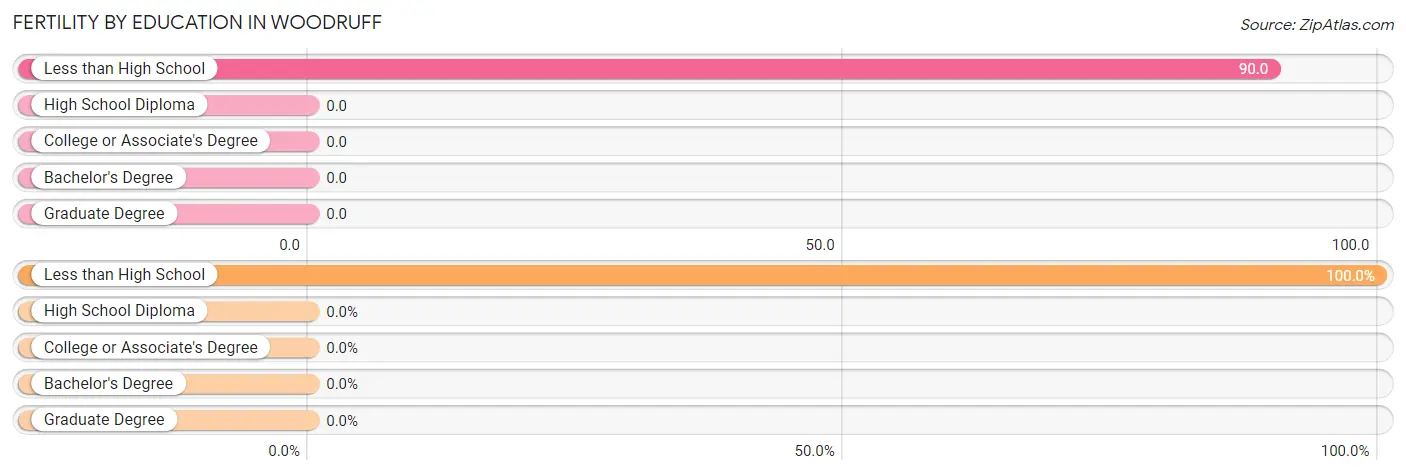
| Educational Attainment | Women with Births | Births / 1,000 Women |
| Less than High School | 13 (100.0%) | 90.0 |
| High School Diploma | 0 (0.0%) | 0.0 |
| College or Associate's Degree | 0 (0.0%) | 0.0 |
| Bachelor's Degree | 0 (0.0%) | 0.0 |
| Graduate Degree | 0 (0.0%) | 0.0 |
| Total | 13 (100.0%) | 16.0 |
Fertility by Education by Marriage Status in Woodruff
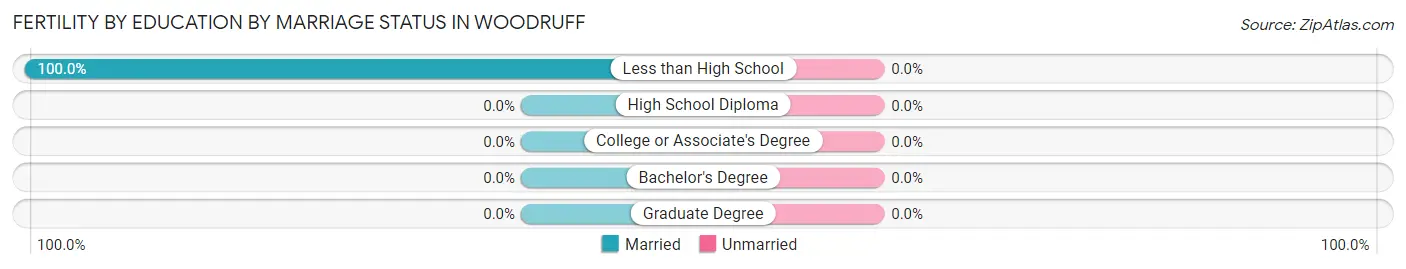
| Educational Attainment | Married | Unmarried |
| Less than High School | 13 (100.0%) | 0 (0.0%) |
| High School Diploma | 0 (0.0%) | 0 (0.0%) |
| College or Associate's Degree | 0 (0.0%) | 0 (0.0%) |
| Bachelor's Degree | 0 (0.0%) | 0 (0.0%) |
| Graduate Degree | 0 (0.0%) | 0 (0.0%) |
| Total | 13 (100.0%) | 0 (0.0%) |
Employment Characteristics in Woodruff
Employment by Class of Employer in Woodruff
Among the 2,157 employed individuals in Woodruff, private company employees (1,709 | 79.2%), local government employees (110 | 5.1%), and self-employed (not incorporated) (108 | 5.0%) make up the most common classes of employment.
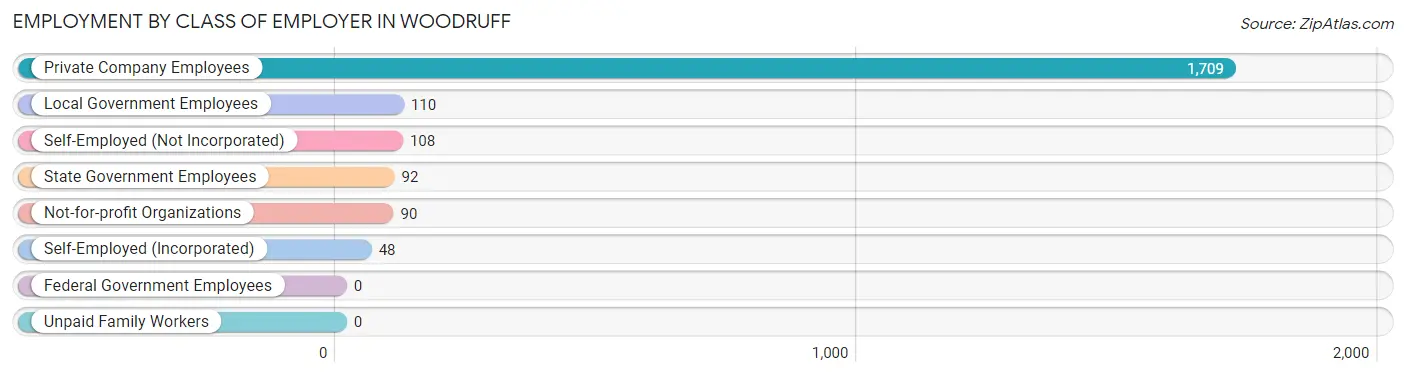
| Employer Class | # Employees | % Employees |
| Private Company Employees | 1,709 | 79.2% |
| Self-Employed (Incorporated) | 48 | 2.2% |
| Self-Employed (Not Incorporated) | 108 | 5.0% |
| Not-for-profit Organizations | 90 | 4.2% |
| Local Government Employees | 110 | 5.1% |
| State Government Employees | 92 | 4.3% |
| Federal Government Employees | 0 | 0.0% |
| Unpaid Family Workers | 0 | 0.0% |
| Total | 2,157 | 100.0% |
Employment Status by Age in Woodruff
According to the labor force statistics for Woodruff, out of the total population over 16 years of age (3,540), 65.0% or 2,301 individuals are in the labor force, with 6.3% or 145 of them unemployed. The age group with the highest labor force participation rate is 35 to 44 years, with 96.6% or 686 individuals in the labor force. Within the labor force, the 30 to 34 years age range has the highest percentage of unemployed individuals, with 31.2% or 97 of them being unemployed.
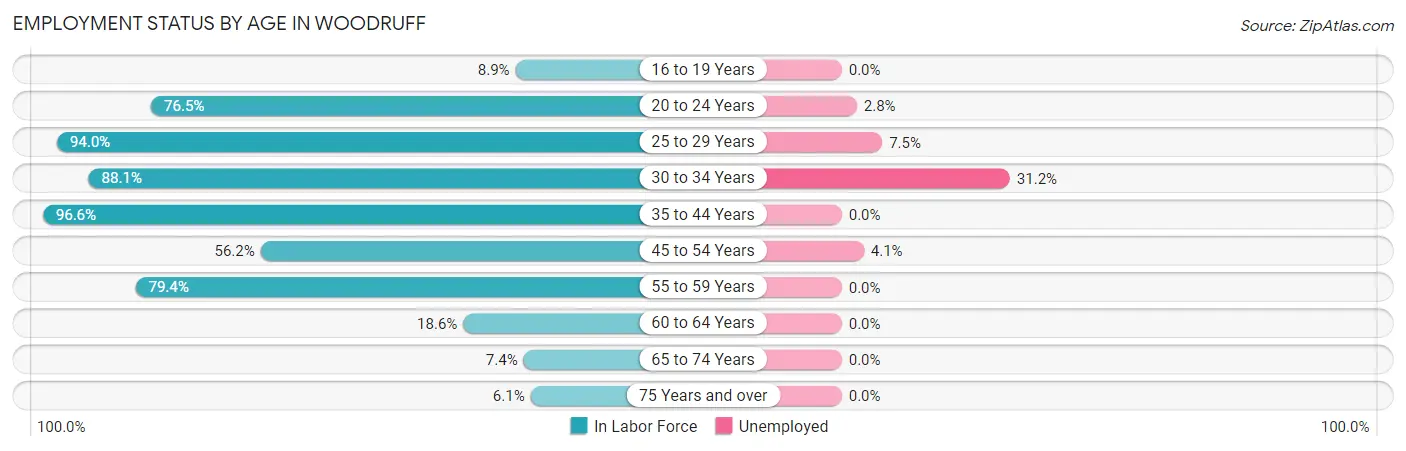
| Age Bracket | In Labor Force | Unemployed |
| 16 to 19 Years | 11 (8.9%) | 0 (0.0%) |
| 20 to 24 Years | 326 (76.5%) | 9 (2.8%) |
| 25 to 29 Years | 358 (94.0%) | 27 (7.5%) |
| 30 to 34 Years | 311 (88.1%) | 97 (31.2%) |
| 35 to 44 Years | 686 (96.6%) | 0 (0.0%) |
| 45 to 54 Years | 294 (56.2%) | 12 (4.1%) |
| 55 to 59 Years | 243 (79.4%) | 0 (0.0%) |
| 60 to 64 Years | 38 (18.6%) | 0 (0.0%) |
| 65 to 74 Years | 21 (7.4%) | 0 (0.0%) |
| 75 Years and over | 14 (6.1%) | 0 (0.0%) |
| Total | 2,301 (65.0%) | 145 (6.3%) |
Employment Status by Educational Attainment in Woodruff
According to labor force statistics for Woodruff, 77.9% of individuals (1,930) out of the total population between 25 and 64 years of age (2,477) are in the labor force, with 7.0% or 135 of them being unemployed. The group with the highest labor force participation rate are those with the educational attainment of bachelor's degree or higher, with 100.0% or 523 individuals in the labor force. Within the labor force, individuals with high school diploma education have the highest percentage of unemployment, with 18.0% or 109 of them being unemployed.
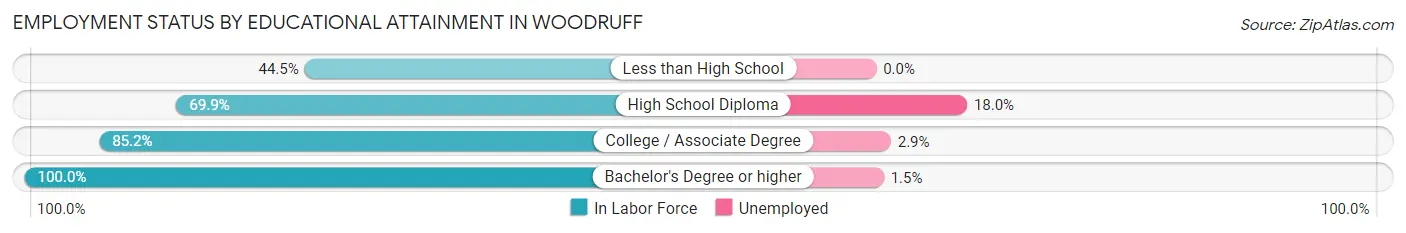
| Educational Attainment | In Labor Force | Unemployed |
| Less than High School | 137 (44.5%) | 0 (0.0%) |
| High School Diploma | 607 (69.9%) | 156 (18.0%) |
| College / Associate Degree | 663 (85.2%) | 23 (2.9%) |
| Bachelor's Degree or higher | 523 (100.0%) | 8 (1.5%) |
| Total | 1,930 (77.9%) | 173 (7.0%) |
Employment Occupations by Sex in Woodruff
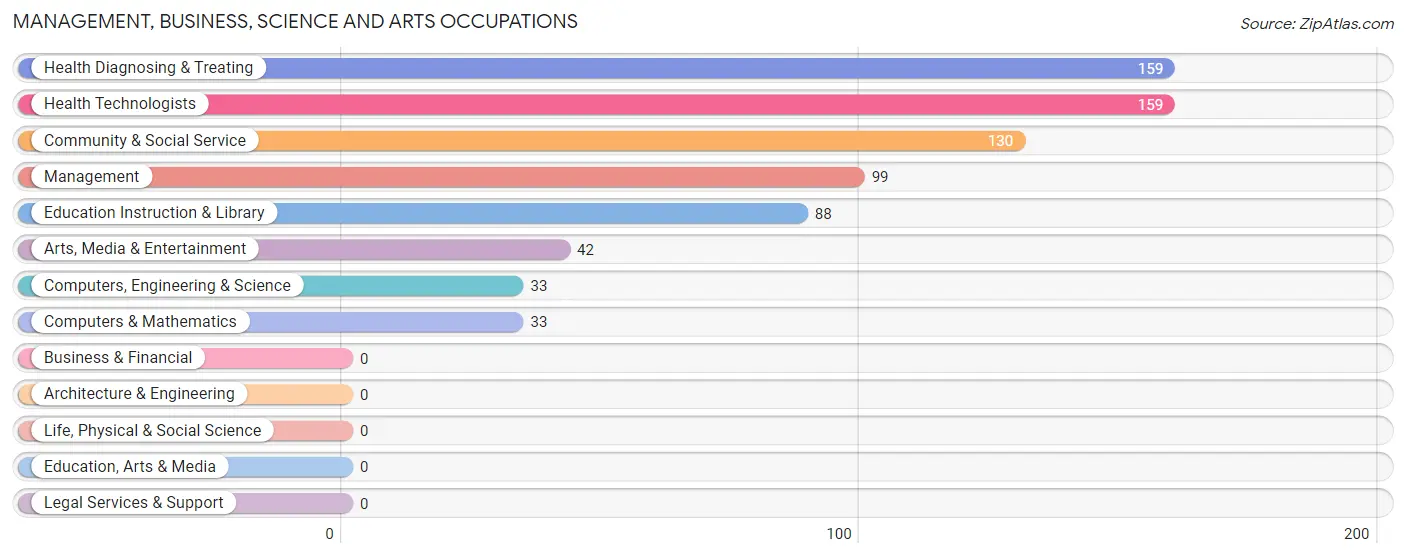
Management, Business, Science and Arts Occupations
The most common Management, Business, Science and Arts occupations in Woodruff are Health Diagnosing & Treating (159 | 7.4%), Health Technologists (159 | 7.4%), Community & Social Service (130 | 6.0%), Management (99 | 4.6%), and Education Instruction & Library (88 | 4.1%).
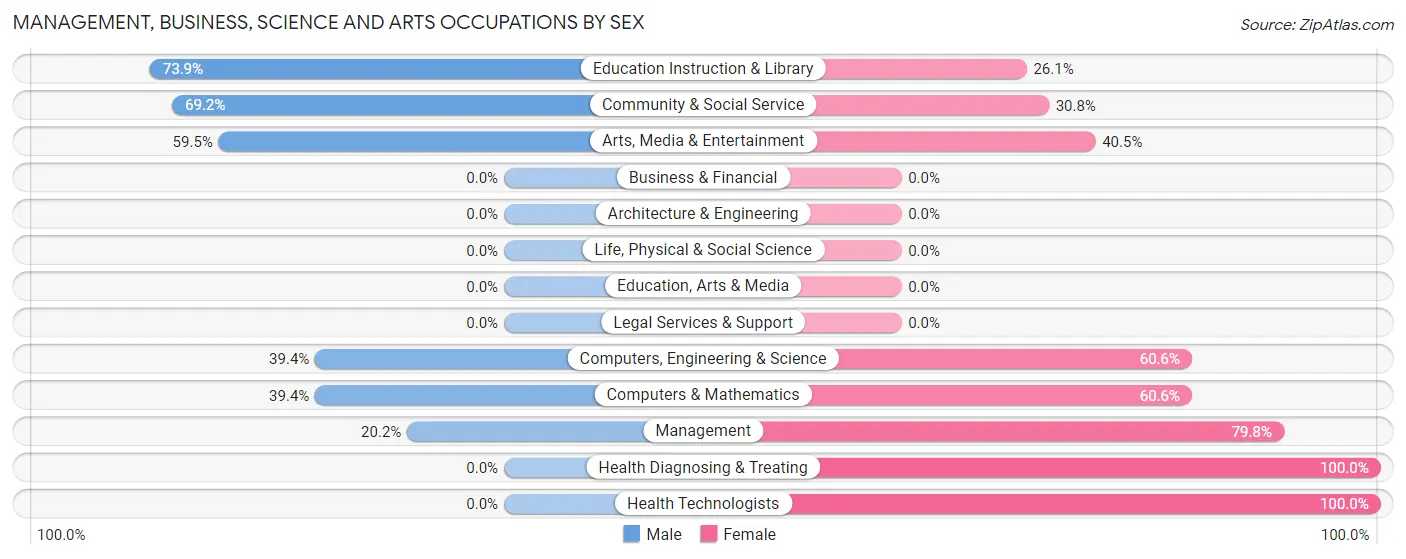
Management, Business, Science and Arts Occupations by Sex
Within the Management, Business, Science and Arts occupations in Woodruff, the most male-oriented occupations are Education Instruction & Library (73.9%), Community & Social Service (69.2%), and Arts, Media & Entertainment (59.5%), while the most female-oriented occupations are Health Diagnosing & Treating (100.0%), Health Technologists (100.0%), and Management (79.8%).
| Occupation | Male | Female |
| Management | 20 (20.2%) | 79 (79.8%) |
| Business & Financial | 0 (0.0%) | 0 (0.0%) |
| Computers, Engineering & Science | 13 (39.4%) | 20 (60.6%) |
| Computers & Mathematics | 13 (39.4%) | 20 (60.6%) |
| Architecture & Engineering | 0 (0.0%) | 0 (0.0%) |
| Life, Physical & Social Science | 0 (0.0%) | 0 (0.0%) |
| Community & Social Service | 90 (69.2%) | 40 (30.8%) |
| Education, Arts & Media | 0 (0.0%) | 0 (0.0%) |
| Legal Services & Support | 0 (0.0%) | 0 (0.0%) |
| Education Instruction & Library | 65 (73.9%) | 23 (26.1%) |
| Arts, Media & Entertainment | 25 (59.5%) | 17 (40.5%) |
| Health Diagnosing & Treating | 0 (0.0%) | 159 (100.0%) |
| Health Technologists | 0 (0.0%) | 159 (100.0%) |
| Total (Category) | 123 (29.2%) | 298 (70.8%) |
| Total (Overall) | 1,243 (57.6%) | 914 (42.4%) |
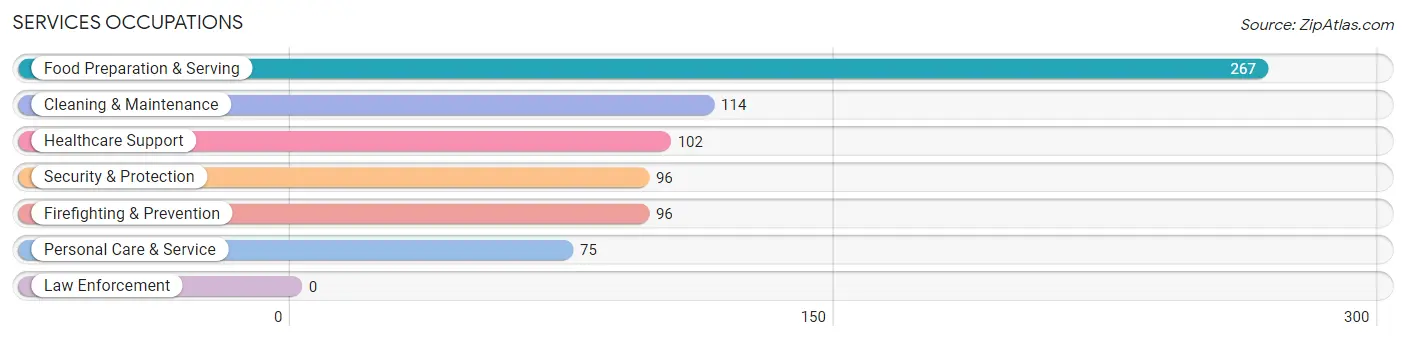
Services Occupations
The most common Services occupations in Woodruff are Food Preparation & Serving (267 | 12.4%), Cleaning & Maintenance (114 | 5.3%), Healthcare Support (102 | 4.7%), Security & Protection (96 | 4.4%), and Firefighting & Prevention (96 | 4.4%).
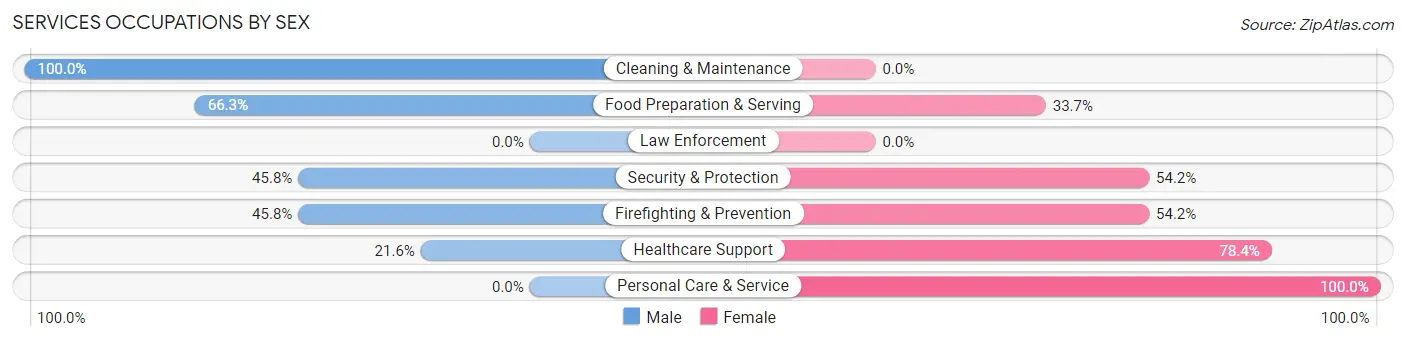
Services Occupations by Sex
Within the Services occupations in Woodruff, the most male-oriented occupations are Cleaning & Maintenance (100.0%), Food Preparation & Serving (66.3%), and Security & Protection (45.8%), while the most female-oriented occupations are Personal Care & Service (100.0%), Healthcare Support (78.4%), and Security & Protection (54.2%).
| Occupation | Male | Female |
| Healthcare Support | 22 (21.6%) | 80 (78.4%) |
| Security & Protection | 44 (45.8%) | 52 (54.2%) |
| Firefighting & Prevention | 44 (45.8%) | 52 (54.2%) |
| Law Enforcement | 0 (0.0%) | 0 (0.0%) |
| Food Preparation & Serving | 177 (66.3%) | 90 (33.7%) |
| Cleaning & Maintenance | 114 (100.0%) | 0 (0.0%) |
| Personal Care & Service | 0 (0.0%) | 75 (100.0%) |
| Total (Category) | 357 (54.6%) | 297 (45.4%) |
| Total (Overall) | 1,243 (57.6%) | 914 (42.4%) |
Sales and Office Occupations
The most common Sales and Office occupations in Woodruff are Sales & Related (159 | 7.4%), and Office & Administration (75 | 3.5%).
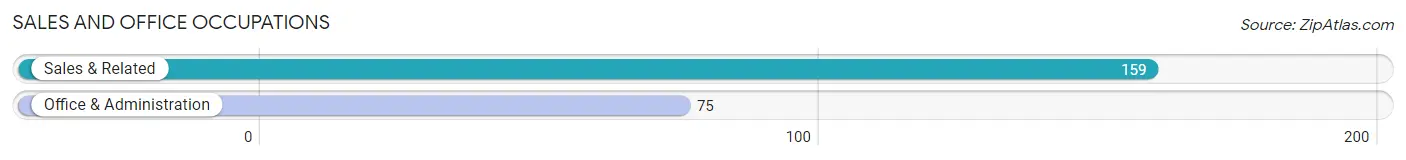
Sales and Office Occupations by Sex
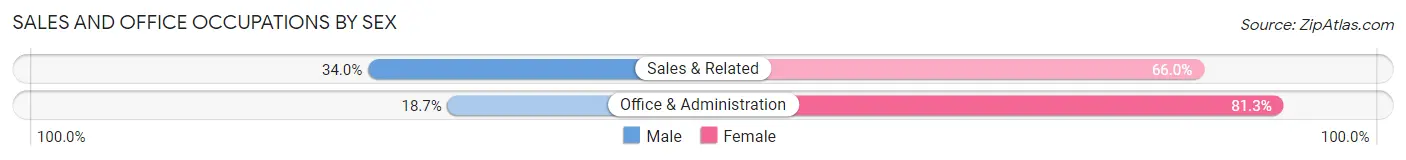
| Occupation | Male | Female |
| Sales & Related | 54 (34.0%) | 105 (66.0%) |
| Office & Administration | 14 (18.7%) | 61 (81.3%) |
| Total (Category) | 68 (29.1%) | 166 (70.9%) |
| Total (Overall) | 1,243 (57.6%) | 914 (42.4%) |
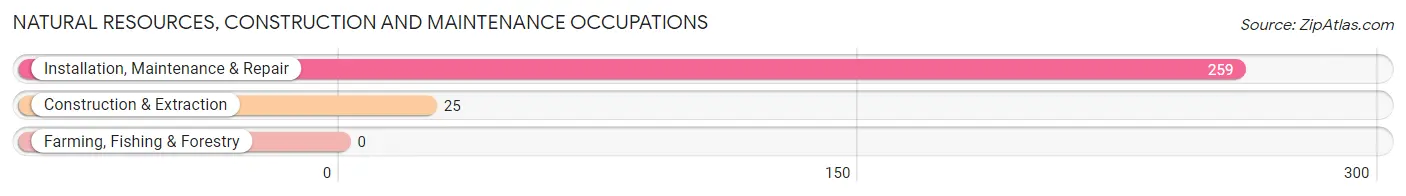
Natural Resources, Construction and Maintenance Occupations
The most common Natural Resources, Construction and Maintenance occupations in Woodruff are Installation, Maintenance & Repair (259 | 12.0%), and Construction & Extraction (25 | 1.2%).
Natural Resources, Construction and Maintenance Occupations by Sex
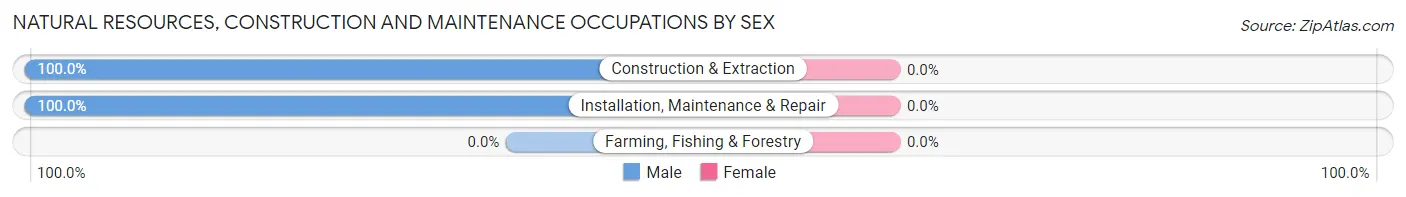
| Occupation | Male | Female |
| Farming, Fishing & Forestry | 0 (0.0%) | 0 (0.0%) |
| Construction & Extraction | 25 (100.0%) | 0 (0.0%) |
| Installation, Maintenance & Repair | 259 (100.0%) | 0 (0.0%) |
| Total (Category) | 284 (100.0%) | 0 (0.0%) |
| Total (Overall) | 1,243 (57.6%) | 914 (42.4%) |
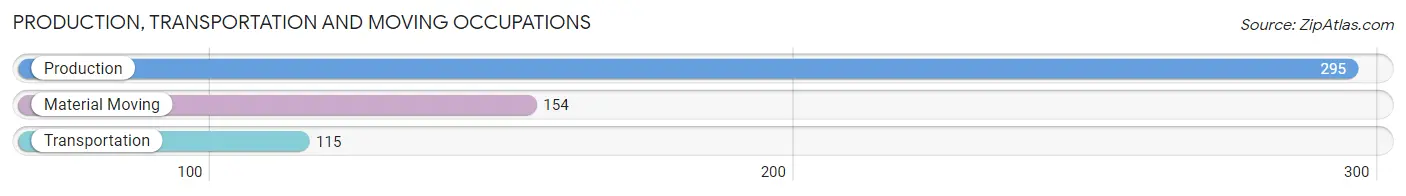
Production, Transportation and Moving Occupations
The most common Production, Transportation and Moving occupations in Woodruff are Production (295 | 13.7%), Material Moving (154 | 7.1%), and Transportation (115 | 5.3%).
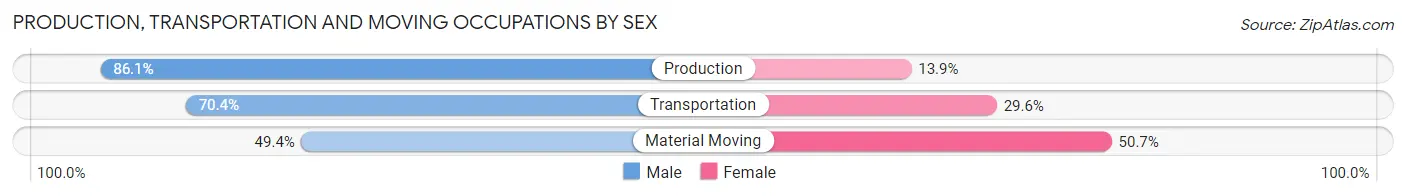
Production, Transportation and Moving Occupations by Sex
| Occupation | Male | Female |
| Production | 254 (86.1%) | 41 (13.9%) |
| Transportation | 81 (70.4%) | 34 (29.6%) |
| Material Moving | 76 (49.3%) | 78 (50.6%) |
| Total (Category) | 411 (72.9%) | 153 (27.1%) |
| Total (Overall) | 1,243 (57.6%) | 914 (42.4%) |
Employment Industries by Sex in Woodruff
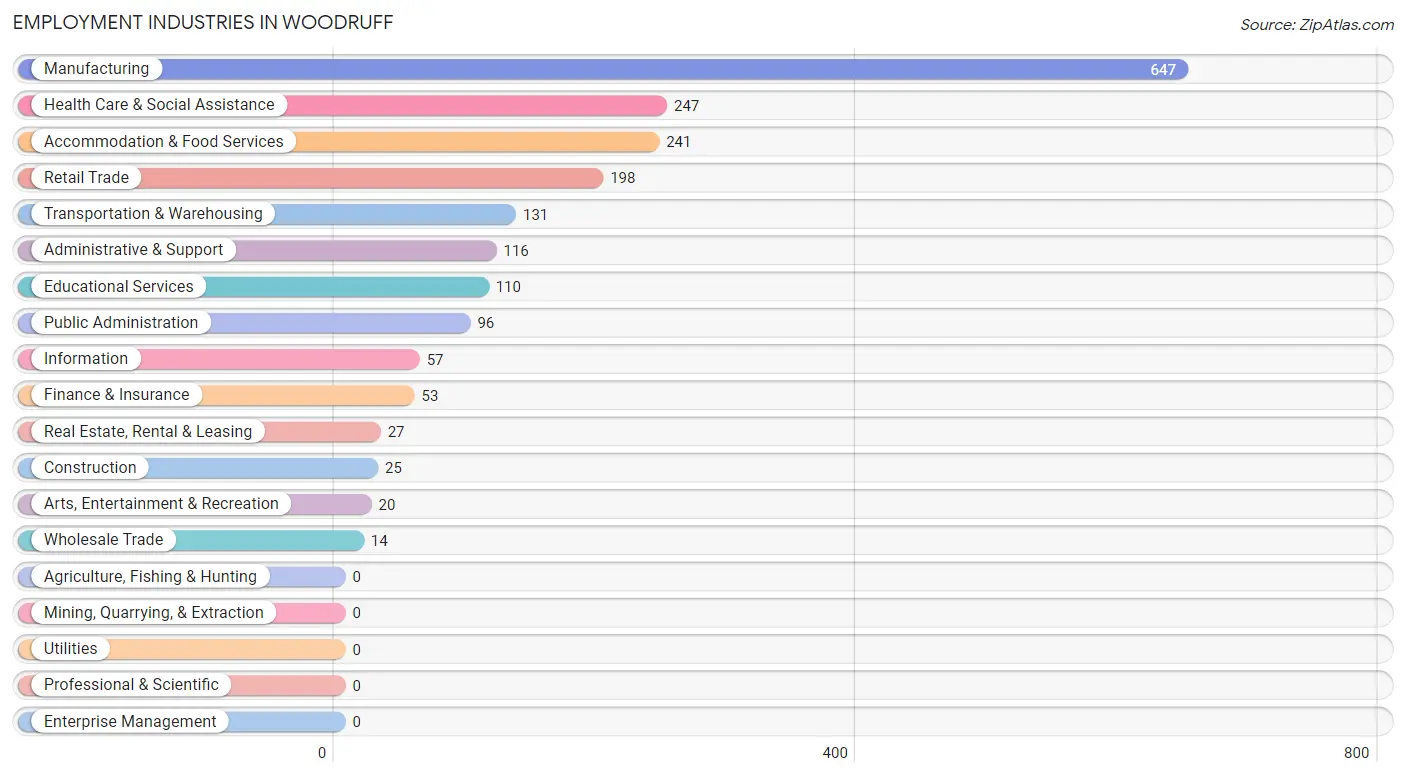
Employment Industries in Woodruff
The major employment industries in Woodruff include Manufacturing (647 | 30.0%), Health Care & Social Assistance (247 | 11.5%), Accommodation & Food Services (241 | 11.2%), Retail Trade (198 | 9.2%), and Transportation & Warehousing (131 | 6.1%).
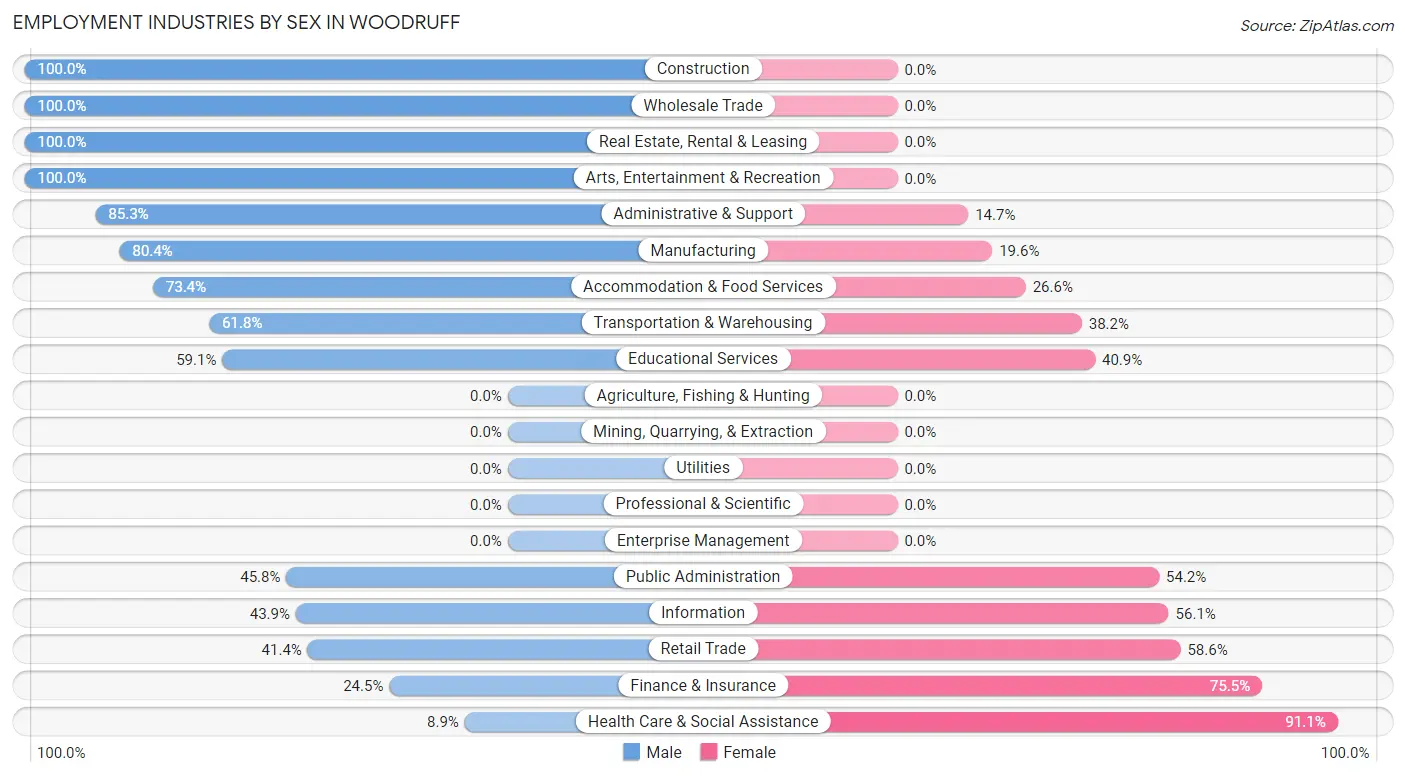
Employment Industries by Sex in Woodruff
The Woodruff industries that see more men than women are Construction (100.0%), Wholesale Trade (100.0%), and Real Estate, Rental & Leasing (100.0%), whereas the industries that tend to have a higher number of women are Health Care & Social Assistance (91.1%), Finance & Insurance (75.5%), and Retail Trade (58.6%).
| Industry | Male | Female |
| Agriculture, Fishing & Hunting | 0 (0.0%) | 0 (0.0%) |
| Mining, Quarrying, & Extraction | 0 (0.0%) | 0 (0.0%) |
| Construction | 25 (100.0%) | 0 (0.0%) |
| Manufacturing | 520 (80.4%) | 127 (19.6%) |
| Wholesale Trade | 14 (100.0%) | 0 (0.0%) |
| Retail Trade | 82 (41.4%) | 116 (58.6%) |
| Transportation & Warehousing | 81 (61.8%) | 50 (38.2%) |
| Utilities | 0 (0.0%) | 0 (0.0%) |
| Information | 25 (43.9%) | 32 (56.1%) |
| Finance & Insurance | 13 (24.5%) | 40 (75.5%) |
| Real Estate, Rental & Leasing | 27 (100.0%) | 0 (0.0%) |
| Professional & Scientific | 0 (0.0%) | 0 (0.0%) |
| Enterprise Management | 0 (0.0%) | 0 (0.0%) |
| Administrative & Support | 99 (85.3%) | 17 (14.7%) |
| Educational Services | 65 (59.1%) | 45 (40.9%) |
| Health Care & Social Assistance | 22 (8.9%) | 225 (91.1%) |
| Arts, Entertainment & Recreation | 20 (100.0%) | 0 (0.0%) |
| Accommodation & Food Services | 177 (73.4%) | 64 (26.6%) |
| Public Administration | 44 (45.8%) | 52 (54.2%) |
| Total | 1,243 (57.6%) | 914 (42.4%) |
Education in Woodruff
School Enrollment in Woodruff
The most common levels of schooling among the 578 students in Woodruff are elementary school (244 | 42.2%), high school (179 | 31.0%), and middle school (78 | 13.5%).
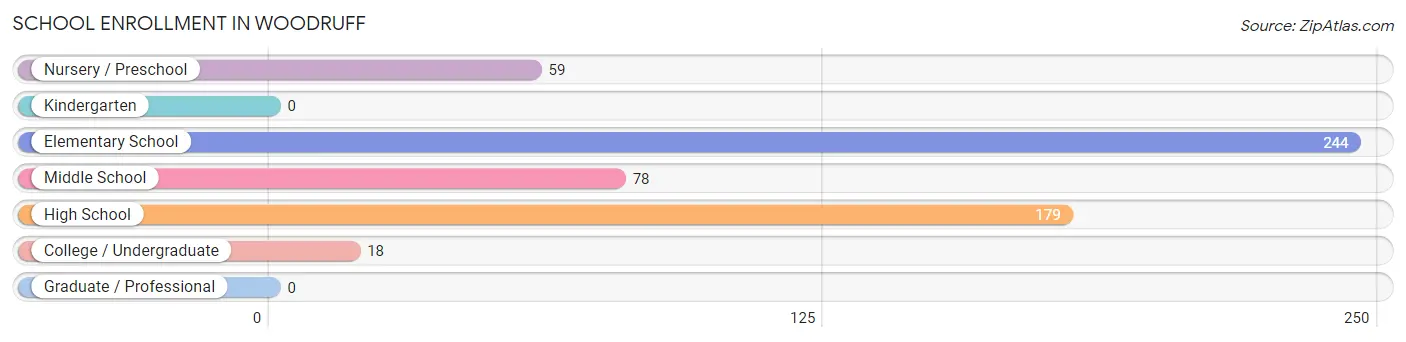
| School Level | # Students | % Students |
| Nursery / Preschool | 59 | 10.2% |
| Kindergarten | 0 | 0.0% |
| Elementary School | 244 | 42.2% |
| Middle School | 78 | 13.5% |
| High School | 179 | 31.0% |
| College / Undergraduate | 18 | 3.1% |
| Graduate / Professional | 0 | 0.0% |
| Total | 578 | 100.0% |
School Enrollment by Age by Funding Source in Woodruff
Out of a total of 578 students who are enrolled in schools in Woodruff, 46 (8.0%) attend a private institution, while the remaining 532 (92.0%) are enrolled in public schools. The age group of 10 to 14 year olds has the highest likelihood of being enrolled in private schools, with 30 (13.5% in the age bracket) enrolled. Conversely, the age group of 15 to 17 year olds has the lowest likelihood of being enrolled in a private school, with 154 (100.0% in the age bracket) attending a public institution.
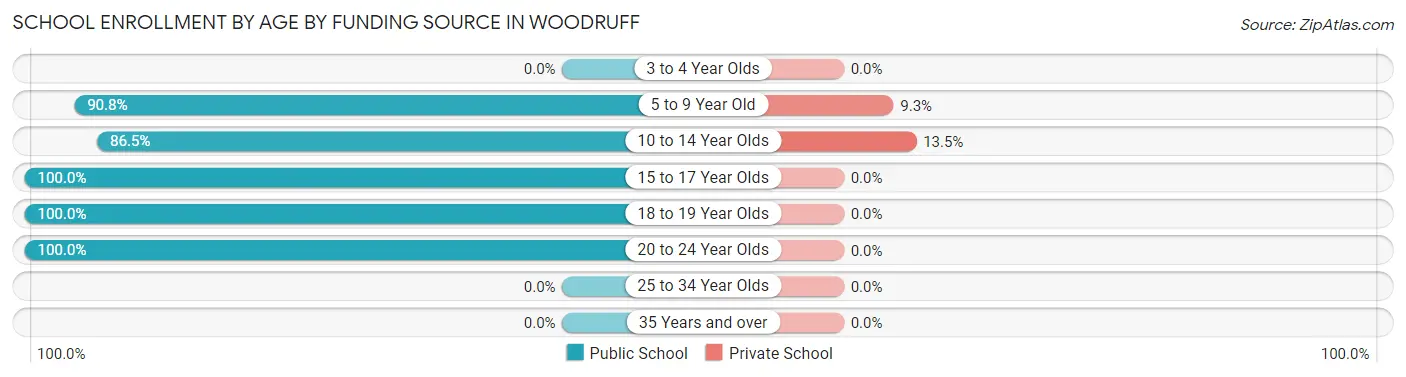
| Age Bracket | Public School | Private School |
| 3 to 4 Year Olds | 0 (0.0%) | 0 (0.0%) |
| 5 to 9 Year Old | 157 (90.7%) | 16 (9.2%) |
| 10 to 14 Year Olds | 192 (86.5%) | 30 (13.5%) |
| 15 to 17 Year Olds | 154 (100.0%) | 0 (0.0%) |
| 18 to 19 Year Olds | 11 (100.0%) | 0 (0.0%) |
| 20 to 24 Year Olds | 18 (100.0%) | 0 (0.0%) |
| 25 to 34 Year Olds | 0 (0.0%) | 0 (0.0%) |
| 35 Years and over | 0 (0.0%) | 0 (0.0%) |
| Total | 532 (92.0%) | 46 (8.0%) |
Educational Attainment by Field of Study in Woodruff
Engineering (267 | 42.7%), liberal arts & history (92 | 14.7%), business (66 | 10.6%), education (66 | 10.6%), and psychology (42 | 6.7%) are the most common fields of study among 625 individuals in Woodruff who have obtained a bachelor's degree or higher.
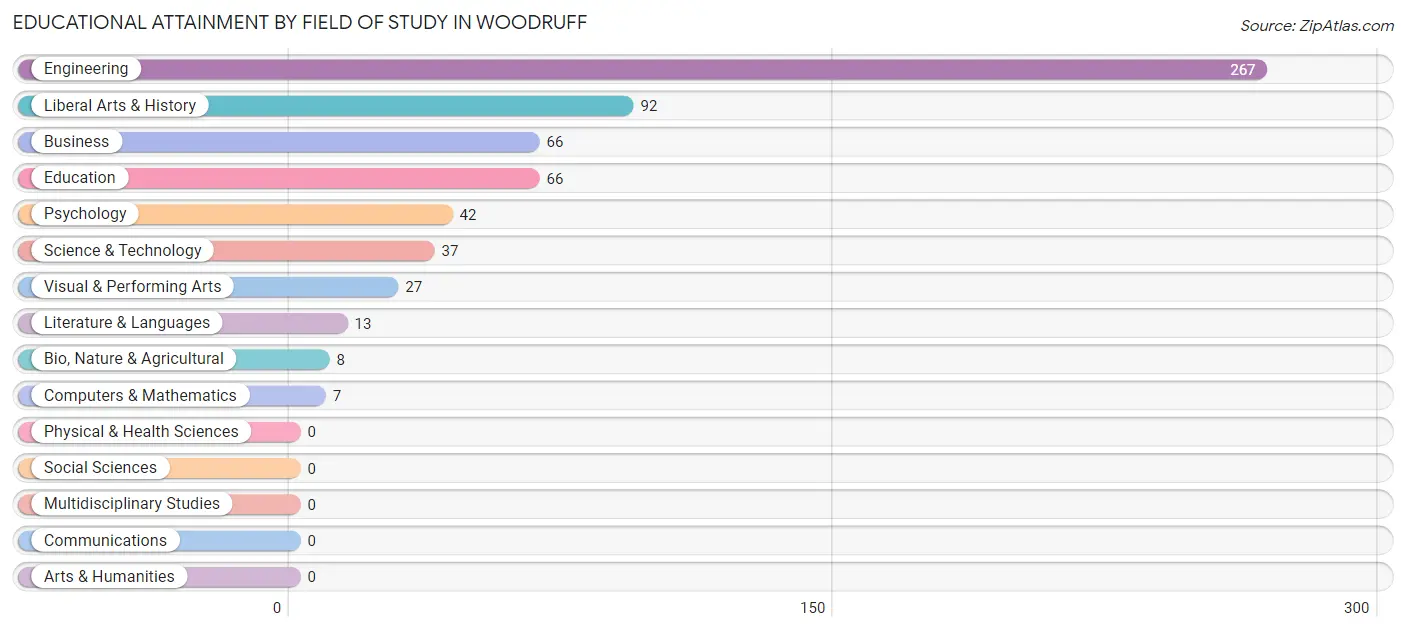
| Field of Study | # Graduates | % Graduates |
| Computers & Mathematics | 7 | 1.1% |
| Bio, Nature & Agricultural | 8 | 1.3% |
| Physical & Health Sciences | 0 | 0.0% |
| Psychology | 42 | 6.7% |
| Social Sciences | 0 | 0.0% |
| Engineering | 267 | 42.7% |
| Multidisciplinary Studies | 0 | 0.0% |
| Science & Technology | 37 | 5.9% |
| Business | 66 | 10.6% |
| Education | 66 | 10.6% |
| Literature & Languages | 13 | 2.1% |
| Liberal Arts & History | 92 | 14.7% |
| Visual & Performing Arts | 27 | 4.3% |
| Communications | 0 | 0.0% |
| Arts & Humanities | 0 | 0.0% |
| Total | 625 | 100.0% |
Transportation & Commute in Woodruff
Vehicle Availability by Sex in Woodruff
The most prevalent vehicle ownership categories in Woodruff are males with 1 vehicle (541, accounting for 43.8%) and females with 1 vehicle (240, making up 59.2%).
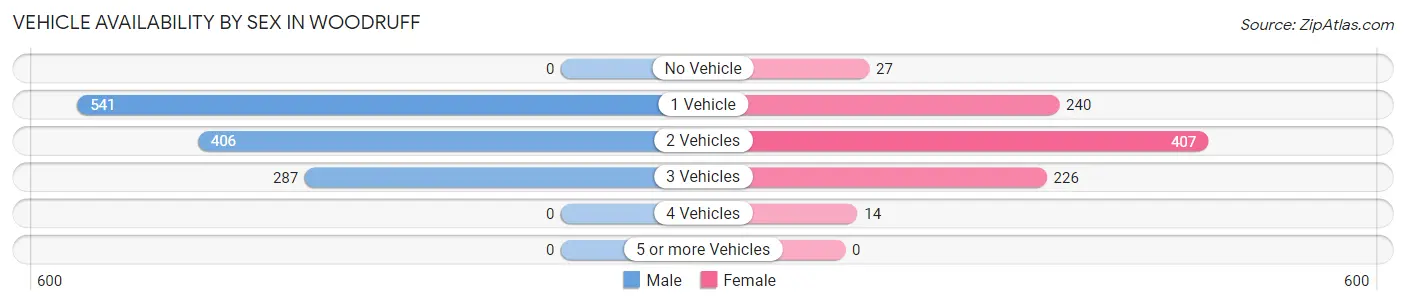
| Vehicles Available | Male | Female |
| No Vehicle | 0 (0.0%) | 27 (2.9%) |
| 1 Vehicle | 541 (43.8%) | 240 (26.3%) |
| 2 Vehicles | 406 (32.9%) | 407 (44.5%) |
| 3 Vehicles | 287 (23.3%) | 226 (24.7%) |
| 4 Vehicles | 0 (0.0%) | 14 (1.5%) |
| 5 or more Vehicles | 0 (0.0%) | 0 (0.0%) |
| Total | 1,234 (100.0%) | 914 (100.0%) |
Commute Time in Woodruff
The most frequently occuring commute durations in Woodruff are 5 to 9 minutes (517 commuters, 24.5%), 30 to 34 minutes (474 commuters, 22.5%), and 25 to 29 minutes (416 commuters, 19.7%).
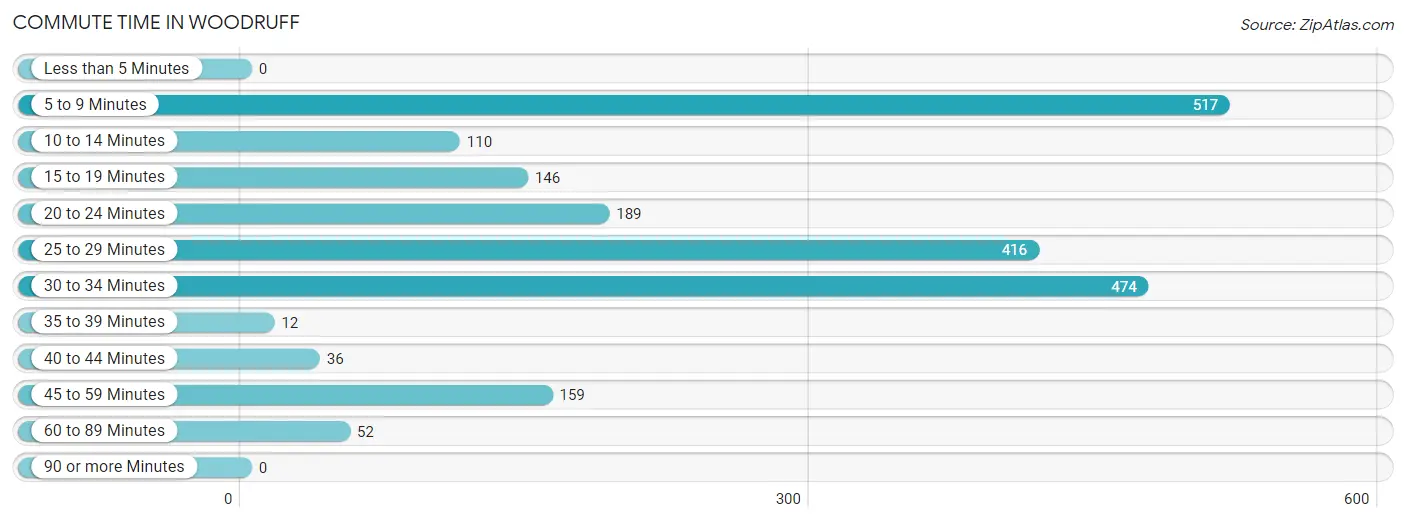
| Commute Time | # Commuters | % Commuters |
| Less than 5 Minutes | 0 | 0.0% |
| 5 to 9 Minutes | 517 | 24.5% |
| 10 to 14 Minutes | 110 | 5.2% |
| 15 to 19 Minutes | 146 | 6.9% |
| 20 to 24 Minutes | 189 | 8.9% |
| 25 to 29 Minutes | 416 | 19.7% |
| 30 to 34 Minutes | 474 | 22.5% |
| 35 to 39 Minutes | 12 | 0.6% |
| 40 to 44 Minutes | 36 | 1.7% |
| 45 to 59 Minutes | 159 | 7.5% |
| 60 to 89 Minutes | 52 | 2.5% |
| 90 or more Minutes | 0 | 0.0% |
Commute Time by Sex in Woodruff
The most common commute times in Woodruff are 25 to 29 minutes (355 commuters, 29.3%) for males and 5 to 9 minutes (256 commuters, 28.4%) for females.
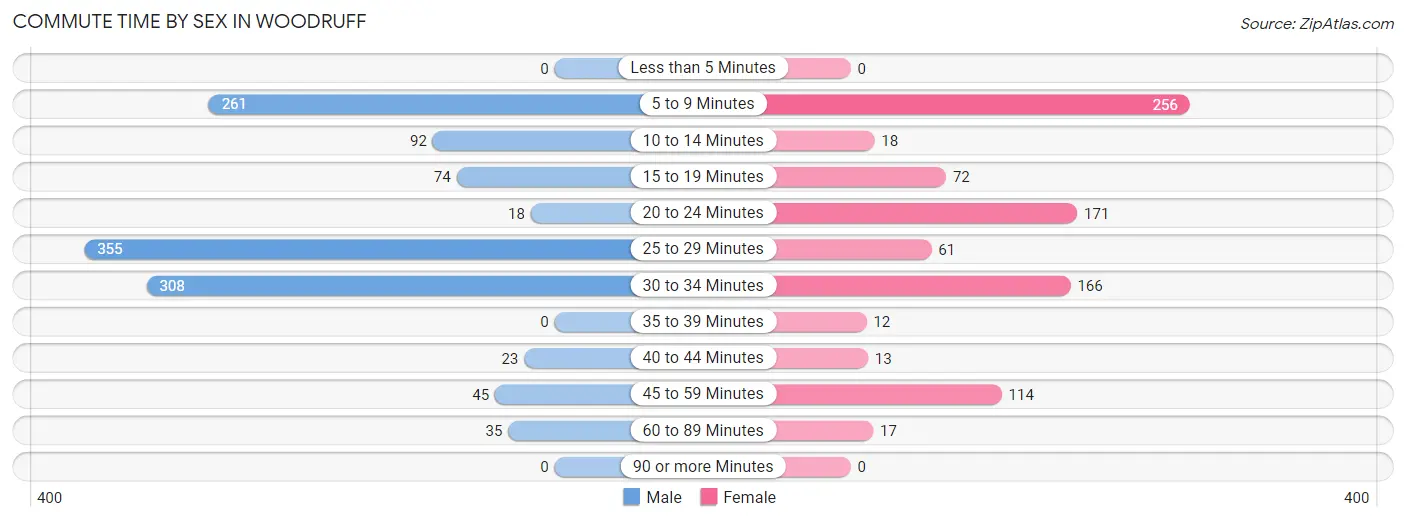
| Commute Time | Male | Female |
| Less than 5 Minutes | 0 (0.0%) | 0 (0.0%) |
| 5 to 9 Minutes | 261 (21.5%) | 256 (28.4%) |
| 10 to 14 Minutes | 92 (7.6%) | 18 (2.0%) |
| 15 to 19 Minutes | 74 (6.1%) | 72 (8.0%) |
| 20 to 24 Minutes | 18 (1.5%) | 171 (19.0%) |
| 25 to 29 Minutes | 355 (29.3%) | 61 (6.8%) |
| 30 to 34 Minutes | 308 (25.4%) | 166 (18.4%) |
| 35 to 39 Minutes | 0 (0.0%) | 12 (1.3%) |
| 40 to 44 Minutes | 23 (1.9%) | 13 (1.4%) |
| 45 to 59 Minutes | 45 (3.7%) | 114 (12.7%) |
| 60 to 89 Minutes | 35 (2.9%) | 17 (1.9%) |
| 90 or more Minutes | 0 (0.0%) | 0 (0.0%) |
Time of Departure to Work by Sex in Woodruff
The most frequent times of departure to work in Woodruff are 7:00 AM to 7:29 AM (350, 28.9%) for males and 8:00 AM to 8:29 AM (158, 17.6%) for females.
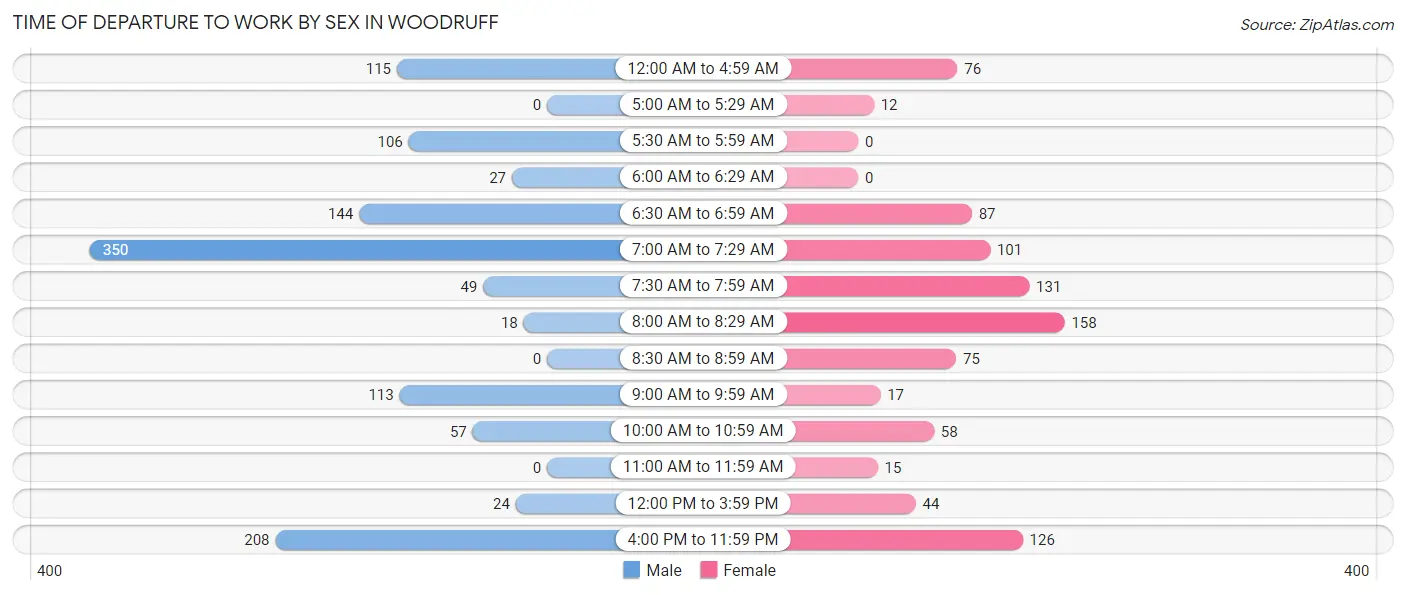
| Time of Departure | Male | Female |
| 12:00 AM to 4:59 AM | 115 (9.5%) | 76 (8.4%) |
| 5:00 AM to 5:29 AM | 0 (0.0%) | 12 (1.3%) |
| 5:30 AM to 5:59 AM | 106 (8.7%) | 0 (0.0%) |
| 6:00 AM to 6:29 AM | 27 (2.2%) | 0 (0.0%) |
| 6:30 AM to 6:59 AM | 144 (11.9%) | 87 (9.7%) |
| 7:00 AM to 7:29 AM | 350 (28.9%) | 101 (11.2%) |
| 7:30 AM to 7:59 AM | 49 (4.1%) | 131 (14.6%) |
| 8:00 AM to 8:29 AM | 18 (1.5%) | 158 (17.6%) |
| 8:30 AM to 8:59 AM | 0 (0.0%) | 75 (8.3%) |
| 9:00 AM to 9:59 AM | 113 (9.3%) | 17 (1.9%) |
| 10:00 AM to 10:59 AM | 57 (4.7%) | 58 (6.4%) |
| 11:00 AM to 11:59 AM | 0 (0.0%) | 15 (1.7%) |
| 12:00 PM to 3:59 PM | 24 (2.0%) | 44 (4.9%) |
| 4:00 PM to 11:59 PM | 208 (17.2%) | 126 (14.0%) |
| Total | 1,211 (100.0%) | 900 (100.0%) |
Housing Occupancy in Woodruff
Occupancy by Ownership in Woodruff
Of the total 1,722 dwellings in Woodruff, owner-occupied units account for 1,053 (61.2%), while renter-occupied units make up 669 (38.9%).
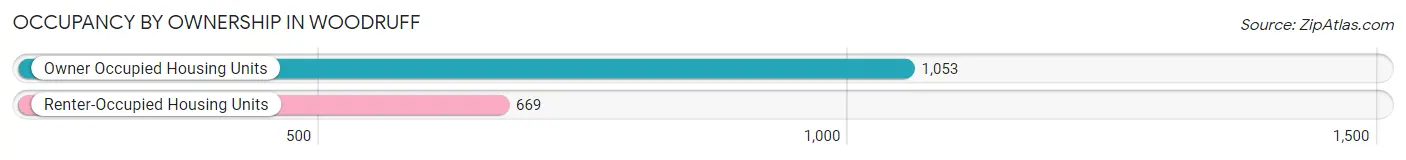
| Occupancy | # Housing Units | % Housing Units |
| Owner Occupied Housing Units | 1,053 | 61.2% |
| Renter-Occupied Housing Units | 669 | 38.9% |
| Total Occupied Housing Units | 1,722 | 100.0% |
Occupancy by Household Size in Woodruff
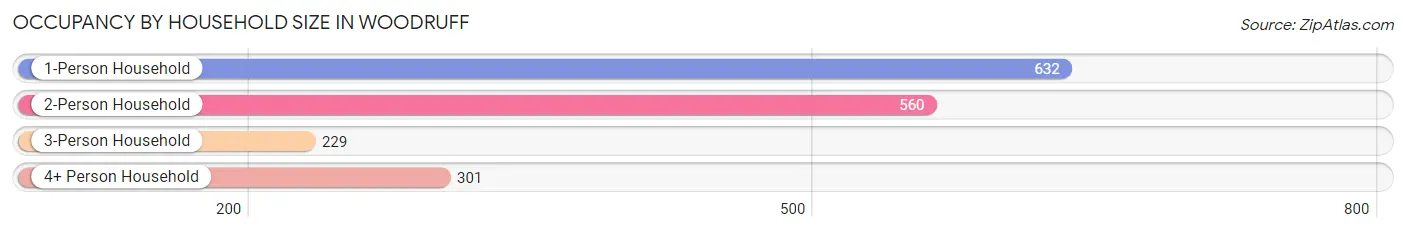
| Household Size | # Housing Units | % Housing Units |
| 1-Person Household | 632 | 36.7% |
| 2-Person Household | 560 | 32.5% |
| 3-Person Household | 229 | 13.3% |
| 4+ Person Household | 301 | 17.5% |
| Total Housing Units | 1,722 | 100.0% |
Occupancy by Ownership by Household Size in Woodruff
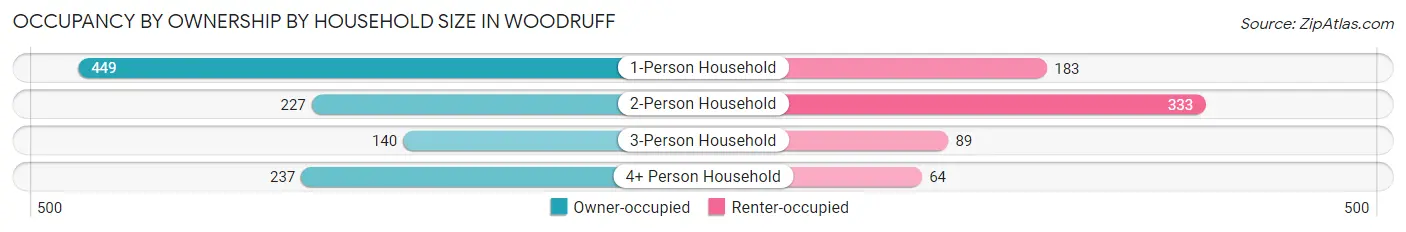
| Household Size | Owner-occupied | Renter-occupied |
| 1-Person Household | 449 (71.0%) | 183 (29.0%) |
| 2-Person Household | 227 (40.5%) | 333 (59.5%) |
| 3-Person Household | 140 (61.1%) | 89 (38.9%) |
| 4+ Person Household | 237 (78.7%) | 64 (21.3%) |
| Total Housing Units | 1,053 (61.2%) | 669 (38.9%) |
Occupancy by Educational Attainment in Woodruff
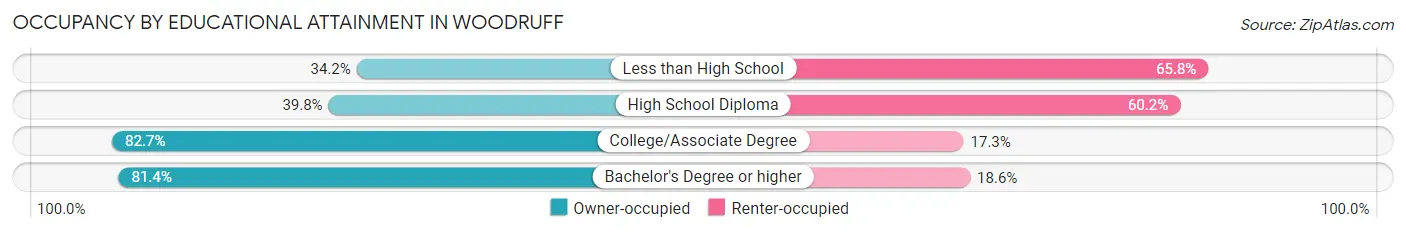
| Household Size | Owner-occupied | Renter-occupied |
| Less than High School | 81 (34.2%) | 156 (65.8%) |
| High School Diploma | 231 (39.8%) | 350 (60.2%) |
| College/Associate Degree | 348 (82.7%) | 73 (17.3%) |
| Bachelor's Degree or higher | 393 (81.4%) | 90 (18.6%) |
Occupancy by Age of Householder in Woodruff
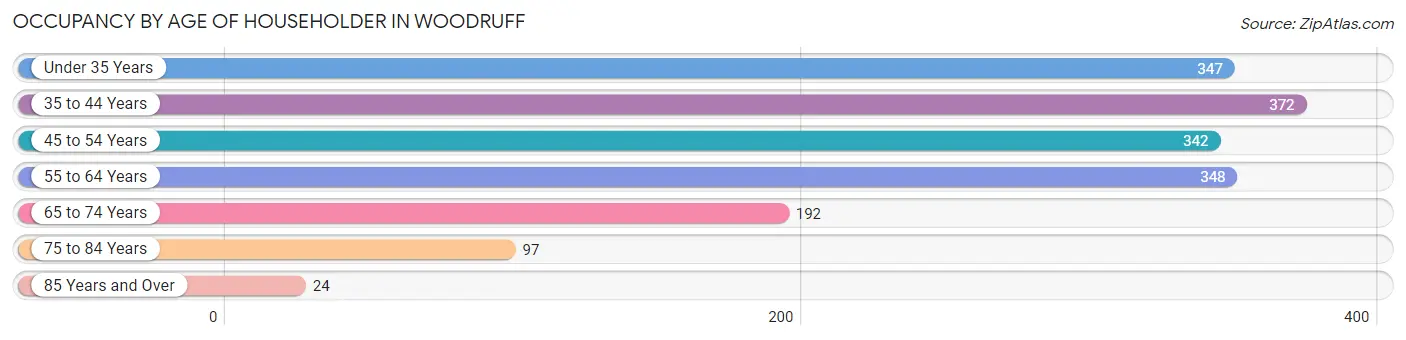
| Age Bracket | # Households | % Households |
| Under 35 Years | 347 | 20.2% |
| 35 to 44 Years | 372 | 21.6% |
| 45 to 54 Years | 342 | 19.9% |
| 55 to 64 Years | 348 | 20.2% |
| 65 to 74 Years | 192 | 11.2% |
| 75 to 84 Years | 97 | 5.6% |
| 85 Years and Over | 24 | 1.4% |
| Total | 1,722 | 100.0% |
Housing Finances in Woodruff
Median Income by Occupancy in Woodruff
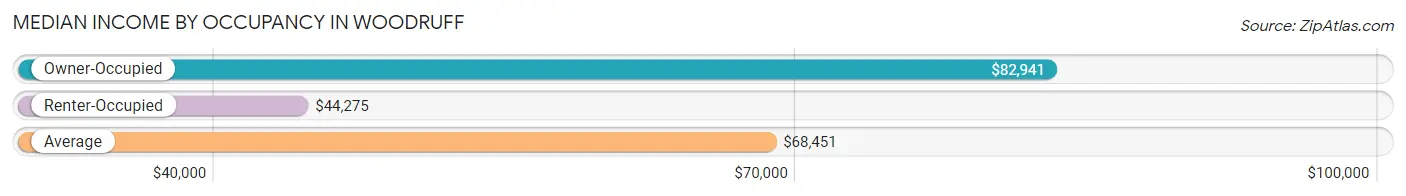
| Occupancy Type | # Households | Median Income |
| Owner-Occupied | 1,053 (61.2%) | $82,941 |
| Renter-Occupied | 669 (38.9%) | $44,275 |
| Average | 1,722 (100.0%) | $68,451 |
Occupancy by Householder Income Bracket in Woodruff
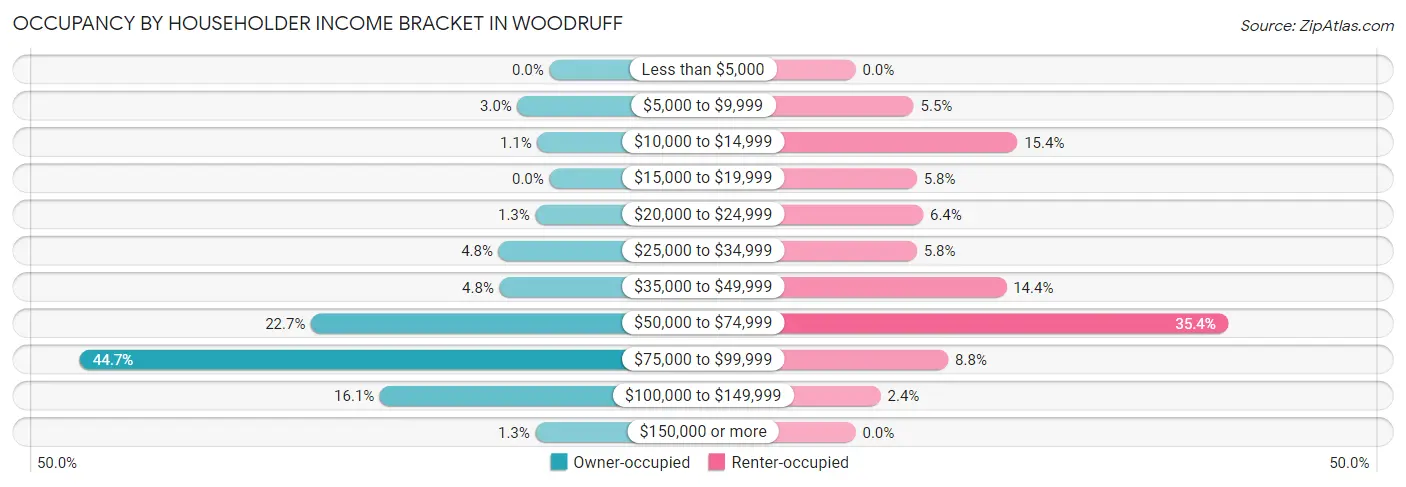
| Income Bracket | Owner-occupied | Renter-occupied |
| Less than $5,000 | 0 (0.0%) | 0 (0.0%) |
| $5,000 to $9,999 | 32 (3.0%) | 37 (5.5%) |
| $10,000 to $14,999 | 12 (1.1%) | 103 (15.4%) |
| $15,000 to $19,999 | 0 (0.0%) | 39 (5.8%) |
| $20,000 to $24,999 | 14 (1.3%) | 43 (6.4%) |
| $25,000 to $34,999 | 51 (4.8%) | 39 (5.8%) |
| $35,000 to $49,999 | 50 (4.8%) | 96 (14.3%) |
| $50,000 to $74,999 | 239 (22.7%) | 237 (35.4%) |
| $75,000 to $99,999 | 471 (44.7%) | 59 (8.8%) |
| $100,000 to $149,999 | 170 (16.1%) | 16 (2.4%) |
| $150,000 or more | 14 (1.3%) | 0 (0.0%) |
| Total | 1,053 (100.0%) | 669 (100.0%) |
Monthly Housing Cost Tiers in Woodruff
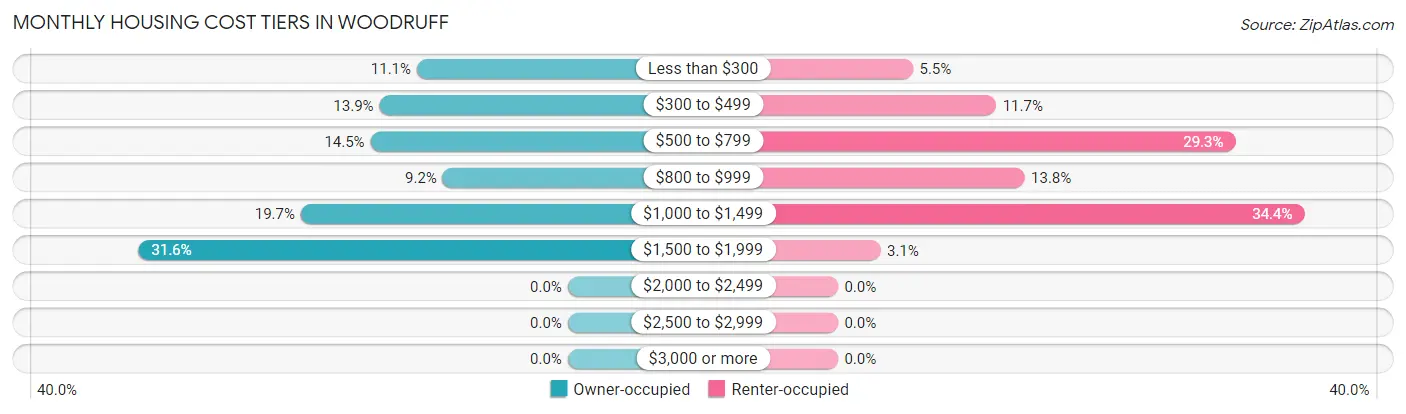
| Monthly Cost | Owner-occupied | Renter-occupied |
| Less than $300 | 117 (11.1%) | 37 (5.5%) |
| $300 to $499 | 146 (13.9%) | 78 (11.7%) |
| $500 to $799 | 153 (14.5%) | 196 (29.3%) |
| $800 to $999 | 97 (9.2%) | 92 (13.8%) |
| $1,000 to $1,499 | 207 (19.7%) | 230 (34.4%) |
| $1,500 to $1,999 | 333 (31.6%) | 21 (3.1%) |
| $2,000 to $2,499 | 0 (0.0%) | 0 (0.0%) |
| $2,500 to $2,999 | 0 (0.0%) | 0 (0.0%) |
| $3,000 or more | 0 (0.0%) | 0 (0.0%) |
| Total | 1,053 (100.0%) | 669 (100.0%) |
Physical Housing Characteristics in Woodruff
Housing Structures in Woodruff
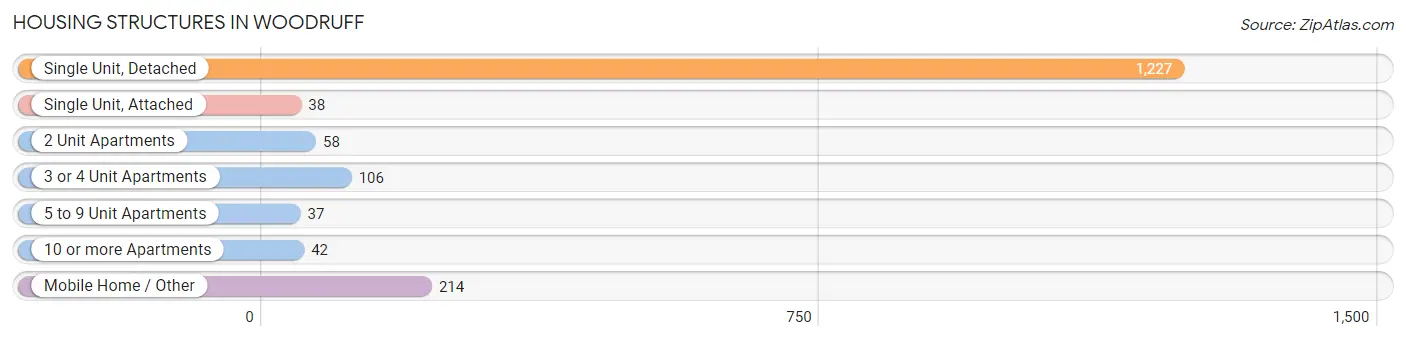
| Structure Type | # Housing Units | % Housing Units |
| Single Unit, Detached | 1,227 | 71.3% |
| Single Unit, Attached | 38 | 2.2% |
| 2 Unit Apartments | 58 | 3.4% |
| 3 or 4 Unit Apartments | 106 | 6.2% |
| 5 to 9 Unit Apartments | 37 | 2.1% |
| 10 or more Apartments | 42 | 2.4% |
| Mobile Home / Other | 214 | 12.4% |
| Total | 1,722 | 100.0% |
Housing Structures by Occupancy in Woodruff
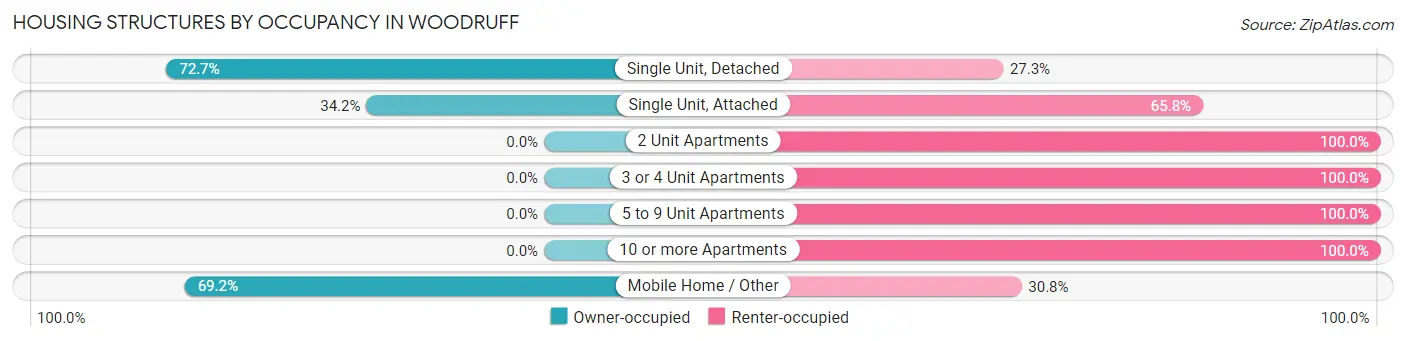
| Structure Type | Owner-occupied | Renter-occupied |
| Single Unit, Detached | 892 (72.7%) | 335 (27.3%) |
| Single Unit, Attached | 13 (34.2%) | 25 (65.8%) |
| 2 Unit Apartments | 0 (0.0%) | 58 (100.0%) |
| 3 or 4 Unit Apartments | 0 (0.0%) | 106 (100.0%) |
| 5 to 9 Unit Apartments | 0 (0.0%) | 37 (100.0%) |
| 10 or more Apartments | 0 (0.0%) | 42 (100.0%) |
| Mobile Home / Other | 148 (69.2%) | 66 (30.8%) |
| Total | 1,053 (61.2%) | 669 (38.9%) |
Housing Structures by Number of Rooms in Woodruff
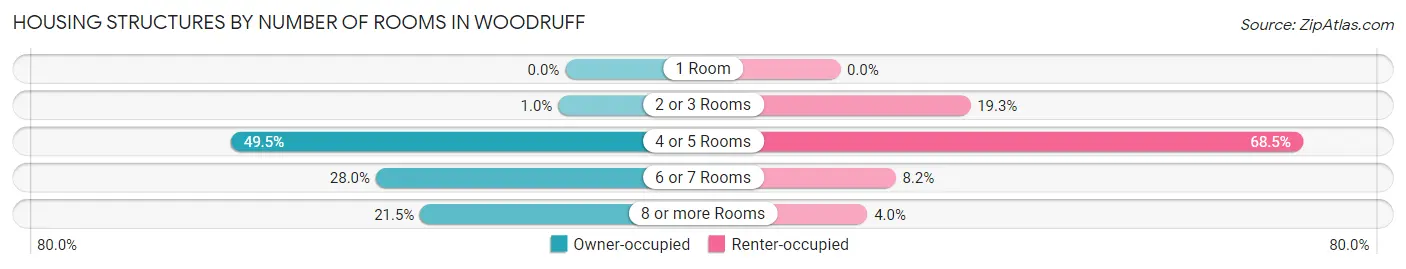
| Number of Rooms | Owner-occupied | Renter-occupied |
| 1 Room | 0 (0.0%) | 0 (0.0%) |
| 2 or 3 Rooms | 11 (1.0%) | 129 (19.3%) |
| 4 or 5 Rooms | 521 (49.5%) | 458 (68.5%) |
| 6 or 7 Rooms | 295 (28.0%) | 55 (8.2%) |
| 8 or more Rooms | 226 (21.5%) | 27 (4.0%) |
| Total | 1,053 (100.0%) | 669 (100.0%) |
Housing Structure by Heating Type in Woodruff
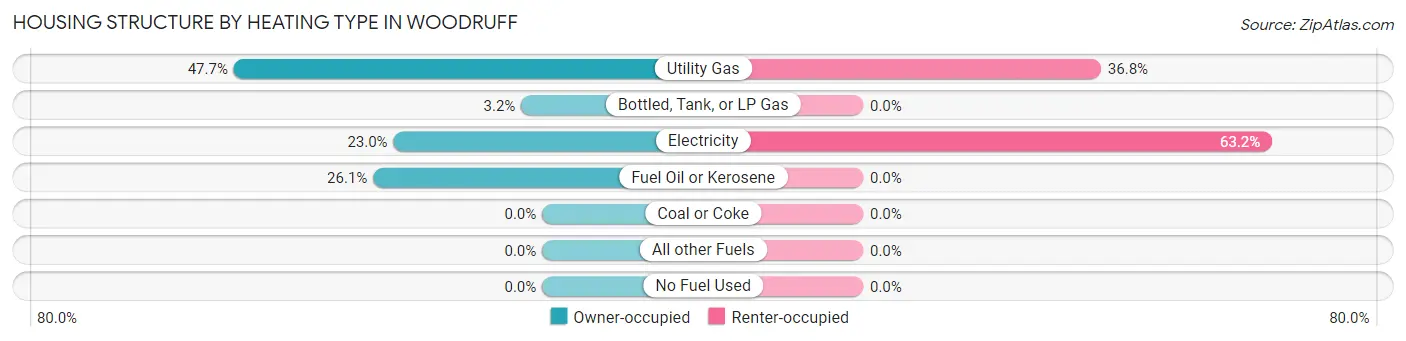
| Heating Type | Owner-occupied | Renter-occupied |
| Utility Gas | 502 (47.7%) | 246 (36.8%) |
| Bottled, Tank, or LP Gas | 34 (3.2%) | 0 (0.0%) |
| Electricity | 242 (23.0%) | 423 (63.2%) |
| Fuel Oil or Kerosene | 275 (26.1%) | 0 (0.0%) |
| Coal or Coke | 0 (0.0%) | 0 (0.0%) |
| All other Fuels | 0 (0.0%) | 0 (0.0%) |
| No Fuel Used | 0 (0.0%) | 0 (0.0%) |
| Total | 1,053 (100.0%) | 669 (100.0%) |
Household Vehicle Usage in Woodruff
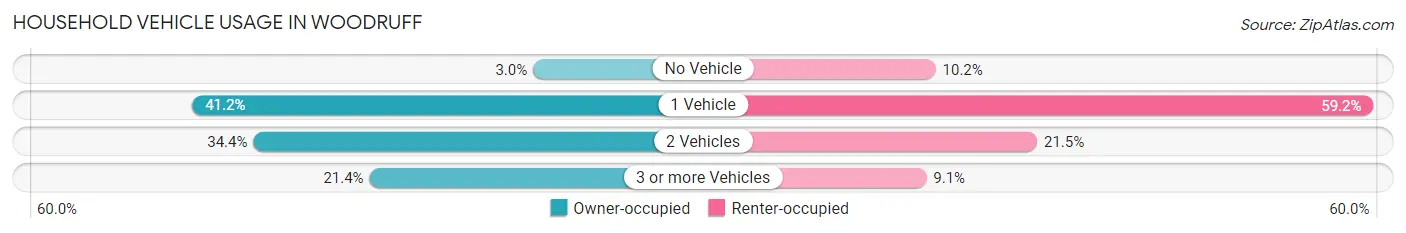
| Vehicles per Household | Owner-occupied | Renter-occupied |
| No Vehicle | 32 (3.0%) | 68 (10.2%) |
| 1 Vehicle | 434 (41.2%) | 396 (59.2%) |
| 2 Vehicles | 362 (34.4%) | 144 (21.5%) |
| 3 or more Vehicles | 225 (21.4%) | 61 (9.1%) |
| Total | 1,053 (100.0%) | 669 (100.0%) |
Real Estate & Mortgages in Woodruff
Real Estate and Mortgage Overview in Woodruff
| Characteristic | Without Mortgage | With Mortgage |
| Housing Units | 310 | 743 |
| Median Property Value | $101,700 | $188,600 |
| Median Household Income | $72,000 | $14 |
| Monthly Housing Costs | $395 | $0 |
| Real Estate Taxes | - | - |
Property Value by Mortgage Status in Woodruff
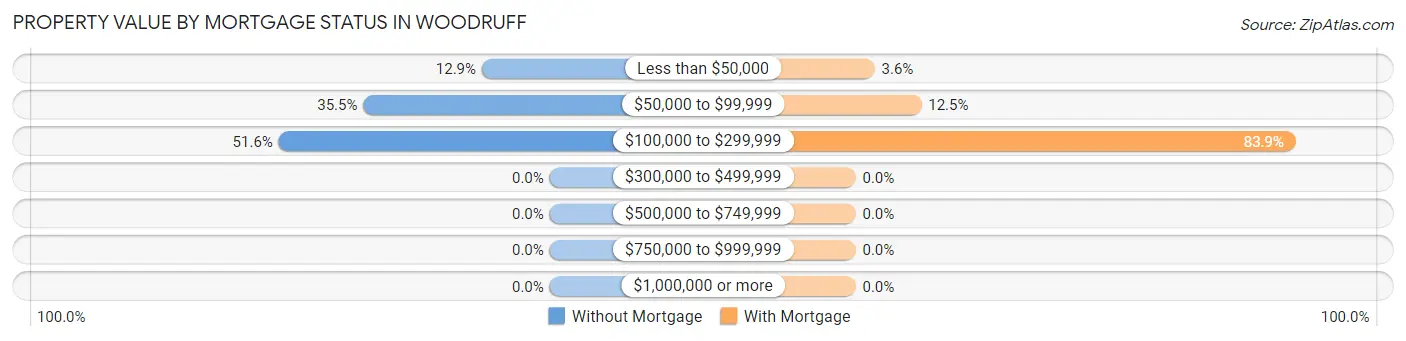
| Property Value | Without Mortgage | With Mortgage |
| Less than $50,000 | 40 (12.9%) | 27 (3.6%) |
| $50,000 to $99,999 | 110 (35.5%) | 93 (12.5%) |
| $100,000 to $299,999 | 160 (51.6%) | 623 (83.9%) |
| $300,000 to $499,999 | 0 (0.0%) | 0 (0.0%) |
| $500,000 to $749,999 | 0 (0.0%) | 0 (0.0%) |
| $750,000 to $999,999 | 0 (0.0%) | 0 (0.0%) |
| $1,000,000 or more | 0 (0.0%) | 0 (0.0%) |
| Total | 310 (100.0%) | 743 (100.0%) |
Household Income by Mortgage Status in Woodruff
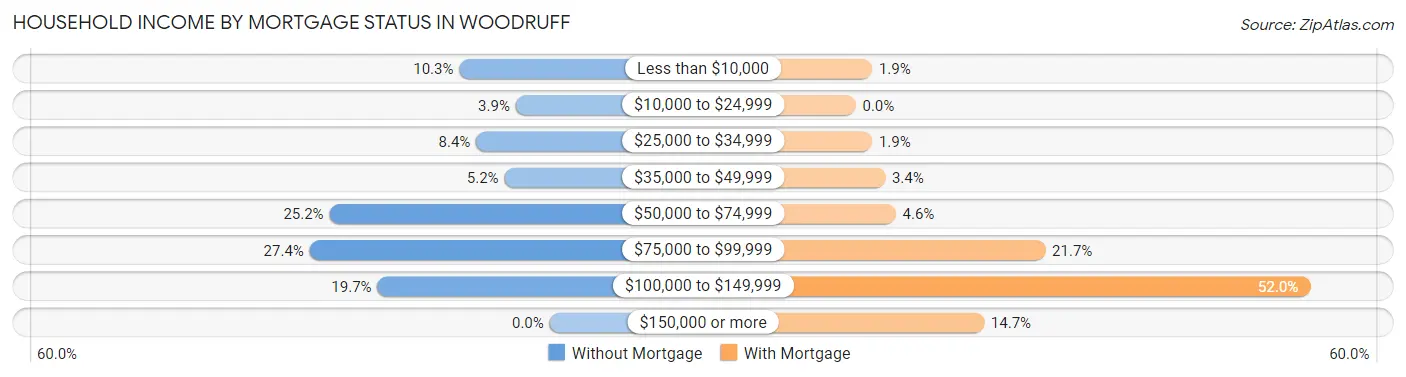
| Household Income | Without Mortgage | With Mortgage |
| Less than $10,000 | 32 (10.3%) | 14 (1.9%) |
| $10,000 to $24,999 | 12 (3.9%) | 0 (0.0%) |
| $25,000 to $34,999 | 26 (8.4%) | 14 (1.9%) |
| $35,000 to $49,999 | 16 (5.2%) | 25 (3.4%) |
| $50,000 to $74,999 | 78 (25.2%) | 34 (4.6%) |
| $75,000 to $99,999 | 85 (27.4%) | 161 (21.7%) |
| $100,000 to $149,999 | 61 (19.7%) | 386 (51.9%) |
| $150,000 or more | 0 (0.0%) | 109 (14.7%) |
| Total | 310 (100.0%) | 743 (100.0%) |
Property Value to Household Income Ratio in Woodruff
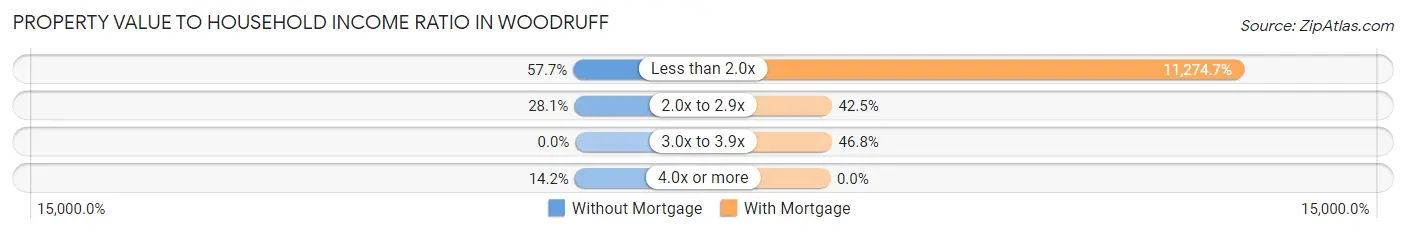
| Value-to-Income Ratio | Without Mortgage | With Mortgage |
| Less than 2.0x | 179 (57.7%) | 83,771 (11,274.7%) |
| 2.0x to 2.9x | 87 (28.1%) | 316 (42.5%) |
| 3.0x to 3.9x | 0 (0.0%) | 348 (46.8%) |
| 4.0x or more | 44 (14.2%) | 0 (0.0%) |
| Total | 310 (100.0%) | 743 (100.0%) |
Real Estate Taxes by Mortgage Status in Woodruff
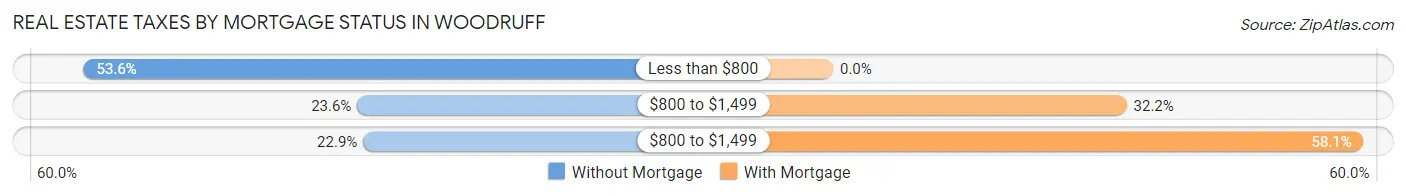
| Property Taxes | Without Mortgage | With Mortgage |
| Less than $800 | 166 (53.5%) | 0 (0.0%) |
| $800 to $1,499 | 73 (23.5%) | 239 (32.2%) |
| $800 to $1,499 | 71 (22.9%) | 432 (58.1%) |
| Total | 310 (100.0%) | 743 (100.0%) |
Health & Disability in Woodruff
Health Insurance Coverage by Age in Woodruff
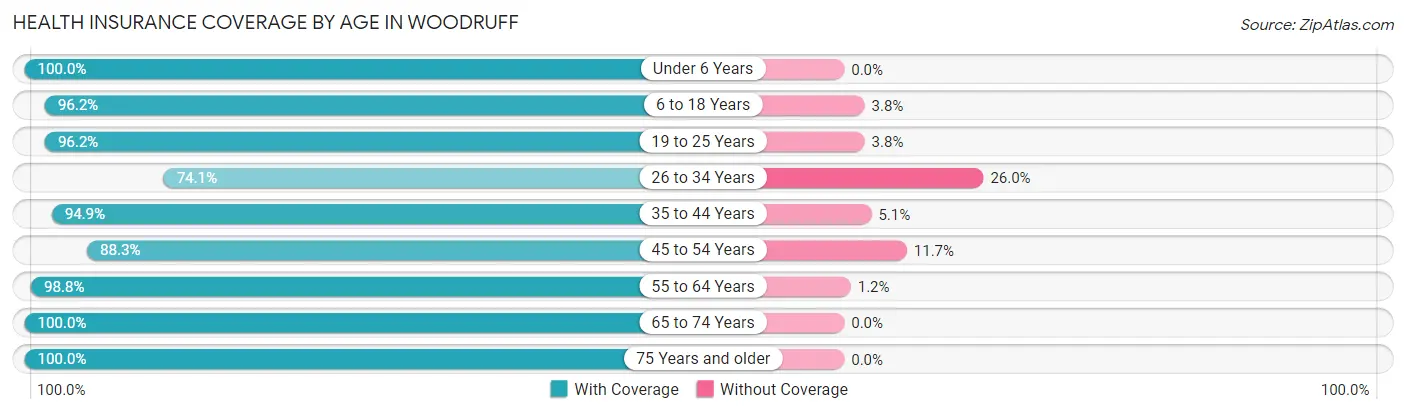
| Age Bracket | With Coverage | Without Coverage |
| Under 6 Years | 345 (100.0%) | 0 (0.0%) |
| 6 to 18 Years | 482 (96.2%) | 19 (3.8%) |
| 19 to 25 Years | 430 (96.2%) | 17 (3.8%) |
| 26 to 34 Years | 528 (74.1%) | 185 (26.0%) |
| 35 to 44 Years | 674 (94.9%) | 36 (5.1%) |
| 45 to 54 Years | 454 (88.3%) | 60 (11.7%) |
| 55 to 64 Years | 488 (98.8%) | 6 (1.2%) |
| 65 to 74 Years | 266 (100.0%) | 0 (0.0%) |
| 75 Years and older | 137 (100.0%) | 0 (0.0%) |
| Total | 3,804 (92.2%) | 323 (7.8%) |
Health Insurance Coverage by Citizenship Status in Woodruff
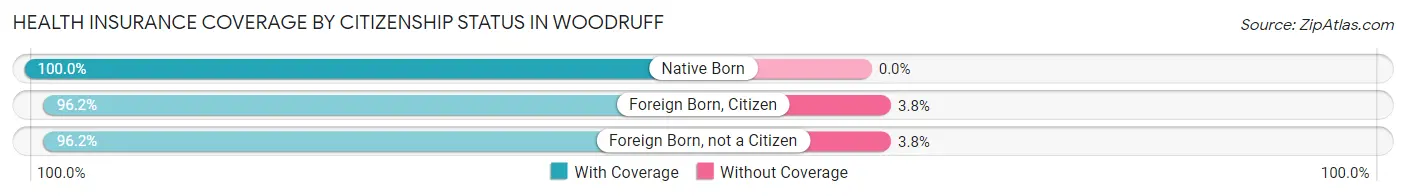
| Citizenship Status | With Coverage | Without Coverage |
| Native Born | 345 (100.0%) | 0 (0.0%) |
| Foreign Born, Citizen | 482 (96.2%) | 19 (3.8%) |
| Foreign Born, not a Citizen | 430 (96.2%) | 17 (3.8%) |
Health Insurance Coverage by Household Income in Woodruff
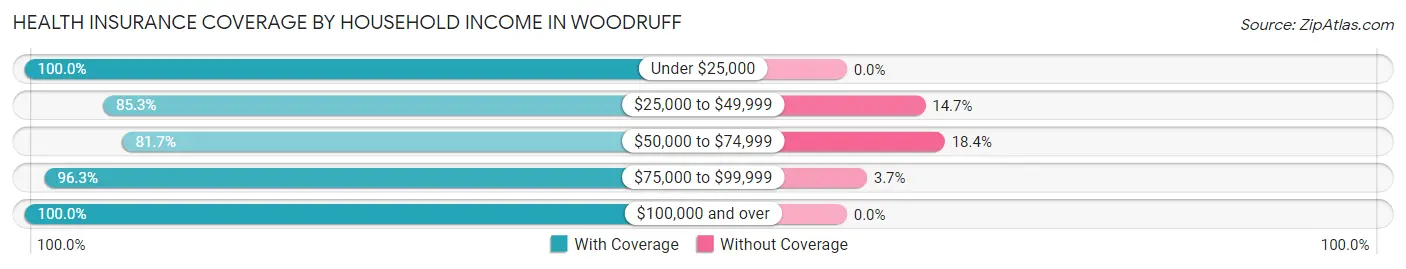
| Household Income | With Coverage | Without Coverage |
| Under $25,000 | 442 (100.0%) | 0 (0.0%) |
| $25,000 to $49,999 | 383 (85.3%) | 66 (14.7%) |
| $50,000 to $74,999 | 930 (81.7%) | 209 (18.3%) |
| $75,000 to $99,999 | 1,236 (96.3%) | 48 (3.7%) |
| $100,000 and over | 804 (100.0%) | 0 (0.0%) |
Public vs Private Health Insurance Coverage by Age in Woodruff
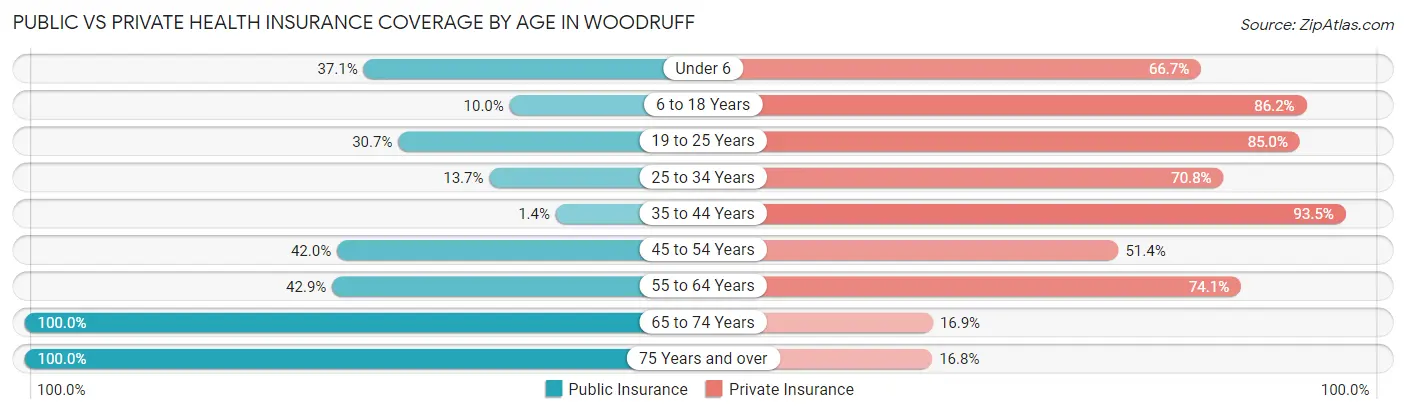
| Age Bracket | Public Insurance | Private Insurance |
| Under 6 | 128 (37.1%) | 230 (66.7%) |
| 6 to 18 Years | 50 (10.0%) | 432 (86.2%) |
| 19 to 25 Years | 137 (30.6%) | 380 (85.0%) |
| 25 to 34 Years | 98 (13.7%) | 505 (70.8%) |
| 35 to 44 Years | 10 (1.4%) | 664 (93.5%) |
| 45 to 54 Years | 216 (42.0%) | 264 (51.4%) |
| 55 to 64 Years | 212 (42.9%) | 366 (74.1%) |
| 65 to 74 Years | 266 (100.0%) | 45 (16.9%) |
| 75 Years and over | 137 (100.0%) | 23 (16.8%) |
| Total | 1,254 (30.4%) | 2,909 (70.5%) |
Disability Status by Sex by Age in Woodruff
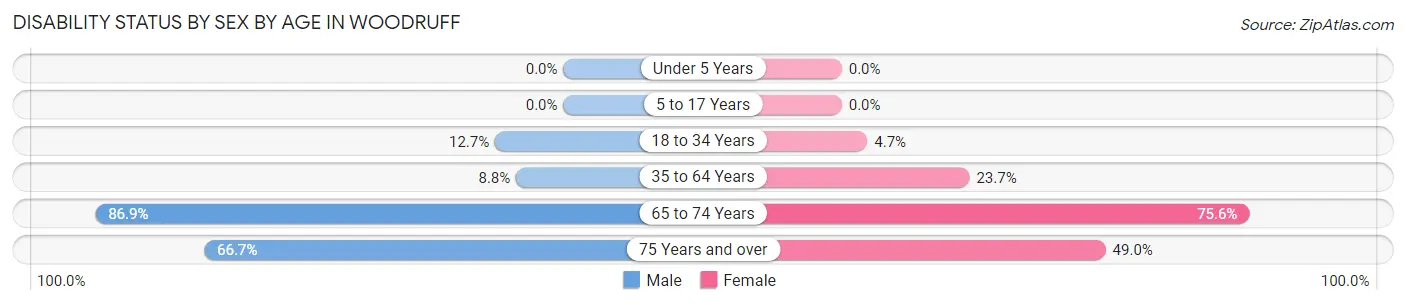
| Age Bracket | Male | Female |
| Under 5 Years | 0 (0.0%) | 0 (0.0%) |
| 5 to 17 Years | 0 (0.0%) | 0 (0.0%) |
| 18 to 34 Years | 87 (12.7%) | 23 (4.7%) |
| 35 to 64 Years | 83 (8.8%) | 183 (23.7%) |
| 65 to 74 Years | 53 (86.9%) | 155 (75.6%) |
| 75 Years and over | 26 (66.7%) | 48 (49.0%) |
Disability Class by Sex by Age in Woodruff
Disability Class: Hearing Difficulty
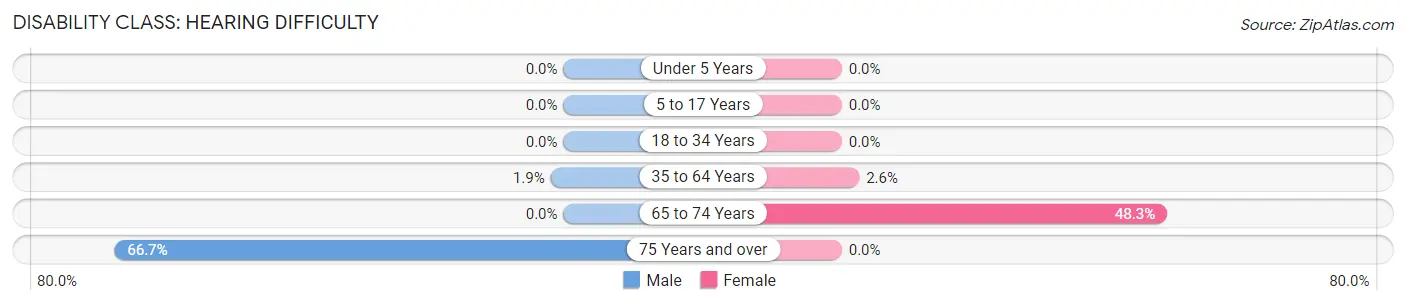
| Age Bracket | Male | Female |
| Under 5 Years | 0 (0.0%) | 0 (0.0%) |
| 5 to 17 Years | 0 (0.0%) | 0 (0.0%) |
| 18 to 34 Years | 0 (0.0%) | 0 (0.0%) |
| 35 to 64 Years | 18 (1.9%) | 20 (2.6%) |
| 65 to 74 Years | 0 (0.0%) | 99 (48.3%) |
| 75 Years and over | 26 (66.7%) | 0 (0.0%) |
Disability Class: Vision Difficulty
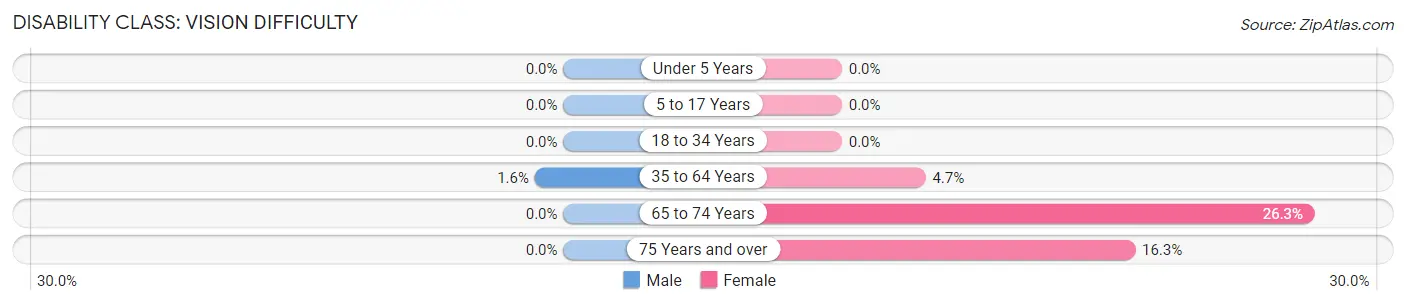
| Age Bracket | Male | Female |
| Under 5 Years | 0 (0.0%) | 0 (0.0%) |
| 5 to 17 Years | 0 (0.0%) | 0 (0.0%) |
| 18 to 34 Years | 0 (0.0%) | 0 (0.0%) |
| 35 to 64 Years | 15 (1.6%) | 36 (4.7%) |
| 65 to 74 Years | 0 (0.0%) | 54 (26.3%) |
| 75 Years and over | 0 (0.0%) | 16 (16.3%) |
Disability Class: Cognitive Difficulty
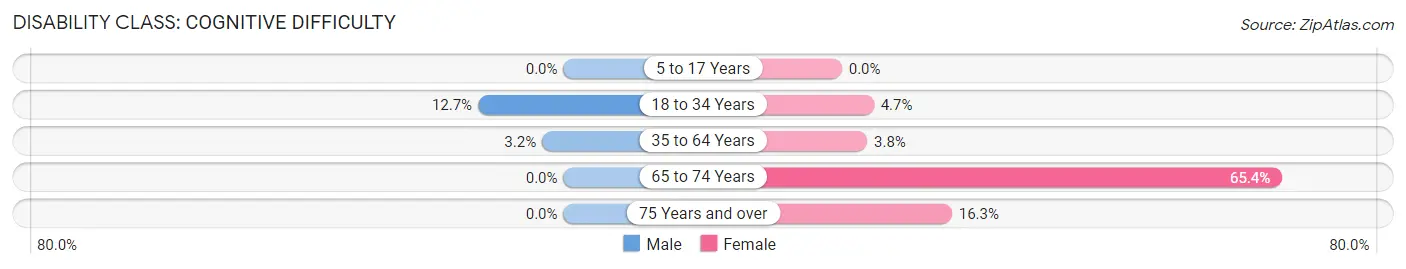
| Age Bracket | Male | Female |
| 5 to 17 Years | 0 (0.0%) | 0 (0.0%) |
| 18 to 34 Years | 87 (12.7%) | 23 (4.7%) |
| 35 to 64 Years | 30 (3.2%) | 29 (3.8%) |
| 65 to 74 Years | 0 (0.0%) | 134 (65.4%) |
| 75 Years and over | 0 (0.0%) | 16 (16.3%) |
Disability Class: Ambulatory Difficulty
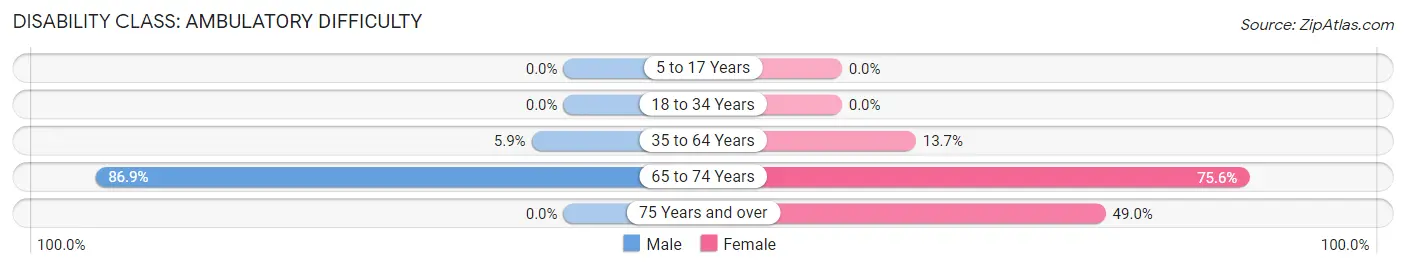
| Age Bracket | Male | Female |
| 5 to 17 Years | 0 (0.0%) | 0 (0.0%) |
| 18 to 34 Years | 0 (0.0%) | 0 (0.0%) |
| 35 to 64 Years | 56 (5.9%) | 106 (13.7%) |
| 65 to 74 Years | 53 (86.9%) | 155 (75.6%) |
| 75 Years and over | 0 (0.0%) | 48 (49.0%) |
Disability Class: Self-Care Difficulty
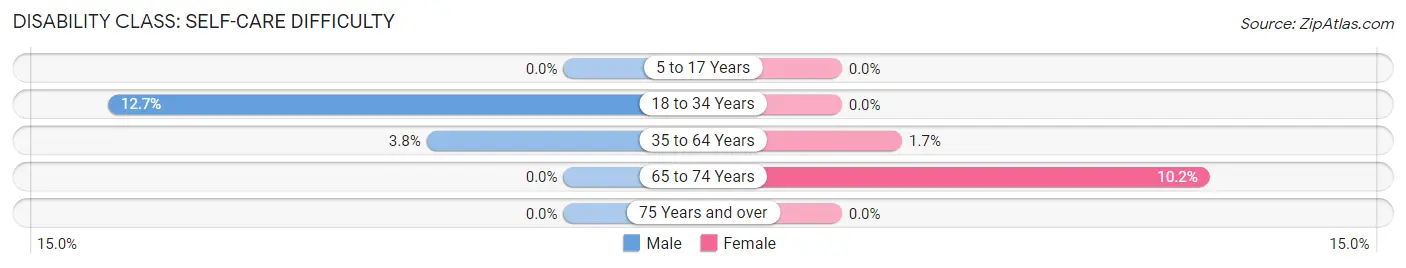
| Age Bracket | Male | Female |
| 5 to 17 Years | 0 (0.0%) | 0 (0.0%) |
| 18 to 34 Years | 87 (12.7%) | 0 (0.0%) |
| 35 to 64 Years | 36 (3.8%) | 13 (1.7%) |
| 65 to 74 Years | 0 (0.0%) | 21 (10.2%) |
| 75 Years and over | 0 (0.0%) | 0 (0.0%) |
Technology Access in Woodruff
Computing Device Access in Woodruff
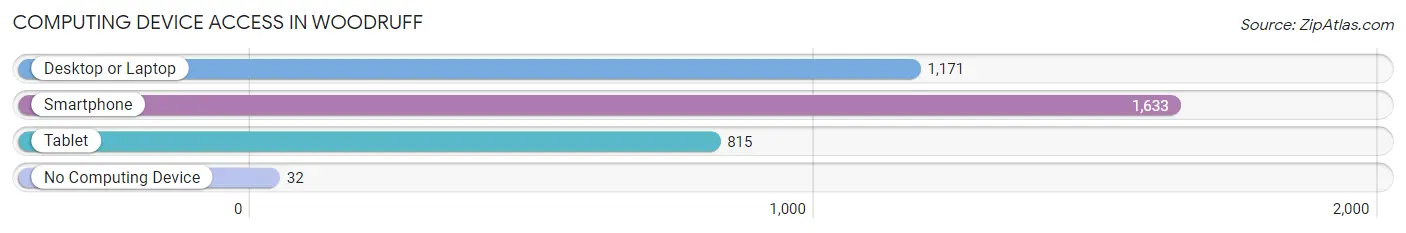
| Device Type | # Households | % Households |
| Desktop or Laptop | 1,171 | 68.0% |
| Smartphone | 1,633 | 94.8% |
| Tablet | 815 | 47.3% |
| No Computing Device | 32 | 1.9% |
| Total | 1,722 | 100.0% |
Internet Access in Woodruff
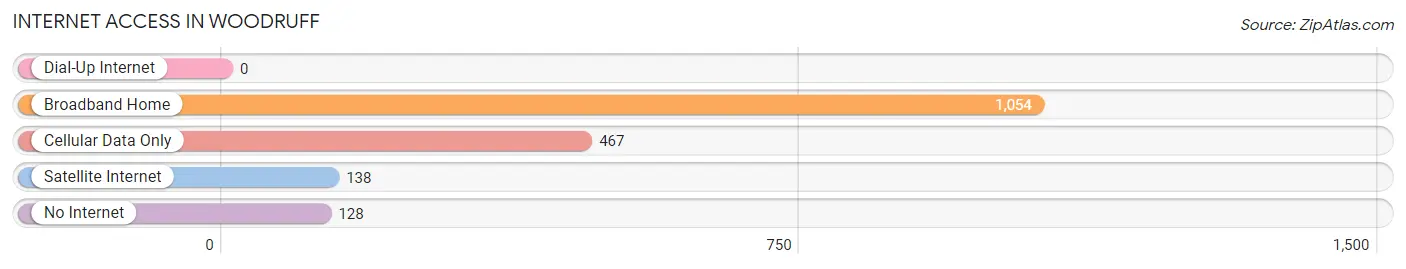
| Internet Type | # Households | % Households |
| Dial-Up Internet | 0 | 0.0% |
| Broadband Home | 1,054 | 61.2% |
| Cellular Data Only | 467 | 27.1% |
| Satellite Internet | 138 | 8.0% |
| No Internet | 128 | 7.4% |
| Total | 1,722 | 100.0% |
Woodruff Summary
History
The town of Woodruff, South Carolina is located in Spartanburg County and is part of the Greenville-Spartanburg-Anderson Combined Statistical Area. The town was founded in 1872 and was named after William H. Woodruff, a prominent local businessman. The town was originally a small farming community, but it has since grown into a thriving suburban area.
The town of Woodruff has a rich history that dates back to the early 19th century. The area was first settled by the Cherokee Indians, who were later forced to move westward during the Indian Removal Act of 1830. The first settlers in the area were mostly of English and Scottish descent. The town was officially incorporated in 1872 and was named after William H. Woodruff, a prominent local businessman.
The town of Woodruff has seen many changes over the years. In the early 1900s, the town was a bustling center of commerce and industry, with several mills and factories located in the area. The town was also home to a large number of textile mills, which provided employment for many of the town’s residents.
In the late 20th century, the town of Woodruff began to experience a period of growth and development. The town was home to several new businesses and industries, including a large shopping center and a number of restaurants. The town also saw an influx of new residents, as many people moved to the area to take advantage of the town’s growing economy.
Geography
Woodruff is located in the northwestern corner of Spartanburg County, South Carolina. The town is situated in the foothills of the Blue Ridge Mountains and is bordered by the cities of Spartanburg, Greer, and Duncan. The town is located approximately 25 miles from the city of Greenville and is part of the Greenville-Spartanburg-Anderson Combined Statistical Area.
The town of Woodruff covers an area of approximately 4.5 square miles and has a population of approximately 5,000 people. The town is located at an elevation of 890 feet above sea level and has a humid subtropical climate. The town experiences hot, humid summers and mild winters.
Economy
The town of Woodruff has a strong and diverse economy. The town is home to several large businesses and industries, including a large shopping center and a number of restaurants. The town is also home to several manufacturing companies, including a large textile mill and a number of other industrial businesses.
The town of Woodruff is also home to several educational institutions, including a community college and a technical college. The town is also home to a number of medical facilities, including a hospital and several clinics.
Demographics
As of the 2010 census, the town of Woodruff had a population of 5,000 people. The town has a population that is predominantly white, with approximately 85% of the population being white. The town also has a large Hispanic population, with approximately 10% of the population being Hispanic. The town also has a small African American population, with approximately 5% of the population being African American.
The town of Woodruff has a median household income of approximately $45,000 and a median home value of approximately $150,000. The town also has a high rate of homeownership, with approximately 75% of the population owning their own homes. The town also has a low unemployment rate, with approximately 4% of the population being unemployed.
Common Questions
What is Per Capita Income in Woodruff?
Per Capita income in Woodruff is $29,436.
What is the Median Family Income in Woodruff?
Median Family Income in Woodruff is $71,212.
What is the Median Household income in Woodruff?
Median Household Income in Woodruff is $68,451.
What is Income or Wage Gap in Woodruff?
Income or Wage Gap in Woodruff is 18.8%.
Women in Woodruff earn 81.2 cents for every dollar earned by a man.
What is Inequality or Gini Index in Woodruff?
Inequality or Gini Index in Woodruff is 0.29.
What is the Total Population of Woodruff?
Total Population of Woodruff is 4,262.
What is the Total Male Population of Woodruff?
Total Male Population of Woodruff is 2,223.
What is the Total Female Population of Woodruff?
Total Female Population of Woodruff is 2,039.
What is the Ratio of Males per 100 Females in Woodruff?
There are 109.02 Males per 100 Females in Woodruff.
What is the Ratio of Females per 100 Males in Woodruff?
There are 91.72 Females per 100 Males in Woodruff.
What is the Median Population Age in Woodruff?
Median Population Age in Woodruff is 37.3 Years.
What is the Average Family Size in Woodruff
Average Family Size in Woodruff is 3.2 People.
What is the Average Household Size in Woodruff
Average Household Size in Woodruff is 2.4 People.
How Large is the Labor Force in Woodruff?
There are 2,301 People in the Labor Forcein in Woodruff.
What is the Percentage of People in the Labor Force in Woodruff?
65.0% of People are in the Labor Force in Woodruff.
What is the Unemployment Rate in Woodruff?
Unemployment Rate in Woodruff is 6.3%.