Startex, SC Map & Demographics
Startex Map
Startex Overview
$21,419
PER CAPITA INCOME
$44,116
AVG FAMILY INCOME
$44,353
AVG HOUSEHOLD INCOME
0.28
INEQUALITY / GINI INDEX
553
TOTAL POPULATION
320
MALE POPULATION
233
FEMALE POPULATION
137.34
MALES / 100 FEMALES
72.81
FEMALES / 100 MALES
50.7
MEDIAN AGE
2.8
AVG FAMILY SIZE
2.7
AVG HOUSEHOLD SIZE
289
LABOR FORCE [ PEOPLE ]
52.3%
PERCENT IN LABOR FORCE
20.8%
UNEMPLOYMENT RATE
Startex Zip Codes
Startex Area Codes
Income in Startex
Income Overview in Startex
Per Capita Income in Startex is $21,419, while median incomes of families and households are $44,116 and $44,353 respectively.
| Characteristic | Number | Measure |
| Per Capita Income | 553 | $21,419 |
| Median Family Income | 193 | $44,116 |
| Mean Family Income | 193 | $54,702 |
| Median Household Income | 204 | $44,353 |
| Mean Household Income | 204 | $54,463 |
| Income Deficit | 193 | $0 |
| Wage / Income Gap (%) | 553 | 0.00% |
| Wage / Income Gap ($) | 553 | 100.00¢ per $1 |
| Gini / Inequality Index | 553 | 0.28 |
Earnings by Sex in Startex
| Sex | Number | Average Earnings |
| Male | 126 (55.0%) | $0 |
| Female | 103 (45.0%) | $0 |
| Total | 229 (100.0%) | $0 |
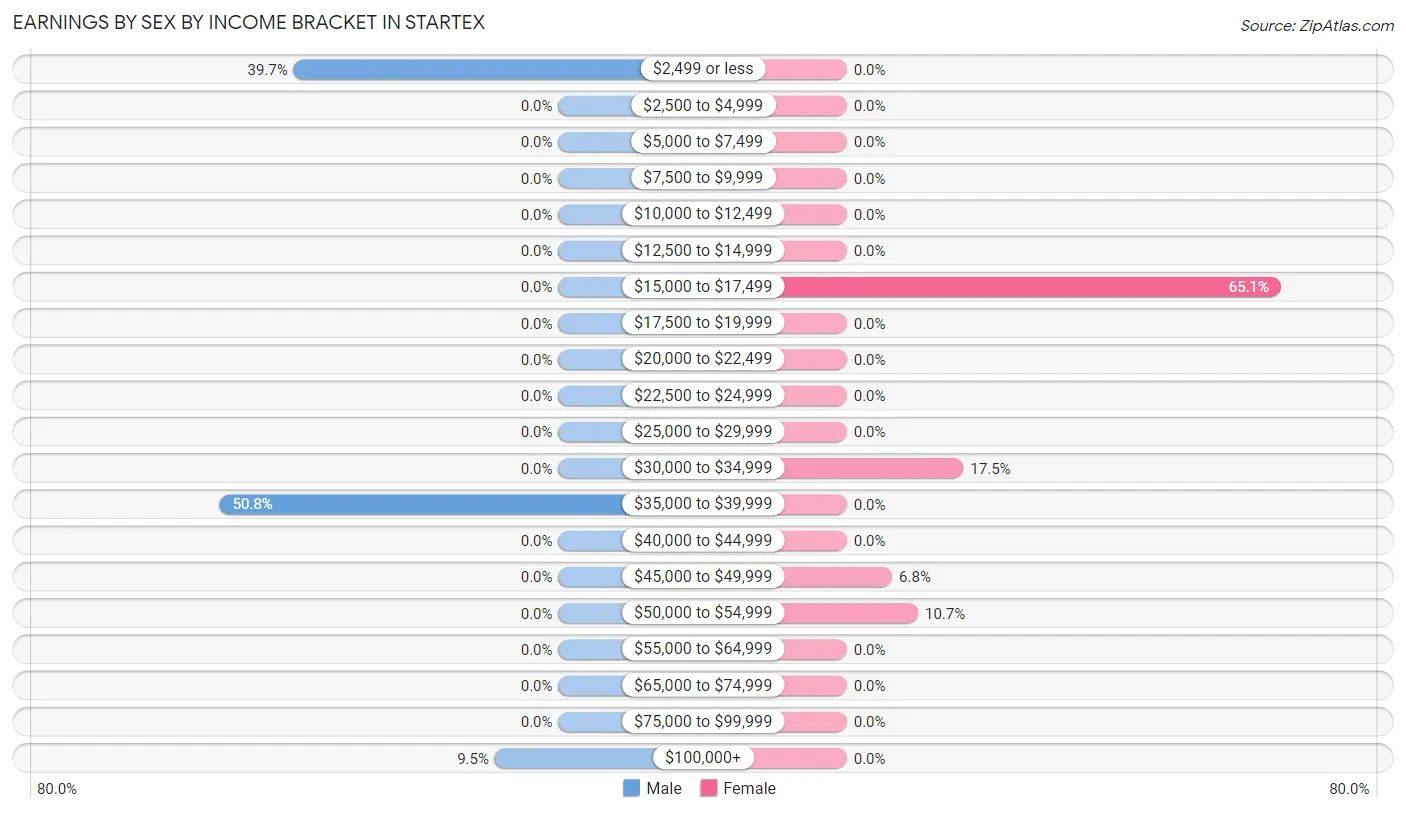
Earnings by Sex by Income Bracket in Startex
The most common earnings brackets in Startex are $35,000 to $39,999 for men (64 | 50.8%) and $15,000 to $17,499 for women (67 | 65.0%).
| Income | Male | Female |
| $2,499 or less | 50 (39.7%) | 0 (0.0%) |
| $2,500 to $4,999 | 0 (0.0%) | 0 (0.0%) |
| $5,000 to $7,499 | 0 (0.0%) | 0 (0.0%) |
| $7,500 to $9,999 | 0 (0.0%) | 0 (0.0%) |
| $10,000 to $12,499 | 0 (0.0%) | 0 (0.0%) |
| $12,500 to $14,999 | 0 (0.0%) | 0 (0.0%) |
| $15,000 to $17,499 | 0 (0.0%) | 67 (65.0%) |
| $17,500 to $19,999 | 0 (0.0%) | 0 (0.0%) |
| $20,000 to $22,499 | 0 (0.0%) | 0 (0.0%) |
| $22,500 to $24,999 | 0 (0.0%) | 0 (0.0%) |
| $25,000 to $29,999 | 0 (0.0%) | 0 (0.0%) |
| $30,000 to $34,999 | 0 (0.0%) | 18 (17.5%) |
| $35,000 to $39,999 | 64 (50.8%) | 0 (0.0%) |
| $40,000 to $44,999 | 0 (0.0%) | 0 (0.0%) |
| $45,000 to $49,999 | 0 (0.0%) | 7 (6.8%) |
| $50,000 to $54,999 | 0 (0.0%) | 11 (10.7%) |
| $55,000 to $64,999 | 0 (0.0%) | 0 (0.0%) |
| $65,000 to $74,999 | 0 (0.0%) | 0 (0.0%) |
| $75,000 to $99,999 | 0 (0.0%) | 0 (0.0%) |
| $100,000+ | 12 (9.5%) | 0 (0.0%) |
| Total | 126 (100.0%) | 103 (100.0%) |
Earnings by Sex by Educational Attainment in Startex
| Educational Attainment | Male Income | Female Income |
| Less than High School | - | - |
| High School Diploma | - | - |
| College or Associate's Degree | - | - |
| Bachelor's Degree | - | - |
| Graduate Degree | - | - |
| Total | $36,484 | $0 |
Family Income in Startex
Family Income Brackets in Startex
According to the Startex family income data, there are 59 families falling into the $25,000 to $34,999 income range, which is the most common income bracket and makes up 30.6% of all families.
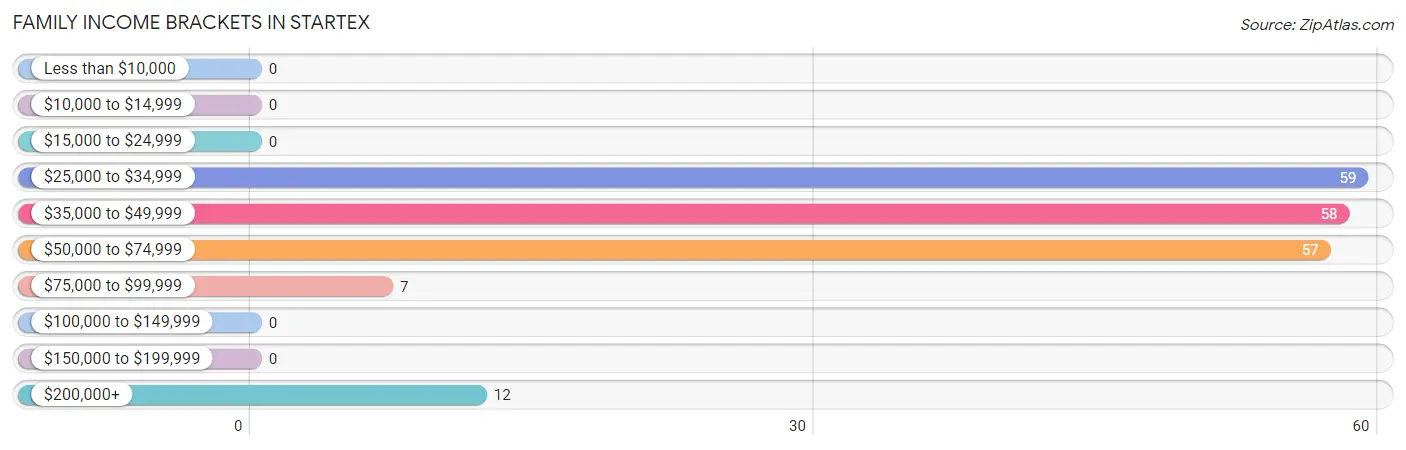
| Income Bracket | # Families | % Families |
| Less than $10,000 | 0 | 0.0% |
| $10,000 to $14,999 | 0 | 0.0% |
| $15,000 to $24,999 | 0 | 0.0% |
| $25,000 to $34,999 | 59 | 30.6% |
| $35,000 to $49,999 | 58 | 30.1% |
| $50,000 to $74,999 | 57 | 29.5% |
| $75,000 to $99,999 | 7 | 3.6% |
| $100,000 to $149,999 | 0 | 0.0% |
| $150,000 to $199,999 | 0 | 0.0% |
| $200,000+ | 12 | 6.2% |
Family Income by Famaliy Size in Startex
3-person families (129 | 66.8%) account for the highest median family income in Startex with $42,737 per family, while 3-person families (129 | 66.8%) have the highest median income of $14,246 per family member.
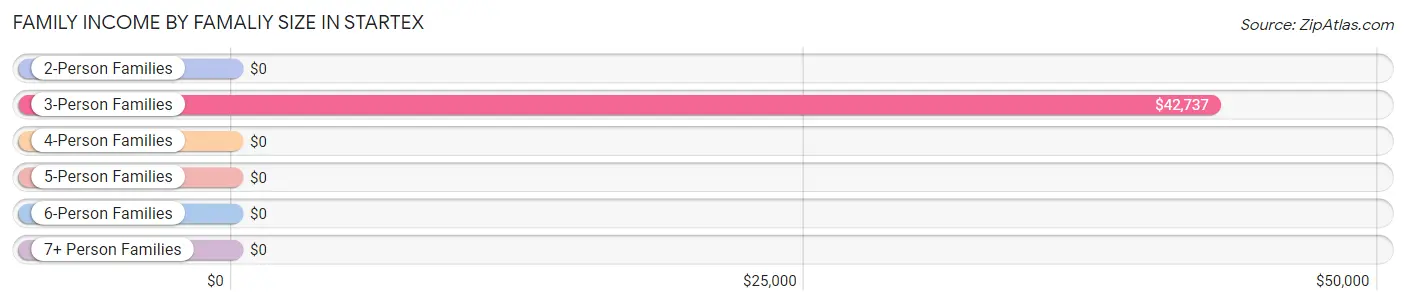
| Income Bracket | # Families | Median Income |
| 2-Person Families | 64 (33.2%) | $0 |
| 3-Person Families | 129 (66.8%) | $42,737 |
| 4-Person Families | 0 (0.0%) | $0 |
| 5-Person Families | 0 (0.0%) | $0 |
| 6-Person Families | 0 (0.0%) | $0 |
| 7+ Person Families | 0 (0.0%) | $0 |
| Total | 193 (100.0%) | $44,116 |
Family Income by Number of Earners in Startex
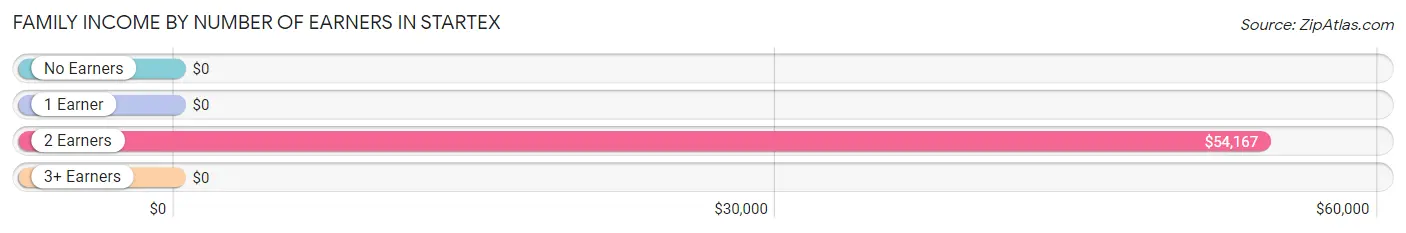
| Number of Earners | # Families | Median Income |
| No Earners | 58 (30.0%) | $0 |
| 1 Earner | 59 (30.6%) | $0 |
| 2 Earners | 76 (39.4%) | $54,167 |
| 3+ Earners | 0 (0.0%) | $0 |
| Total | 193 (100.0%) | $44,116 |
Household Income in Startex
Household Income Brackets in Startex
With 68 households falling in the category, the $50,000 to $74,999 income range is the most frequent in Startex, accounting for 33.3% of all households.
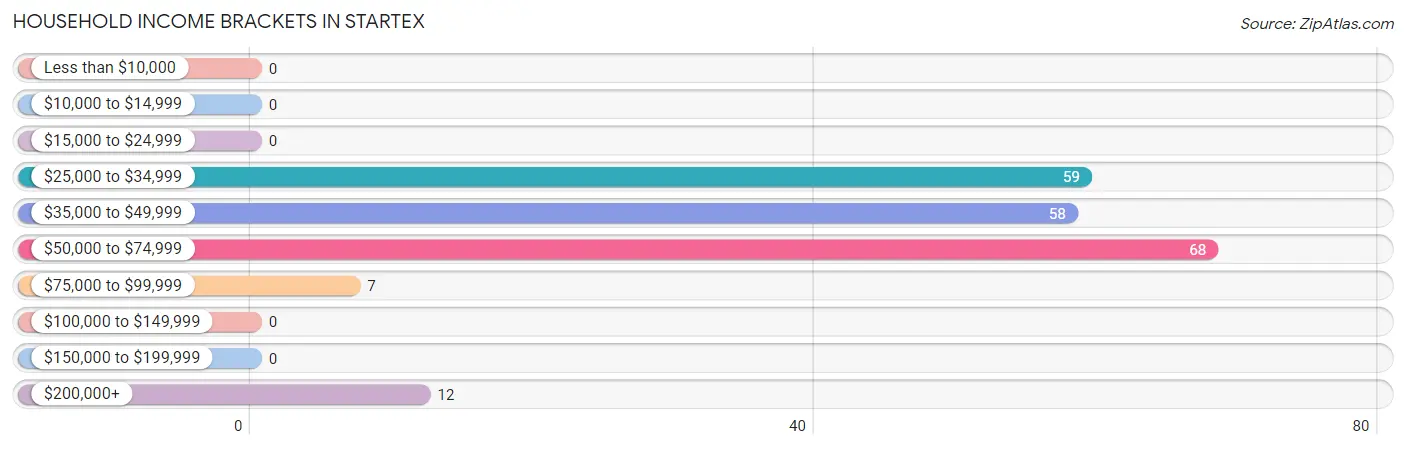
| Income Bracket | # Households | % Households |
| Less than $10,000 | 0 | 0.0% |
| $10,000 to $14,999 | 0 | 0.0% |
| $15,000 to $24,999 | 0 | 0.0% |
| $25,000 to $34,999 | 59 | 28.9% |
| $35,000 to $49,999 | 58 | 28.4% |
| $50,000 to $74,999 | 68 | 33.3% |
| $75,000 to $99,999 | 7 | 3.4% |
| $100,000 to $149,999 | 0 | 0.0% |
| $150,000 to $199,999 | 0 | 0.0% |
| $200,000+ | 12 | 5.9% |
Household Income by Householder Age in Startex
| Income Bracket | # Households | Median Income |
| 15 to 24 Years | 0 (0.0%) | $0 |
| 25 to 44 Years | 18 (8.8%) | $0 |
| 45 to 64 Years | 116 (56.9%) | $0 |
| 65+ Years | 70 (34.3%) | $0 |
| Total | 204 (100.0%) | $44,353 |
Poverty in Startex
Income Below Poverty by Sex and Age in Startex
| Age Bracket | Male | Female |
| Under 5 Years | 0 (0.0%) | 0 (0.0%) |
| 5 Years | 0 (0.0%) | 0 (0.0%) |
| 6 to 11 Years | 0 (0.0%) | 0 (0.0%) |
| 12 to 14 Years | 0 (0.0%) | 0 (0.0%) |
| 15 Years | 0 (0.0%) | 0 (0.0%) |
| 16 and 17 Years | 0 (0.0%) | 0 (0.0%) |
| 18 to 24 Years | 0 (0.0%) | 0 (0.0%) |
| 25 to 34 Years | 0 (0.0%) | 0 (0.0%) |
| 35 to 44 Years | 0 (0.0%) | 0 (0.0%) |
| 45 to 54 Years | 0 (0.0%) | 0 (0.0%) |
| 55 to 64 Years | 0 (0.0%) | 0 (0.0%) |
| 65 to 74 Years | 0 (0.0%) | 0 (0.0%) |
| 75 Years and over | 0 (0.0%) | 0 (0.0%) |
| Total | 0 (0.0%) | 0 (0.0%) |
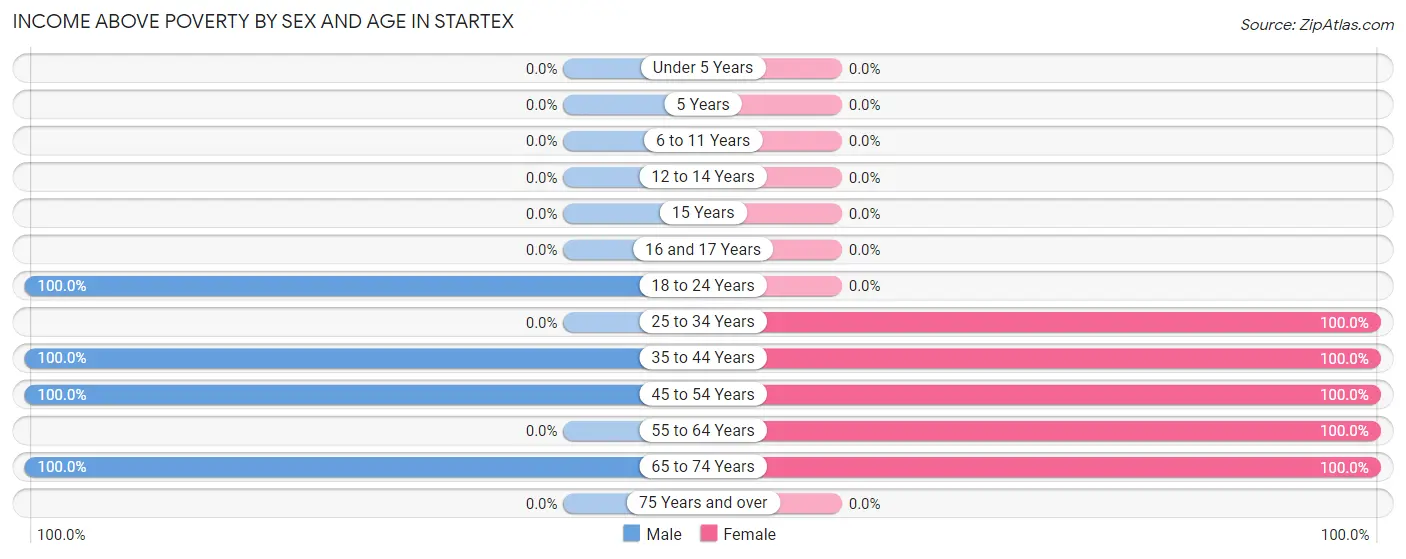
Income Above Poverty by Sex and Age in Startex
According to the poverty statistics in Startex, males aged 18 to 24 years and females aged 25 to 34 years are the age groups that are most secure financially, with 100.0% of males and 100.0% of females in these age groups living above the poverty line.
| Age Bracket | Male | Female |
| Under 5 Years | 0 (0.0%) | 0 (0.0%) |
| 5 Years | 0 (0.0%) | 0 (0.0%) |
| 6 to 11 Years | 0 (0.0%) | 0 (0.0%) |
| 12 to 14 Years | 0 (0.0%) | 0 (0.0%) |
| 15 Years | 0 (0.0%) | 0 (0.0%) |
| 16 and 17 Years | 0 (0.0%) | 0 (0.0%) |
| 18 to 24 Years | 50 (100.0%) | 0 (0.0%) |
| 25 to 34 Years | 0 (0.0%) | 29 (100.0%) |
| 35 to 44 Years | 75 (100.0%) | 7 (100.0%) |
| 45 to 54 Years | 123 (100.0%) | 127 (100.0%) |
| 55 to 64 Years | 0 (0.0%) | 12 (100.0%) |
| 65 to 74 Years | 72 (100.0%) | 58 (100.0%) |
| 75 Years and over | 0 (0.0%) | 0 (0.0%) |
| Total | 320 (100.0%) | 233 (100.0%) |
Income Below Poverty Among Married-Couple Families in Startex
| Children | Above Poverty | Below Poverty |
| No Children | 193 (100.0%) | 0 (0.0%) |
| 1 or 2 Children | 0 (0.0%) | 0 (0.0%) |
| 3 or 4 Children | 0 (0.0%) | 0 (0.0%) |
| 5 or more Children | 0 (0.0%) | 0 (0.0%) |
| Total | 193 (100.0%) | 0 (0.0%) |
Income Below Poverty Among Single-Parent Households in Startex
| Children | Single Father | Single Mother |
| No Children | 0 (0.0%) | 0 (0.0%) |
| 1 or 2 Children | 0 (0.0%) | 0 (0.0%) |
| 3 or 4 Children | 0 (0.0%) | 0 (0.0%) |
| 5 or more Children | 0 (0.0%) | 0 (0.0%) |
| Total | 0 (0.0%) | 0 (0.0%) |
Income Below Poverty Among Married-Couple vs Single-Parent Households in Startex
| Children | Married-Couple Families | Single-Parent Households |
| No Children | 0 (0.0%) | 0 (0.0%) |
| 1 or 2 Children | 0 (0.0%) | 0 (0.0%) |
| 3 or 4 Children | 0 (0.0%) | 0 (0.0%) |
| 5 or more Children | 0 (0.0%) | 0 (0.0%) |
| Total | 0 (0.0%) | 0 (0.0%) |
Race in Startex
The most populous races in Startex are White / Caucasian (418 | 75.6%), Black / African American (124 | 22.4%), and Two or more Races (11 | 2.0%).
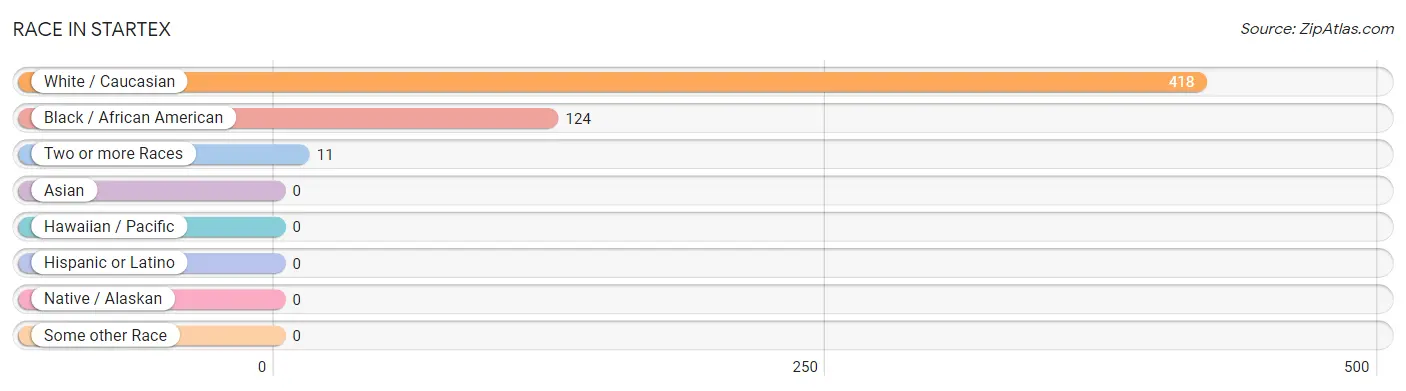
| Race | # Population | % Population |
| Asian | 0 | 0.0% |
| Black / African American | 124 | 22.4% |
| Hawaiian / Pacific | 0 | 0.0% |
| Hispanic or Latino | 0 | 0.0% |
| Native / Alaskan | 0 | 0.0% |
| White / Caucasian | 418 | 75.6% |
| Two or more Races | 11 | 2.0% |
| Some other Race | 0 | 0.0% |
| Total | 553 | 100.0% |
Ancestry in Startex
The most populous ancestries reported in Startex are English (235 | 42.5%), European (14 | 2.5%), Bhutanese (11 | 2.0%), and Indian (Asian) (11 | 2.0%), together accounting for 49.0% of all Startex residents.
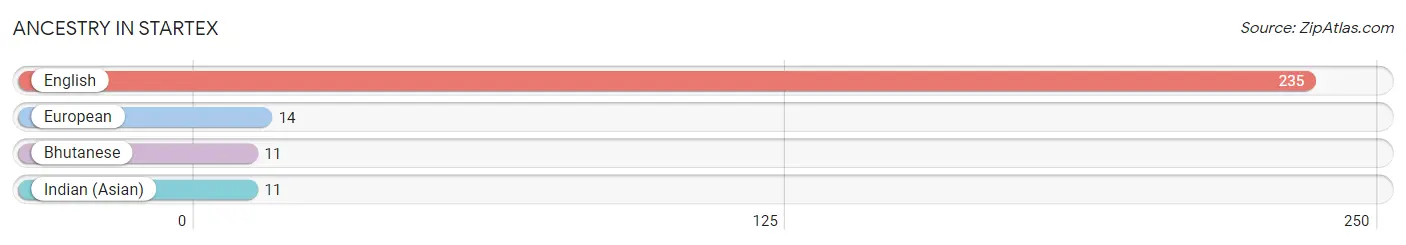
| Ancestry | # Population | % Population |
| Bhutanese | 11 | 2.0% |
| English | 235 | 42.5% |
| European | 14 | 2.5% |
| Indian (Asian) | 11 | 2.0% | View All 4 Rows |
Immigrants in Startex

| Immigration Origin | # Population | % Population | View All 0 Rows |
Sex and Age in Startex
Sex and Age in Startex
The most populous age groups in Startex are 50 to 54 Years (116 | 36.2%) for men and 45 to 49 Years (67 | 28.8%) for women.
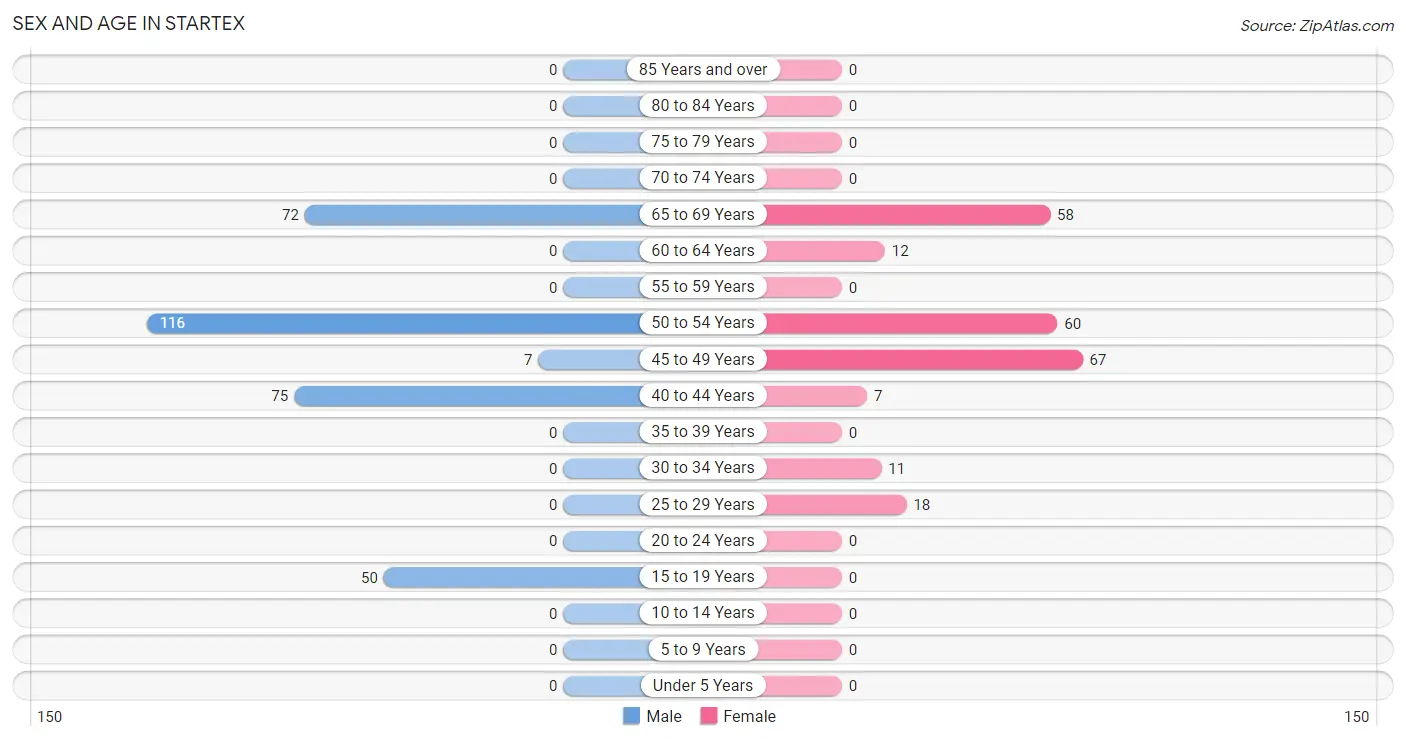
| Age Bracket | Male | Female |
| Under 5 Years | 0 (0.0%) | 0 (0.0%) |
| 5 to 9 Years | 0 (0.0%) | 0 (0.0%) |
| 10 to 14 Years | 0 (0.0%) | 0 (0.0%) |
| 15 to 19 Years | 50 (15.6%) | 0 (0.0%) |
| 20 to 24 Years | 0 (0.0%) | 0 (0.0%) |
| 25 to 29 Years | 0 (0.0%) | 18 (7.7%) |
| 30 to 34 Years | 0 (0.0%) | 11 (4.7%) |
| 35 to 39 Years | 0 (0.0%) | 0 (0.0%) |
| 40 to 44 Years | 75 (23.4%) | 7 (3.0%) |
| 45 to 49 Years | 7 (2.2%) | 67 (28.8%) |
| 50 to 54 Years | 116 (36.2%) | 60 (25.8%) |
| 55 to 59 Years | 0 (0.0%) | 0 (0.0%) |
| 60 to 64 Years | 0 (0.0%) | 12 (5.1%) |
| 65 to 69 Years | 72 (22.5%) | 58 (24.9%) |
| 70 to 74 Years | 0 (0.0%) | 0 (0.0%) |
| 75 to 79 Years | 0 (0.0%) | 0 (0.0%) |
| 80 to 84 Years | 0 (0.0%) | 0 (0.0%) |
| 85 Years and over | 0 (0.0%) | 0 (0.0%) |
| Total | 320 (100.0%) | 233 (100.0%) |
Families and Households in Startex
Median Family Size in Startex
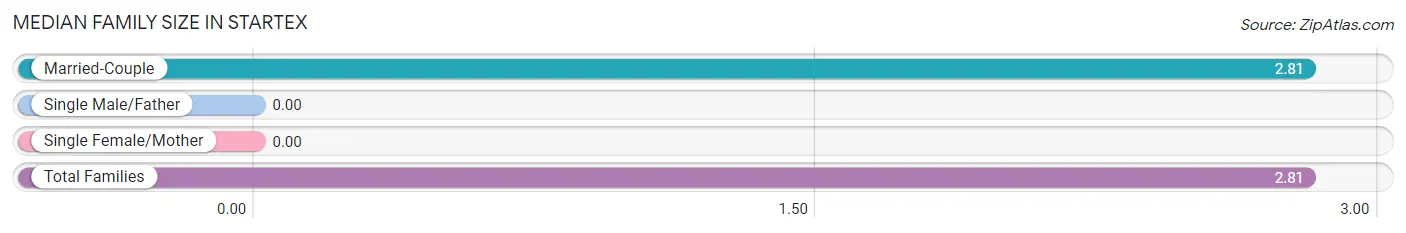
| Family Type | # Families | Family Size |
| Married-Couple | 193 (100.0%) | 2.81 |
| Single Male/Father | 0 (0.0%) | - |
| Single Female/Mother | 0 (0.0%) | - |
| Total Families | 193 (100.0%) | 2.81 |
Median Household Size in Startex
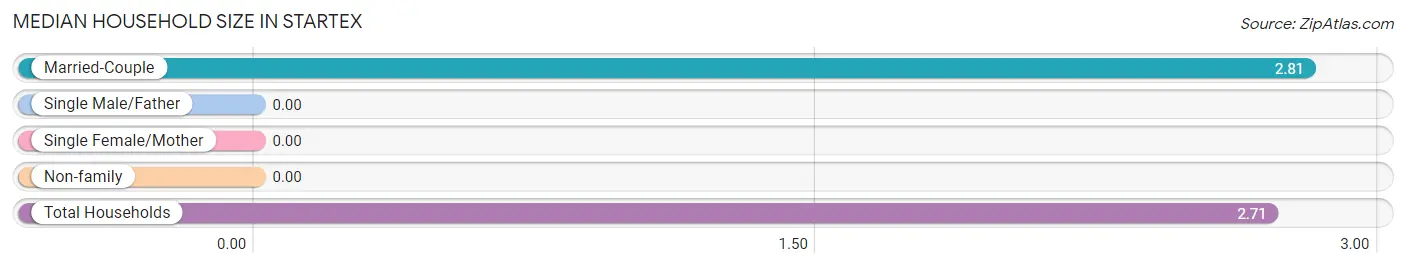
| Household Type | # Households | Household Size |
| Married-Couple | 193 (94.6%) | 2.81 |
| Single Male/Father | 0 (0.0%) | - |
| Single Female/Mother | 0 (0.0%) | - |
| Non-family | 11 (5.4%) | - |
| Total Households | 204 (100.0%) | 2.71 |
Household Size by Marriage Status in Startex
Out of a total of 204 households in Startex, 193 (94.6%) are family households, while 11 (5.4%) are nonfamily households. The most numerous type of family households are 3-person households, comprising 129, and the most common type of nonfamily households are 1-person households, comprising 11.
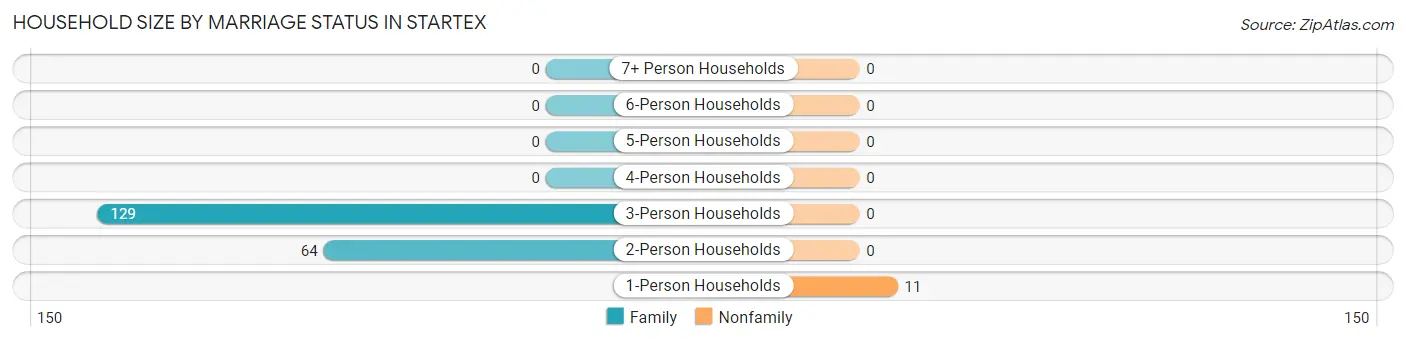
| Household Size | Family Households | Nonfamily Households |
| 1-Person Households | - | 11 (5.4%) |
| 2-Person Households | 64 (31.4%) | 0 (0.0%) |
| 3-Person Households | 129 (63.2%) | 0 (0.0%) |
| 4-Person Households | 0 (0.0%) | 0 (0.0%) |
| 5-Person Households | 0 (0.0%) | 0 (0.0%) |
| 6-Person Households | 0 (0.0%) | 0 (0.0%) |
| 7+ Person Households | 0 (0.0%) | 0 (0.0%) |
| Total | 193 (94.6%) | 11 (5.4%) |
Female Fertility in Startex
Fertility by Age in Startex
| Age Bracket | Women with Births | Births / 1,000 Women |
| 15 to 19 years | 0 (0.0%) | 0.0 |
| 20 to 34 years | 0 (0.0%) | 0.0 |
| 35 to 50 years | 0 (0.0%) | 0.0 |
| Total | 0 (0.0%) | 0.0 |
Fertility by Age by Marriage Status in Startex
| Age Bracket | Married | Unmarried |
| 15 to 19 years | 0 (0.0%) | 0 (0.0%) |
| 20 to 34 years | 0 (0.0%) | 0 (0.0%) |
| 35 to 50 years | 0 (0.0%) | 0 (0.0%) |
| Total | 0 (0.0%) | 0 (0.0%) |
Fertility by Education in Startex
| Educational Attainment | Women with Births | Births / 1,000 Women |
| Less than High School | 0 (0.0%) | 0.0 |
| High School Diploma | 0 (0.0%) | 0.0 |
| College or Associate's Degree | 0 (0.0%) | 0.0 |
| Bachelor's Degree | 0 (0.0%) | 0.0 |
| Graduate Degree | 0 (0.0%) | 0.0 |
| Total | 0 (0.0%) | 0.0 |
Fertility by Education by Marriage Status in Startex
| Educational Attainment | Married | Unmarried |
| Less than High School | 0 (0.0%) | 0 (0.0%) |
| High School Diploma | 0 (0.0%) | 0 (0.0%) |
| College or Associate's Degree | 0 (0.0%) | 0 (0.0%) |
| Bachelor's Degree | 0 (0.0%) | 0 (0.0%) |
| Graduate Degree | 0 (0.0%) | 0 (0.0%) |
| Total | 0 (0.0%) | 0 (0.0%) |
Employment Characteristics in Startex
Employment by Class of Employer in Startex
Among the 218 employed individuals in Startex, private company employees (199 | 91.3%), and local government employees (19 | 8.7%) make up the most common classes of employment.
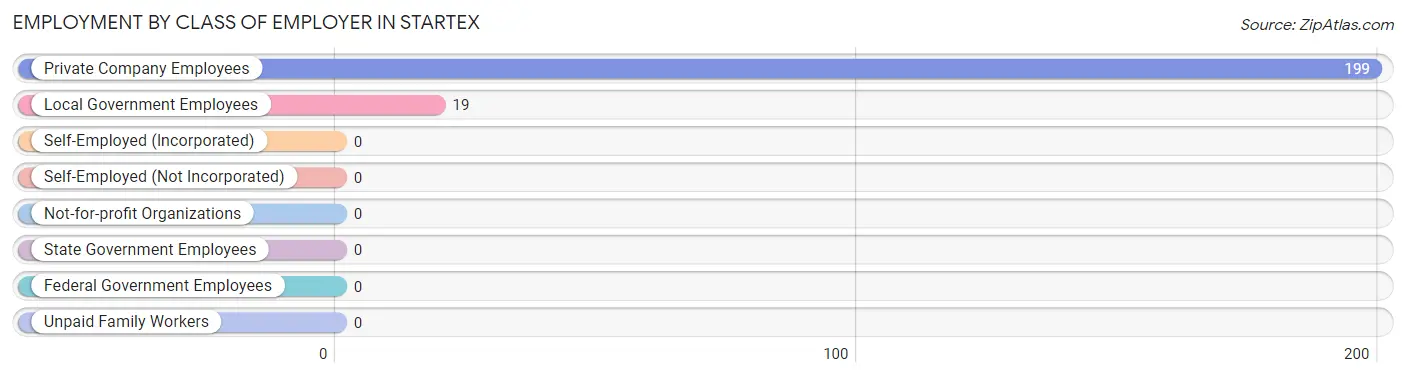
| Employer Class | # Employees | % Employees |
| Private Company Employees | 199 | 91.3% |
| Self-Employed (Incorporated) | 0 | 0.0% |
| Self-Employed (Not Incorporated) | 0 | 0.0% |
| Not-for-profit Organizations | 0 | 0.0% |
| Local Government Employees | 19 | 8.7% |
| State Government Employees | 0 | 0.0% |
| Federal Government Employees | 0 | 0.0% |
| Unpaid Family Workers | 0 | 0.0% |
| Total | 218 | 100.0% |
Employment Status by Age in Startex
According to the labor force statistics for Startex, out of the total population over 16 years of age (553), 52.3% or 289 individuals are in the labor force, with 20.8% or 60 of them unemployed. The age group with the highest labor force participation rate is 16 to 19 years, with 100.0% or 50 individuals in the labor force. Within the labor force, the 45 to 54 years age range has the highest percentage of unemployed individuals, with 31.4% or 60 of them being unemployed.
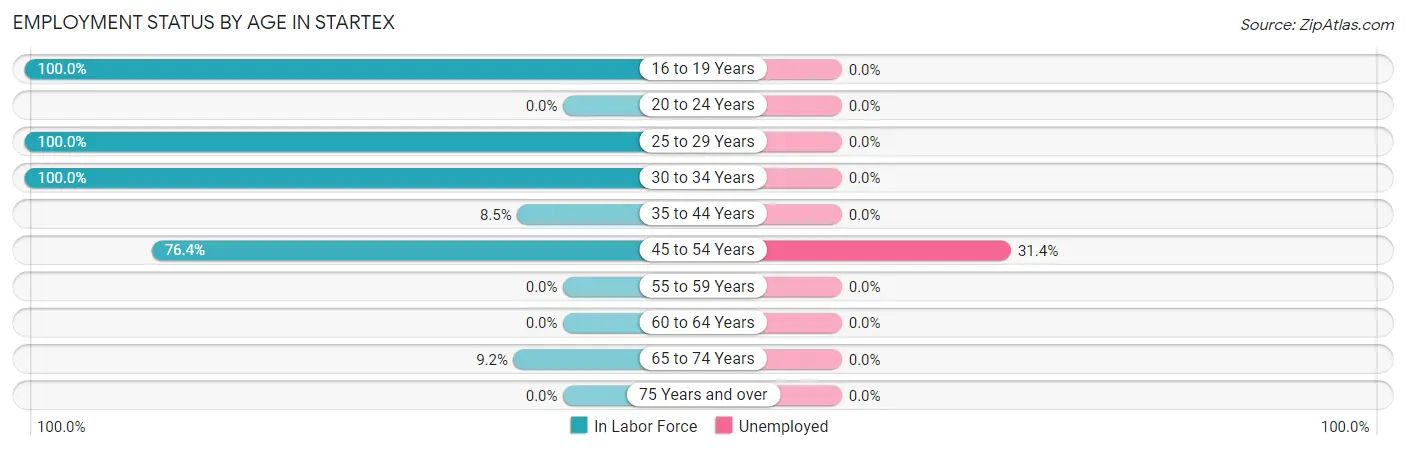
| Age Bracket | In Labor Force | Unemployed |
| 16 to 19 Years | 50 (100.0%) | 0 (0.0%) |
| 20 to 24 Years | 0 (0.0%) | 0 (0.0%) |
| 25 to 29 Years | 18 (100.0%) | 0 (0.0%) |
| 30 to 34 Years | 11 (100.0%) | 0 (0.0%) |
| 35 to 44 Years | 7 (8.5%) | 0 (0.0%) |
| 45 to 54 Years | 191 (76.4%) | 60 (31.4%) |
| 55 to 59 Years | 0 (0.0%) | 0 (0.0%) |
| 60 to 64 Years | 0 (0.0%) | 0 (0.0%) |
| 65 to 74 Years | 12 (9.2%) | 0 (0.0%) |
| 75 Years and over | 0 (0.0%) | 0 (0.0%) |
| Total | 289 (52.3%) | 60 (20.8%) |
Employment Status by Educational Attainment in Startex
According to labor force statistics for Startex, 60.9% of individuals (227) out of the total population between 25 and 64 years of age (373) are in the labor force, with 26.4% or 60 of them being unemployed. The group with the highest labor force participation rate are those with the educational attainment of high school diploma, with 100.0% or 57 individuals in the labor force. Within the labor force, individuals with less than high school education have the highest percentage of unemployment, with 47.2% or 60 of them being unemployed.
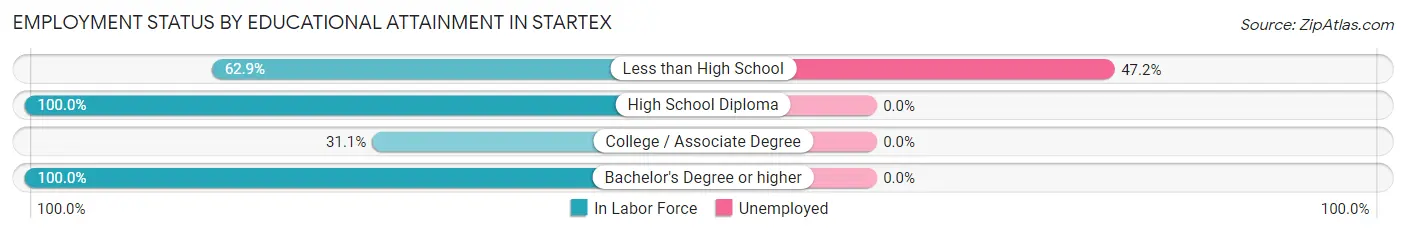
| Educational Attainment | In Labor Force | Unemployed |
| Less than High School | 127 (62.9%) | 95 (47.2%) |
| High School Diploma | 57 (100.0%) | 0 (0.0%) |
| College / Associate Degree | 32 (31.1%) | 0 (0.0%) |
| Bachelor's Degree or higher | 11 (100.0%) | 0 (0.0%) |
| Total | 227 (60.9%) | 98 (26.4%) |
Employment Occupations by Sex in Startex
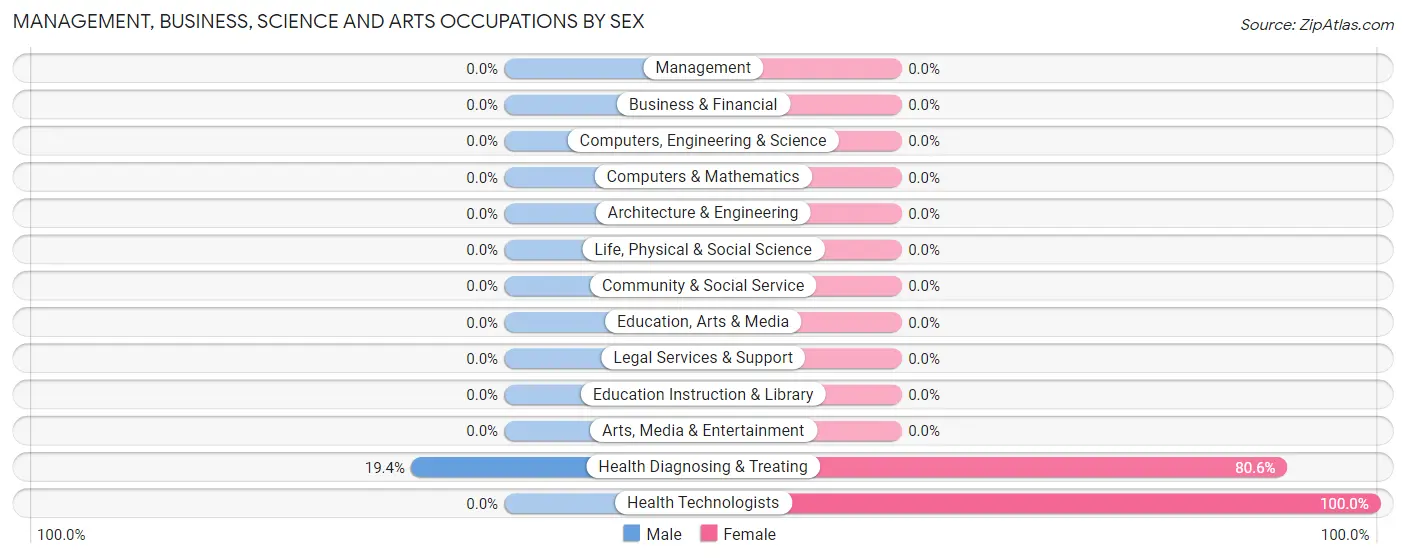
Management, Business, Science and Arts Occupations
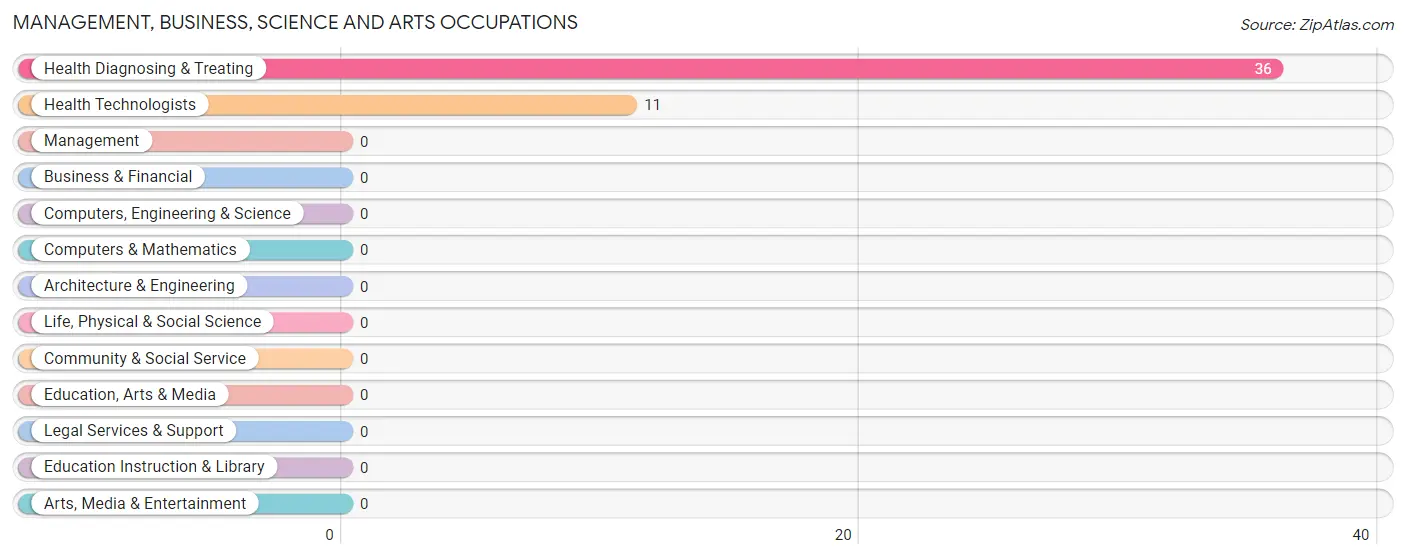
The most common Management, Business, Science and Arts occupations in Startex are Health Diagnosing & Treating (36 | 15.7%), and Health Technologists (11 | 4.8%).
Management, Business, Science and Arts Occupations by Sex
| Occupation | Male | Female |
| Management | 0 (0.0%) | 0 (0.0%) |
| Business & Financial | 0 (0.0%) | 0 (0.0%) |
| Computers, Engineering & Science | 0 (0.0%) | 0 (0.0%) |
| Computers & Mathematics | 0 (0.0%) | 0 (0.0%) |
| Architecture & Engineering | 0 (0.0%) | 0 (0.0%) |
| Life, Physical & Social Science | 0 (0.0%) | 0 (0.0%) |
| Community & Social Service | 0 (0.0%) | 0 (0.0%) |
| Education, Arts & Media | 0 (0.0%) | 0 (0.0%) |
| Legal Services & Support | 0 (0.0%) | 0 (0.0%) |
| Education Instruction & Library | 0 (0.0%) | 0 (0.0%) |
| Arts, Media & Entertainment | 0 (0.0%) | 0 (0.0%) |
| Health Diagnosing & Treating | 7 (19.4%) | 29 (80.6%) |
| Health Technologists | 0 (0.0%) | 11 (100.0%) |
| Total (Category) | 7 (19.4%) | 29 (80.6%) |
| Total (Overall) | 126 (55.0%) | 103 (45.0%) |
Services Occupations
The most common Services occupations in Startex are Food Preparation & Serving (67 | 29.3%), Security & Protection (12 | 5.2%), and Law Enforcement (12 | 5.2%).
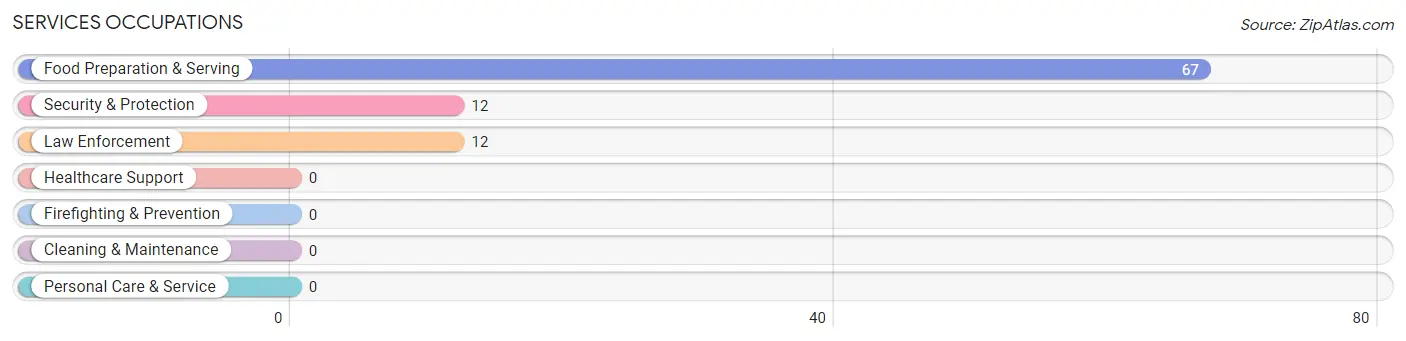
Services Occupations by Sex
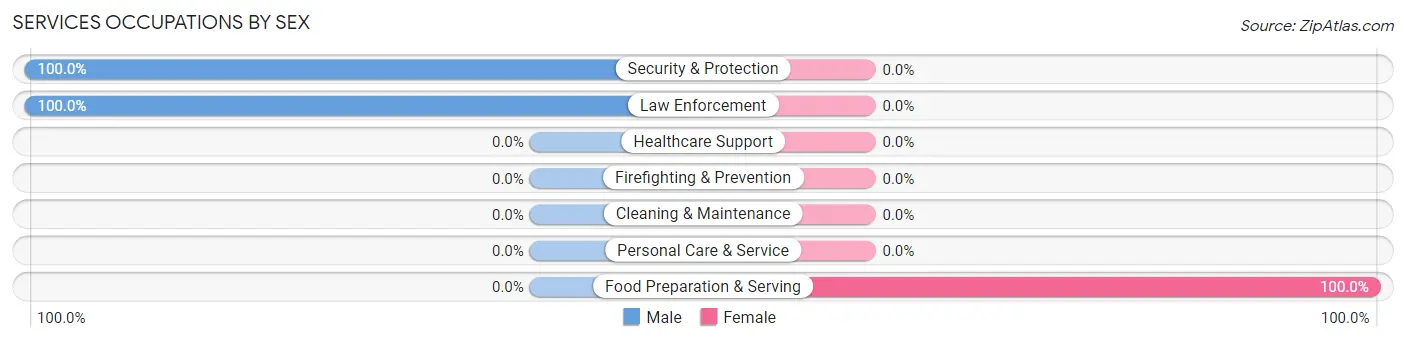
| Occupation | Male | Female |
| Healthcare Support | 0 (0.0%) | 0 (0.0%) |
| Security & Protection | 12 (100.0%) | 0 (0.0%) |
| Firefighting & Prevention | 0 (0.0%) | 0 (0.0%) |
| Law Enforcement | 12 (100.0%) | 0 (0.0%) |
| Food Preparation & Serving | 0 (0.0%) | 67 (100.0%) |
| Cleaning & Maintenance | 0 (0.0%) | 0 (0.0%) |
| Personal Care & Service | 0 (0.0%) | 0 (0.0%) |
| Total (Category) | 12 (15.2%) | 67 (84.8%) |
| Total (Overall) | 126 (55.0%) | 103 (45.0%) |
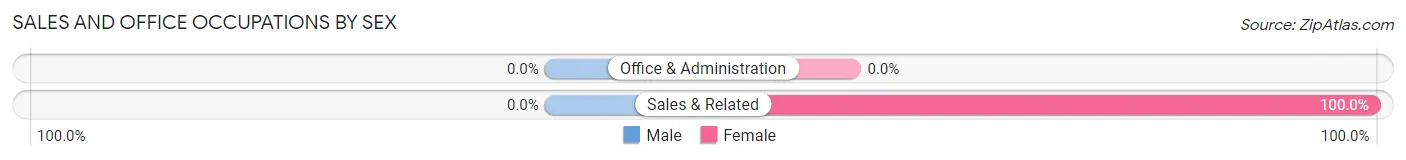
Sales and Office Occupations
The most common Sales and Office occupations in Startex are , and Sales & Related (7 | 3.1%).
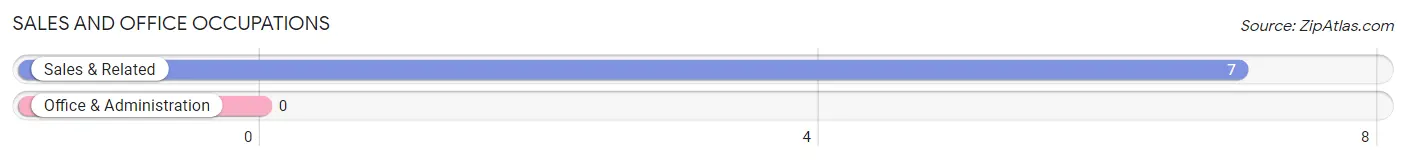
Sales and Office Occupations by Sex
| Occupation | Male | Female |
| Sales & Related | 0 (0.0%) | 7 (100.0%) |
| Office & Administration | 0 (0.0%) | 0 (0.0%) |
| Total (Category) | 0 (0.0%) | 7 (100.0%) |
| Total (Overall) | 126 (55.0%) | 103 (45.0%) |
Natural Resources, Construction and Maintenance Occupations
Natural Resources, Construction and Maintenance Occupations by Sex
| Occupation | Male | Female |
| Farming, Fishing & Forestry | 0 (0.0%) | 0 (0.0%) |
| Construction & Extraction | 0 (0.0%) | 0 (0.0%) |
| Installation, Maintenance & Repair | 0 (0.0%) | 0 (0.0%) |
| Total (Category) | 0 (0.0%) | 0 (0.0%) |
| Total (Overall) | 126 (55.0%) | 103 (45.0%) |
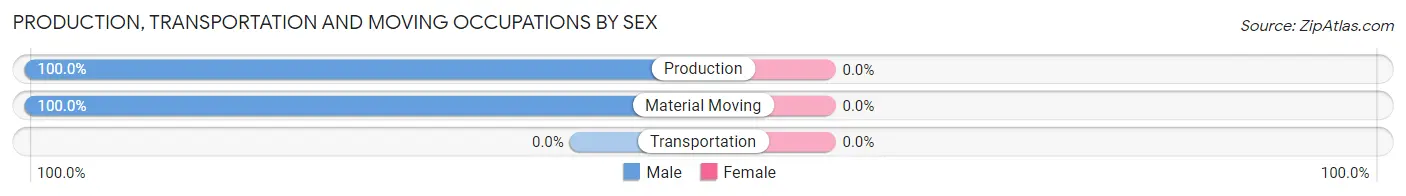
Production, Transportation and Moving Occupations
The most common Production, Transportation and Moving occupations in Startex are Production (57 | 24.9%), and Material Moving (50 | 21.8%).
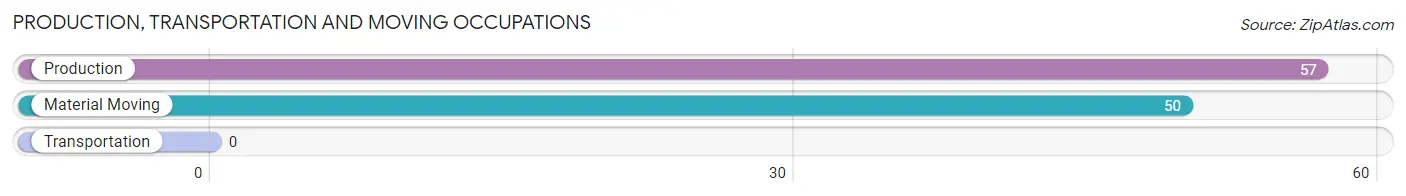
Production, Transportation and Moving Occupations by Sex
| Occupation | Male | Female |
| Production | 57 (100.0%) | 0 (0.0%) |
| Transportation | 0 (0.0%) | 0 (0.0%) |
| Material Moving | 50 (100.0%) | 0 (0.0%) |
| Total (Category) | 107 (100.0%) | 0 (0.0%) |
| Total (Overall) | 126 (55.0%) | 103 (45.0%) |
Employment Industries by Sex in Startex
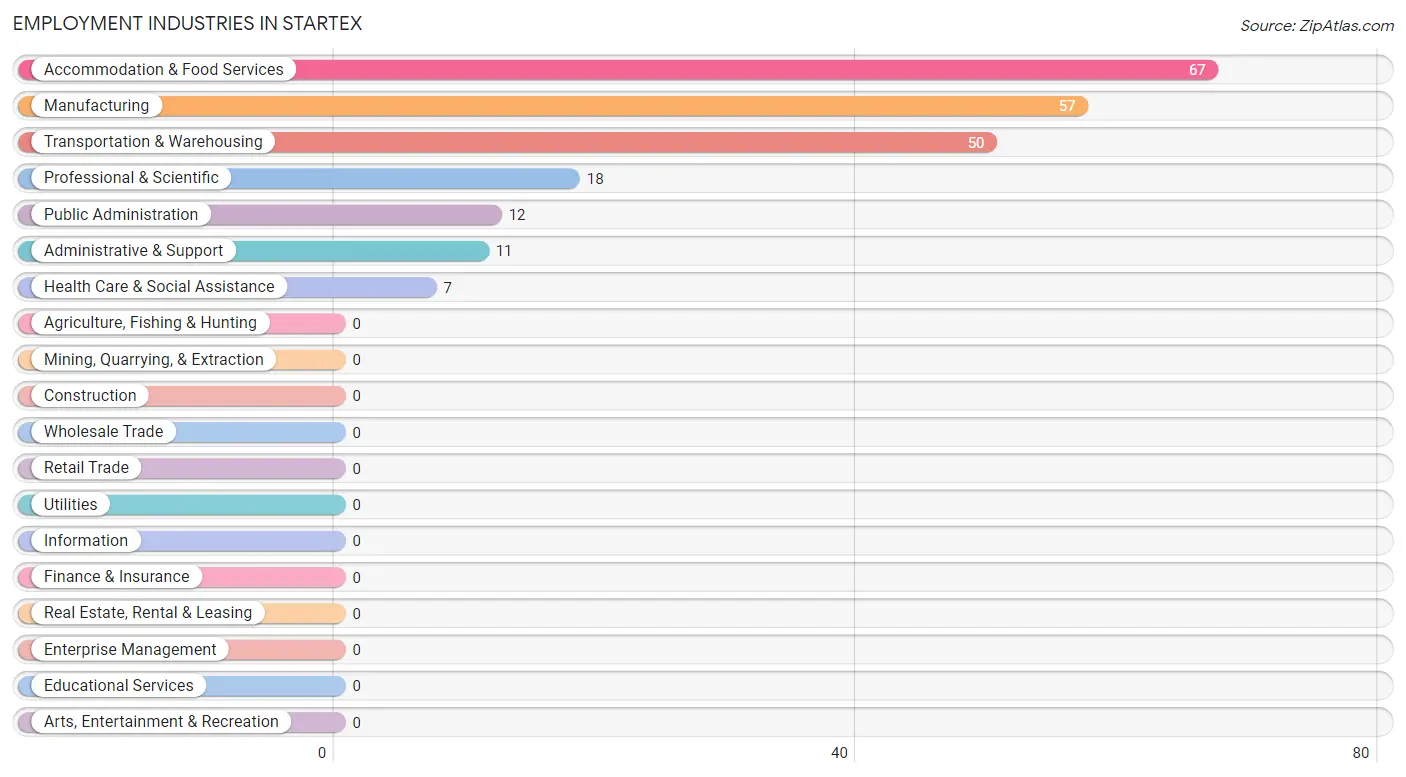
Employment Industries in Startex
The major employment industries in Startex include Accommodation & Food Services (67 | 29.3%), Manufacturing (57 | 24.9%), Transportation & Warehousing (50 | 21.8%), Professional & Scientific (18 | 7.9%), and Public Administration (12 | 5.2%).
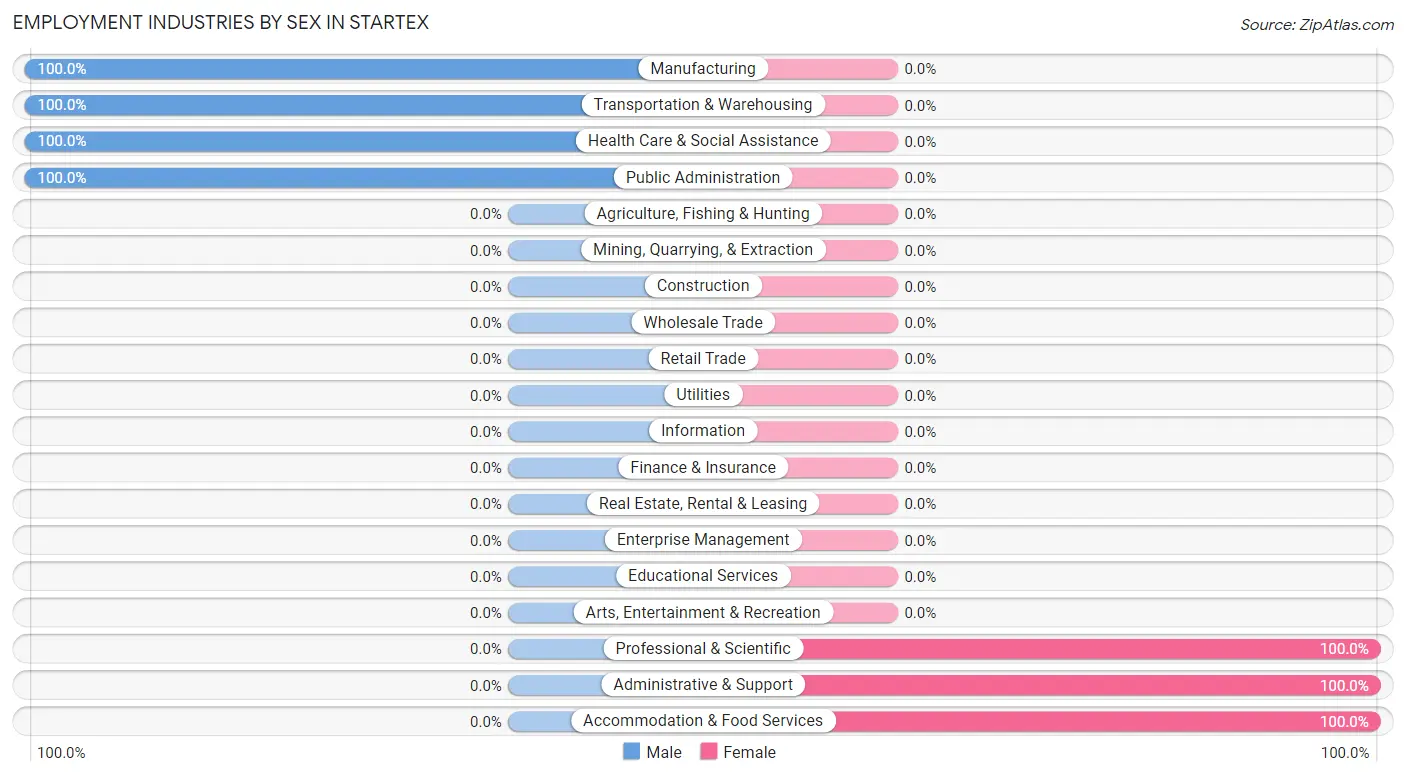
Employment Industries by Sex in Startex
The Startex industries that see more men than women are Manufacturing (100.0%), Transportation & Warehousing (100.0%), and Health Care & Social Assistance (100.0%), whereas the industries that tend to have a higher number of women are Professional & Scientific (100.0%), Administrative & Support (100.0%), and Accommodation & Food Services (100.0%).
| Industry | Male | Female |
| Agriculture, Fishing & Hunting | 0 (0.0%) | 0 (0.0%) |
| Mining, Quarrying, & Extraction | 0 (0.0%) | 0 (0.0%) |
| Construction | 0 (0.0%) | 0 (0.0%) |
| Manufacturing | 57 (100.0%) | 0 (0.0%) |
| Wholesale Trade | 0 (0.0%) | 0 (0.0%) |
| Retail Trade | 0 (0.0%) | 0 (0.0%) |
| Transportation & Warehousing | 50 (100.0%) | 0 (0.0%) |
| Utilities | 0 (0.0%) | 0 (0.0%) |
| Information | 0 (0.0%) | 0 (0.0%) |
| Finance & Insurance | 0 (0.0%) | 0 (0.0%) |
| Real Estate, Rental & Leasing | 0 (0.0%) | 0 (0.0%) |
| Professional & Scientific | 0 (0.0%) | 18 (100.0%) |
| Enterprise Management | 0 (0.0%) | 0 (0.0%) |
| Administrative & Support | 0 (0.0%) | 11 (100.0%) |
| Educational Services | 0 (0.0%) | 0 (0.0%) |
| Health Care & Social Assistance | 7 (100.0%) | 0 (0.0%) |
| Arts, Entertainment & Recreation | 0 (0.0%) | 0 (0.0%) |
| Accommodation & Food Services | 0 (0.0%) | 67 (100.0%) |
| Public Administration | 12 (100.0%) | 0 (0.0%) |
| Total | 126 (55.0%) | 103 (45.0%) |
Education in Startex
School Enrollment in Startex
| School Level | # Students | % Students |
| Nursery / Preschool | 0 | 0.0% |
| Kindergarten | 0 | 0.0% |
| Elementary School | 0 | 0.0% |
| Middle School | 0 | 0.0% |
| High School | 0 | 0.0% |
| College / Undergraduate | 0 | 0.0% |
| Graduate / Professional | 0 | 0.0% |
| Total | 0 | 0.0% |
School Enrollment by Age by Funding Source in Startex
| Age Bracket | Public School | Private School |
| 3 to 4 Year Olds | 0 (0.0%) | 0 (0.0%) |
| 5 to 9 Year Old | 0 (0.0%) | 0 (0.0%) |
| 10 to 14 Year Olds | 0 (0.0%) | 0 (0.0%) |
| 15 to 17 Year Olds | 0 (0.0%) | 0 (0.0%) |
| 18 to 19 Year Olds | 0 (0.0%) | 0 (0.0%) |
| 20 to 24 Year Olds | 0 (0.0%) | 0 (0.0%) |
| 25 to 34 Year Olds | 0 (0.0%) | 0 (0.0%) |
| 35 Years and over | 0 (0.0%) | 0 (0.0%) |
| Total | 0 (0.0%) | 0 (0.0%) |
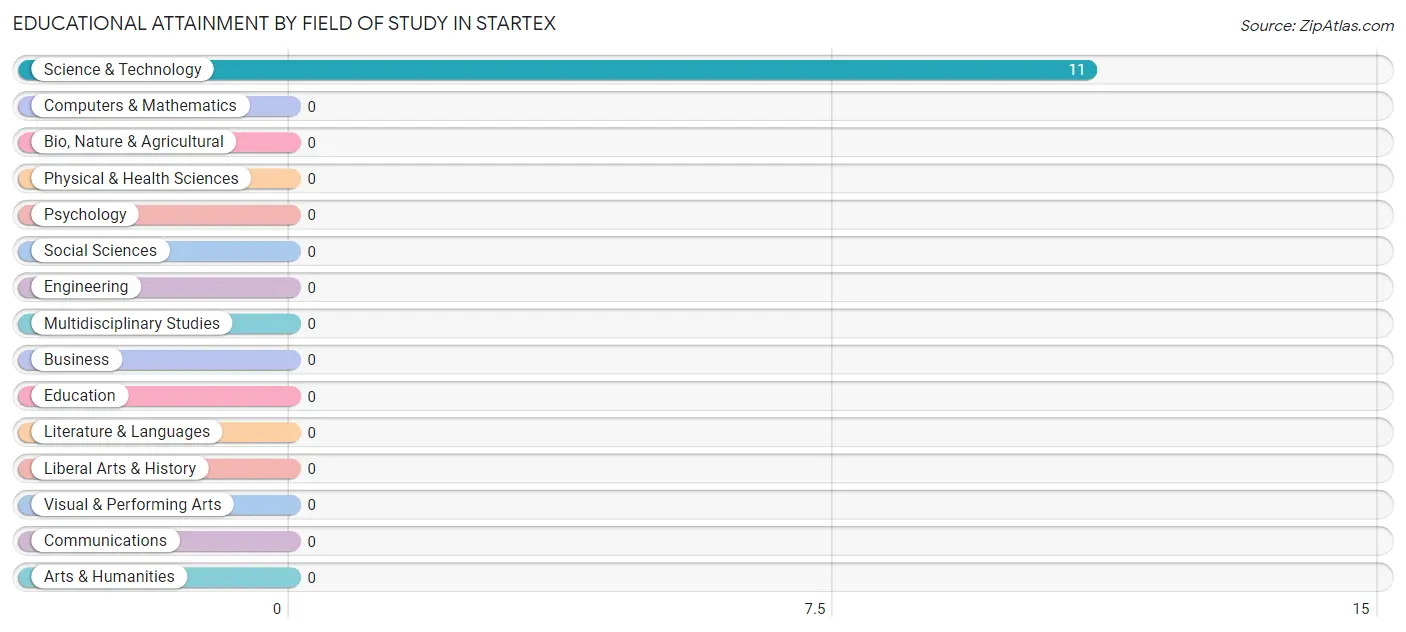
Educational Attainment by Field of Study in Startex
, and science & technology (11 | 100.0%) are the most common fields of study among 11 individuals in Startex who have obtained a bachelor's degree or higher.
| Field of Study | # Graduates | % Graduates |
| Computers & Mathematics | 0 | 0.0% |
| Bio, Nature & Agricultural | 0 | 0.0% |
| Physical & Health Sciences | 0 | 0.0% |
| Psychology | 0 | 0.0% |
| Social Sciences | 0 | 0.0% |
| Engineering | 0 | 0.0% |
| Multidisciplinary Studies | 0 | 0.0% |
| Science & Technology | 11 | 100.0% |
| Business | 0 | 0.0% |
| Education | 0 | 0.0% |
| Literature & Languages | 0 | 0.0% |
| Liberal Arts & History | 0 | 0.0% |
| Visual & Performing Arts | 0 | 0.0% |
| Communications | 0 | 0.0% |
| Arts & Humanities | 0 | 0.0% |
| Total | 11 | 100.0% |
Transportation & Commute in Startex
Vehicle Availability by Sex in Startex
The most prevalent vehicle ownership categories in Startex are males with 2 vehicles (57, accounting for 45.2%) and females with 2 vehicles (67, making up 62.0%).
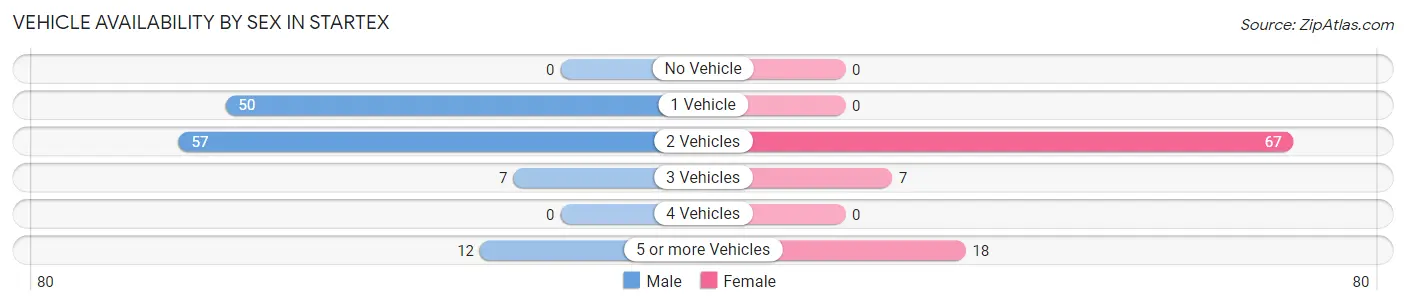
| Vehicles Available | Male | Female |
| No Vehicle | 0 (0.0%) | 0 (0.0%) |
| 1 Vehicle | 50 (39.7%) | 0 (0.0%) |
| 2 Vehicles | 57 (45.2%) | 67 (72.8%) |
| 3 Vehicles | 7 (5.6%) | 7 (7.6%) |
| 4 Vehicles | 0 (0.0%) | 0 (0.0%) |
| 5 or more Vehicles | 12 (9.5%) | 18 (19.6%) |
| Total | 126 (100.0%) | 92 (100.0%) |
Commute Time in Startex
The most frequently occuring commute durations in Startex are 10 to 14 minutes (107 commuters, 49.1%), 20 to 24 minutes (85 commuters, 39.0%), and 15 to 19 minutes (12 commuters, 5.5%).
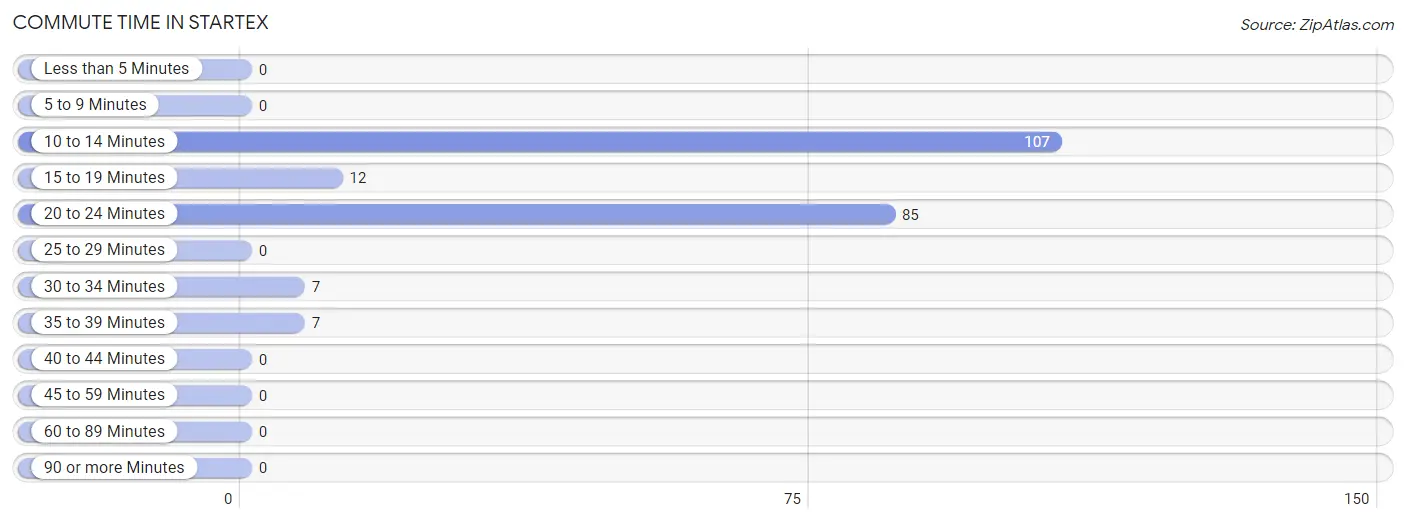
| Commute Time | # Commuters | % Commuters |
| Less than 5 Minutes | 0 | 0.0% |
| 5 to 9 Minutes | 0 | 0.0% |
| 10 to 14 Minutes | 107 | 49.1% |
| 15 to 19 Minutes | 12 | 5.5% |
| 20 to 24 Minutes | 85 | 39.0% |
| 25 to 29 Minutes | 0 | 0.0% |
| 30 to 34 Minutes | 7 | 3.2% |
| 35 to 39 Minutes | 7 | 3.2% |
| 40 to 44 Minutes | 0 | 0.0% |
| 45 to 59 Minutes | 0 | 0.0% |
| 60 to 89 Minutes | 0 | 0.0% |
| 90 or more Minutes | 0 | 0.0% |
Commute Time by Sex in Startex
The most common commute times in Startex are 10 to 14 minutes (107 commuters, 84.9%) for males and 20 to 24 minutes (85 commuters, 92.4%) for females.
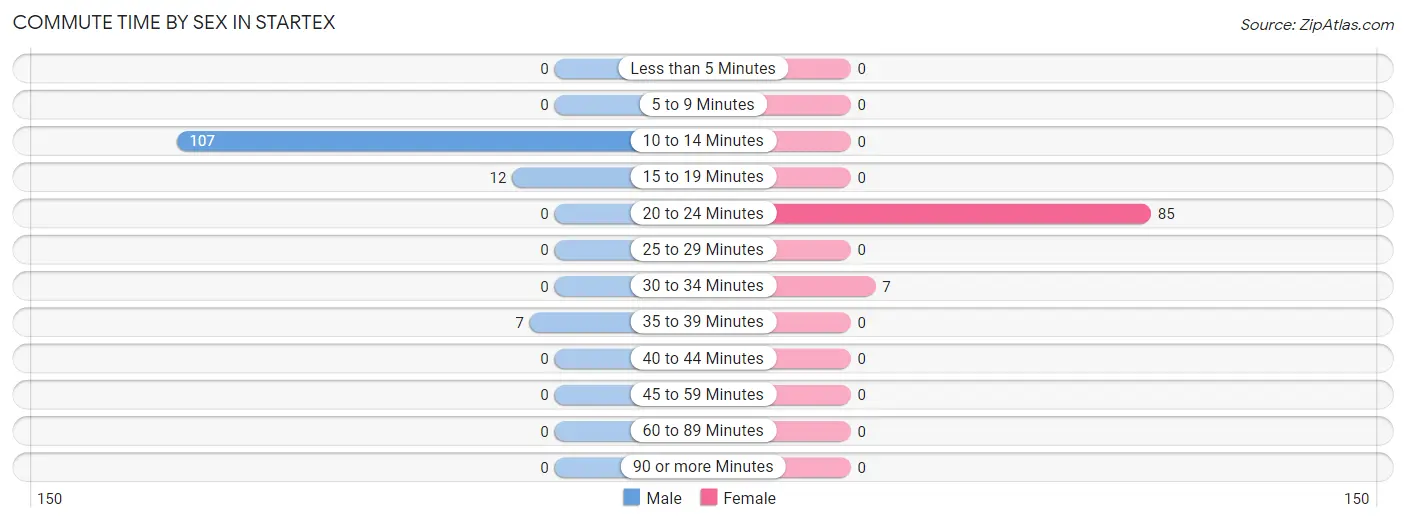
| Commute Time | Male | Female |
| Less than 5 Minutes | 0 (0.0%) | 0 (0.0%) |
| 5 to 9 Minutes | 0 (0.0%) | 0 (0.0%) |
| 10 to 14 Minutes | 107 (84.9%) | 0 (0.0%) |
| 15 to 19 Minutes | 12 (9.5%) | 0 (0.0%) |
| 20 to 24 Minutes | 0 (0.0%) | 85 (92.4%) |
| 25 to 29 Minutes | 0 (0.0%) | 0 (0.0%) |
| 30 to 34 Minutes | 0 (0.0%) | 7 (7.6%) |
| 35 to 39 Minutes | 7 (5.6%) | 0 (0.0%) |
| 40 to 44 Minutes | 0 (0.0%) | 0 (0.0%) |
| 45 to 59 Minutes | 0 (0.0%) | 0 (0.0%) |
| 60 to 89 Minutes | 0 (0.0%) | 0 (0.0%) |
| 90 or more Minutes | 0 (0.0%) | 0 (0.0%) |
Time of Departure to Work by Sex in Startex
The most frequent times of departure to work in Startex are 5:30 AM to 5:59 AM (107, 84.9%) for males and 5:30 AM to 5:59 AM (67, 72.8%) for females.
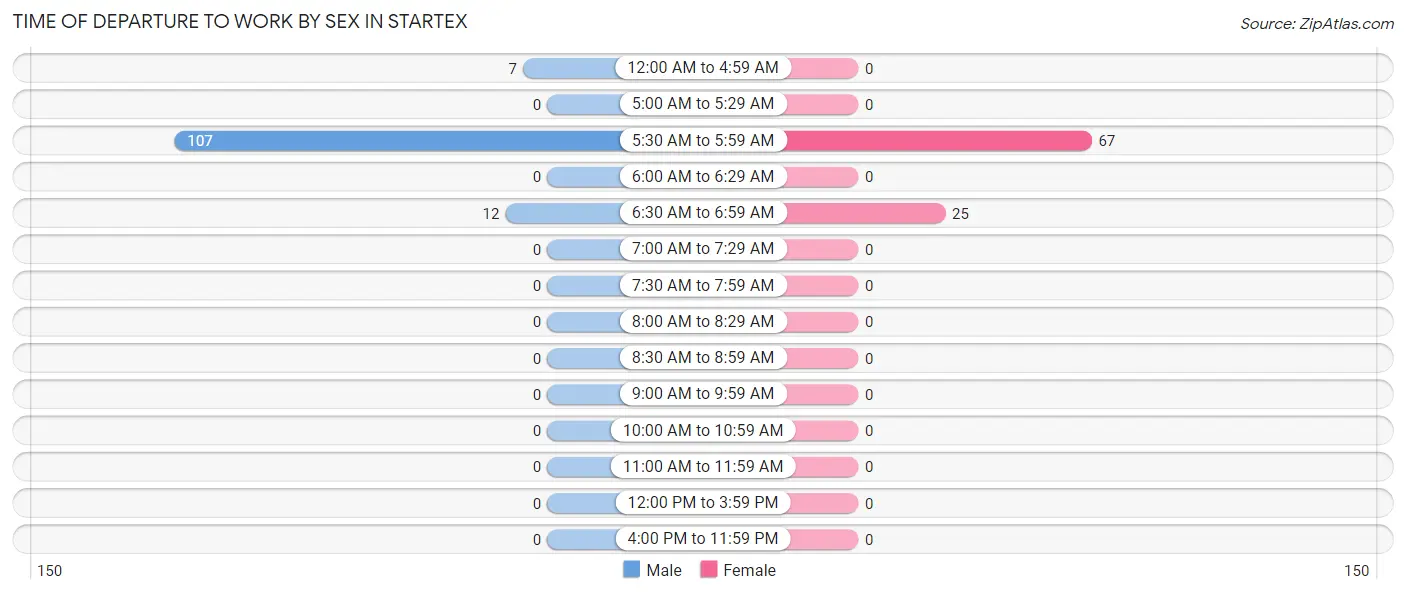
| Time of Departure | Male | Female |
| 12:00 AM to 4:59 AM | 7 (5.6%) | 0 (0.0%) |
| 5:00 AM to 5:29 AM | 0 (0.0%) | 0 (0.0%) |
| 5:30 AM to 5:59 AM | 107 (84.9%) | 67 (72.8%) |
| 6:00 AM to 6:29 AM | 0 (0.0%) | 0 (0.0%) |
| 6:30 AM to 6:59 AM | 12 (9.5%) | 25 (27.2%) |
| 7:00 AM to 7:29 AM | 0 (0.0%) | 0 (0.0%) |
| 7:30 AM to 7:59 AM | 0 (0.0%) | 0 (0.0%) |
| 8:00 AM to 8:29 AM | 0 (0.0%) | 0 (0.0%) |
| 8:30 AM to 8:59 AM | 0 (0.0%) | 0 (0.0%) |
| 9:00 AM to 9:59 AM | 0 (0.0%) | 0 (0.0%) |
| 10:00 AM to 10:59 AM | 0 (0.0%) | 0 (0.0%) |
| 11:00 AM to 11:59 AM | 0 (0.0%) | 0 (0.0%) |
| 12:00 PM to 3:59 PM | 0 (0.0%) | 0 (0.0%) |
| 4:00 PM to 11:59 PM | 0 (0.0%) | 0 (0.0%) |
| Total | 126 (100.0%) | 92 (100.0%) |
Housing Occupancy in Startex
Occupancy by Ownership in Startex
Of the total 204 dwellings in Startex, owner-occupied units account for 12 (5.9%), while renter-occupied units make up 192 (94.1%).
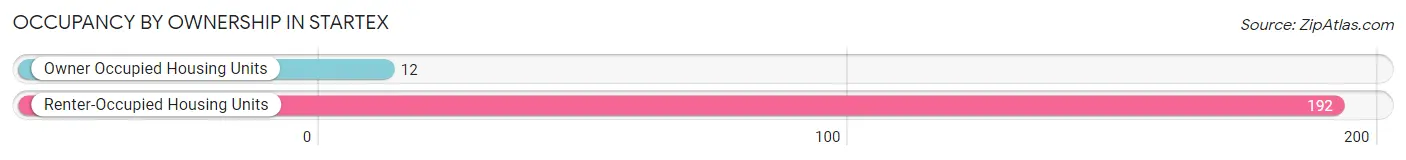
| Occupancy | # Housing Units | % Housing Units |
| Owner Occupied Housing Units | 12 | 5.9% |
| Renter-Occupied Housing Units | 192 | 94.1% |
| Total Occupied Housing Units | 204 | 100.0% |
Occupancy by Household Size in Startex
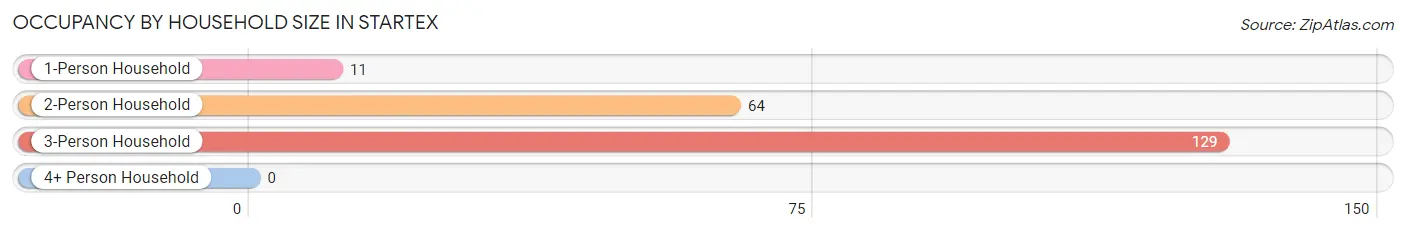
| Household Size | # Housing Units | % Housing Units |
| 1-Person Household | 11 | 5.4% |
| 2-Person Household | 64 | 31.4% |
| 3-Person Household | 129 | 63.2% |
| 4+ Person Household | 0 | 0.0% |
| Total Housing Units | 204 | 100.0% |
Occupancy by Ownership by Household Size in Startex
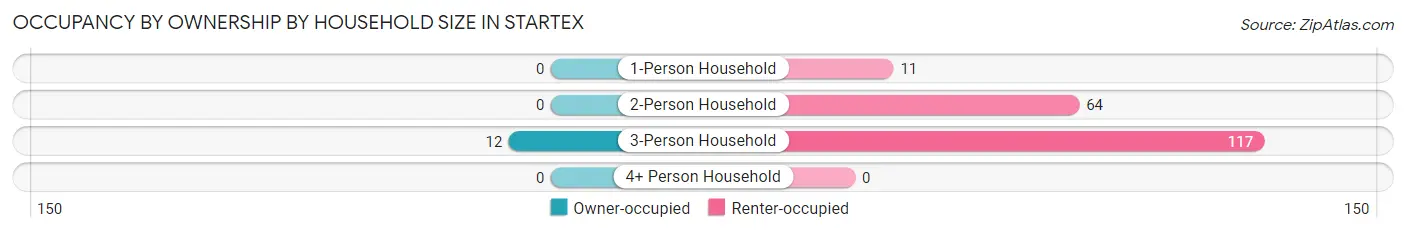
| Household Size | Owner-occupied | Renter-occupied |
| 1-Person Household | 0 (0.0%) | 11 (100.0%) |
| 2-Person Household | 0 (0.0%) | 64 (100.0%) |
| 3-Person Household | 12 (9.3%) | 117 (90.7%) |
| 4+ Person Household | 0 (0.0%) | 0 (0.0%) |
| Total Housing Units | 12 (5.9%) | 192 (94.1%) |
Occupancy by Educational Attainment in Startex
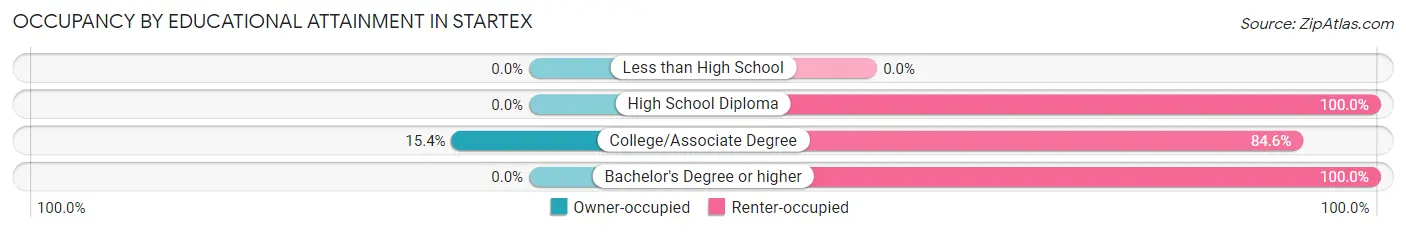
| Household Size | Owner-occupied | Renter-occupied |
| Less than High School | 0 (0.0%) | 0 (0.0%) |
| High School Diploma | 0 (0.0%) | 115 (100.0%) |
| College/Associate Degree | 12 (15.4%) | 66 (84.6%) |
| Bachelor's Degree or higher | 0 (0.0%) | 11 (100.0%) |
Occupancy by Age of Householder in Startex
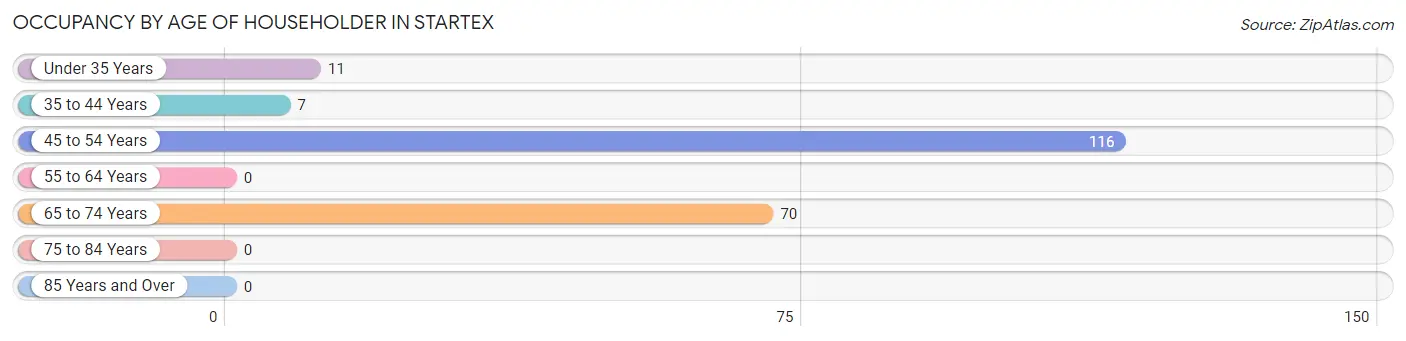
| Age Bracket | # Households | % Households |
| Under 35 Years | 11 | 5.4% |
| 35 to 44 Years | 7 | 3.4% |
| 45 to 54 Years | 116 | 56.9% |
| 55 to 64 Years | 0 | 0.0% |
| 65 to 74 Years | 70 | 34.3% |
| 75 to 84 Years | 0 | 0.0% |
| 85 Years and Over | 0 | 0.0% |
| Total | 204 | 100.0% |
Housing Finances in Startex
Median Income by Occupancy in Startex
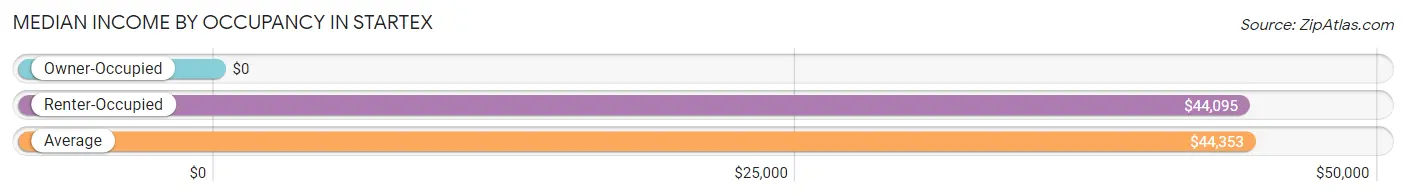
| Occupancy Type | # Households | Median Income |
| Owner-Occupied | 12 (5.9%) | $0 |
| Renter-Occupied | 192 (94.1%) | $44,095 |
| Average | 204 (100.0%) | $44,353 |
Occupancy by Householder Income Bracket in Startex
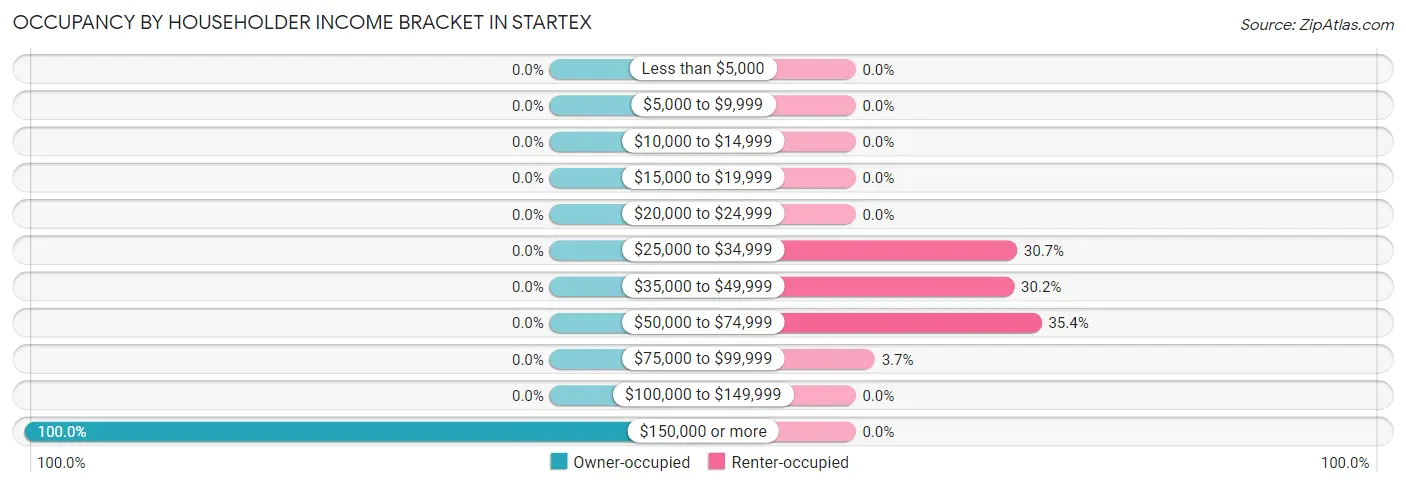
| Income Bracket | Owner-occupied | Renter-occupied |
| Less than $5,000 | 0 (0.0%) | 0 (0.0%) |
| $5,000 to $9,999 | 0 (0.0%) | 0 (0.0%) |
| $10,000 to $14,999 | 0 (0.0%) | 0 (0.0%) |
| $15,000 to $19,999 | 0 (0.0%) | 0 (0.0%) |
| $20,000 to $24,999 | 0 (0.0%) | 0 (0.0%) |
| $25,000 to $34,999 | 0 (0.0%) | 59 (30.7%) |
| $35,000 to $49,999 | 0 (0.0%) | 58 (30.2%) |
| $50,000 to $74,999 | 0 (0.0%) | 68 (35.4%) |
| $75,000 to $99,999 | 0 (0.0%) | 7 (3.6%) |
| $100,000 to $149,999 | 0 (0.0%) | 0 (0.0%) |
| $150,000 or more | 12 (100.0%) | 0 (0.0%) |
| Total | 12 (100.0%) | 192 (100.0%) |
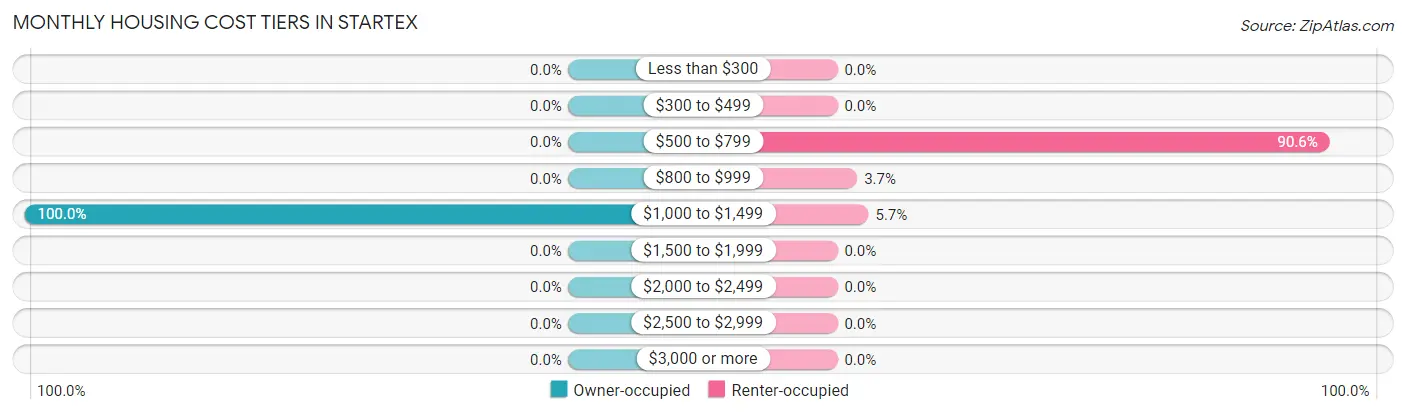
Monthly Housing Cost Tiers in Startex
| Monthly Cost | Owner-occupied | Renter-occupied |
| Less than $300 | 0 (0.0%) | 0 (0.0%) |
| $300 to $499 | 0 (0.0%) | 0 (0.0%) |
| $500 to $799 | 0 (0.0%) | 174 (90.6%) |
| $800 to $999 | 0 (0.0%) | 7 (3.6%) |
| $1,000 to $1,499 | 12 (100.0%) | 11 (5.7%) |
| $1,500 to $1,999 | 0 (0.0%) | 0 (0.0%) |
| $2,000 to $2,499 | 0 (0.0%) | 0 (0.0%) |
| $2,500 to $2,999 | 0 (0.0%) | 0 (0.0%) |
| $3,000 or more | 0 (0.0%) | 0 (0.0%) |
| Total | 12 (100.0%) | 192 (100.0%) |
Physical Housing Characteristics in Startex
Housing Structures in Startex
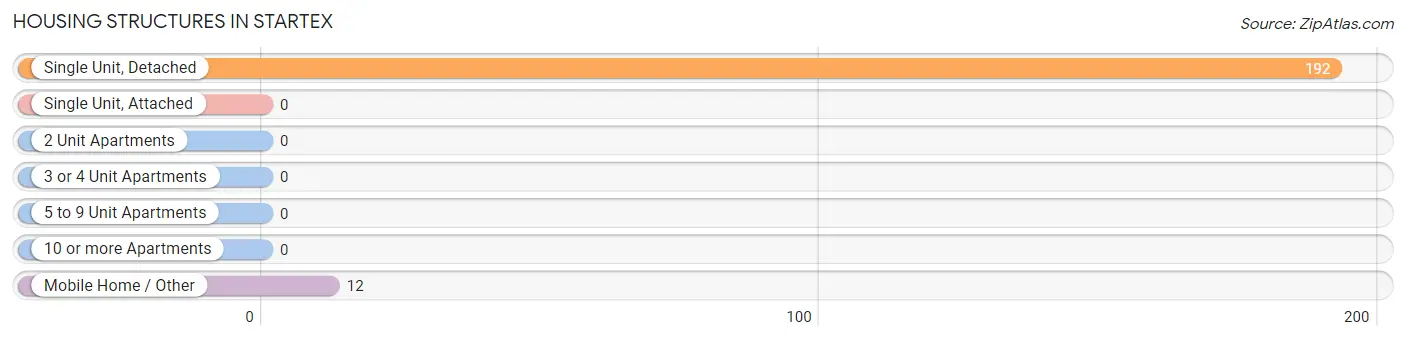
| Structure Type | # Housing Units | % Housing Units |
| Single Unit, Detached | 192 | 94.1% |
| Single Unit, Attached | 0 | 0.0% |
| 2 Unit Apartments | 0 | 0.0% |
| 3 or 4 Unit Apartments | 0 | 0.0% |
| 5 to 9 Unit Apartments | 0 | 0.0% |
| 10 or more Apartments | 0 | 0.0% |
| Mobile Home / Other | 12 | 5.9% |
| Total | 204 | 100.0% |
Housing Structures by Occupancy in Startex
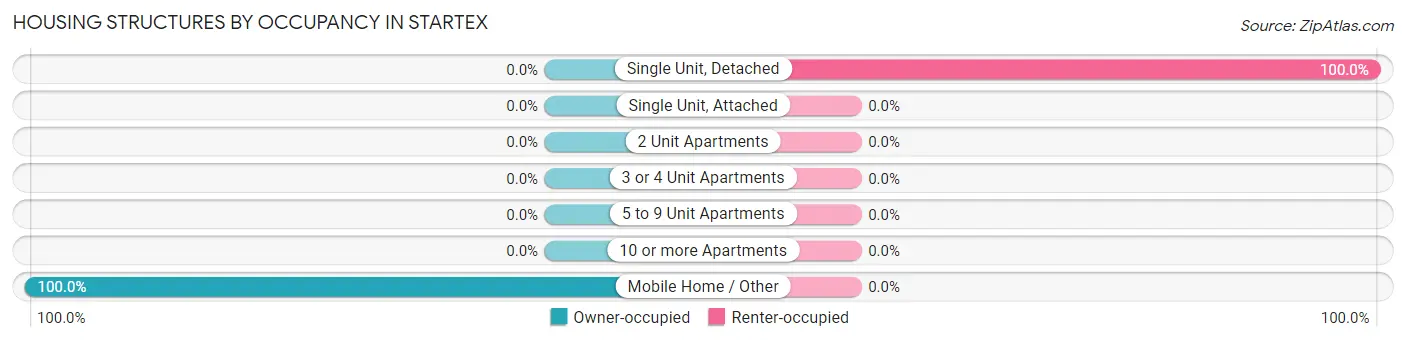
| Structure Type | Owner-occupied | Renter-occupied |
| Single Unit, Detached | 0 (0.0%) | 192 (100.0%) |
| Single Unit, Attached | 0 (0.0%) | 0 (0.0%) |
| 2 Unit Apartments | 0 (0.0%) | 0 (0.0%) |
| 3 or 4 Unit Apartments | 0 (0.0%) | 0 (0.0%) |
| 5 to 9 Unit Apartments | 0 (0.0%) | 0 (0.0%) |
| 10 or more Apartments | 0 (0.0%) | 0 (0.0%) |
| Mobile Home / Other | 12 (100.0%) | 0 (0.0%) |
| Total | 12 (5.9%) | 192 (94.1%) |
Housing Structures by Number of Rooms in Startex
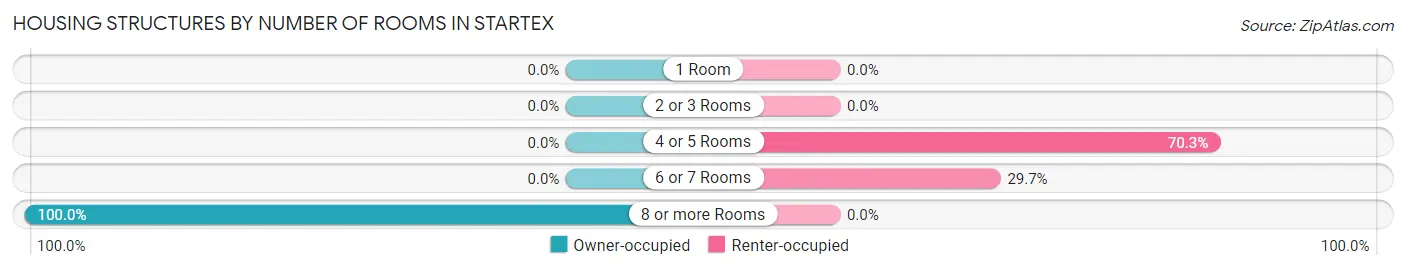
| Number of Rooms | Owner-occupied | Renter-occupied |
| 1 Room | 0 (0.0%) | 0 (0.0%) |
| 2 or 3 Rooms | 0 (0.0%) | 0 (0.0%) |
| 4 or 5 Rooms | 0 (0.0%) | 135 (70.3%) |
| 6 or 7 Rooms | 0 (0.0%) | 57 (29.7%) |
| 8 or more Rooms | 12 (100.0%) | 0 (0.0%) |
| Total | 12 (100.0%) | 192 (100.0%) |
Housing Structure by Heating Type in Startex
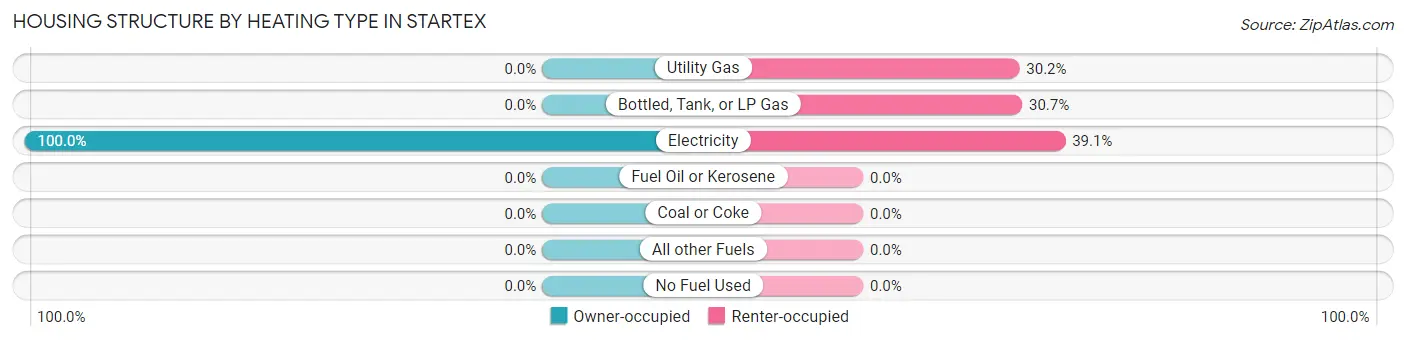
| Heating Type | Owner-occupied | Renter-occupied |
| Utility Gas | 0 (0.0%) | 58 (30.2%) |
| Bottled, Tank, or LP Gas | 0 (0.0%) | 59 (30.7%) |
| Electricity | 12 (100.0%) | 75 (39.1%) |
| Fuel Oil or Kerosene | 0 (0.0%) | 0 (0.0%) |
| Coal or Coke | 0 (0.0%) | 0 (0.0%) |
| All other Fuels | 0 (0.0%) | 0 (0.0%) |
| No Fuel Used | 0 (0.0%) | 0 (0.0%) |
| Total | 12 (100.0%) | 192 (100.0%) |
Household Vehicle Usage in Startex
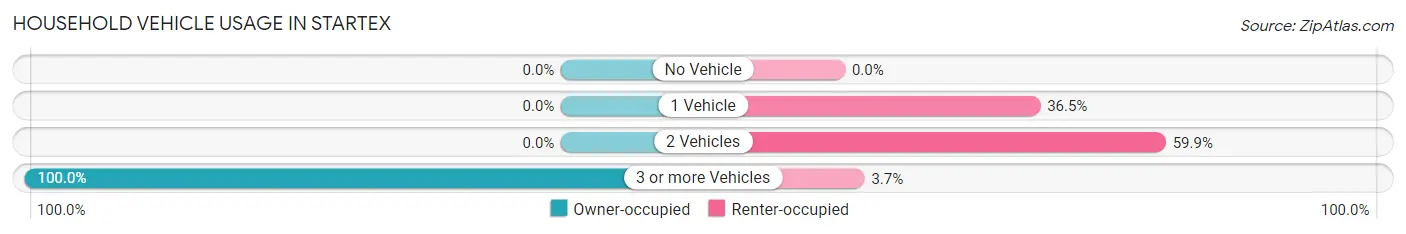
| Vehicles per Household | Owner-occupied | Renter-occupied |
| No Vehicle | 0 (0.0%) | 0 (0.0%) |
| 1 Vehicle | 0 (0.0%) | 70 (36.5%) |
| 2 Vehicles | 0 (0.0%) | 115 (59.9%) |
| 3 or more Vehicles | 12 (100.0%) | 7 (3.6%) |
| Total | 12 (100.0%) | 192 (100.0%) |
Real Estate & Mortgages in Startex
Real Estate and Mortgage Overview in Startex
| Characteristic | Without Mortgage | With Mortgage |
| Housing Units | 0 | 12 |
| Median Property Value | - | - |
| Median Household Income | - | - |
| Monthly Housing Costs | - | - |
| Real Estate Taxes | - | - |
Property Value by Mortgage Status in Startex
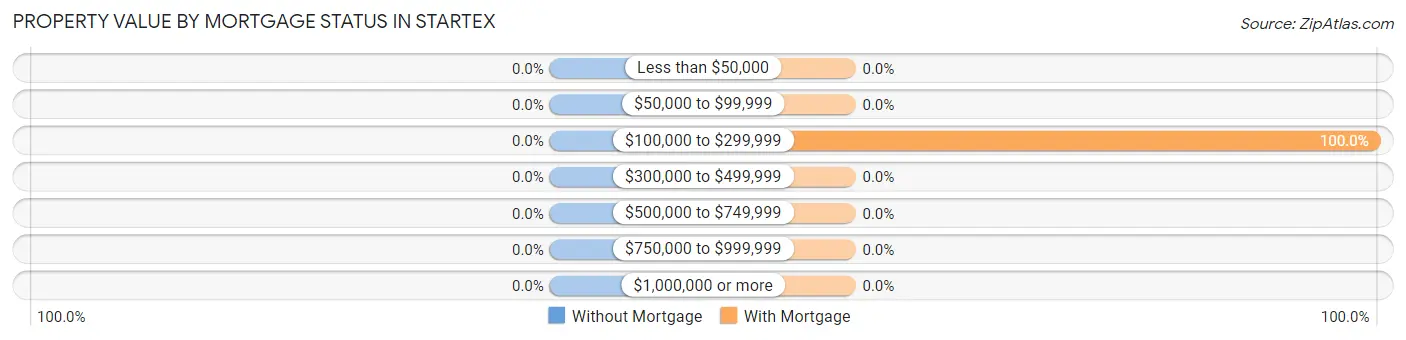
| Property Value | Without Mortgage | With Mortgage |
| Less than $50,000 | 0 (0.0%) | 0 (0.0%) |
| $50,000 to $99,999 | 0 (0.0%) | 0 (0.0%) |
| $100,000 to $299,999 | 0 (0.0%) | 12 (100.0%) |
| $300,000 to $499,999 | 0 (0.0%) | 0 (0.0%) |
| $500,000 to $749,999 | 0 (0.0%) | 0 (0.0%) |
| $750,000 to $999,999 | 0 (0.0%) | 0 (0.0%) |
| $1,000,000 or more | 0 (0.0%) | 0 (0.0%) |
| Total | 0 (0.0%) | 12 (100.0%) |
Household Income by Mortgage Status in Startex
| Household Income | Without Mortgage | With Mortgage |
| Less than $10,000 | 0 (0.0%) | 0 (0.0%) |
| $10,000 to $24,999 | 0 (0.0%) | 0 (0.0%) |
| $25,000 to $34,999 | 0 (0.0%) | 0 (0.0%) |
| $35,000 to $49,999 | 0 (0.0%) | 0 (0.0%) |
| $50,000 to $74,999 | 0 (0.0%) | 0 (0.0%) |
| $75,000 to $99,999 | 0 (0.0%) | 0 (0.0%) |
| $100,000 to $149,999 | 0 (0.0%) | 0 (0.0%) |
| $150,000 or more | 0 (0.0%) | 0 (0.0%) |
| Total | 0 (0.0%) | 12 (100.0%) |
Property Value to Household Income Ratio in Startex
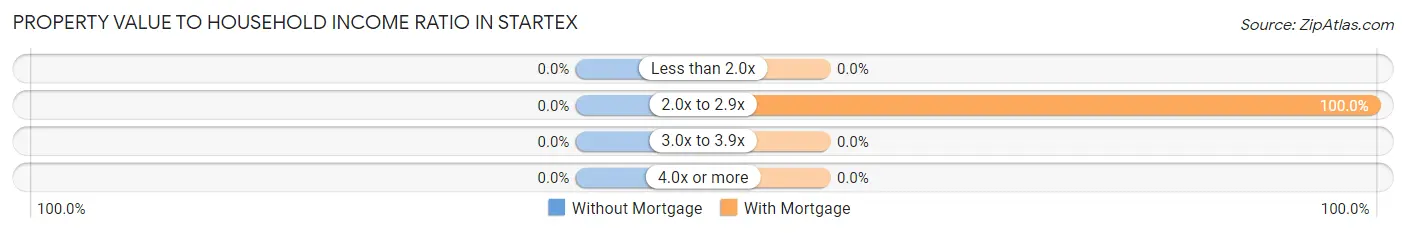
| Value-to-Income Ratio | Without Mortgage | With Mortgage |
| Less than 2.0x | 0 (0.0%) | 0 (0.0%) |
| 2.0x to 2.9x | 0 (0.0%) | 12 (100.0%) |
| 3.0x to 3.9x | 0 (0.0%) | 0 (0.0%) |
| 4.0x or more | 0 (0.0%) | 0 (0.0%) |
| Total | 0 (0.0%) | 12 (100.0%) |
Real Estate Taxes by Mortgage Status in Startex
| Property Taxes | Without Mortgage | With Mortgage |
| Less than $800 | 0 (0.0%) | 0 (0.0%) |
| $800 to $1,499 | 0 (0.0%) | 0 (0.0%) |
| $800 to $1,499 | 0 (0.0%) | 0 (0.0%) |
| Total | 0 (0.0%) | 12 (100.0%) |
Health & Disability in Startex
Health Insurance Coverage by Age in Startex
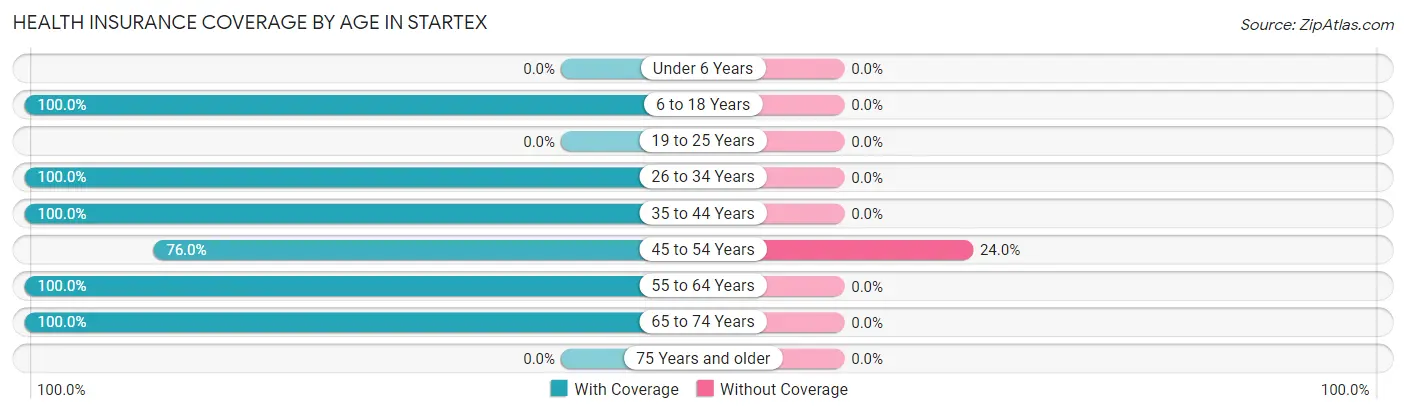
| Age Bracket | With Coverage | Without Coverage |
| Under 6 Years | 0 (0.0%) | 0 (0.0%) |
| 6 to 18 Years | 50 (100.0%) | 0 (0.0%) |
| 19 to 25 Years | 0 (0.0%) | 0 (0.0%) |
| 26 to 34 Years | 29 (100.0%) | 0 (0.0%) |
| 35 to 44 Years | 82 (100.0%) | 0 (0.0%) |
| 45 to 54 Years | 190 (76.0%) | 60 (24.0%) |
| 55 to 64 Years | 12 (100.0%) | 0 (0.0%) |
| 65 to 74 Years | 130 (100.0%) | 0 (0.0%) |
| 75 Years and older | 0 (0.0%) | 0 (0.0%) |
| Total | 493 (89.1%) | 60 (10.8%) |
Health Insurance Coverage by Citizenship Status in Startex
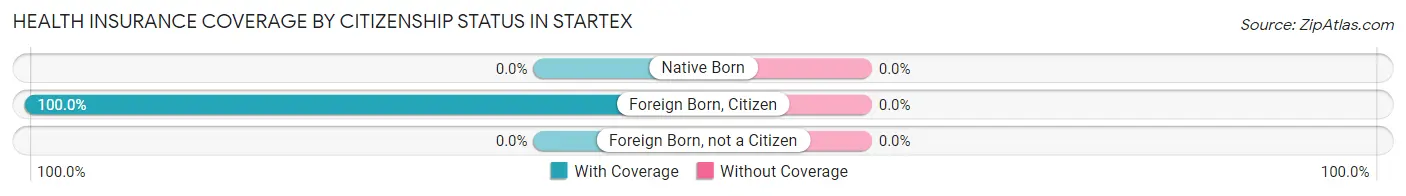
| Citizenship Status | With Coverage | Without Coverage |
| Native Born | 0 (0.0%) | 0 (0.0%) |
| Foreign Born, Citizen | 50 (100.0%) | 0 (0.0%) |
| Foreign Born, not a Citizen | 0 (0.0%) | 0 (0.0%) |
Health Insurance Coverage by Household Income in Startex
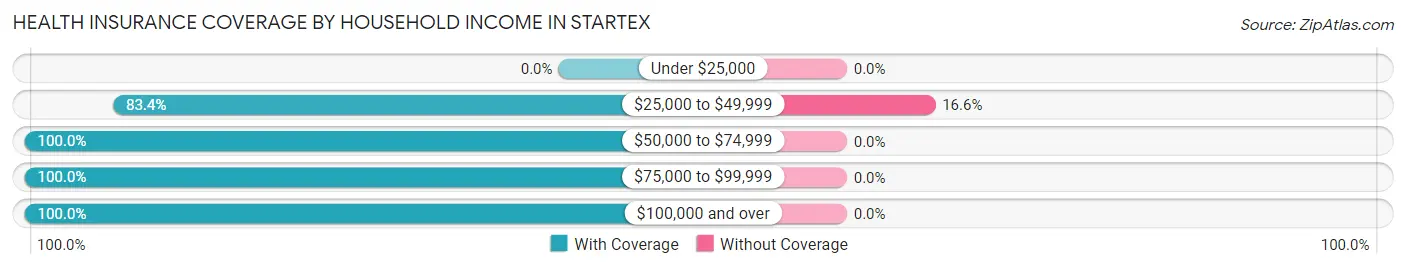
| Household Income | With Coverage | Without Coverage |
| Under $25,000 | 0 (0.0%) | 0 (0.0%) |
| $25,000 to $49,999 | 302 (83.4%) | 60 (16.6%) |
| $50,000 to $74,999 | 135 (100.0%) | 0 (0.0%) |
| $75,000 to $99,999 | 14 (100.0%) | 0 (0.0%) |
| $100,000 and over | 42 (100.0%) | 0 (0.0%) |
Public vs Private Health Insurance Coverage by Age in Startex
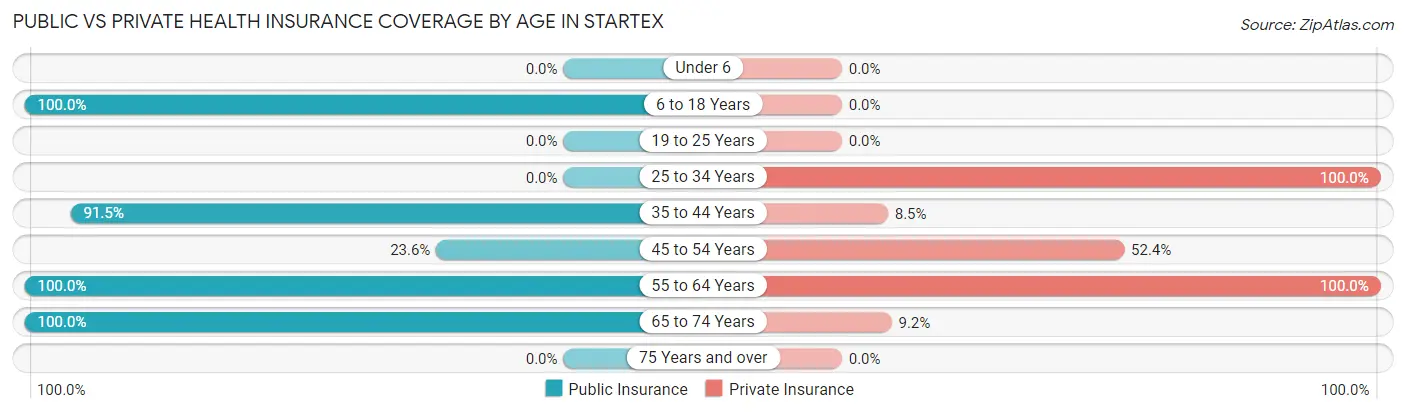
| Age Bracket | Public Insurance | Private Insurance |
| Under 6 | 0 (0.0%) | 0 (0.0%) |
| 6 to 18 Years | 50 (100.0%) | 0 (0.0%) |
| 19 to 25 Years | 0 (0.0%) | 0 (0.0%) |
| 25 to 34 Years | 0 (0.0%) | 29 (100.0%) |
| 35 to 44 Years | 75 (91.5%) | 7 (8.5%) |
| 45 to 54 Years | 59 (23.6%) | 131 (52.4%) |
| 55 to 64 Years | 12 (100.0%) | 12 (100.0%) |
| 65 to 74 Years | 130 (100.0%) | 12 (9.2%) |
| 75 Years and over | 0 (0.0%) | 0 (0.0%) |
| Total | 326 (59.0%) | 191 (34.5%) |
Disability Status by Sex by Age in Startex
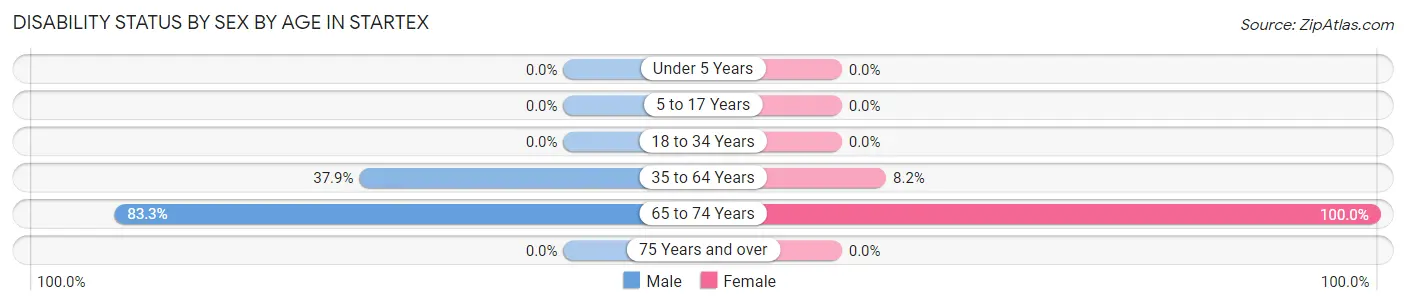
| Age Bracket | Male | Female |
| Under 5 Years | 0 (0.0%) | 0 (0.0%) |
| 5 to 17 Years | 0 (0.0%) | 0 (0.0%) |
| 18 to 34 Years | 0 (0.0%) | 0 (0.0%) |
| 35 to 64 Years | 75 (37.9%) | 12 (8.2%) |
| 65 to 74 Years | 60 (83.3%) | 58 (100.0%) |
| 75 Years and over | 0 (0.0%) | 0 (0.0%) |
Disability Class by Sex by Age in Startex
Disability Class: Hearing Difficulty
| Age Bracket | Male | Female |
| Under 5 Years | 0 (0.0%) | 0 (0.0%) |
| 5 to 17 Years | 0 (0.0%) | 0 (0.0%) |
| 18 to 34 Years | 0 (0.0%) | 0 (0.0%) |
| 35 to 64 Years | 0 (0.0%) | 0 (0.0%) |
| 65 to 74 Years | 0 (0.0%) | 0 (0.0%) |
| 75 Years and over | 0 (0.0%) | 0 (0.0%) |
Disability Class: Vision Difficulty
| Age Bracket | Male | Female |
| Under 5 Years | 0 (0.0%) | 0 (0.0%) |
| 5 to 17 Years | 0 (0.0%) | 0 (0.0%) |
| 18 to 34 Years | 0 (0.0%) | 0 (0.0%) |
| 35 to 64 Years | 0 (0.0%) | 0 (0.0%) |
| 65 to 74 Years | 0 (0.0%) | 0 (0.0%) |
| 75 Years and over | 0 (0.0%) | 0 (0.0%) |
Disability Class: Cognitive Difficulty
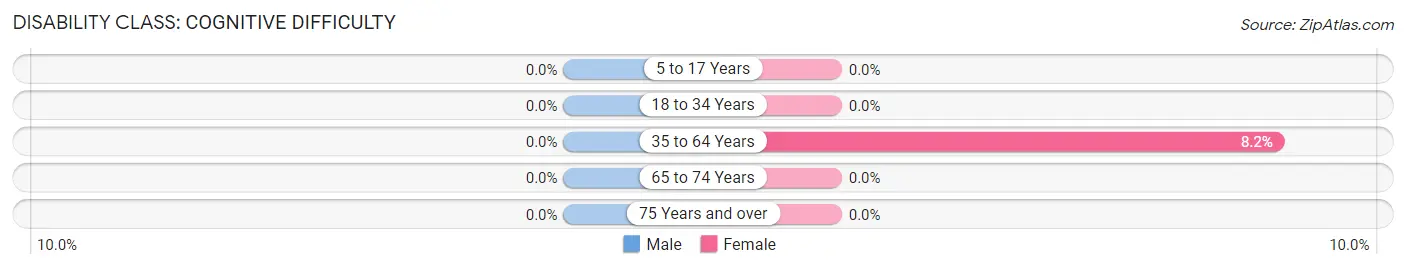
| Age Bracket | Male | Female |
| 5 to 17 Years | 0 (0.0%) | 0 (0.0%) |
| 18 to 34 Years | 0 (0.0%) | 0 (0.0%) |
| 35 to 64 Years | 0 (0.0%) | 12 (8.2%) |
| 65 to 74 Years | 0 (0.0%) | 0 (0.0%) |
| 75 Years and over | 0 (0.0%) | 0 (0.0%) |
Disability Class: Ambulatory Difficulty
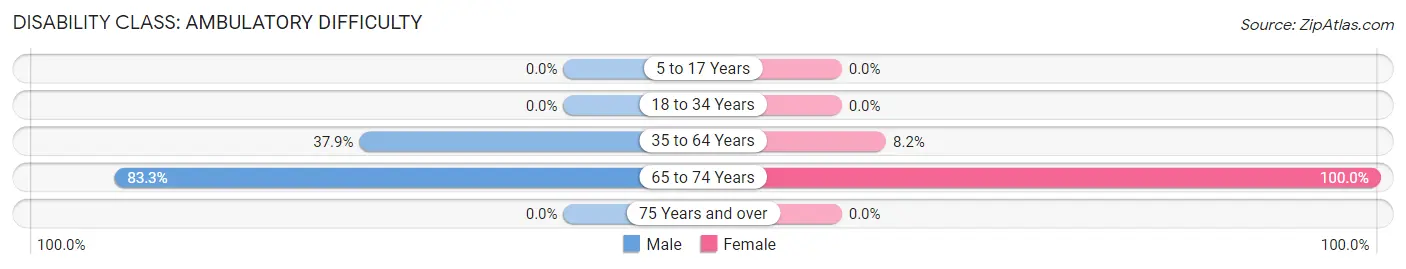
| Age Bracket | Male | Female |
| 5 to 17 Years | 0 (0.0%) | 0 (0.0%) |
| 18 to 34 Years | 0 (0.0%) | 0 (0.0%) |
| 35 to 64 Years | 75 (37.9%) | 12 (8.2%) |
| 65 to 74 Years | 60 (83.3%) | 58 (100.0%) |
| 75 Years and over | 0 (0.0%) | 0 (0.0%) |
Disability Class: Self-Care Difficulty
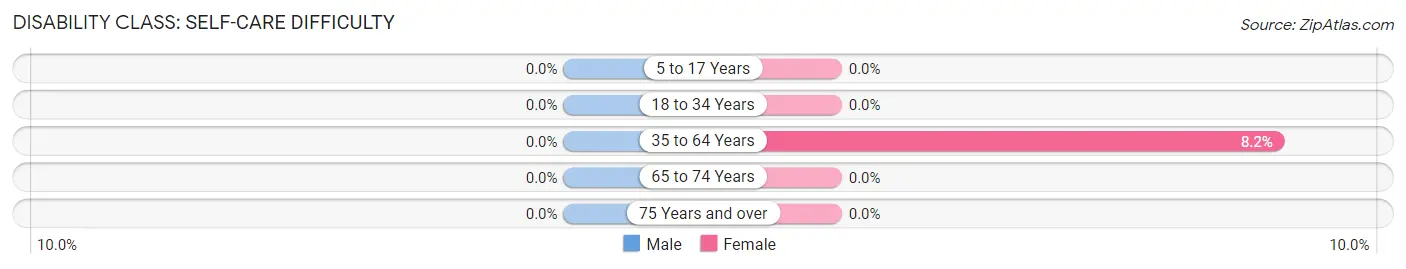
| Age Bracket | Male | Female |
| 5 to 17 Years | 0 (0.0%) | 0 (0.0%) |
| 18 to 34 Years | 0 (0.0%) | 0 (0.0%) |
| 35 to 64 Years | 0 (0.0%) | 12 (8.2%) |
| 65 to 74 Years | 0 (0.0%) | 0 (0.0%) |
| 75 Years and over | 0 (0.0%) | 0 (0.0%) |
Technology Access in Startex
Computing Device Access in Startex
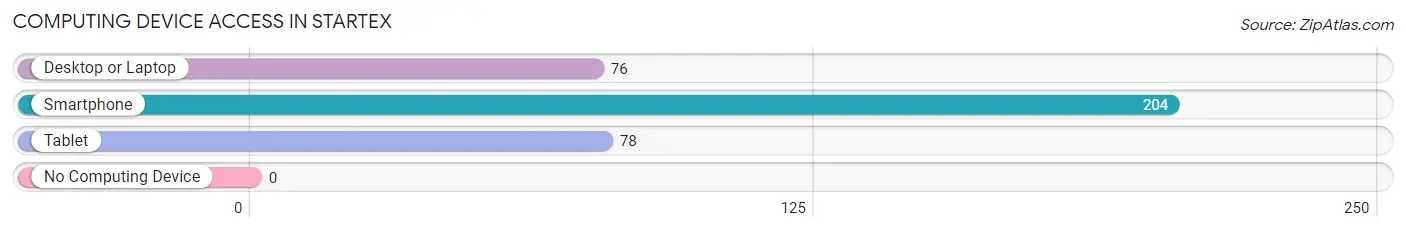
| Device Type | # Households | % Households |
| Desktop or Laptop | 76 | 37.2% |
| Smartphone | 204 | 100.0% |
| Tablet | 78 | 38.2% |
| No Computing Device | 0 | 0.0% |
| Total | 204 | 100.0% |
Internet Access in Startex
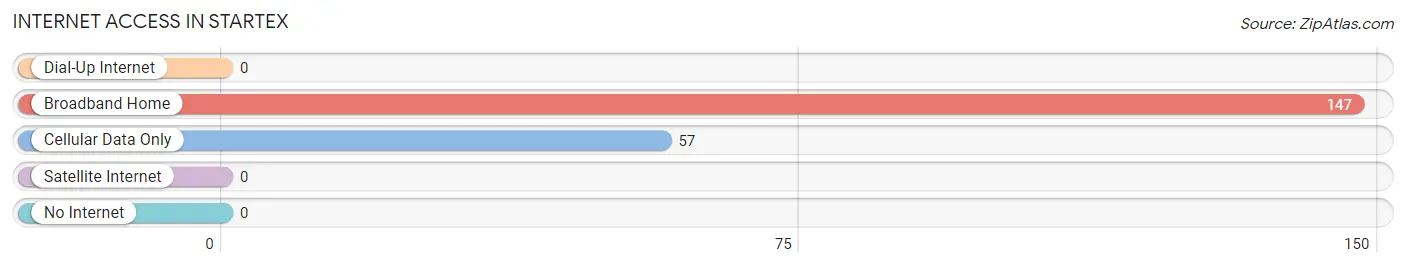
| Internet Type | # Households | % Households |
| Dial-Up Internet | 0 | 0.0% |
| Broadband Home | 147 | 72.1% |
| Cellular Data Only | 57 | 27.9% |
| Satellite Internet | 0 | 0.0% |
| No Internet | 0 | 0.0% |
| Total | 204 | 100.0% |
Startex Summary
Startex is a small town located in Spartanburg County, South Carolina. It is situated in the foothills of the Blue Ridge Mountains and is part of the Greenville-Spartanburg-Anderson Combined Statistical Area. The town has a population of approximately 1,500 people and is located about 20 miles from the city of Spartanburg.
History
Startex was founded in 1887 by a group of settlers from North Carolina. The town was originally known as “Start” and was named after the nearby Startex Mill. The mill was built in 1887 and was used to grind corn and wheat. The town was officially incorporated in 1895 and the name was changed to Startex.
In the early 1900s, Startex was a thriving community with a variety of businesses, including a general store, a blacksmith shop, a grist mill, and a cotton gin. The town also had a post office, a school, and a church.
In the 1950s, the town began to decline as the local economy shifted away from agriculture and manufacturing. The population decreased and many of the businesses closed. In the late 1970s, the town was revitalized with the opening of a new shopping center and the construction of a new highway.
Geography
Startex is located in the foothills of the Blue Ridge Mountains in Spartanburg County. The town is situated along the Pacolet River and is surrounded by rolling hills and forests. The town is located about 20 miles from the city of Spartanburg and is part of the Greenville-Spartanburg-Anderson Combined Statistical Area.
The climate in Startex is mild and humid. Summers are hot and humid with temperatures reaching into the 90s. Winters are mild with temperatures rarely dropping below freezing. The average annual precipitation is around 45 inches.
Economy
The economy of Startex is largely based on agriculture and manufacturing. The town is home to several small businesses, including a general store, a blacksmith shop, and a grist mill. The town also has a post office, a school, and a church.
The town is also home to several large employers, including a manufacturing plant and a distribution center. The town is also home to a number of small businesses, including restaurants, retail stores, and service providers.
Demographics
As of the 2010 census, Startex had a population of 1,500 people. The racial makeup of the town was 94.7% White, 2.7% African American, 0.3% Native American, 0.3% Asian, and 1.7% from other races. The median household income was $35,000 and the median family income was $41,000.
Startex is a small town with a rich history and a diverse economy. The town is home to a variety of businesses and is a great place to live and work. The town is also home to a number of small businesses, including restaurants, retail stores, and service providers. The town is also home to a number of large employers, including a manufacturing plant and a distribution center. The town is a great place to live and work and offers a variety of amenities and activities for residents.
Common Questions
What is Per Capita Income in Startex?
Per Capita income in Startex is $21,419.
What is the Median Family Income in Startex?
Median Family Income in Startex is $44,116.
What is the Median Household income in Startex?
Median Household Income in Startex is $44,353.
What is Inequality or Gini Index in Startex?
Inequality or Gini Index in Startex is 0.28.
What is the Total Population of Startex?
Total Population of Startex is 553.
What is the Total Male Population of Startex?
Total Male Population of Startex is 320.
What is the Total Female Population of Startex?
Total Female Population of Startex is 233.
What is the Ratio of Males per 100 Females in Startex?
There are 137.34 Males per 100 Females in Startex.
What is the Ratio of Females per 100 Males in Startex?
There are 72.81 Females per 100 Males in Startex.
What is the Median Population Age in Startex?
Median Population Age in Startex is 50.7 Years.
What is the Average Family Size in Startex
Average Family Size in Startex is 2.8 People.
What is the Average Household Size in Startex
Average Household Size in Startex is 2.7 People.
How Large is the Labor Force in Startex?
There are 289 People in the Labor Forcein in Startex.
What is the Percentage of People in the Labor Force in Startex?
52.3% of People are in the Labor Force in Startex.
What is the Unemployment Rate in Startex?
Unemployment Rate in Startex is 20.8%.