Smyrna, SC Map & Demographics
Smyrna Map
Smyrna Overview
$144,261
PER CAPITA INCOME
$250,001
AVG FAMILY INCOME
41.9%
WAGE / INCOME GAP [ % ]
58.1¢/ $1
WAGE / INCOME GAP [ $ ]
0.45
INEQUALITY / GINI INDEX
28
TOTAL POPULATION
14
MALE POPULATION
14
FEMALE POPULATION
100.00
MALES / 100 FEMALES
100.00
FEMALES / 100 MALES
63.5
MEDIAN AGE
2.6
AVG FAMILY SIZE
2.3
AVG HOUSEHOLD SIZE
10
LABOR FORCE [ PEOPLE ]
41.7%
PERCENT IN LABOR FORCE
Smyrna Zip Codes
Income in Smyrna
Income Overview in Smyrna
| Characteristic | Number | Measure |
| Per Capita Income | 28 | $144,261 |
| Median Family Income | 9 | $250,001 |
| Mean Family Income | 9 | $367,278 |
| Median Household Income | 12 | $0 |
| Mean Household Income | 12 | $291,742 |
| Income Deficit | 9 | $0 |
| Wage / Income Gap (%) | 28 | 41.86% |
| Wage / Income Gap ($) | 28 | 58.14¢ per $1 |
| Gini / Inequality Index | 28 | 0.45 |
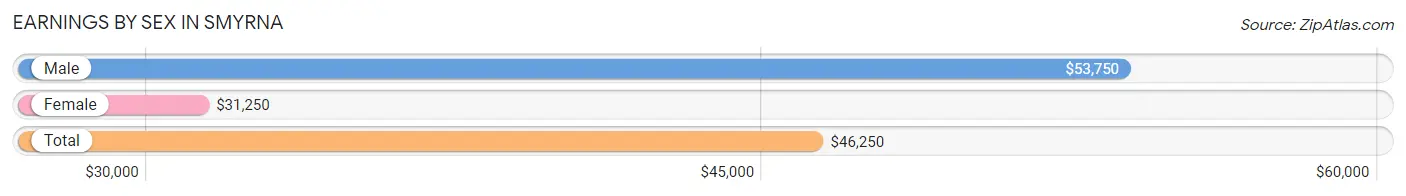
Earnings by Sex in Smyrna
Average Earnings in Smyrna are $46,250, $53,750 for men and $31,250 for women, a difference of 41.9%.
| Sex | Number | Average Earnings |
| Male | 7 (70.0%) | $53,750 |
| Female | 3 (30.0%) | $31,250 |
| Total | 10 (100.0%) | $46,250 |
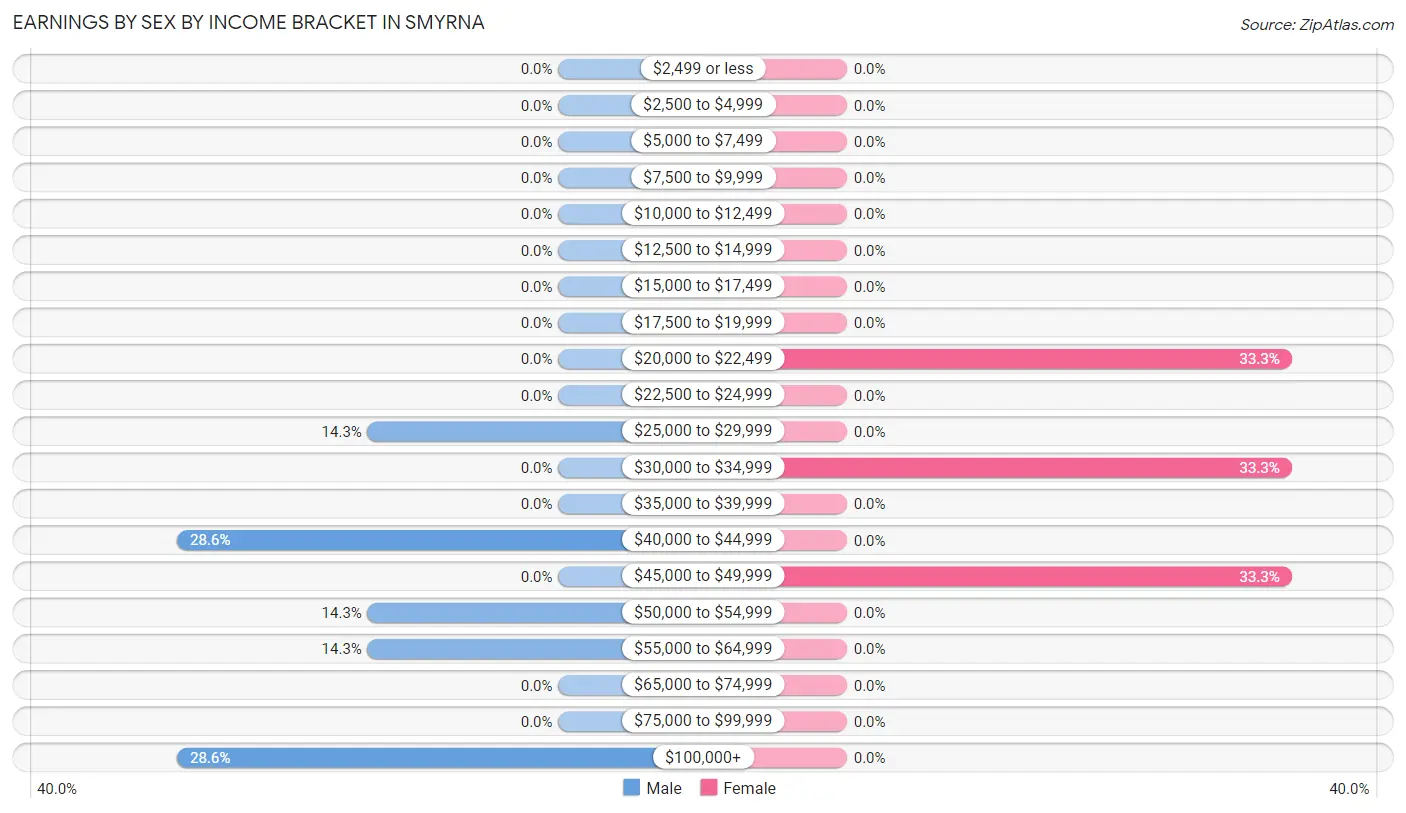
Earnings by Sex by Income Bracket in Smyrna
The most common earnings brackets in Smyrna are $40,000 to $44,999 for men (2 | 28.6%) and $20,000 to $22,499 for women (1 | 33.3%).
| Income | Male | Female |
| $2,499 or less | 0 (0.0%) | 0 (0.0%) |
| $2,500 to $4,999 | 0 (0.0%) | 0 (0.0%) |
| $5,000 to $7,499 | 0 (0.0%) | 0 (0.0%) |
| $7,500 to $9,999 | 0 (0.0%) | 0 (0.0%) |
| $10,000 to $12,499 | 0 (0.0%) | 0 (0.0%) |
| $12,500 to $14,999 | 0 (0.0%) | 0 (0.0%) |
| $15,000 to $17,499 | 0 (0.0%) | 0 (0.0%) |
| $17,500 to $19,999 | 0 (0.0%) | 0 (0.0%) |
| $20,000 to $22,499 | 0 (0.0%) | 1 (33.3%) |
| $22,500 to $24,999 | 0 (0.0%) | 0 (0.0%) |
| $25,000 to $29,999 | 1 (14.3%) | 0 (0.0%) |
| $30,000 to $34,999 | 0 (0.0%) | 1 (33.3%) |
| $35,000 to $39,999 | 0 (0.0%) | 0 (0.0%) |
| $40,000 to $44,999 | 2 (28.6%) | 0 (0.0%) |
| $45,000 to $49,999 | 0 (0.0%) | 1 (33.3%) |
| $50,000 to $54,999 | 1 (14.3%) | 0 (0.0%) |
| $55,000 to $64,999 | 1 (14.3%) | 0 (0.0%) |
| $65,000 to $74,999 | 0 (0.0%) | 0 (0.0%) |
| $75,000 to $99,999 | 0 (0.0%) | 0 (0.0%) |
| $100,000+ | 2 (28.6%) | 0 (0.0%) |
| Total | 7 (100.0%) | 3 (100.0%) |
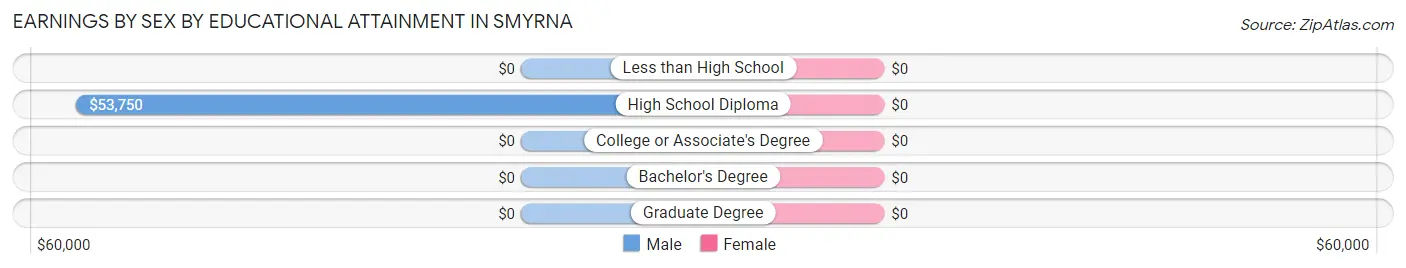
Earnings by Sex by Educational Attainment in Smyrna
| Educational Attainment | Male Income | Female Income |
| Less than High School | - | - |
| High School Diploma | $53,750 | $0 |
| College or Associate's Degree | - | - |
| Bachelor's Degree | - | - |
| Graduate Degree | - | - |
| Total | $58,750 | $31,250 |
Family Income in Smyrna
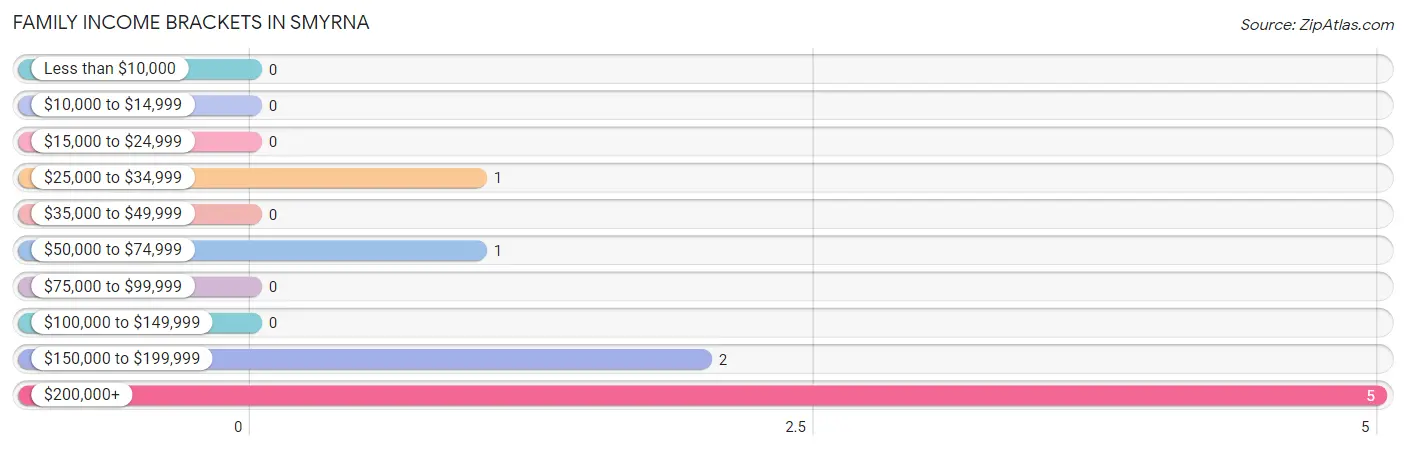
Family Income Brackets in Smyrna
According to the Smyrna family income data, there are 5 families falling into the $200,000+ income range, which is the most common income bracket and makes up 55.6% of all families.
| Income Bracket | # Families | % Families |
| Less than $10,000 | 0 | 0.0% |
| $10,000 to $14,999 | 0 | 0.0% |
| $15,000 to $24,999 | 0 | 0.0% |
| $25,000 to $34,999 | 1 | 11.1% |
| $35,000 to $49,999 | 0 | 0.0% |
| $50,000 to $74,999 | 1 | 11.1% |
| $75,000 to $99,999 | 0 | 0.0% |
| $100,000 to $149,999 | 0 | 0.0% |
| $150,000 to $199,999 | 2 | 22.2% |
| $200,000+ | 5 | 55.6% |
Family Income by Famaliy Size in Smyrna
| Income Bracket | # Families | Median Income |
| 2-Person Families | 7 (77.8%) | $0 |
| 3-Person Families | 2 (22.2%) | $0 |
| 4-Person Families | 0 (0.0%) | $0 |
| 5-Person Families | 0 (0.0%) | $0 |
| 6-Person Families | 0 (0.0%) | $0 |
| 7+ Person Families | 0 (0.0%) | $0 |
| Total | 9 (100.0%) | $250,001 |
Family Income by Number of Earners in Smyrna
| Number of Earners | # Families | Median Income |
| No Earners | 5 (55.6%) | $0 |
| 1 Earner | 1 (11.1%) | $0 |
| 2 Earners | 3 (33.3%) | $0 |
| 3+ Earners | 0 (0.0%) | $0 |
| Total | 9 (100.0%) | $250,001 |
Household Income in Smyrna
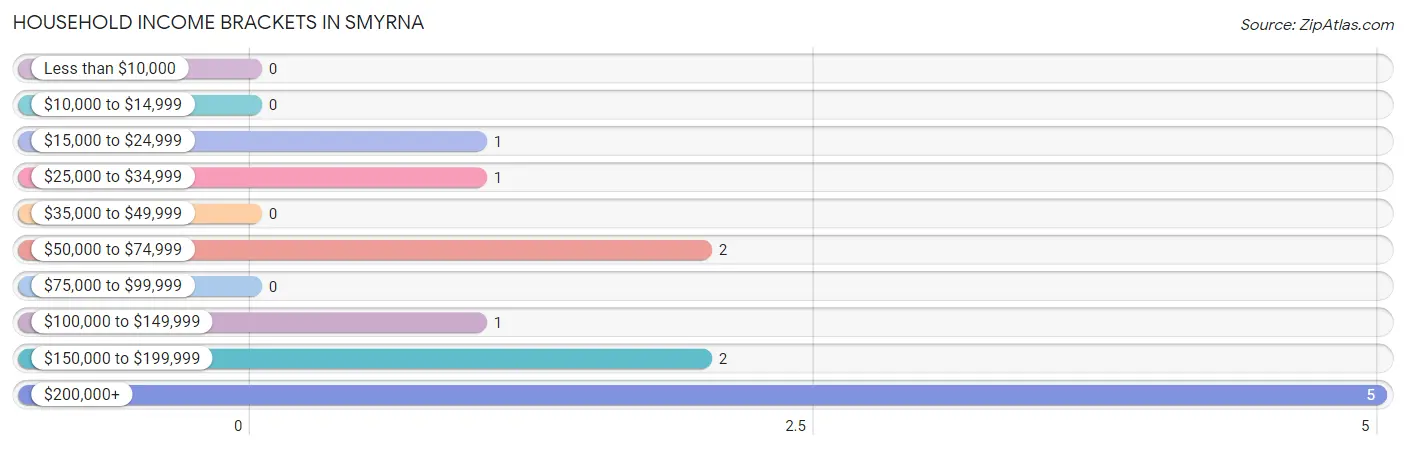
Household Income Brackets in Smyrna
With 5 households falling in the category, the $200,000+ income range is the most frequent in Smyrna, accounting for 41.7% of all households.
| Income Bracket | # Households | % Households |
| Less than $10,000 | 0 | 0.0% |
| $10,000 to $14,999 | 0 | 0.0% |
| $15,000 to $24,999 | 1 | 8.3% |
| $25,000 to $34,999 | 1 | 8.3% |
| $35,000 to $49,999 | 0 | 0.0% |
| $50,000 to $74,999 | 2 | 16.7% |
| $75,000 to $99,999 | 0 | 0.0% |
| $100,000 to $149,999 | 1 | 8.3% |
| $150,000 to $199,999 | 2 | 16.7% |
| $200,000+ | 5 | 41.7% |
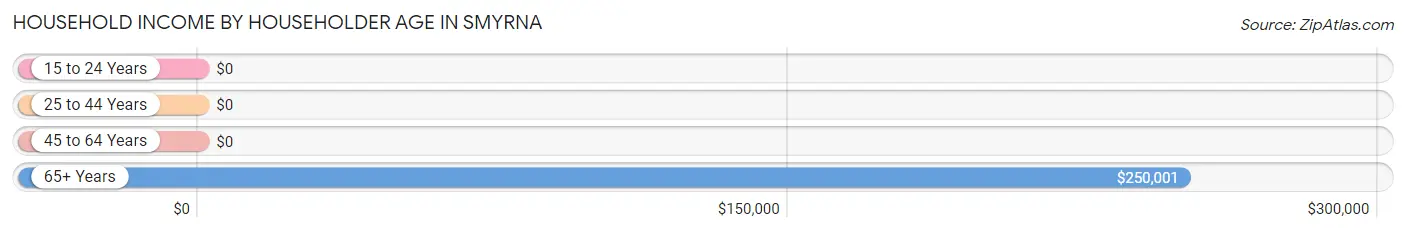
Household Income by Householder Age in Smyrna
The median household income in Smyrna is $0, with the highest median household income of $250,001 found in the 65+ years age bracket for the primary householder. A total of 7 households (58.3%) fall into this category.
| Income Bracket | # Households | Median Income |
| 15 to 24 Years | 0 (0.0%) | $0 |
| 25 to 44 Years | 1 (8.3%) | $0 |
| 45 to 64 Years | 4 (33.3%) | $0 |
| 65+ Years | 7 (58.3%) | $250,001 |
| Total | 12 (100.0%) | $0 |
Poverty in Smyrna
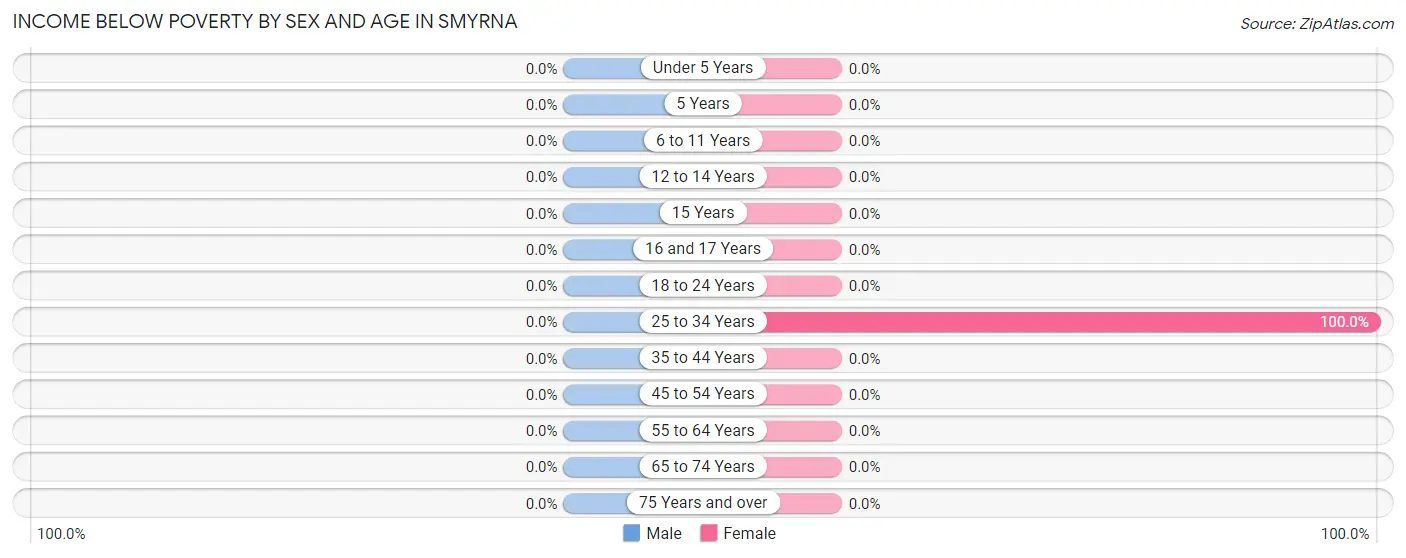
Income Below Poverty by Sex and Age in Smyrna
| Age Bracket | Male | Female |
| Under 5 Years | 0 (0.0%) | 0 (0.0%) |
| 5 Years | 0 (0.0%) | 0 (0.0%) |
| 6 to 11 Years | 0 (0.0%) | 0 (0.0%) |
| 12 to 14 Years | 0 (0.0%) | 0 (0.0%) |
| 15 Years | 0 (0.0%) | 0 (0.0%) |
| 16 and 17 Years | 0 (0.0%) | 0 (0.0%) |
| 18 to 24 Years | 0 (0.0%) | 0 (0.0%) |
| 25 to 34 Years | 0 (0.0%) | 1 (100.0%) |
| 35 to 44 Years | 0 (0.0%) | 0 (0.0%) |
| 45 to 54 Years | 0 (0.0%) | 0 (0.0%) |
| 55 to 64 Years | 0 (0.0%) | 0 (0.0%) |
| 65 to 74 Years | 0 (0.0%) | 0 (0.0%) |
| 75 Years and over | 0 (0.0%) | 0 (0.0%) |
| Total | 0 (0.0%) | 1 (7.1%) |
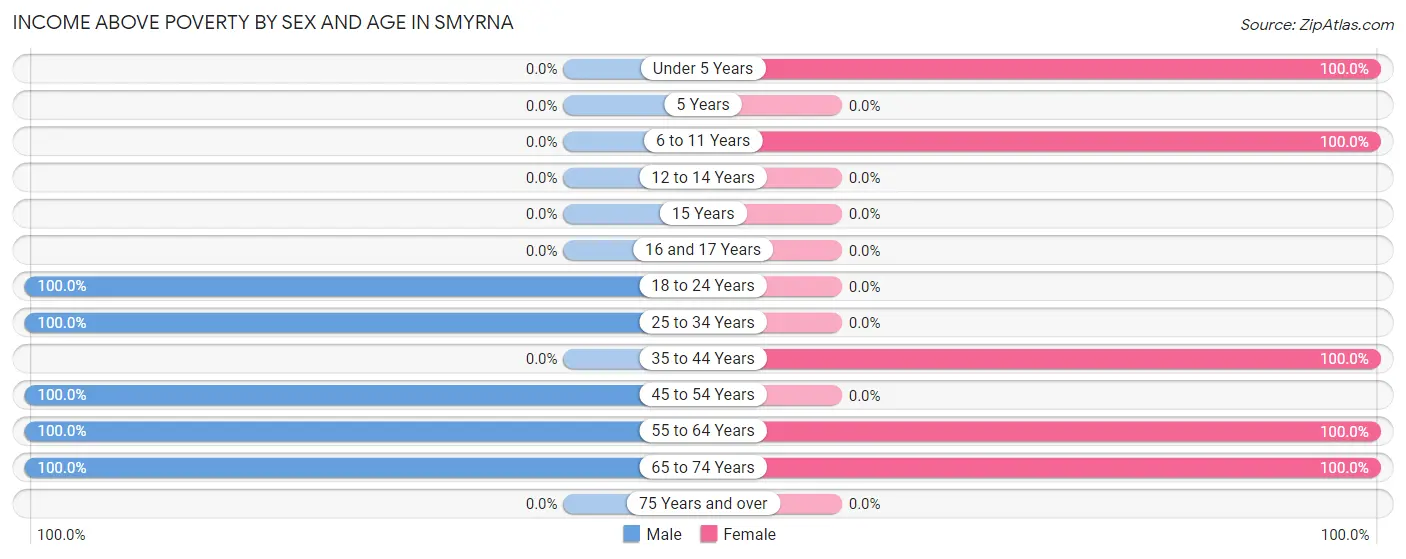
Income Above Poverty by Sex and Age in Smyrna
According to the poverty statistics in Smyrna, males aged 18 to 24 years and females aged under 5 years are the age groups that are most secure financially, with 100.0% of males and 100.0% of females in these age groups living above the poverty line.
| Age Bracket | Male | Female |
| Under 5 Years | 0 (0.0%) | 2 (100.0%) |
| 5 Years | 0 (0.0%) | 0 (0.0%) |
| 6 to 11 Years | 0 (0.0%) | 2 (100.0%) |
| 12 to 14 Years | 0 (0.0%) | 0 (0.0%) |
| 15 Years | 0 (0.0%) | 0 (0.0%) |
| 16 and 17 Years | 0 (0.0%) | 0 (0.0%) |
| 18 to 24 Years | 2 (100.0%) | 0 (0.0%) |
| 25 to 34 Years | 1 (100.0%) | 0 (0.0%) |
| 35 to 44 Years | 0 (0.0%) | 1 (100.0%) |
| 45 to 54 Years | 2 (100.0%) | 0 (0.0%) |
| 55 to 64 Years | 2 (100.0%) | 1 (100.0%) |
| 65 to 74 Years | 7 (100.0%) | 7 (100.0%) |
| 75 Years and over | 0 (0.0%) | 0 (0.0%) |
| Total | 14 (100.0%) | 13 (92.9%) |
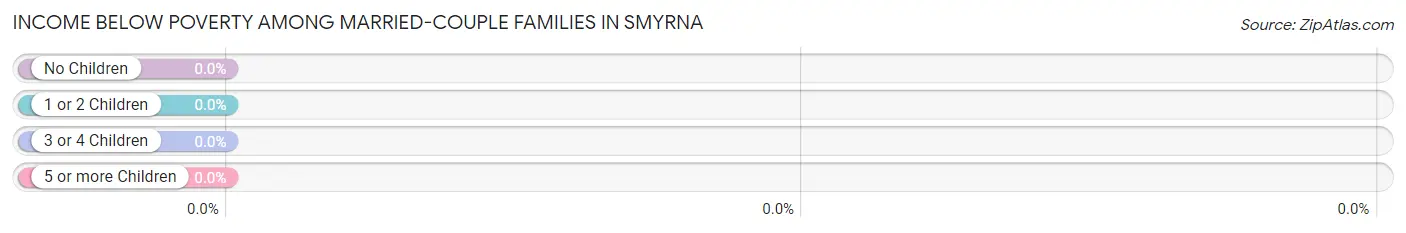
Income Below Poverty Among Married-Couple Families in Smyrna
| Children | Above Poverty | Below Poverty |
| No Children | 6 (100.0%) | 0 (0.0%) |
| 1 or 2 Children | 0 (0.0%) | 0 (0.0%) |
| 3 or 4 Children | 0 (0.0%) | 0 (0.0%) |
| 5 or more Children | 0 (0.0%) | 0 (0.0%) |
| Total | 6 (100.0%) | 0 (0.0%) |
Income Below Poverty Among Single-Parent Households in Smyrna
| Children | Single Father | Single Mother |
| No Children | 0 (0.0%) | 0 (0.0%) |
| 1 or 2 Children | 0 (0.0%) | 0 (0.0%) |
| 3 or 4 Children | 0 (0.0%) | 0 (0.0%) |
| 5 or more Children | 0 (0.0%) | 0 (0.0%) |
| Total | 0 (0.0%) | 0 (0.0%) |
Income Below Poverty Among Married-Couple vs Single-Parent Households in Smyrna
| Children | Married-Couple Families | Single-Parent Households |
| No Children | 0 (0.0%) | 0 (0.0%) |
| 1 or 2 Children | 0 (0.0%) | 0 (0.0%) |
| 3 or 4 Children | 0 (0.0%) | 0 (0.0%) |
| 5 or more Children | 0 (0.0%) | 0 (0.0%) |
| Total | 0 (0.0%) | 0 (0.0%) |
Race in Smyrna
The most populous races in Smyrna are , and White / Caucasian (28 | 100.0%).
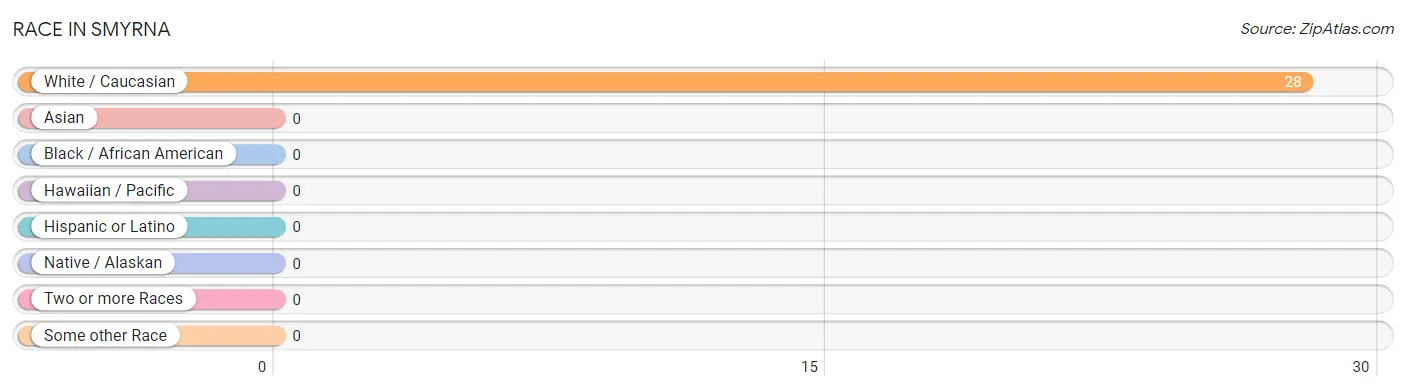
| Race | # Population | % Population |
| Asian | 0 | 0.0% |
| Black / African American | 0 | 0.0% |
| Hawaiian / Pacific | 0 | 0.0% |
| Hispanic or Latino | 0 | 0.0% |
| Native / Alaskan | 0 | 0.0% |
| White / Caucasian | 28 | 100.0% |
| Two or more Races | 0 | 0.0% |
| Some other Race | 0 | 0.0% |
| Total | 28 | 100.0% |
Ancestry in Smyrna
The most populous ancestries reported in Smyrna are Canadian (6 | 21.4%), Irish (5 | 17.9%), French Canadian (3 | 10.7%), European (2 | 7.1%), and American (1 | 3.6%), together accounting for 60.7% of all Smyrna residents.
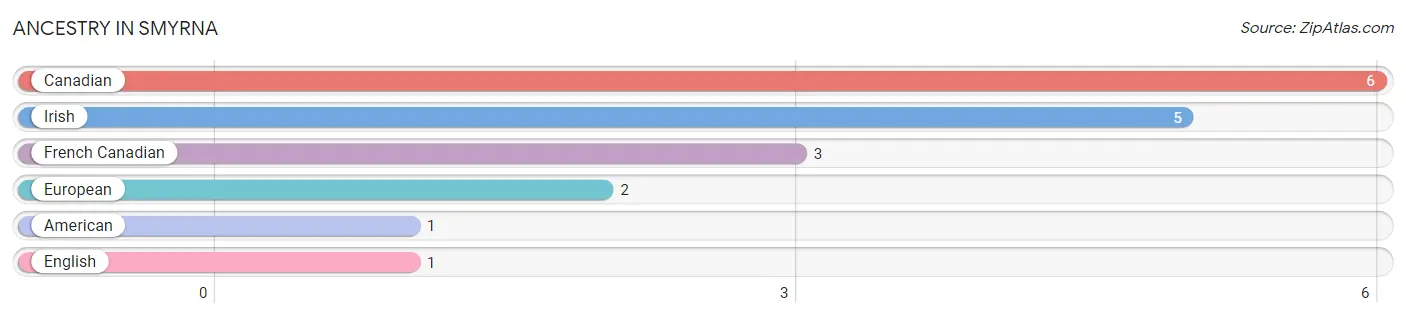
| Ancestry | # Population | % Population |
| American | 1 | 3.6% |
| Canadian | 6 | 21.4% |
| English | 1 | 3.6% |
| European | 2 | 7.1% |
| French Canadian | 3 | 10.7% |
| Irish | 5 | 17.9% | View All 6 Rows |
Immigrants in Smyrna

| Immigration Origin | # Population | % Population | View All 0 Rows |
Sex and Age in Smyrna
Sex and Age in Smyrna
The most populous age groups in Smyrna are 70 to 74 Years (6 | 42.9%) for men and 70 to 74 Years (5 | 35.7%) for women.
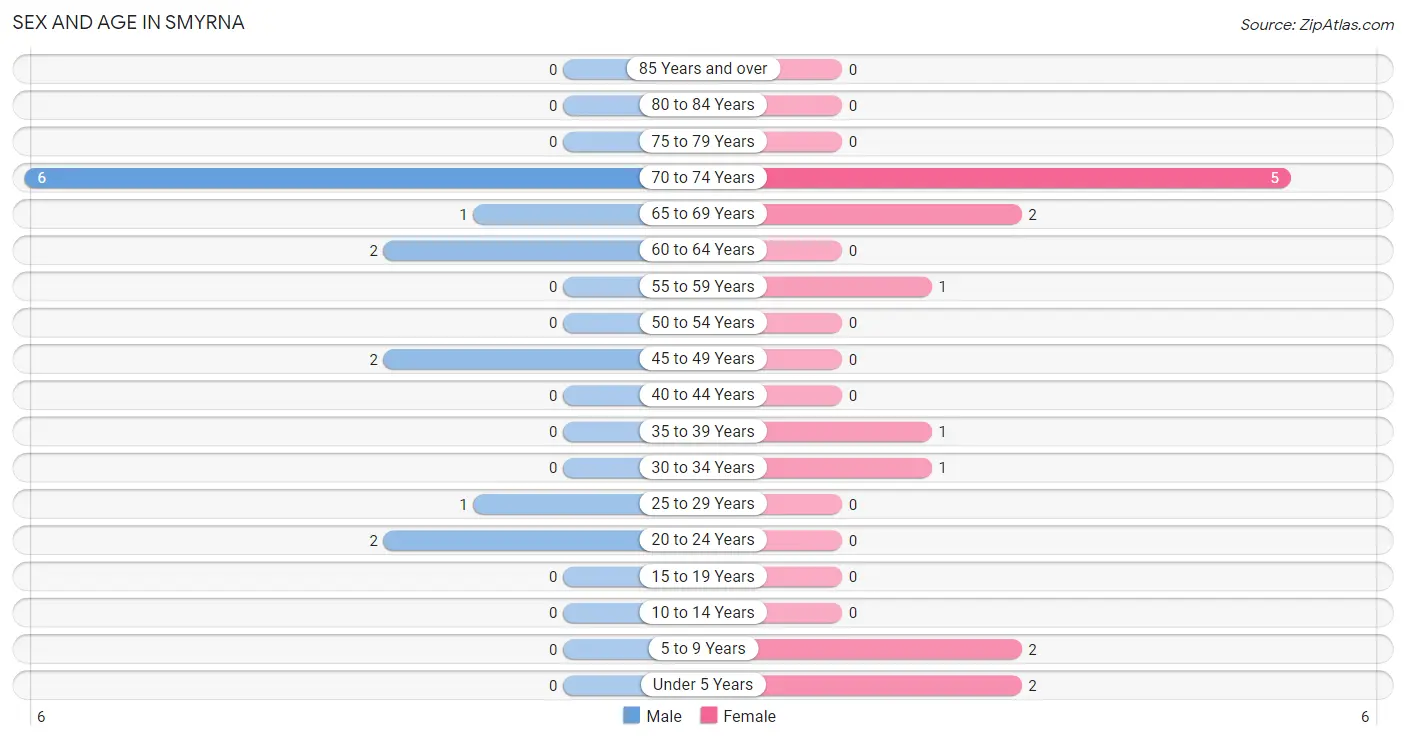
| Age Bracket | Male | Female |
| Under 5 Years | 0 (0.0%) | 2 (14.3%) |
| 5 to 9 Years | 0 (0.0%) | 2 (14.3%) |
| 10 to 14 Years | 0 (0.0%) | 0 (0.0%) |
| 15 to 19 Years | 0 (0.0%) | 0 (0.0%) |
| 20 to 24 Years | 2 (14.3%) | 0 (0.0%) |
| 25 to 29 Years | 1 (7.1%) | 0 (0.0%) |
| 30 to 34 Years | 0 (0.0%) | 1 (7.1%) |
| 35 to 39 Years | 0 (0.0%) | 1 (7.1%) |
| 40 to 44 Years | 0 (0.0%) | 0 (0.0%) |
| 45 to 49 Years | 2 (14.3%) | 0 (0.0%) |
| 50 to 54 Years | 0 (0.0%) | 0 (0.0%) |
| 55 to 59 Years | 0 (0.0%) | 1 (7.1%) |
| 60 to 64 Years | 2 (14.3%) | 0 (0.0%) |
| 65 to 69 Years | 1 (7.1%) | 2 (14.3%) |
| 70 to 74 Years | 6 (42.9%) | 5 (35.7%) |
| 75 to 79 Years | 0 (0.0%) | 0 (0.0%) |
| 80 to 84 Years | 0 (0.0%) | 0 (0.0%) |
| 85 Years and over | 0 (0.0%) | 0 (0.0%) |
| Total | 14 (100.0%) | 14 (100.0%) |
Families and Households in Smyrna
Median Family Size in Smyrna
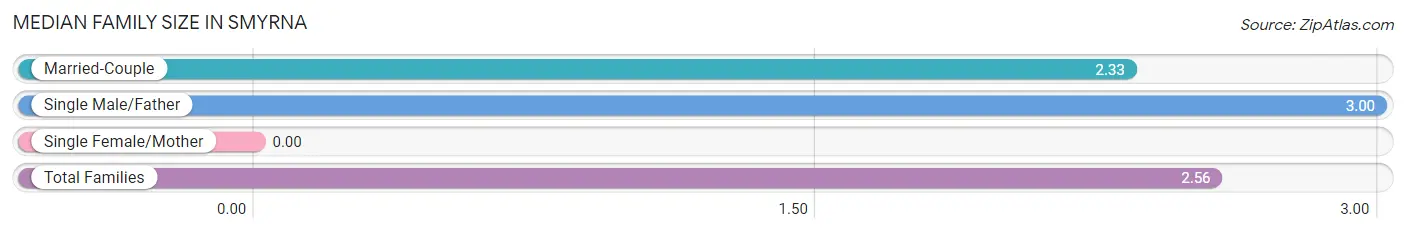
| Family Type | # Families | Family Size |
| Married-Couple | 6 (66.7%) | 2.33 |
| Single Male/Father | 3 (33.3%) | 3.00 |
| Single Female/Mother | 0 (0.0%) | - |
| Total Families | 9 (100.0%) | 2.56 |
Median Household Size in Smyrna
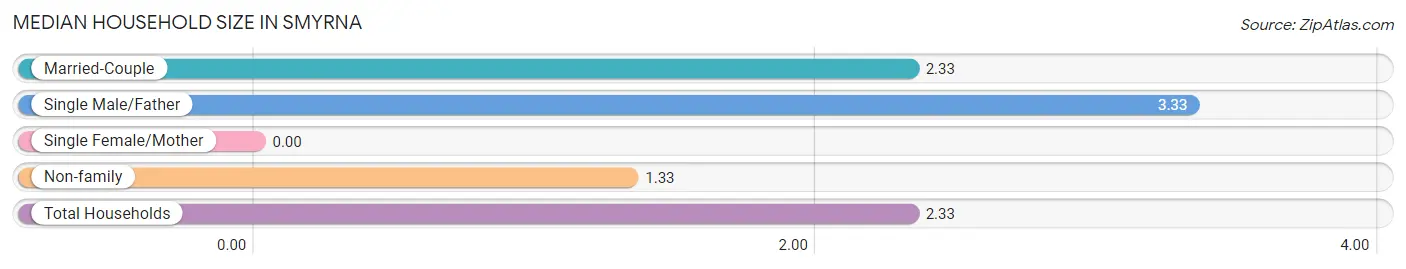
| Household Type | # Households | Household Size |
| Married-Couple | 6 (50.0%) | 2.33 |
| Single Male/Father | 3 (25.0%) | 3.33 |
| Single Female/Mother | 0 (0.0%) | - |
| Non-family | 3 (25.0%) | 1.33 |
| Total Households | 12 (100.0%) | 2.33 |
Household Size by Marriage Status in Smyrna
Out of a total of 12 households in Smyrna, 9 (75.0%) are family households, while 3 (25.0%) are nonfamily households. The most numerous type of family households are 2-person households, comprising 7, and the most common type of nonfamily households are 1-person households, comprising 2.
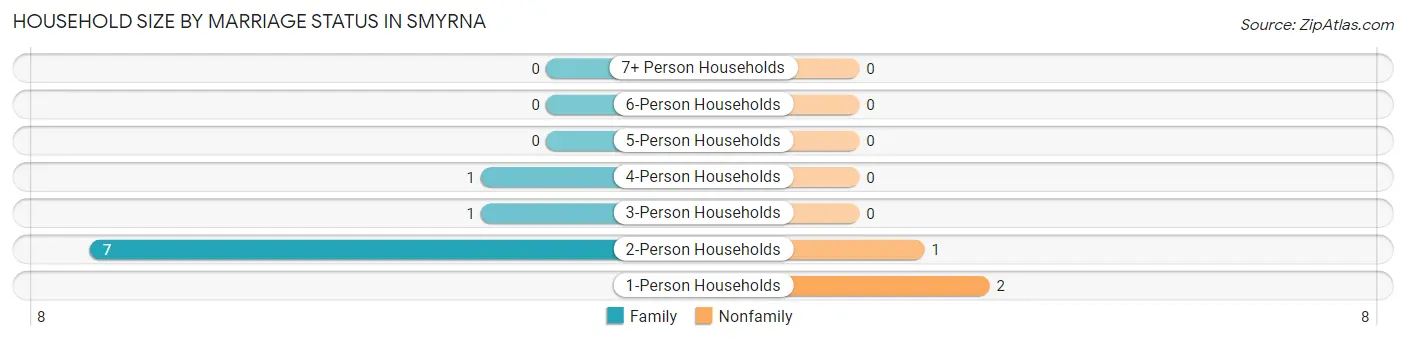
| Household Size | Family Households | Nonfamily Households |
| 1-Person Households | - | 2 (16.7%) |
| 2-Person Households | 7 (58.3%) | 1 (8.3%) |
| 3-Person Households | 1 (8.3%) | 0 (0.0%) |
| 4-Person Households | 1 (8.3%) | 0 (0.0%) |
| 5-Person Households | 0 (0.0%) | 0 (0.0%) |
| 6-Person Households | 0 (0.0%) | 0 (0.0%) |
| 7+ Person Households | 0 (0.0%) | 0 (0.0%) |
| Total | 9 (75.0%) | 3 (25.0%) |
Female Fertility in Smyrna
Fertility by Age in Smyrna
| Age Bracket | Women with Births | Births / 1,000 Women |
| 15 to 19 years | 0 (0.0%) | 0.0 |
| 20 to 34 years | 0 (0.0%) | 0.0 |
| 35 to 50 years | 0 (0.0%) | 0.0 |
| Total | 0 (0.0%) | 0.0 |
Fertility by Age by Marriage Status in Smyrna
| Age Bracket | Married | Unmarried |
| 15 to 19 years | 0 (0.0%) | 0 (0.0%) |
| 20 to 34 years | 0 (0.0%) | 0 (0.0%) |
| 35 to 50 years | 0 (0.0%) | 0 (0.0%) |
| Total | 0 (0.0%) | 0 (0.0%) |
Fertility by Education in Smyrna
| Educational Attainment | Women with Births | Births / 1,000 Women |
| Less than High School | 0 (0.0%) | 0.0 |
| High School Diploma | 0 (0.0%) | 0.0 |
| College or Associate's Degree | 0 (0.0%) | 0.0 |
| Bachelor's Degree | 0 (0.0%) | 0.0 |
| Graduate Degree | 0 (0.0%) | 0.0 |
| Total | 0 (0.0%) | 0.0 |
Fertility by Education by Marriage Status in Smyrna
| Educational Attainment | Married | Unmarried |
| Less than High School | 0 (0.0%) | 0 (0.0%) |
| High School Diploma | 0 (0.0%) | 0 (0.0%) |
| College or Associate's Degree | 0 (0.0%) | 0 (0.0%) |
| Bachelor's Degree | 0 (0.0%) | 0 (0.0%) |
| Graduate Degree | 0 (0.0%) | 0 (0.0%) |
| Total | 0 (0.0%) | 0 (0.0%) |
Employment Characteristics in Smyrna
Employment by Class of Employer in Smyrna
Among the 10 employed individuals in Smyrna, private company employees (8 | 80.0%), and local government employees (2 | 20.0%) make up the most common classes of employment.
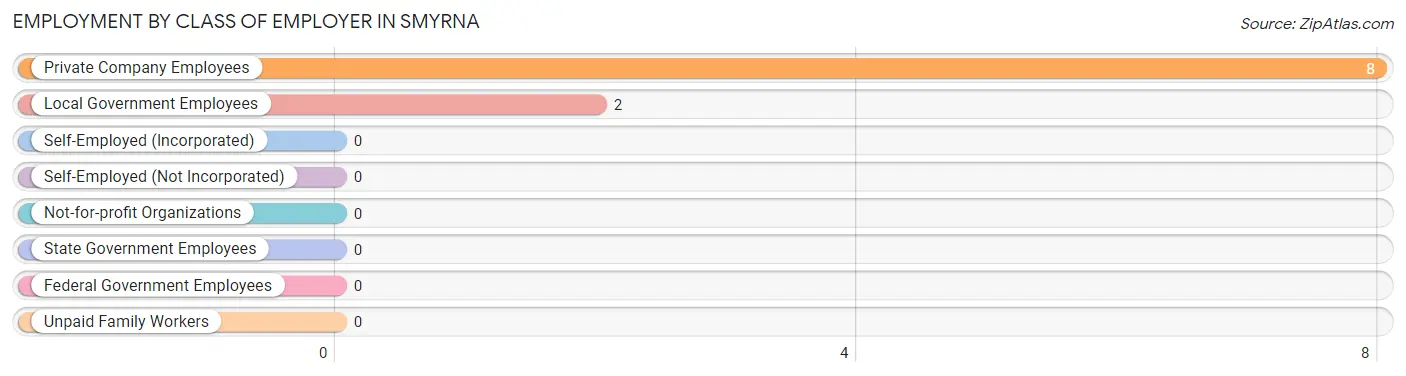
| Employer Class | # Employees | % Employees |
| Private Company Employees | 8 | 80.0% |
| Self-Employed (Incorporated) | 0 | 0.0% |
| Self-Employed (Not Incorporated) | 0 | 0.0% |
| Not-for-profit Organizations | 0 | 0.0% |
| Local Government Employees | 2 | 20.0% |
| State Government Employees | 0 | 0.0% |
| Federal Government Employees | 0 | 0.0% |
| Unpaid Family Workers | 0 | 0.0% |
| Total | 10 | 100.0% |
Employment Status by Age in Smyrna
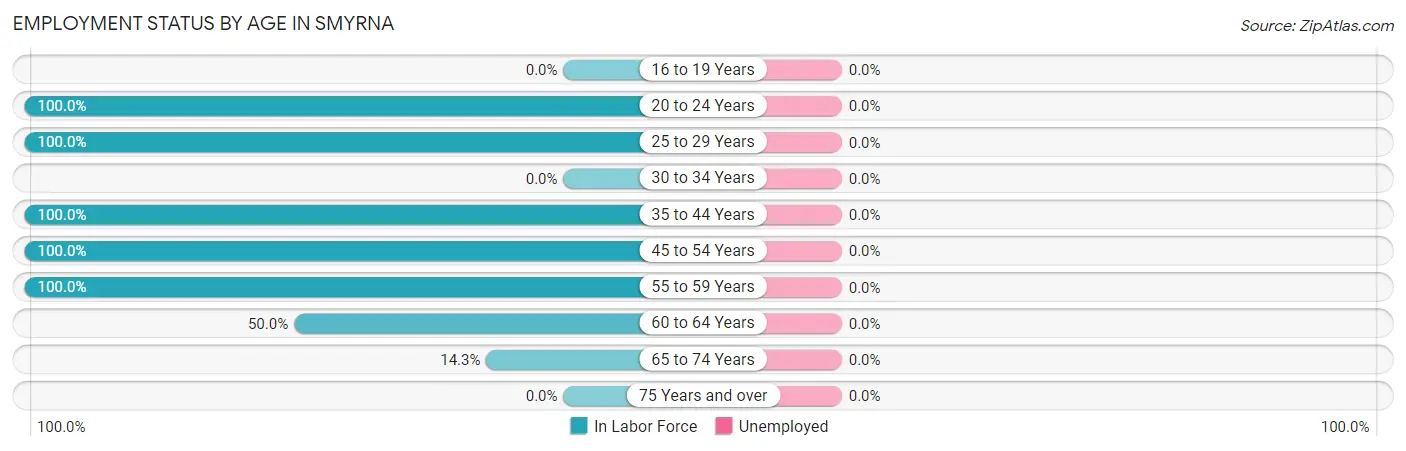
| Age Bracket | In Labor Force | Unemployed |
| 16 to 19 Years | 0 (0.0%) | 0 (0.0%) |
| 20 to 24 Years | 2 (100.0%) | 0 (0.0%) |
| 25 to 29 Years | 1 (100.0%) | 0 (0.0%) |
| 30 to 34 Years | 0 (0.0%) | 0 (0.0%) |
| 35 to 44 Years | 1 (100.0%) | 0 (0.0%) |
| 45 to 54 Years | 2 (100.0%) | 0 (0.0%) |
| 55 to 59 Years | 1 (100.0%) | 0 (0.0%) |
| 60 to 64 Years | 1 (50.0%) | 0 (0.0%) |
| 65 to 74 Years | 2 (14.3%) | 0 (0.0%) |
| 75 Years and over | 0 (0.0%) | 0 (0.0%) |
| Total | 10 (41.7%) | 0 (0.0%) |
Employment Status by Educational Attainment in Smyrna
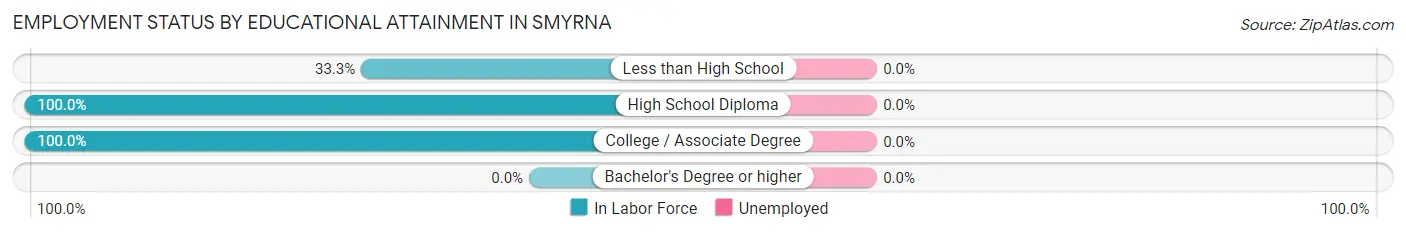
| Educational Attainment | In Labor Force | Unemployed |
| Less than High School | 1 (33.3%) | 0 (0.0%) |
| High School Diploma | 3 (100.0%) | 0 (0.0%) |
| College / Associate Degree | 2 (100.0%) | 0 (0.0%) |
| Bachelor's Degree or higher | 0 (0.0%) | 0 (0.0%) |
| Total | 6 (75.0%) | 0 (0.0%) |
Employment Occupations by Sex in Smyrna
Management, Business, Science and Arts Occupations
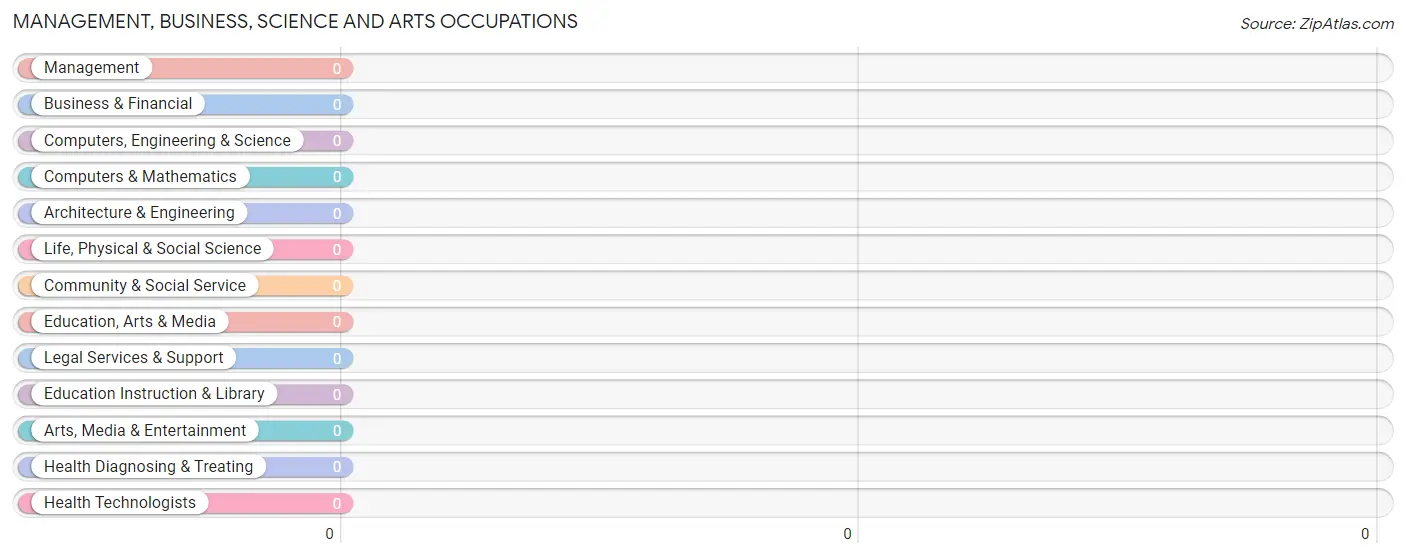
Management, Business, Science and Arts Occupations by Sex
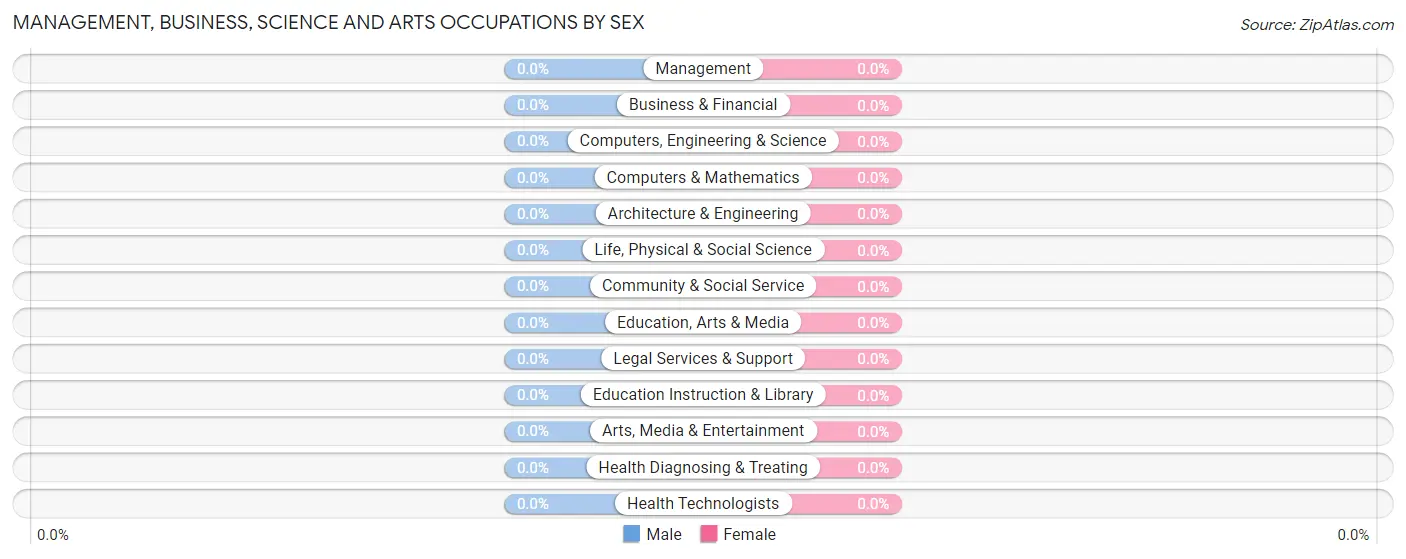
| Occupation | Male | Female |
| Management | 0 (0.0%) | 0 (0.0%) |
| Business & Financial | 0 (0.0%) | 0 (0.0%) |
| Computers, Engineering & Science | 0 (0.0%) | 0 (0.0%) |
| Computers & Mathematics | 0 (0.0%) | 0 (0.0%) |
| Architecture & Engineering | 0 (0.0%) | 0 (0.0%) |
| Life, Physical & Social Science | 0 (0.0%) | 0 (0.0%) |
| Community & Social Service | 0 (0.0%) | 0 (0.0%) |
| Education, Arts & Media | 0 (0.0%) | 0 (0.0%) |
| Legal Services & Support | 0 (0.0%) | 0 (0.0%) |
| Education Instruction & Library | 0 (0.0%) | 0 (0.0%) |
| Arts, Media & Entertainment | 0 (0.0%) | 0 (0.0%) |
| Health Diagnosing & Treating | 0 (0.0%) | 0 (0.0%) |
| Health Technologists | 0 (0.0%) | 0 (0.0%) |
| Total (Category) | 0 (0.0%) | 0 (0.0%) |
| Total (Overall) | 7 (70.0%) | 3 (30.0%) |
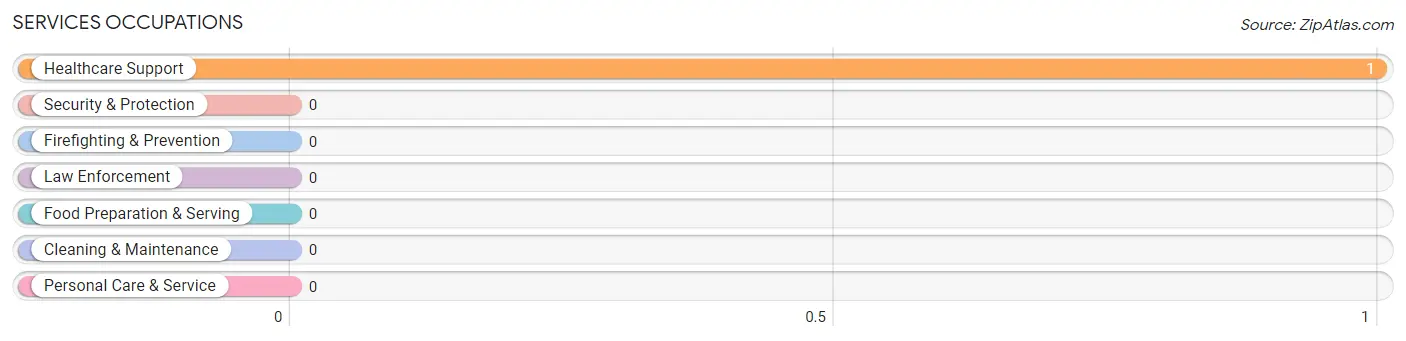
Services Occupations
The most common Services occupations in Smyrna are , and Healthcare Support (1 | 10.0%).
Services Occupations by Sex
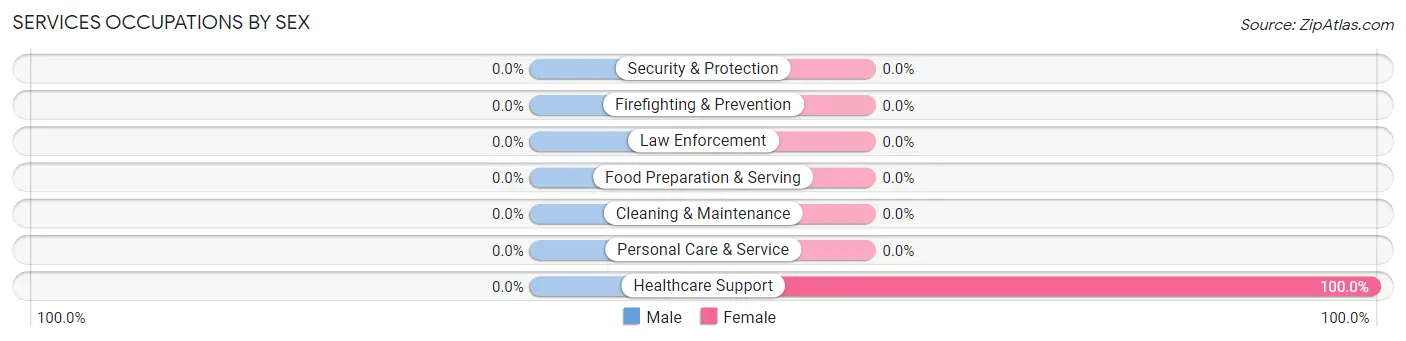
| Occupation | Male | Female |
| Healthcare Support | 0 (0.0%) | 1 (100.0%) |
| Security & Protection | 0 (0.0%) | 0 (0.0%) |
| Firefighting & Prevention | 0 (0.0%) | 0 (0.0%) |
| Law Enforcement | 0 (0.0%) | 0 (0.0%) |
| Food Preparation & Serving | 0 (0.0%) | 0 (0.0%) |
| Cleaning & Maintenance | 0 (0.0%) | 0 (0.0%) |
| Personal Care & Service | 0 (0.0%) | 0 (0.0%) |
| Total (Category) | 0 (0.0%) | 1 (100.0%) |
| Total (Overall) | 7 (70.0%) | 3 (30.0%) |
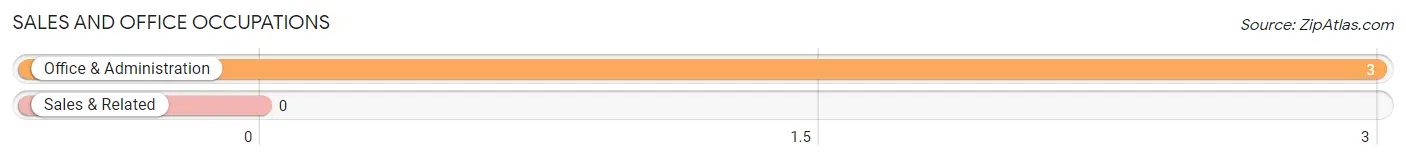
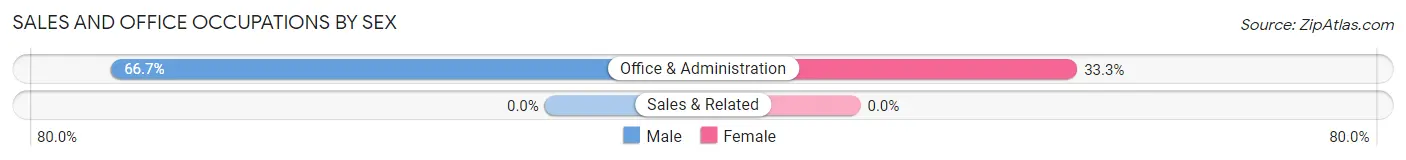
Sales and Office Occupations
The most common Sales and Office occupations in Smyrna are , and Office & Administration (3 | 30.0%).
Sales and Office Occupations by Sex
| Occupation | Male | Female |
| Sales & Related | 0 (0.0%) | 0 (0.0%) |
| Office & Administration | 2 (66.7%) | 1 (33.3%) |
| Total (Category) | 2 (66.7%) | 1 (33.3%) |
| Total (Overall) | 7 (70.0%) | 3 (30.0%) |
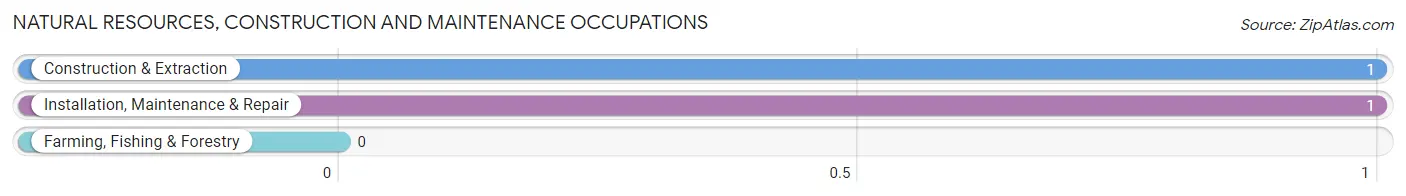
Natural Resources, Construction and Maintenance Occupations
The most common Natural Resources, Construction and Maintenance occupations in Smyrna are Construction & Extraction (1 | 10.0%), and Installation, Maintenance & Repair (1 | 10.0%).
Natural Resources, Construction and Maintenance Occupations by Sex
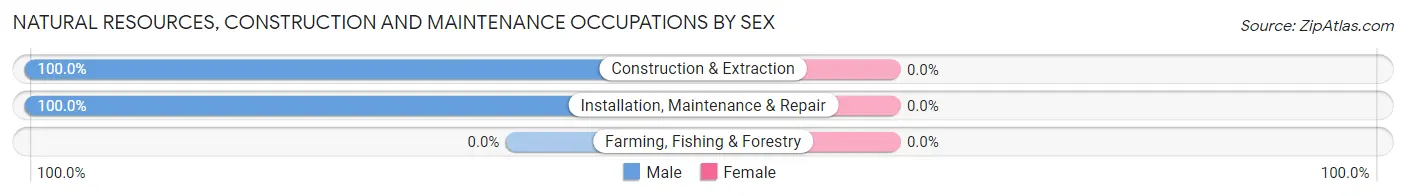
| Occupation | Male | Female |
| Farming, Fishing & Forestry | 0 (0.0%) | 0 (0.0%) |
| Construction & Extraction | 1 (100.0%) | 0 (0.0%) |
| Installation, Maintenance & Repair | 1 (100.0%) | 0 (0.0%) |
| Total (Category) | 2 (100.0%) | 0 (0.0%) |
| Total (Overall) | 7 (70.0%) | 3 (30.0%) |
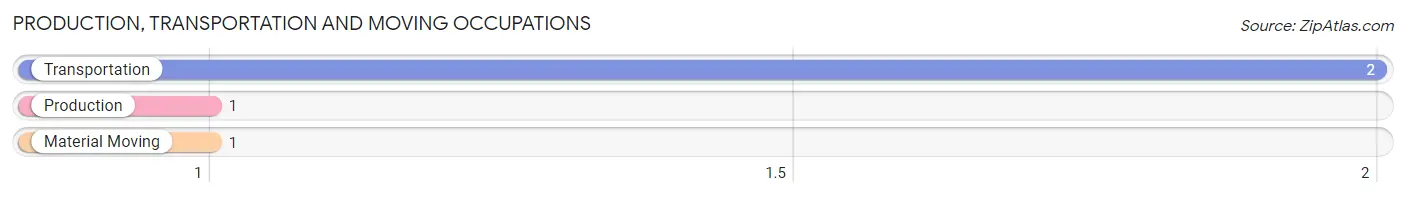
Production, Transportation and Moving Occupations
The most common Production, Transportation and Moving occupations in Smyrna are Transportation (2 | 20.0%), Production (1 | 10.0%), and Material Moving (1 | 10.0%).
Production, Transportation and Moving Occupations by Sex
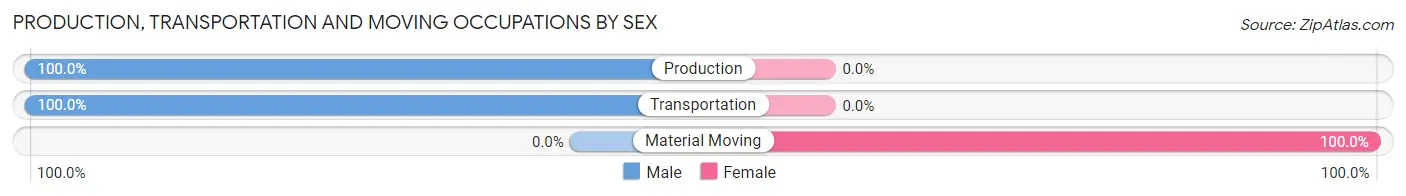
| Occupation | Male | Female |
| Production | 1 (100.0%) | 0 (0.0%) |
| Transportation | 2 (100.0%) | 0 (0.0%) |
| Material Moving | 0 (0.0%) | 1 (100.0%) |
| Total (Category) | 3 (75.0%) | 1 (25.0%) |
| Total (Overall) | 7 (70.0%) | 3 (30.0%) |
Employment Industries by Sex in Smyrna
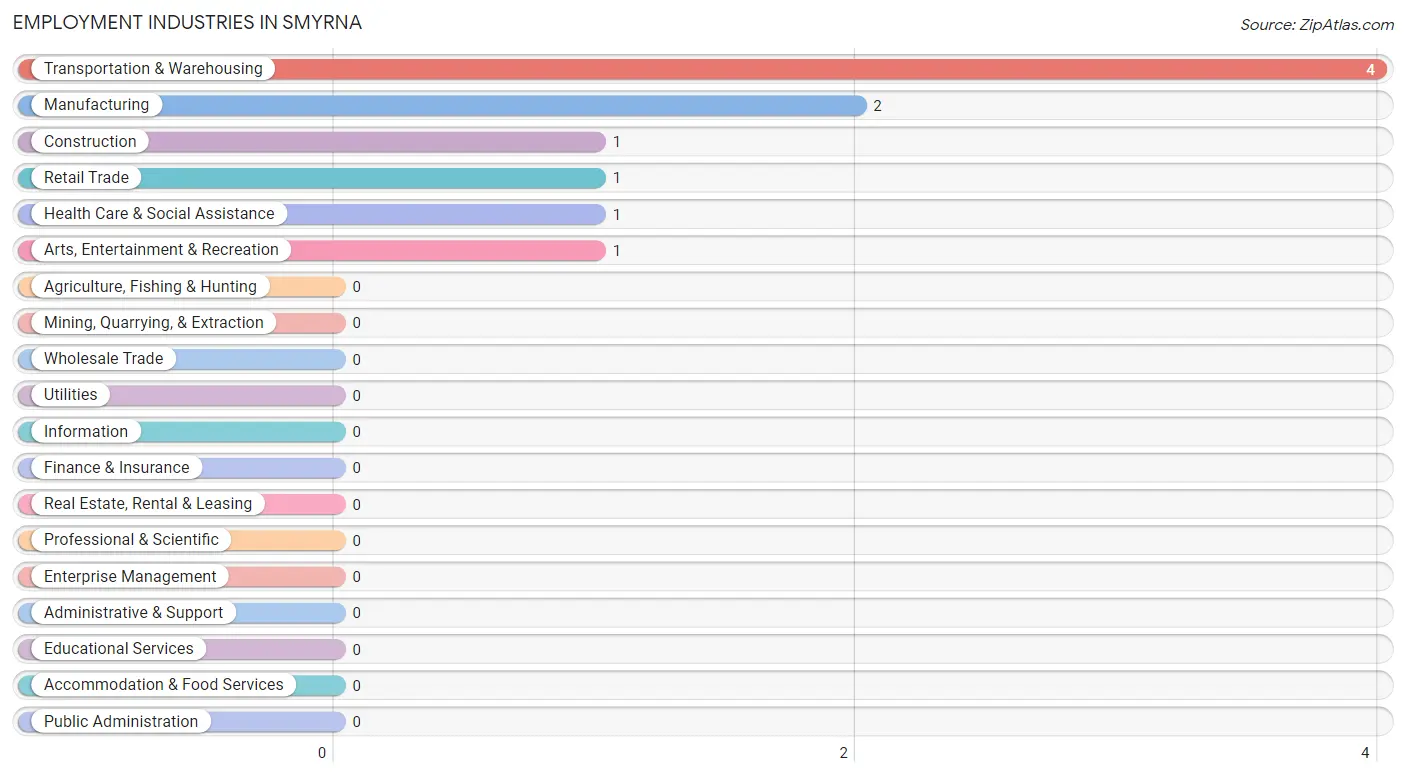
Employment Industries in Smyrna
The major employment industries in Smyrna include Transportation & Warehousing (4 | 40.0%), Manufacturing (2 | 20.0%), Construction (1 | 10.0%), Retail Trade (1 | 10.0%), and Health Care & Social Assistance (1 | 10.0%).
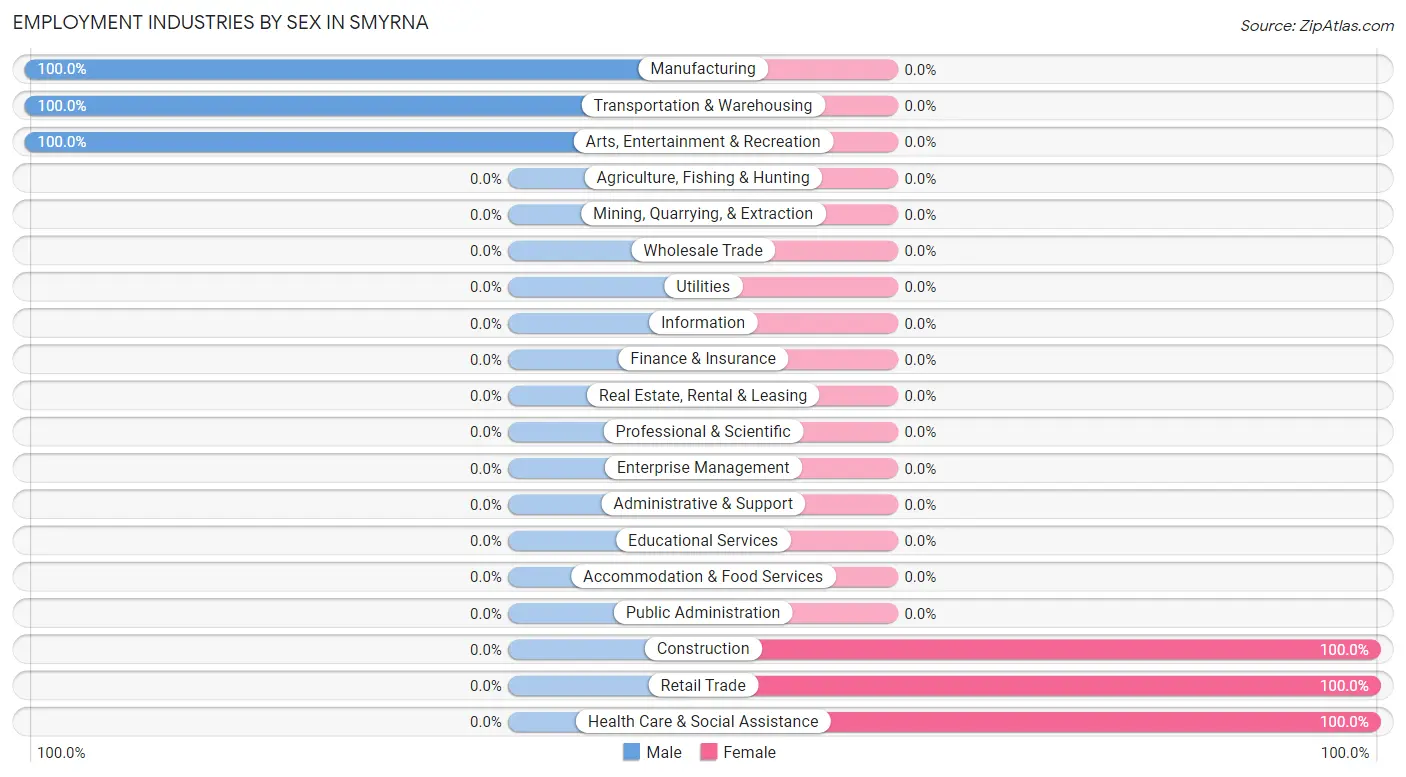
Employment Industries by Sex in Smyrna
The Smyrna industries that see more men than women are Manufacturing (100.0%), Transportation & Warehousing (100.0%), and Arts, Entertainment & Recreation (100.0%), whereas the industries that tend to have a higher number of women are Construction (100.0%), Retail Trade (100.0%), and Health Care & Social Assistance (100.0%).
| Industry | Male | Female |
| Agriculture, Fishing & Hunting | 0 (0.0%) | 0 (0.0%) |
| Mining, Quarrying, & Extraction | 0 (0.0%) | 0 (0.0%) |
| Construction | 0 (0.0%) | 1 (100.0%) |
| Manufacturing | 2 (100.0%) | 0 (0.0%) |
| Wholesale Trade | 0 (0.0%) | 0 (0.0%) |
| Retail Trade | 0 (0.0%) | 1 (100.0%) |
| Transportation & Warehousing | 4 (100.0%) | 0 (0.0%) |
| Utilities | 0 (0.0%) | 0 (0.0%) |
| Information | 0 (0.0%) | 0 (0.0%) |
| Finance & Insurance | 0 (0.0%) | 0 (0.0%) |
| Real Estate, Rental & Leasing | 0 (0.0%) | 0 (0.0%) |
| Professional & Scientific | 0 (0.0%) | 0 (0.0%) |
| Enterprise Management | 0 (0.0%) | 0 (0.0%) |
| Administrative & Support | 0 (0.0%) | 0 (0.0%) |
| Educational Services | 0 (0.0%) | 0 (0.0%) |
| Health Care & Social Assistance | 0 (0.0%) | 1 (100.0%) |
| Arts, Entertainment & Recreation | 1 (100.0%) | 0 (0.0%) |
| Accommodation & Food Services | 0 (0.0%) | 0 (0.0%) |
| Public Administration | 0 (0.0%) | 0 (0.0%) |
| Total | 7 (70.0%) | 3 (30.0%) |
Education in Smyrna
School Enrollment in Smyrna
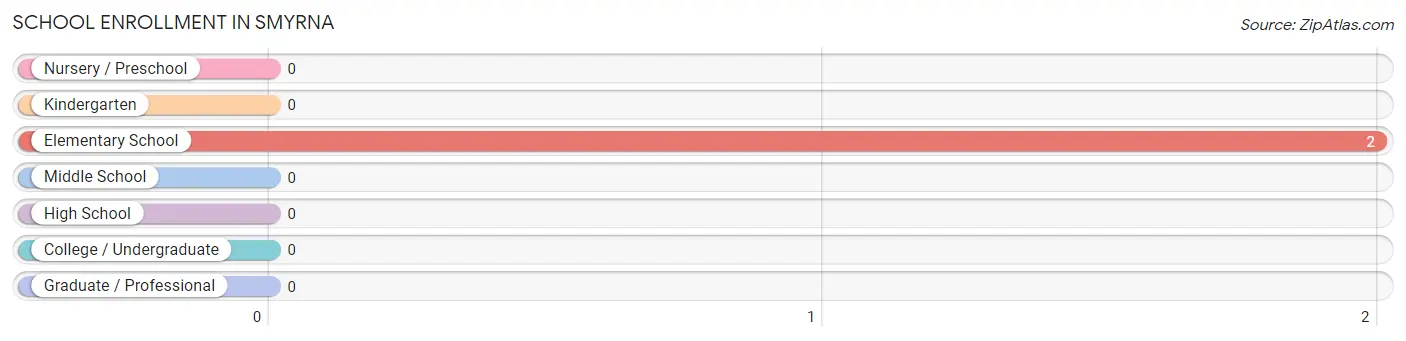
| School Level | # Students | % Students |
| Nursery / Preschool | 0 | 0.0% |
| Kindergarten | 0 | 0.0% |
| Elementary School | 2 | 100.0% |
| Middle School | 0 | 0.0% |
| High School | 0 | 0.0% |
| College / Undergraduate | 0 | 0.0% |
| Graduate / Professional | 0 | 0.0% |
| Total | 2 | 100.0% |
School Enrollment by Age by Funding Source in Smyrna
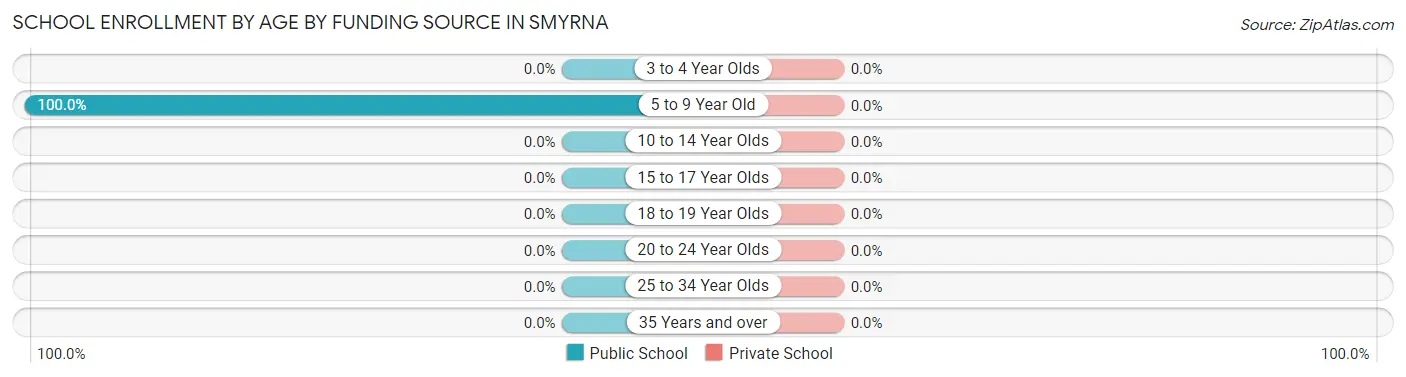
| Age Bracket | Public School | Private School |
| 3 to 4 Year Olds | 0 (0.0%) | 0 (0.0%) |
| 5 to 9 Year Old | 2 (100.0%) | 0 (0.0%) |
| 10 to 14 Year Olds | 0 (0.0%) | 0 (0.0%) |
| 15 to 17 Year Olds | 0 (0.0%) | 0 (0.0%) |
| 18 to 19 Year Olds | 0 (0.0%) | 0 (0.0%) |
| 20 to 24 Year Olds | 0 (0.0%) | 0 (0.0%) |
| 25 to 34 Year Olds | 0 (0.0%) | 0 (0.0%) |
| 35 Years and over | 0 (0.0%) | 0 (0.0%) |
| Total | 2 (100.0%) | 0 (0.0%) |
Educational Attainment by Field of Study in Smyrna
Engineering (5 | 50.0%), and business (5 | 50.0%) are the most common fields of study among 10 individuals in Smyrna who have obtained a bachelor's degree or higher.
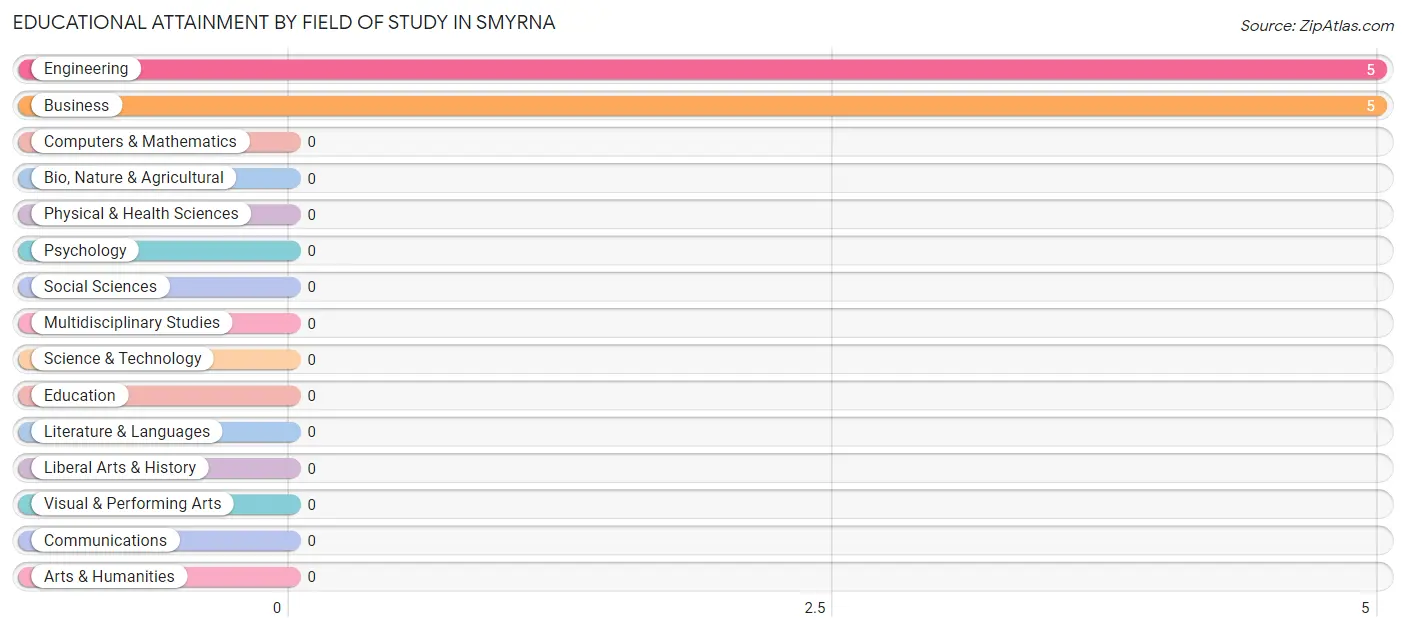
| Field of Study | # Graduates | % Graduates |
| Computers & Mathematics | 0 | 0.0% |
| Bio, Nature & Agricultural | 0 | 0.0% |
| Physical & Health Sciences | 0 | 0.0% |
| Psychology | 0 | 0.0% |
| Social Sciences | 0 | 0.0% |
| Engineering | 5 | 50.0% |
| Multidisciplinary Studies | 0 | 0.0% |
| Science & Technology | 0 | 0.0% |
| Business | 5 | 50.0% |
| Education | 0 | 0.0% |
| Literature & Languages | 0 | 0.0% |
| Liberal Arts & History | 0 | 0.0% |
| Visual & Performing Arts | 0 | 0.0% |
| Communications | 0 | 0.0% |
| Arts & Humanities | 0 | 0.0% |
| Total | 10 | 100.0% |
Transportation & Commute in Smyrna
Vehicle Availability by Sex in Smyrna
The most prevalent vehicle ownership categories in Smyrna are males with 5 or more vehicles (4, accounting for 57.1%) and females with 5 or more vehicles (0, making up 133.3%).
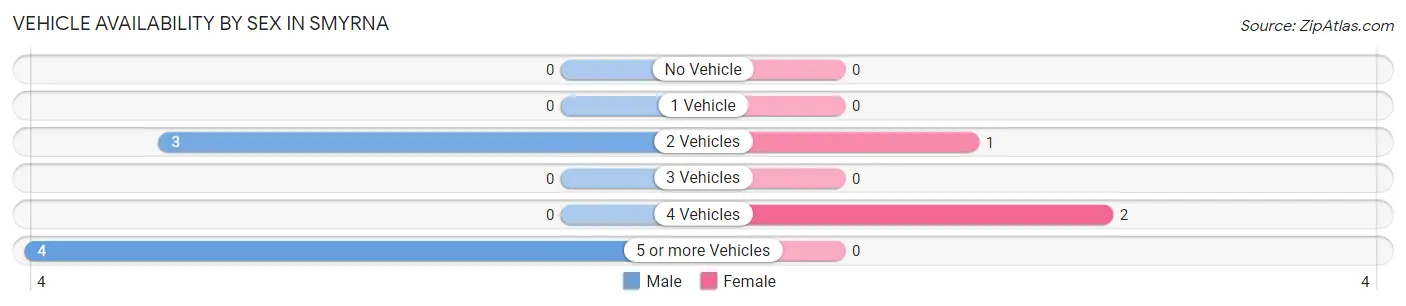
| Vehicles Available | Male | Female |
| No Vehicle | 0 (0.0%) | 0 (0.0%) |
| 1 Vehicle | 0 (0.0%) | 0 (0.0%) |
| 2 Vehicles | 3 (42.9%) | 1 (33.3%) |
| 3 Vehicles | 0 (0.0%) | 0 (0.0%) |
| 4 Vehicles | 0 (0.0%) | 2 (66.7%) |
| 5 or more Vehicles | 4 (57.1%) | 0 (0.0%) |
| Total | 7 (100.0%) | 3 (100.0%) |
Commute Time in Smyrna
The most frequently occuring commute durations in Smyrna are 45 to 59 minutes (3 commuters, 30.0%), 60 to 89 minutes (3 commuters, 30.0%), and 25 to 29 minutes (2 commuters, 20.0%).
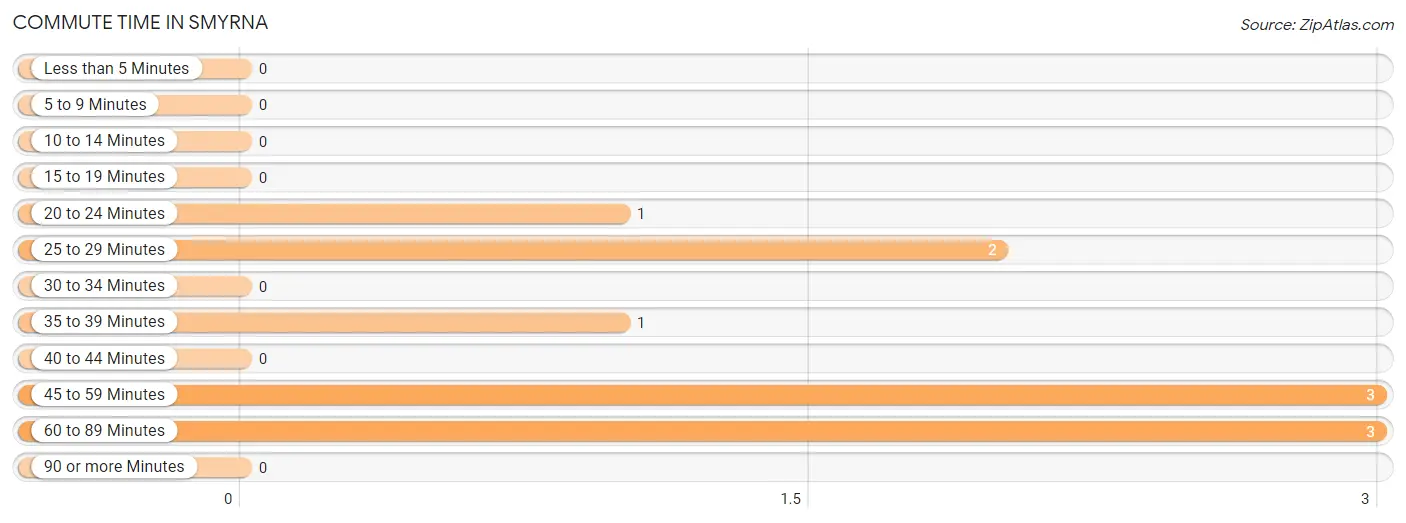
| Commute Time | # Commuters | % Commuters |
| Less than 5 Minutes | 0 | 0.0% |
| 5 to 9 Minutes | 0 | 0.0% |
| 10 to 14 Minutes | 0 | 0.0% |
| 15 to 19 Minutes | 0 | 0.0% |
| 20 to 24 Minutes | 1 | 10.0% |
| 25 to 29 Minutes | 2 | 20.0% |
| 30 to 34 Minutes | 0 | 0.0% |
| 35 to 39 Minutes | 1 | 10.0% |
| 40 to 44 Minutes | 0 | 0.0% |
| 45 to 59 Minutes | 3 | 30.0% |
| 60 to 89 Minutes | 3 | 30.0% |
| 90 or more Minutes | 0 | 0.0% |
Commute Time by Sex in Smyrna
The most common commute times in Smyrna are 45 to 59 minutes (3 commuters, 42.9%) for males and 25 to 29 minutes (2 commuters, 66.7%) for females.
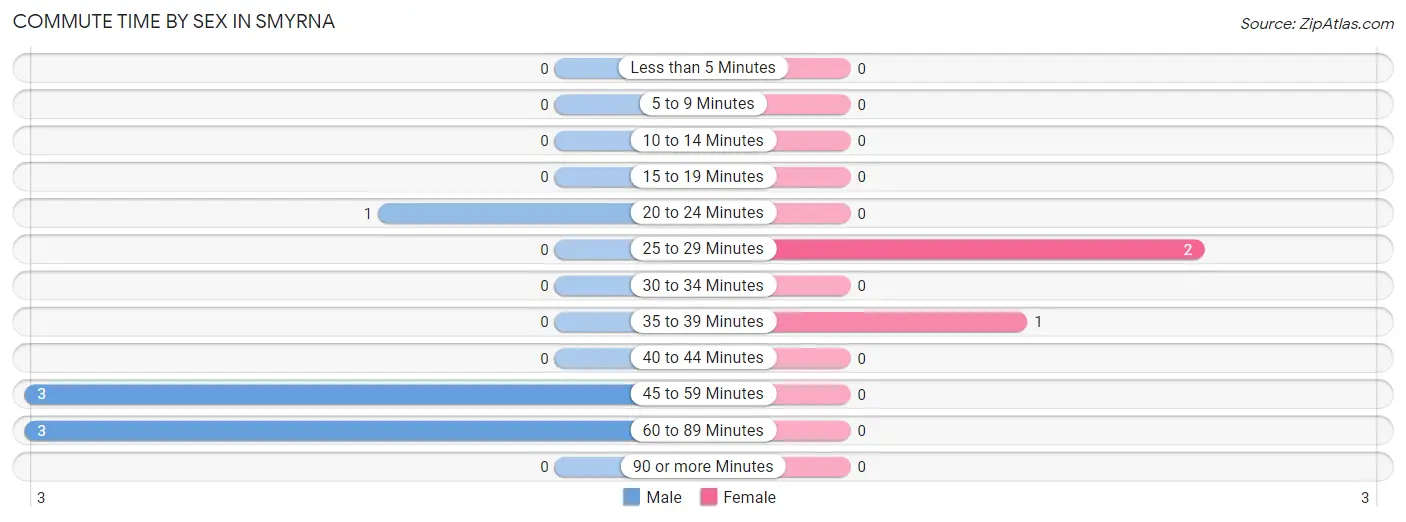
| Commute Time | Male | Female |
| Less than 5 Minutes | 0 (0.0%) | 0 (0.0%) |
| 5 to 9 Minutes | 0 (0.0%) | 0 (0.0%) |
| 10 to 14 Minutes | 0 (0.0%) | 0 (0.0%) |
| 15 to 19 Minutes | 0 (0.0%) | 0 (0.0%) |
| 20 to 24 Minutes | 1 (14.3%) | 0 (0.0%) |
| 25 to 29 Minutes | 0 (0.0%) | 2 (66.7%) |
| 30 to 34 Minutes | 0 (0.0%) | 0 (0.0%) |
| 35 to 39 Minutes | 0 (0.0%) | 1 (33.3%) |
| 40 to 44 Minutes | 0 (0.0%) | 0 (0.0%) |
| 45 to 59 Minutes | 3 (42.9%) | 0 (0.0%) |
| 60 to 89 Minutes | 3 (42.9%) | 0 (0.0%) |
| 90 or more Minutes | 0 (0.0%) | 0 (0.0%) |
Time of Departure to Work by Sex in Smyrna
The most frequent times of departure to work in Smyrna are 7:00 AM to 7:29 AM (3, 42.9%) for males and 5:00 AM to 5:29 AM (1, 33.3%) for females.
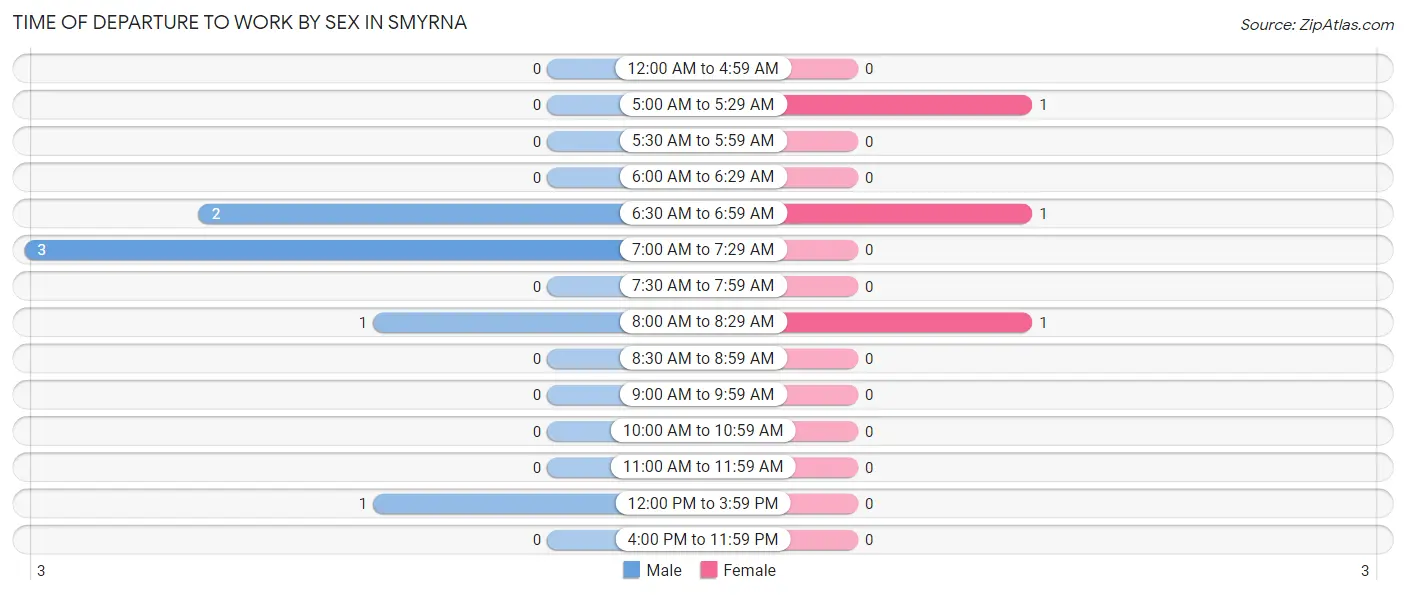
| Time of Departure | Male | Female |
| 12:00 AM to 4:59 AM | 0 (0.0%) | 0 (0.0%) |
| 5:00 AM to 5:29 AM | 0 (0.0%) | 1 (33.3%) |
| 5:30 AM to 5:59 AM | 0 (0.0%) | 0 (0.0%) |
| 6:00 AM to 6:29 AM | 0 (0.0%) | 0 (0.0%) |
| 6:30 AM to 6:59 AM | 2 (28.6%) | 1 (33.3%) |
| 7:00 AM to 7:29 AM | 3 (42.9%) | 0 (0.0%) |
| 7:30 AM to 7:59 AM | 0 (0.0%) | 0 (0.0%) |
| 8:00 AM to 8:29 AM | 1 (14.3%) | 1 (33.3%) |
| 8:30 AM to 8:59 AM | 0 (0.0%) | 0 (0.0%) |
| 9:00 AM to 9:59 AM | 0 (0.0%) | 0 (0.0%) |
| 10:00 AM to 10:59 AM | 0 (0.0%) | 0 (0.0%) |
| 11:00 AM to 11:59 AM | 0 (0.0%) | 0 (0.0%) |
| 12:00 PM to 3:59 PM | 1 (14.3%) | 0 (0.0%) |
| 4:00 PM to 11:59 PM | 0 (0.0%) | 0 (0.0%) |
| Total | 7 (100.0%) | 3 (100.0%) |
Housing Occupancy in Smyrna
Occupancy by Ownership in Smyrna
Of the total 12 dwellings in Smyrna, owner-occupied units account for 12 (100.0%), while renter-occupied units make up 0 (0.0%).
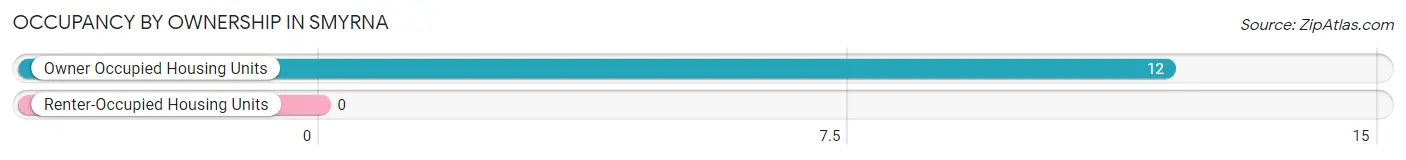
| Occupancy | # Housing Units | % Housing Units |
| Owner Occupied Housing Units | 12 | 100.0% |
| Renter-Occupied Housing Units | 0 | 0.0% |
| Total Occupied Housing Units | 12 | 100.0% |
Occupancy by Household Size in Smyrna
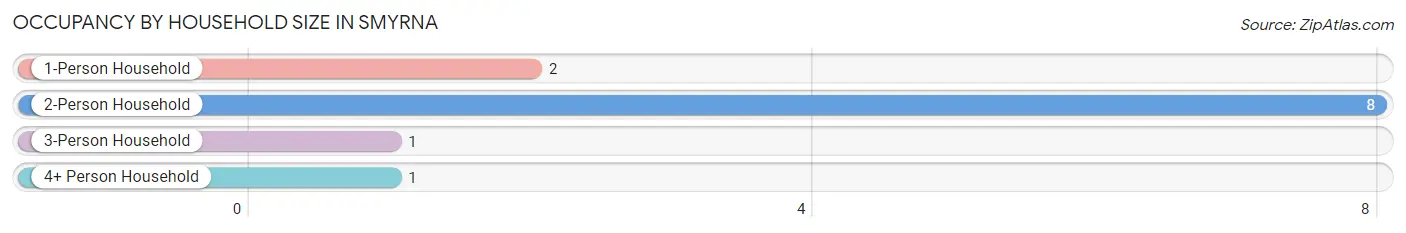
| Household Size | # Housing Units | % Housing Units |
| 1-Person Household | 2 | 16.7% |
| 2-Person Household | 8 | 66.7% |
| 3-Person Household | 1 | 8.3% |
| 4+ Person Household | 1 | 8.3% |
| Total Housing Units | 12 | 100.0% |
Occupancy by Ownership by Household Size in Smyrna
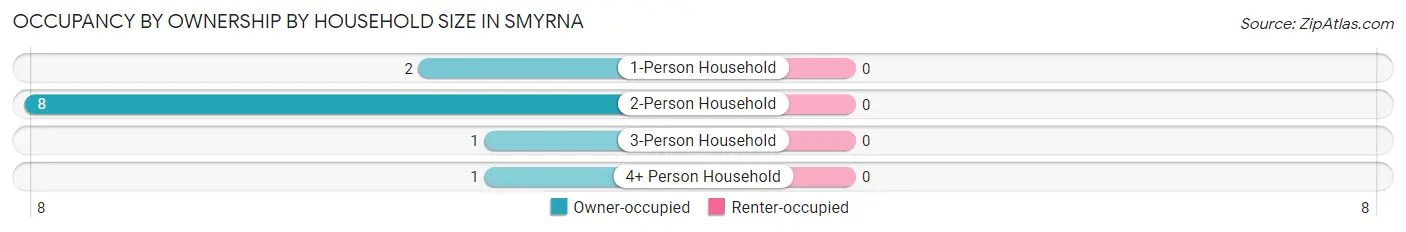
| Household Size | Owner-occupied | Renter-occupied |
| 1-Person Household | 2 (100.0%) | 0 (0.0%) |
| 2-Person Household | 8 (100.0%) | 0 (0.0%) |
| 3-Person Household | 1 (100.0%) | 0 (0.0%) |
| 4+ Person Household | 1 (100.0%) | 0 (0.0%) |
| Total Housing Units | 12 (100.0%) | 0 (0.0%) |
Occupancy by Educational Attainment in Smyrna
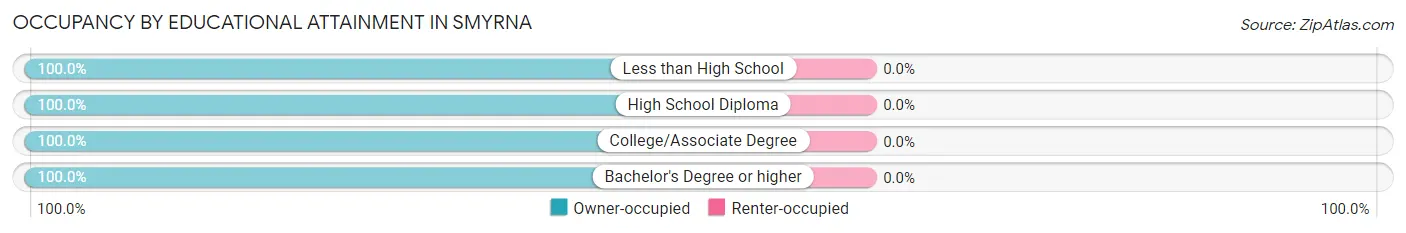
| Household Size | Owner-occupied | Renter-occupied |
| Less than High School | 1 (100.0%) | 0 (0.0%) |
| High School Diploma | 3 (100.0%) | 0 (0.0%) |
| College/Associate Degree | 3 (100.0%) | 0 (0.0%) |
| Bachelor's Degree or higher | 5 (100.0%) | 0 (0.0%) |
Occupancy by Age of Householder in Smyrna
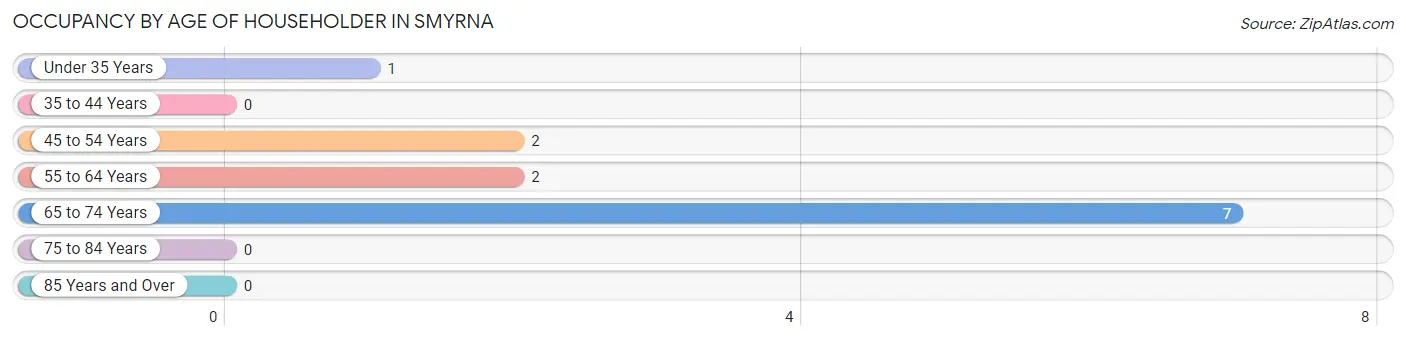
| Age Bracket | # Households | % Households |
| Under 35 Years | 1 | 8.3% |
| 35 to 44 Years | 0 | 0.0% |
| 45 to 54 Years | 2 | 16.7% |
| 55 to 64 Years | 2 | 16.7% |
| 65 to 74 Years | 7 | 58.3% |
| 75 to 84 Years | 0 | 0.0% |
| 85 Years and Over | 0 | 0.0% |
| Total | 12 | 100.0% |
Housing Finances in Smyrna
Median Income by Occupancy in Smyrna
| Occupancy Type | # Households | Median Income |
| Owner-Occupied | 12 (100.0%) | $0 |
| Renter-Occupied | 0 (0.0%) | $0 |
| Average | 12 (100.0%) | $0 |
Occupancy by Householder Income Bracket in Smyrna
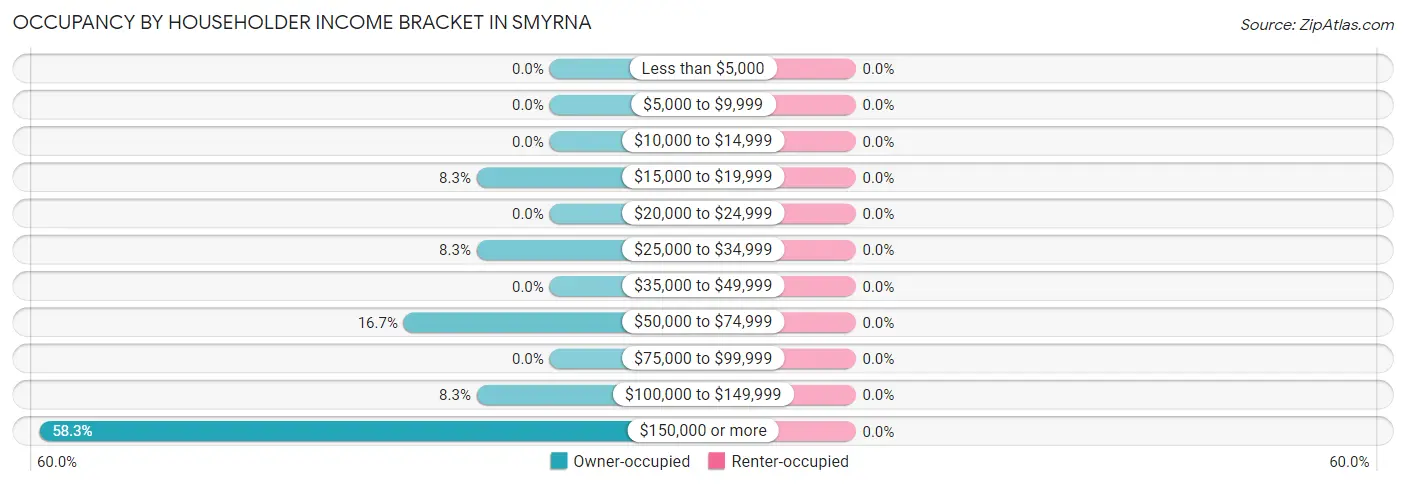
| Income Bracket | Owner-occupied | Renter-occupied |
| Less than $5,000 | 0 (0.0%) | 0 (0.0%) |
| $5,000 to $9,999 | 0 (0.0%) | 0 (0.0%) |
| $10,000 to $14,999 | 0 (0.0%) | 0 (0.0%) |
| $15,000 to $19,999 | 1 (8.3%) | 0 (0.0%) |
| $20,000 to $24,999 | 0 (0.0%) | 0 (0.0%) |
| $25,000 to $34,999 | 1 (8.3%) | 0 (0.0%) |
| $35,000 to $49,999 | 0 (0.0%) | 0 (0.0%) |
| $50,000 to $74,999 | 2 (16.7%) | 0 (0.0%) |
| $75,000 to $99,999 | 0 (0.0%) | 0 (0.0%) |
| $100,000 to $149,999 | 1 (8.3%) | 0 (0.0%) |
| $150,000 or more | 7 (58.3%) | 0 (0.0%) |
| Total | 12 (100.0%) | 0 (0.0%) |
Monthly Housing Cost Tiers in Smyrna
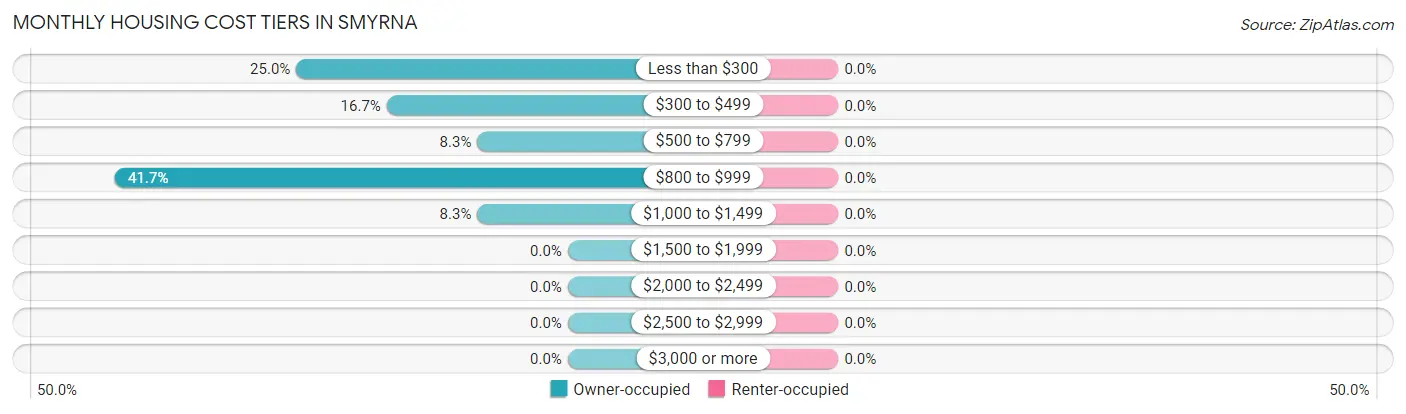
| Monthly Cost | Owner-occupied | Renter-occupied |
| Less than $300 | 3 (25.0%) | 0 (0.0%) |
| $300 to $499 | 2 (16.7%) | 0 (0.0%) |
| $500 to $799 | 1 (8.3%) | 0 (0.0%) |
| $800 to $999 | 5 (41.7%) | 0 (0.0%) |
| $1,000 to $1,499 | 1 (8.3%) | 0 (0.0%) |
| $1,500 to $1,999 | 0 (0.0%) | 0 (0.0%) |
| $2,000 to $2,499 | 0 (0.0%) | 0 (0.0%) |
| $2,500 to $2,999 | 0 (0.0%) | 0 (0.0%) |
| $3,000 or more | 0 (0.0%) | 0 (0.0%) |
| Total | 12 (100.0%) | 0 (0.0%) |
Physical Housing Characteristics in Smyrna
Housing Structures in Smyrna
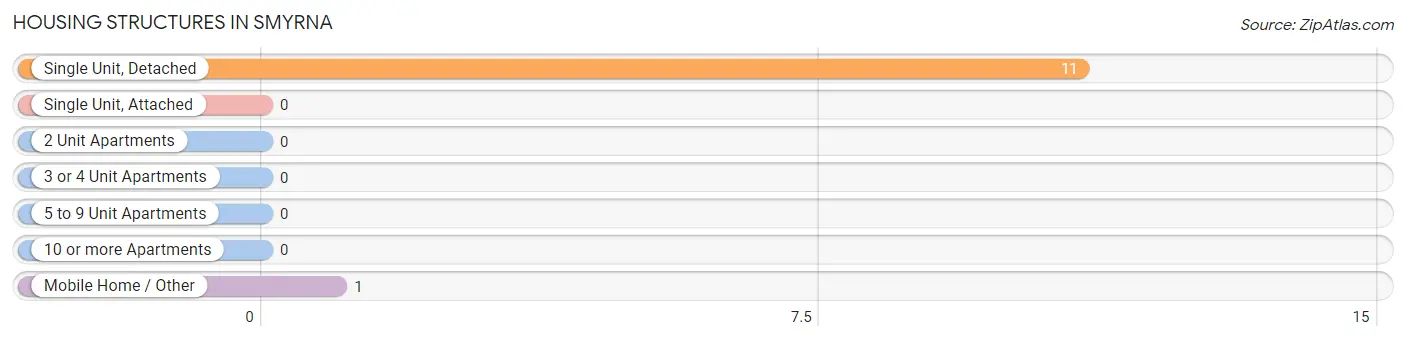
| Structure Type | # Housing Units | % Housing Units |
| Single Unit, Detached | 11 | 91.7% |
| Single Unit, Attached | 0 | 0.0% |
| 2 Unit Apartments | 0 | 0.0% |
| 3 or 4 Unit Apartments | 0 | 0.0% |
| 5 to 9 Unit Apartments | 0 | 0.0% |
| 10 or more Apartments | 0 | 0.0% |
| Mobile Home / Other | 1 | 8.3% |
| Total | 12 | 100.0% |
Housing Structures by Occupancy in Smyrna
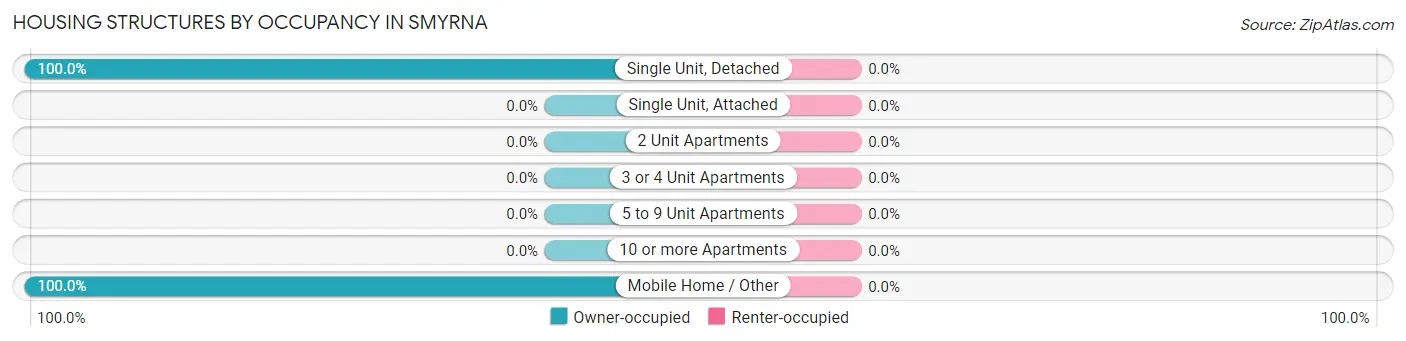
| Structure Type | Owner-occupied | Renter-occupied |
| Single Unit, Detached | 11 (100.0%) | 0 (0.0%) |
| Single Unit, Attached | 0 (0.0%) | 0 (0.0%) |
| 2 Unit Apartments | 0 (0.0%) | 0 (0.0%) |
| 3 or 4 Unit Apartments | 0 (0.0%) | 0 (0.0%) |
| 5 to 9 Unit Apartments | 0 (0.0%) | 0 (0.0%) |
| 10 or more Apartments | 0 (0.0%) | 0 (0.0%) |
| Mobile Home / Other | 1 (100.0%) | 0 (0.0%) |
| Total | 12 (100.0%) | 0 (0.0%) |
Housing Structures by Number of Rooms in Smyrna
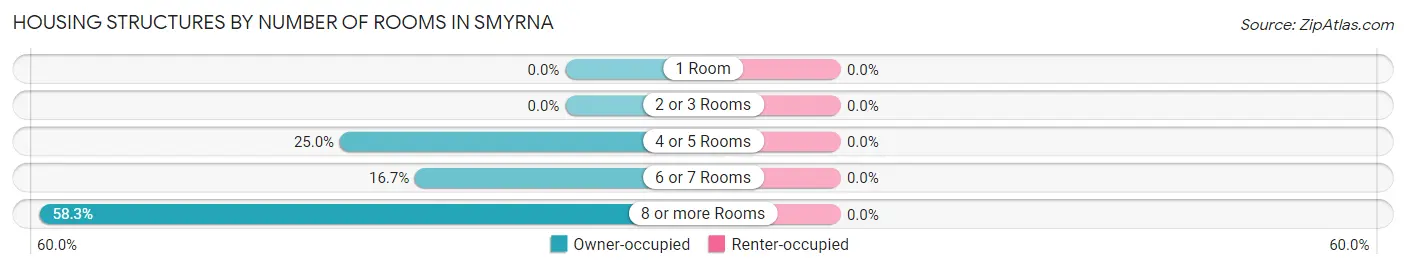
| Number of Rooms | Owner-occupied | Renter-occupied |
| 1 Room | 0 (0.0%) | 0 (0.0%) |
| 2 or 3 Rooms | 0 (0.0%) | 0 (0.0%) |
| 4 or 5 Rooms | 3 (25.0%) | 0 (0.0%) |
| 6 or 7 Rooms | 2 (16.7%) | 0 (0.0%) |
| 8 or more Rooms | 7 (58.3%) | 0 (0.0%) |
| Total | 12 (100.0%) | 0 (0.0%) |
Housing Structure by Heating Type in Smyrna
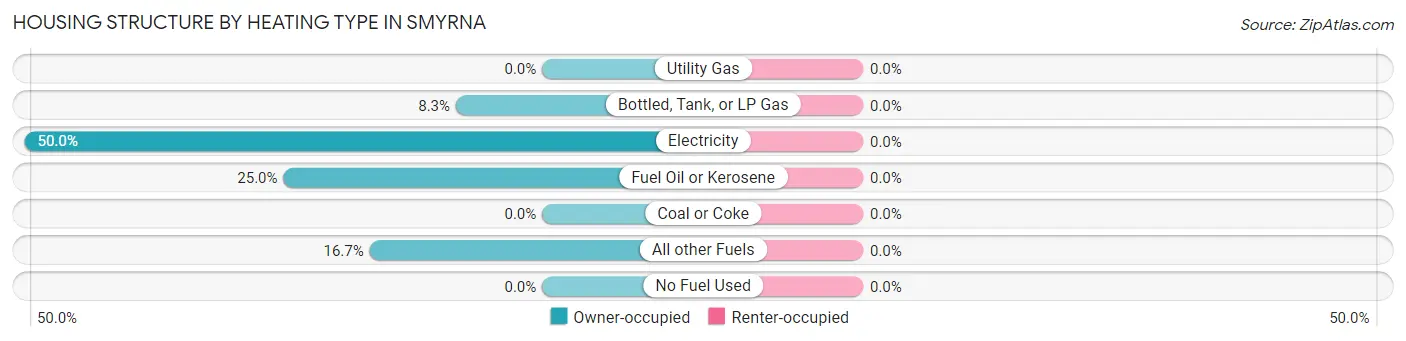
| Heating Type | Owner-occupied | Renter-occupied |
| Utility Gas | 0 (0.0%) | 0 (0.0%) |
| Bottled, Tank, or LP Gas | 1 (8.3%) | 0 (0.0%) |
| Electricity | 6 (50.0%) | 0 (0.0%) |
| Fuel Oil or Kerosene | 3 (25.0%) | 0 (0.0%) |
| Coal or Coke | 0 (0.0%) | 0 (0.0%) |
| All other Fuels | 2 (16.7%) | 0 (0.0%) |
| No Fuel Used | 0 (0.0%) | 0 (0.0%) |
| Total | 12 (100.0%) | 0 (0.0%) |
Household Vehicle Usage in Smyrna
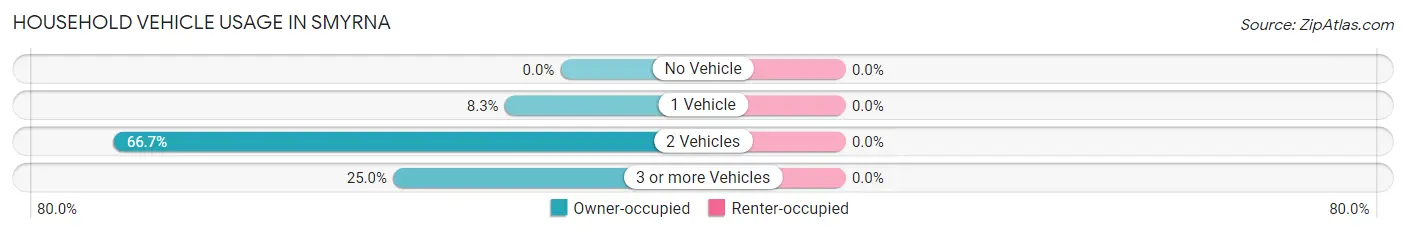
| Vehicles per Household | Owner-occupied | Renter-occupied |
| No Vehicle | 0 (0.0%) | 0 (0.0%) |
| 1 Vehicle | 1 (8.3%) | 0 (0.0%) |
| 2 Vehicles | 8 (66.7%) | 0 (0.0%) |
| 3 or more Vehicles | 3 (25.0%) | 0 (0.0%) |
| Total | 12 (100.0%) | 0 (0.0%) |
Real Estate & Mortgages in Smyrna
Real Estate and Mortgage Overview in Smyrna
| Characteristic | Without Mortgage | With Mortgage |
| Housing Units | 10 | 2 |
| Median Property Value | - | - |
| Median Household Income | - | - |
| Monthly Housing Costs | - | - |
| Real Estate Taxes | - | - |
Property Value by Mortgage Status in Smyrna
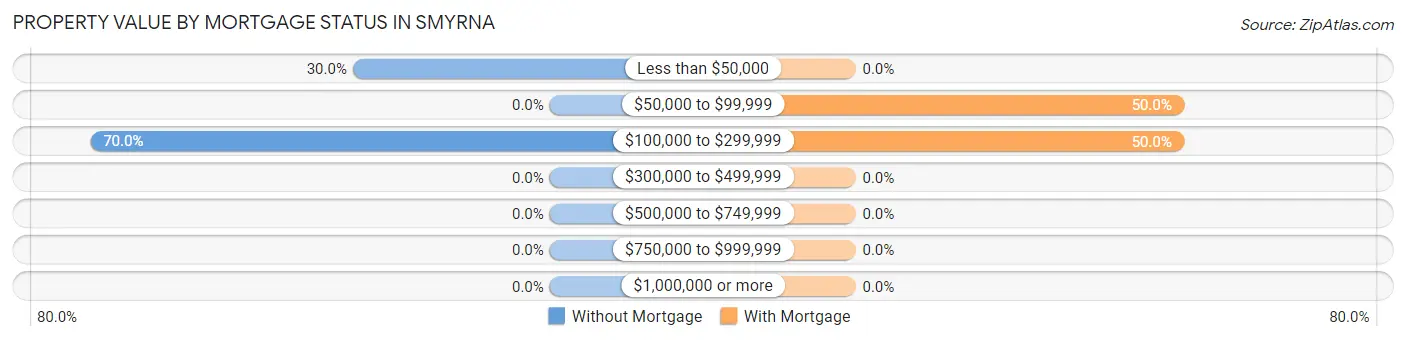
| Property Value | Without Mortgage | With Mortgage |
| Less than $50,000 | 3 (30.0%) | 0 (0.0%) |
| $50,000 to $99,999 | 0 (0.0%) | 1 (50.0%) |
| $100,000 to $299,999 | 7 (70.0%) | 1 (50.0%) |
| $300,000 to $499,999 | 0 (0.0%) | 0 (0.0%) |
| $500,000 to $749,999 | 0 (0.0%) | 0 (0.0%) |
| $750,000 to $999,999 | 0 (0.0%) | 0 (0.0%) |
| $1,000,000 or more | 0 (0.0%) | 0 (0.0%) |
| Total | 10 (100.0%) | 2 (100.0%) |
Household Income by Mortgage Status in Smyrna
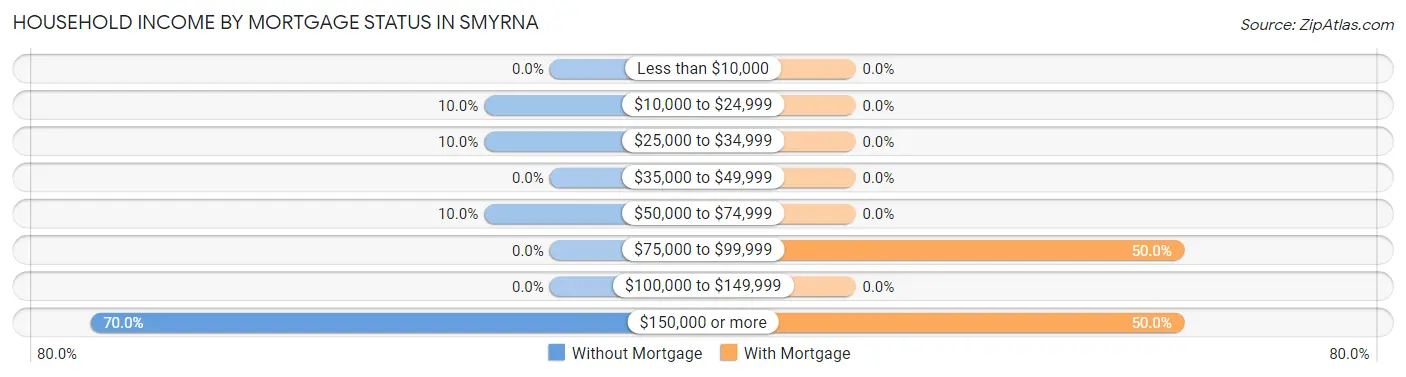
| Household Income | Without Mortgage | With Mortgage |
| Less than $10,000 | 0 (0.0%) | 0 (0.0%) |
| $10,000 to $24,999 | 1 (10.0%) | 0 (0.0%) |
| $25,000 to $34,999 | 1 (10.0%) | 0 (0.0%) |
| $35,000 to $49,999 | 0 (0.0%) | 0 (0.0%) |
| $50,000 to $74,999 | 1 (10.0%) | 0 (0.0%) |
| $75,000 to $99,999 | 0 (0.0%) | 1 (50.0%) |
| $100,000 to $149,999 | 0 (0.0%) | 0 (0.0%) |
| $150,000 or more | 7 (70.0%) | 1 (50.0%) |
| Total | 10 (100.0%) | 2 (100.0%) |
Property Value to Household Income Ratio in Smyrna
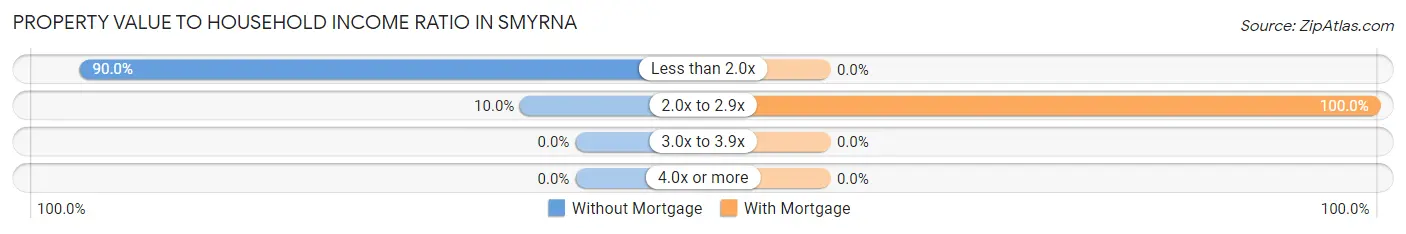
| Value-to-Income Ratio | Without Mortgage | With Mortgage |
| Less than 2.0x | 9 (90.0%) | 0 (0.0%) |
| 2.0x to 2.9x | 1 (10.0%) | 2 (100.0%) |
| 3.0x to 3.9x | 0 (0.0%) | 0 (0.0%) |
| 4.0x or more | 0 (0.0%) | 0 (0.0%) |
| Total | 10 (100.0%) | 2 (100.0%) |
Real Estate Taxes by Mortgage Status in Smyrna
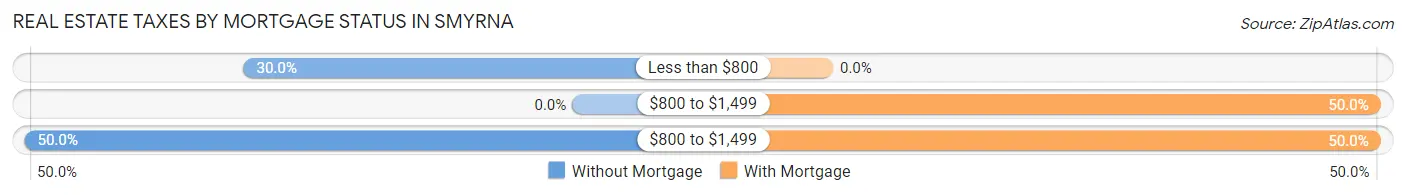
| Property Taxes | Without Mortgage | With Mortgage |
| Less than $800 | 3 (30.0%) | 0 (0.0%) |
| $800 to $1,499 | 0 (0.0%) | 1 (50.0%) |
| $800 to $1,499 | 5 (50.0%) | 1 (50.0%) |
| Total | 10 (100.0%) | 2 (100.0%) |
Health & Disability in Smyrna
Health Insurance Coverage by Age in Smyrna
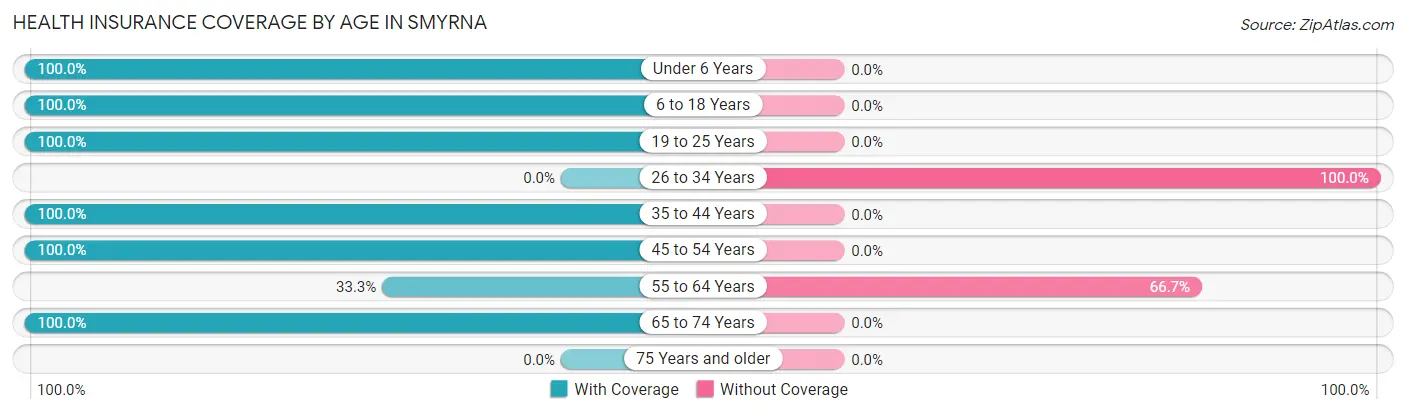
| Age Bracket | With Coverage | Without Coverage |
| Under 6 Years | 2 (100.0%) | 0 (0.0%) |
| 6 to 18 Years | 2 (100.0%) | 0 (0.0%) |
| 19 to 25 Years | 2 (100.0%) | 0 (0.0%) |
| 26 to 34 Years | 0 (0.0%) | 2 (100.0%) |
| 35 to 44 Years | 1 (100.0%) | 0 (0.0%) |
| 45 to 54 Years | 2 (100.0%) | 0 (0.0%) |
| 55 to 64 Years | 1 (33.3%) | 2 (66.7%) |
| 65 to 74 Years | 14 (100.0%) | 0 (0.0%) |
| 75 Years and older | 0 (0.0%) | 0 (0.0%) |
| Total | 24 (85.7%) | 4 (14.3%) |
Health Insurance Coverage by Citizenship Status in Smyrna
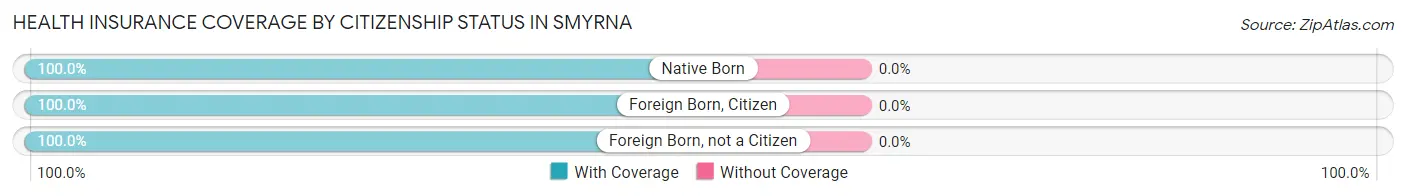
| Citizenship Status | With Coverage | Without Coverage |
| Native Born | 2 (100.0%) | 0 (0.0%) |
| Foreign Born, Citizen | 2 (100.0%) | 0 (0.0%) |
| Foreign Born, not a Citizen | 2 (100.0%) | 0 (0.0%) |
Health Insurance Coverage by Household Income in Smyrna
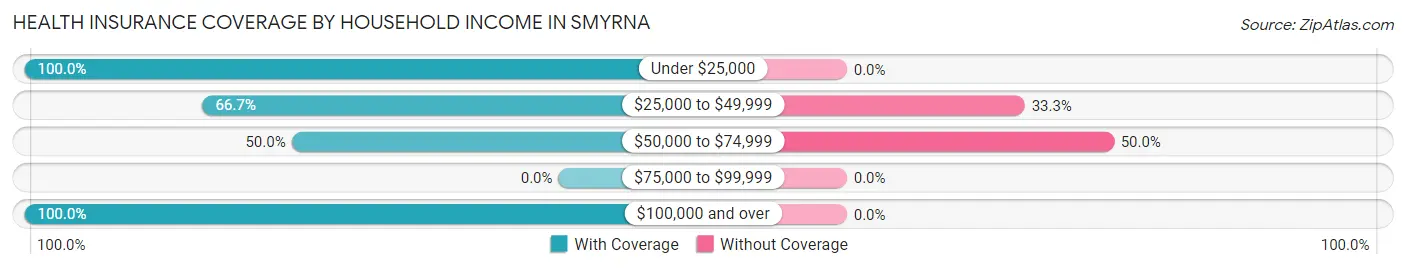
| Household Income | With Coverage | Without Coverage |
| Under $25,000 | 1 (100.0%) | 0 (0.0%) |
| $25,000 to $49,999 | 4 (66.7%) | 2 (33.3%) |
| $50,000 to $74,999 | 2 (50.0%) | 2 (50.0%) |
| $75,000 to $99,999 | 0 (0.0%) | 0 (0.0%) |
| $100,000 and over | 17 (100.0%) | 0 (0.0%) |
Public vs Private Health Insurance Coverage by Age in Smyrna
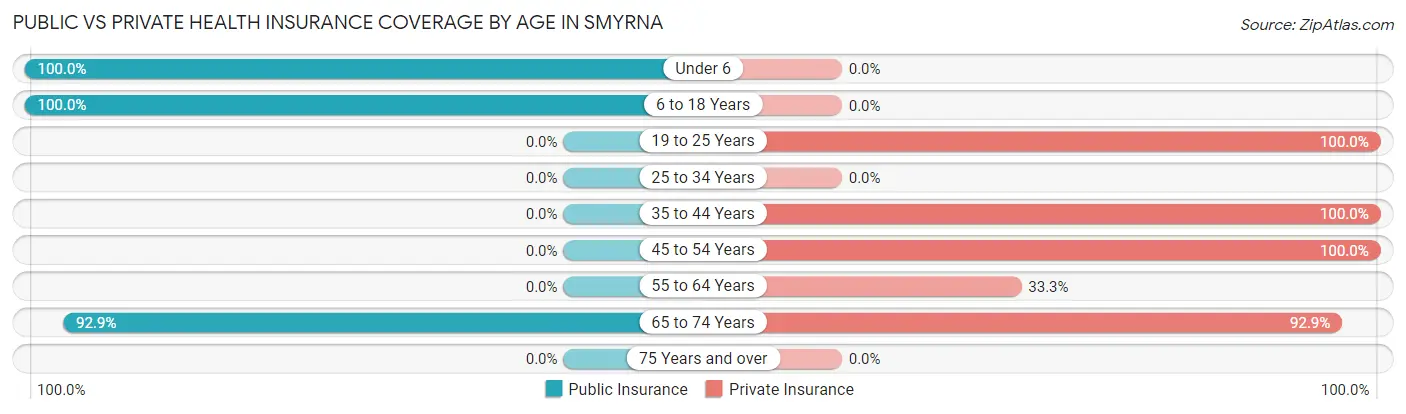
| Age Bracket | Public Insurance | Private Insurance |
| Under 6 | 2 (100.0%) | 0 (0.0%) |
| 6 to 18 Years | 2 (100.0%) | 0 (0.0%) |
| 19 to 25 Years | 0 (0.0%) | 2 (100.0%) |
| 25 to 34 Years | 0 (0.0%) | 0 (0.0%) |
| 35 to 44 Years | 0 (0.0%) | 1 (100.0%) |
| 45 to 54 Years | 0 (0.0%) | 2 (100.0%) |
| 55 to 64 Years | 0 (0.0%) | 1 (33.3%) |
| 65 to 74 Years | 13 (92.9%) | 13 (92.9%) |
| 75 Years and over | 0 (0.0%) | 0 (0.0%) |
| Total | 17 (60.7%) | 19 (67.9%) |
Disability Status by Sex by Age in Smyrna
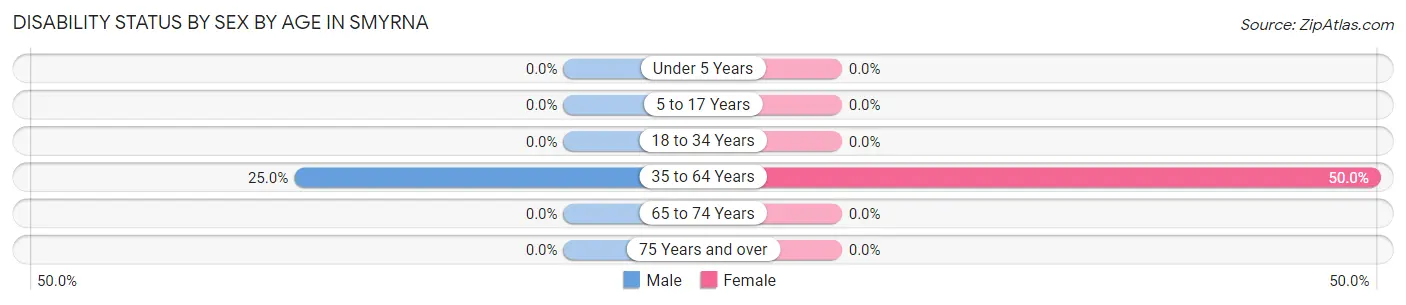
| Age Bracket | Male | Female |
| Under 5 Years | 0 (0.0%) | 0 (0.0%) |
| 5 to 17 Years | 0 (0.0%) | 0 (0.0%) |
| 18 to 34 Years | 0 (0.0%) | 0 (0.0%) |
| 35 to 64 Years | 1 (25.0%) | 1 (50.0%) |
| 65 to 74 Years | 0 (0.0%) | 0 (0.0%) |
| 75 Years and over | 0 (0.0%) | 0 (0.0%) |
Disability Class by Sex by Age in Smyrna
Disability Class: Hearing Difficulty
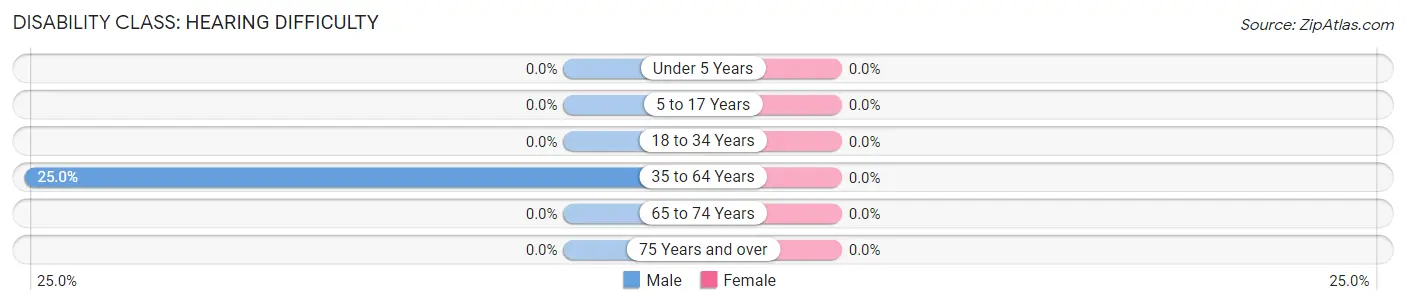
| Age Bracket | Male | Female |
| Under 5 Years | 0 (0.0%) | 0 (0.0%) |
| 5 to 17 Years | 0 (0.0%) | 0 (0.0%) |
| 18 to 34 Years | 0 (0.0%) | 0 (0.0%) |
| 35 to 64 Years | 1 (25.0%) | 0 (0.0%) |
| 65 to 74 Years | 0 (0.0%) | 0 (0.0%) |
| 75 Years and over | 0 (0.0%) | 0 (0.0%) |
Disability Class: Vision Difficulty
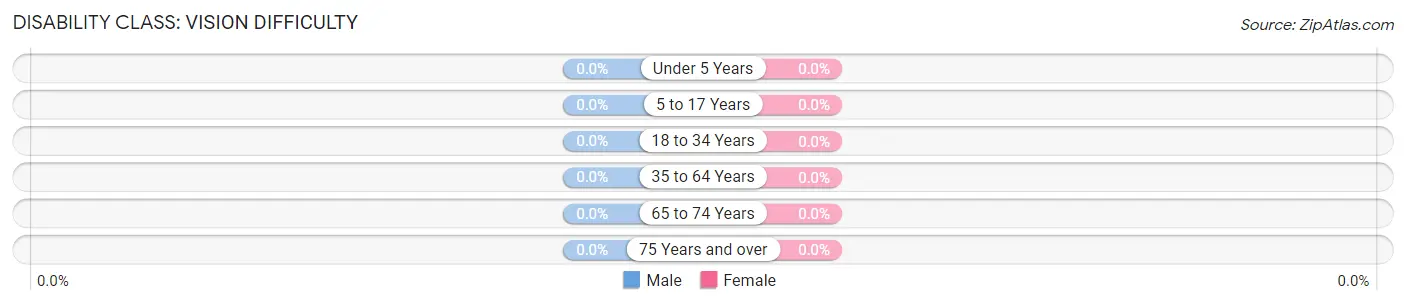
| Age Bracket | Male | Female |
| Under 5 Years | 0 (0.0%) | 0 (0.0%) |
| 5 to 17 Years | 0 (0.0%) | 0 (0.0%) |
| 18 to 34 Years | 0 (0.0%) | 0 (0.0%) |
| 35 to 64 Years | 0 (0.0%) | 0 (0.0%) |
| 65 to 74 Years | 0 (0.0%) | 0 (0.0%) |
| 75 Years and over | 0 (0.0%) | 0 (0.0%) |
Disability Class: Cognitive Difficulty

| Age Bracket | Male | Female |
| 5 to 17 Years | 0 (0.0%) | 0 (0.0%) |
| 18 to 34 Years | 0 (0.0%) | 0 (0.0%) |
| 35 to 64 Years | 0 (0.0%) | 0 (0.0%) |
| 65 to 74 Years | 0 (0.0%) | 0 (0.0%) |
| 75 Years and over | 0 (0.0%) | 0 (0.0%) |
Disability Class: Ambulatory Difficulty
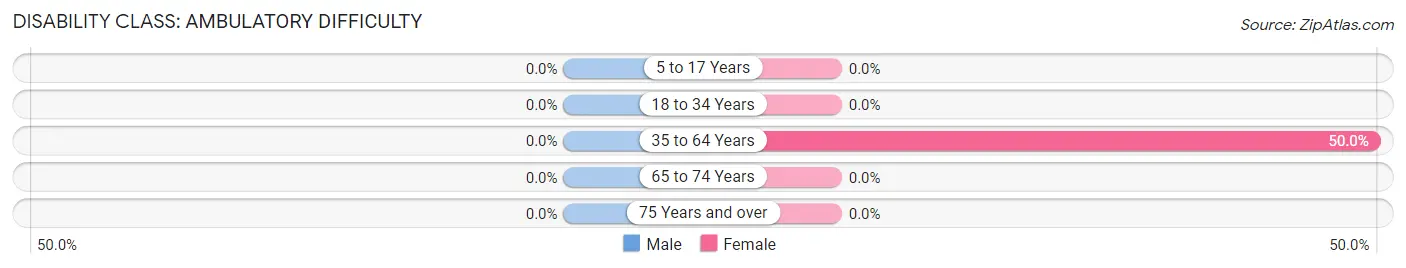
| Age Bracket | Male | Female |
| 5 to 17 Years | 0 (0.0%) | 0 (0.0%) |
| 18 to 34 Years | 0 (0.0%) | 0 (0.0%) |
| 35 to 64 Years | 0 (0.0%) | 1 (50.0%) |
| 65 to 74 Years | 0 (0.0%) | 0 (0.0%) |
| 75 Years and over | 0 (0.0%) | 0 (0.0%) |
Disability Class: Self-Care Difficulty
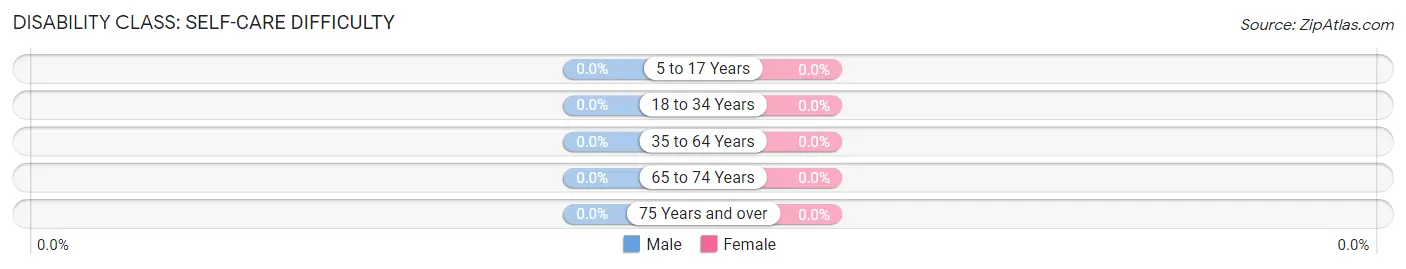
| Age Bracket | Male | Female |
| 5 to 17 Years | 0 (0.0%) | 0 (0.0%) |
| 18 to 34 Years | 0 (0.0%) | 0 (0.0%) |
| 35 to 64 Years | 0 (0.0%) | 0 (0.0%) |
| 65 to 74 Years | 0 (0.0%) | 0 (0.0%) |
| 75 Years and over | 0 (0.0%) | 0 (0.0%) |
Technology Access in Smyrna
Computing Device Access in Smyrna
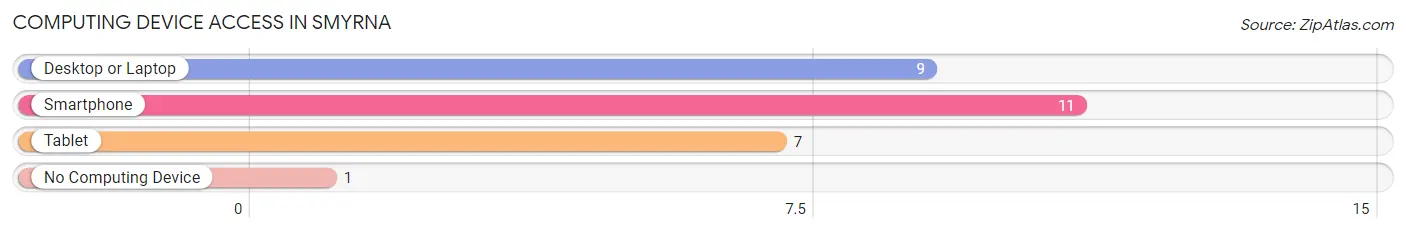
| Device Type | # Households | % Households |
| Desktop or Laptop | 9 | 75.0% |
| Smartphone | 11 | 91.7% |
| Tablet | 7 | 58.3% |
| No Computing Device | 1 | 8.3% |
| Total | 12 | 100.0% |
Internet Access in Smyrna
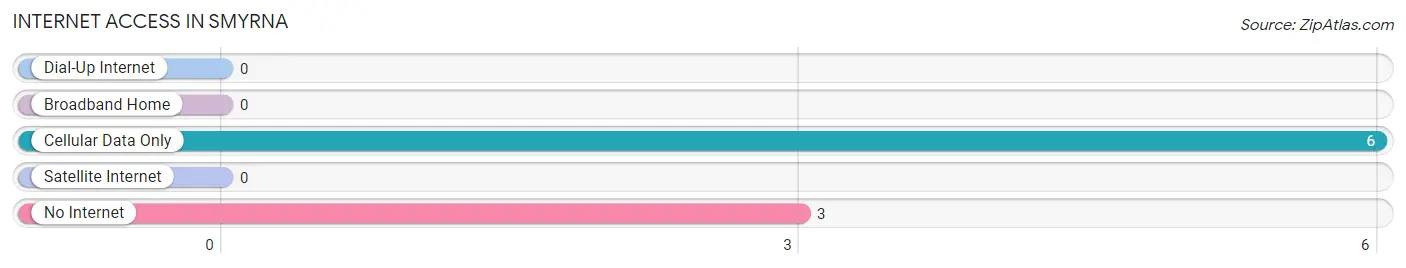
| Internet Type | # Households | % Households |
| Dial-Up Internet | 0 | 0.0% |
| Broadband Home | 0 | 0.0% |
| Cellular Data Only | 6 | 50.0% |
| Satellite Internet | 0 | 0.0% |
| No Internet | 3 | 25.0% |
| Total | 12 | 100.0% |
Smyrna Summary
Smyrna is a small town located in the northwestern corner of South Carolina, in the foothills of the Blue Ridge Mountains. It is situated in the Piedmont region of the state, and is part of Spartanburg County. The town has a population of just over 1,000 people, and is known for its rural charm and small-town atmosphere.
History
Smyrna was first settled in the late 1700s by a group of settlers from North Carolina. The town was originally known as “New Smyrna”, and was named after the ancient Greek city of Smyrna. The town was officially incorporated in 1837, and was named after the biblical city of Smyrna.
The town was an important stop on the Spartanburg and Union Railroad, which connected Spartanburg to Union, South Carolina. The railroad was completed in 1851, and was a major factor in the growth of the town. The railroad allowed for the transportation of goods and people, and helped to spur the development of the town.
In the late 1800s, Smyrna was a thriving agricultural community. The town was known for its production of cotton, corn, and other crops. The town also had several mills, which produced textiles and other goods.
Geography
Smyrna is located in the northwestern corner of South Carolina, in the foothills of the Blue Ridge Mountains. The town is situated in the Piedmont region of the state, and is part of Spartanburg County. The town is located at the intersection of US Highway 221 and SC Highway 11.
The town is situated on the banks of the Pacolet River, which flows through the town. The town is surrounded by rolling hills and forests, and is known for its rural charm and small-town atmosphere.
Economy
Smyrna’s economy is largely based on agriculture and tourism. The town is known for its production of cotton, corn, and other crops. The town also has several mills, which produce textiles and other goods.
The town is also a popular tourist destination, and is known for its rural charm and small-town atmosphere. The town is home to several historic sites, including the Smyrna Presbyterian Church, which was built in 1837. The town also has several parks and recreational areas, which attract visitors from all over the region.
Demographics
As of the 2010 census, the population of Smyrna was 1,072. The town has a population that is predominantly white (94.2%), with a small percentage of African Americans (3.3%) and Hispanics (1.2%). The median household income in the town is $37,500, and the median age is 43.
Smyrna is a small town with a rural charm and small-town atmosphere. The town is known for its agricultural production and its historic sites, and is a popular tourist destination. The town has a population that is predominantly white, and has a median household income of $37,500.
Common Questions
What is Per Capita Income in Smyrna?
Per Capita income in Smyrna is $144,261.
What is the Median Family Income in Smyrna?
Median Family Income in Smyrna is $250,001.
What is Income or Wage Gap in Smyrna?
Income or Wage Gap in Smyrna is 41.9%.
Women in Smyrna earn 58.1 cents for every dollar earned by a man.
What is Inequality or Gini Index in Smyrna?
Inequality or Gini Index in Smyrna is 0.45.
What is the Total Population of Smyrna?
Total Population of Smyrna is 28.
What is the Total Male Population of Smyrna?
Total Male Population of Smyrna is 14.
What is the Total Female Population of Smyrna?
Total Female Population of Smyrna is 14.
What is the Ratio of Males per 100 Females in Smyrna?
There are 100.00 Males per 100 Females in Smyrna.
What is the Ratio of Females per 100 Males in Smyrna?
There are 100.00 Females per 100 Males in Smyrna.
What is the Median Population Age in Smyrna?
Median Population Age in Smyrna is 63.5 Years.
What is the Average Family Size in Smyrna
Average Family Size in Smyrna is 2.6 People.
What is the Average Household Size in Smyrna
Average Household Size in Smyrna is 2.3 People.
How Large is the Labor Force in Smyrna?
There are 10 People in the Labor Forcein in Smyrna.
What is the Percentage of People in the Labor Force in Smyrna?
41.7% of People are in the Labor Force in Smyrna.