Ridge Spring, SC Map & Demographics
Ridge Spring Map
Ridge Spring Overview
$36,338
PER CAPITA INCOME
$73,333
AVG FAMILY INCOME
$37,969
AVG HOUSEHOLD INCOME
17.3%
WAGE / INCOME GAP [ % ]
82.7¢/ $1
WAGE / INCOME GAP [ $ ]
0.56
INEQUALITY / GINI INDEX
720
TOTAL POPULATION
301
MALE POPULATION
419
FEMALE POPULATION
71.84
MALES / 100 FEMALES
139.20
FEMALES / 100 MALES
44.3
MEDIAN AGE
3.3
AVG FAMILY SIZE
2.2
AVG HOUSEHOLD SIZE
342
LABOR FORCE [ PEOPLE ]
54.2%
PERCENT IN LABOR FORCE
1.5%
UNEMPLOYMENT RATE
Ridge Spring Zip Codes
Ridge Spring Area Codes
Income in Ridge Spring
Income Overview in Ridge Spring
Per Capita Income in Ridge Spring is $36,338, while median incomes of families and households are $73,333 and $37,969 respectively.
| Characteristic | Number | Measure |
| Per Capita Income | 720 | $36,338 |
| Median Family Income | 158 | $73,333 |
| Mean Family Income | 158 | $114,182 |
| Median Household Income | 327 | $37,969 |
| Mean Household Income | 327 | $71,843 |
| Income Deficit | 158 | $0 |
| Wage / Income Gap (%) | 720 | 17.32% |
| Wage / Income Gap ($) | 720 | 82.68¢ per $1 |
| Gini / Inequality Index | 720 | 0.56 |
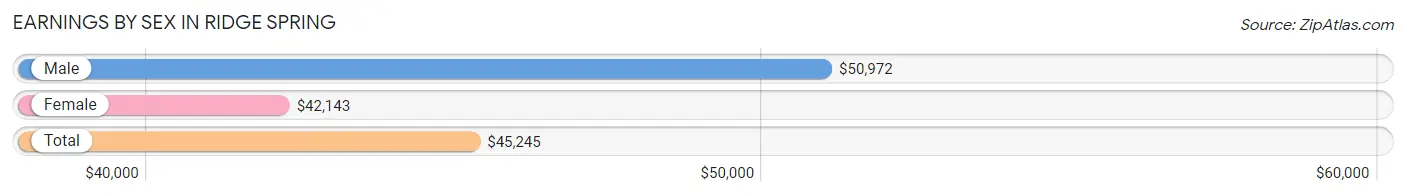
Earnings by Sex in Ridge Spring
Average Earnings in Ridge Spring are $45,245, $50,972 for men and $42,143 for women, a difference of 17.3%.
| Sex | Number | Average Earnings |
| Male | 201 (55.4%) | $50,972 |
| Female | 162 (44.6%) | $42,143 |
| Total | 363 (100.0%) | $45,245 |
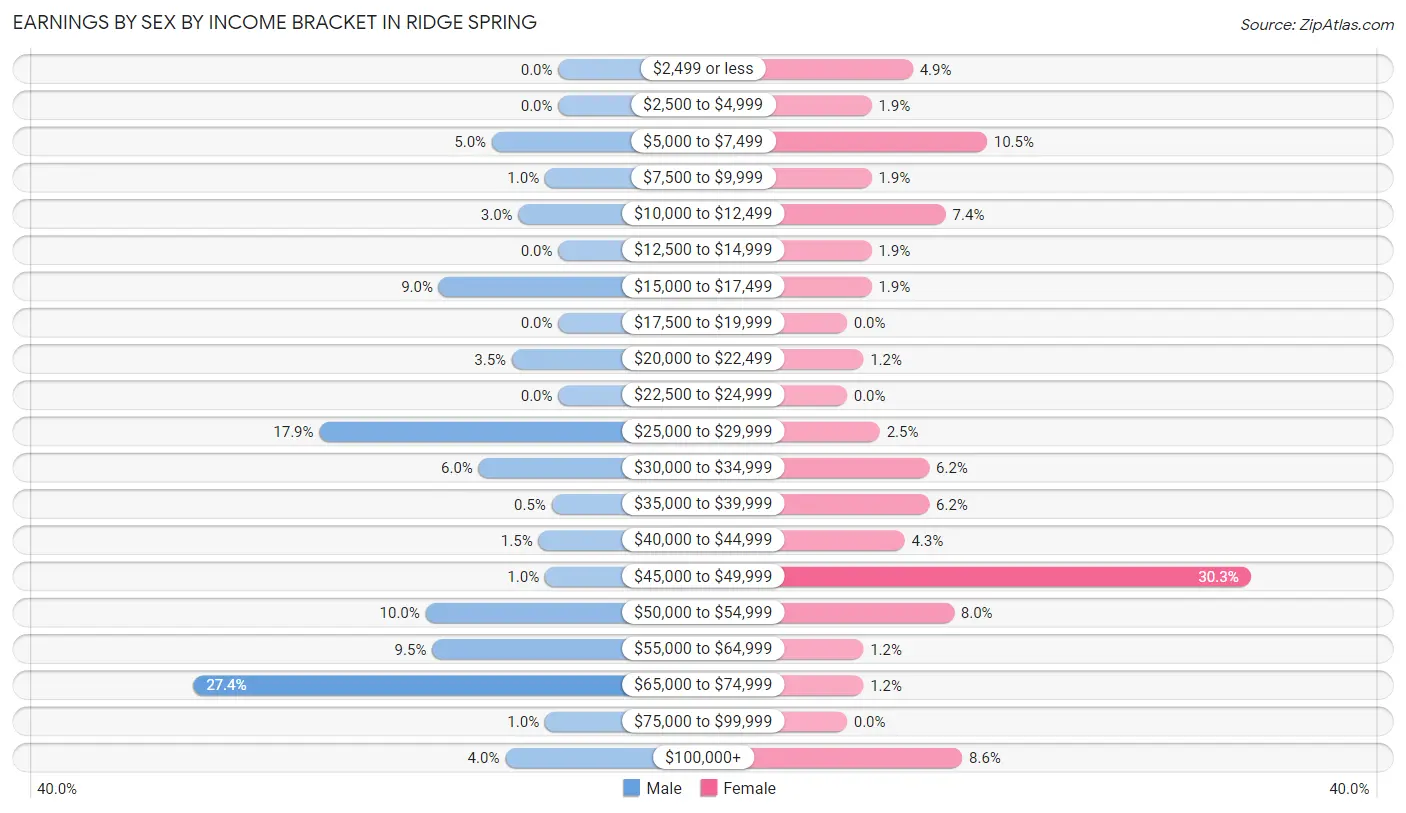
Earnings by Sex by Income Bracket in Ridge Spring
The most common earnings brackets in Ridge Spring are $65,000 to $74,999 for men (55 | 27.4%) and $45,000 to $49,999 for women (49 | 30.2%).
| Income | Male | Female |
| $2,499 or less | 0 (0.0%) | 8 (4.9%) |
| $2,500 to $4,999 | 0 (0.0%) | 3 (1.8%) |
| $5,000 to $7,499 | 10 (5.0%) | 17 (10.5%) |
| $7,500 to $9,999 | 2 (1.0%) | 3 (1.8%) |
| $10,000 to $12,499 | 6 (3.0%) | 12 (7.4%) |
| $12,500 to $14,999 | 0 (0.0%) | 3 (1.8%) |
| $15,000 to $17,499 | 18 (9.0%) | 3 (1.8%) |
| $17,500 to $19,999 | 0 (0.0%) | 0 (0.0%) |
| $20,000 to $22,499 | 7 (3.5%) | 2 (1.2%) |
| $22,500 to $24,999 | 0 (0.0%) | 0 (0.0%) |
| $25,000 to $29,999 | 36 (17.9%) | 4 (2.5%) |
| $30,000 to $34,999 | 12 (6.0%) | 10 (6.2%) |
| $35,000 to $39,999 | 1 (0.5%) | 10 (6.2%) |
| $40,000 to $44,999 | 3 (1.5%) | 7 (4.3%) |
| $45,000 to $49,999 | 2 (1.0%) | 49 (30.2%) |
| $50,000 to $54,999 | 20 (10.0%) | 13 (8.0%) |
| $55,000 to $64,999 | 19 (9.5%) | 2 (1.2%) |
| $65,000 to $74,999 | 55 (27.4%) | 2 (1.2%) |
| $75,000 to $99,999 | 2 (1.0%) | 0 (0.0%) |
| $100,000+ | 8 (4.0%) | 14 (8.6%) |
| Total | 201 (100.0%) | 162 (100.0%) |
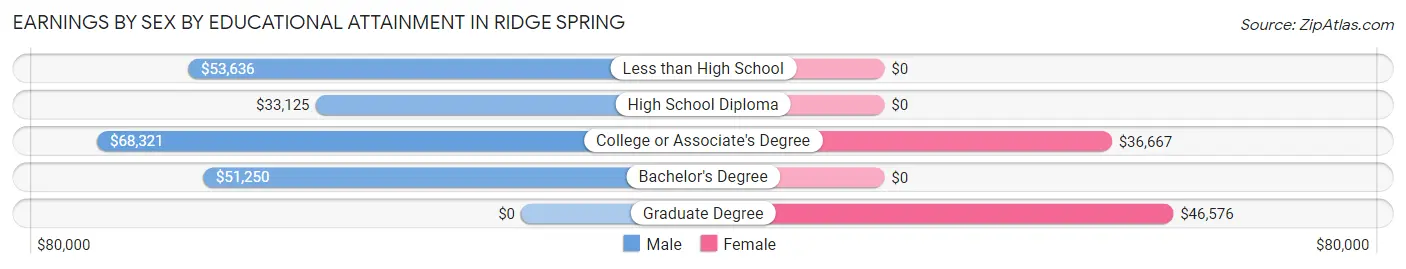
Earnings by Sex by Educational Attainment in Ridge Spring
Average earnings in Ridge Spring are $53,977 for men and $45,435 for women, a difference of 15.8%. Men with an educational attainment of college or associate's degree enjoy the highest average annual earnings of $68,321, while those with high school diploma education earn the least with $33,125. Women with an educational attainment of graduate degree earn the most with the average annual earnings of $46,576, while those with college or associate's degree education have the smallest earnings of $36,667.
| Educational Attainment | Male Income | Female Income |
| Less than High School | $53,636 | $0 |
| High School Diploma | $33,125 | $0 |
| College or Associate's Degree | $68,321 | $36,667 |
| Bachelor's Degree | $51,250 | $0 |
| Graduate Degree | - | - |
| Total | $53,977 | $45,435 |
Family Income in Ridge Spring
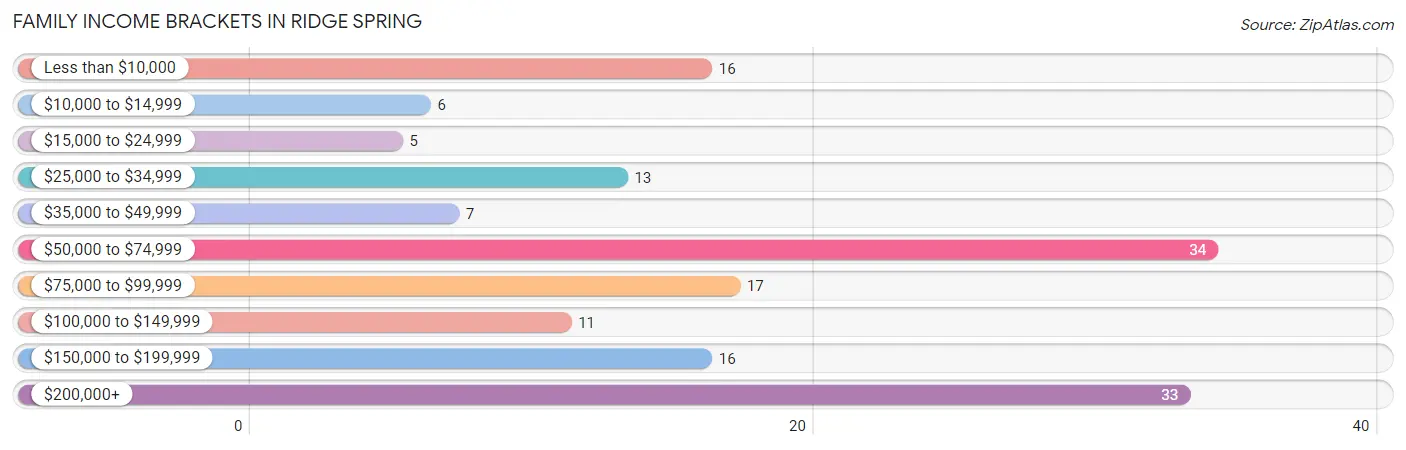
Family Income Brackets in Ridge Spring
According to the Ridge Spring family income data, there are 34 families falling into the $50,000 to $74,999 income range, which is the most common income bracket and makes up 21.5% of all families. Conversely, the $15,000 to $24,999 income bracket is the least frequent group with only 5 families (3.2%) belonging to this category.
| Income Bracket | # Families | % Families |
| Less than $10,000 | 16 | 10.1% |
| $10,000 to $14,999 | 6 | 3.8% |
| $15,000 to $24,999 | 5 | 3.2% |
| $25,000 to $34,999 | 13 | 8.2% |
| $35,000 to $49,999 | 7 | 4.4% |
| $50,000 to $74,999 | 34 | 21.5% |
| $75,000 to $99,999 | 17 | 10.8% |
| $100,000 to $149,999 | 11 | 7.0% |
| $150,000 to $199,999 | 16 | 10.1% |
| $200,000+ | 33 | 20.9% |
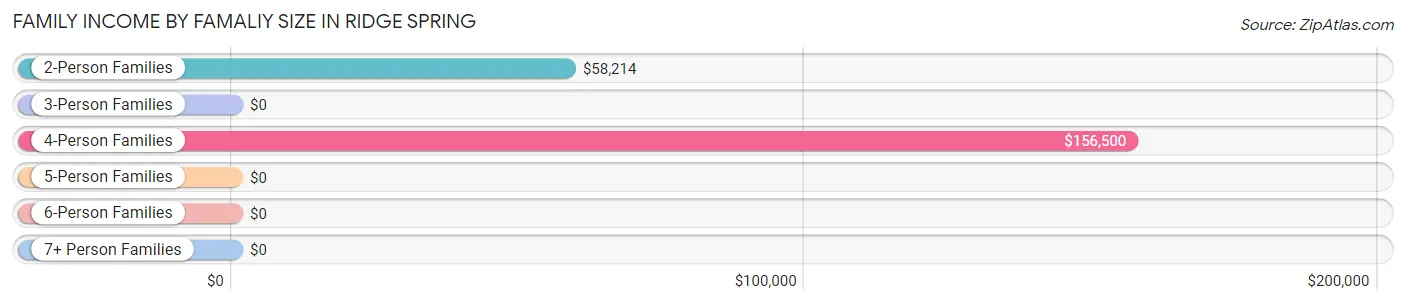
Family Income by Famaliy Size in Ridge Spring
4-person families (26 | 16.5%) account for the highest median family income in Ridge Spring with $156,500 per family, while 4-person families (26 | 16.5%) have the highest median income of $39,125 per family member.
| Income Bracket | # Families | Median Income |
| 2-Person Families | 80 (50.6%) | $58,214 |
| 3-Person Families | 45 (28.5%) | $0 |
| 4-Person Families | 26 (16.5%) | $156,500 |
| 5-Person Families | 5 (3.2%) | $0 |
| 6-Person Families | 2 (1.3%) | $0 |
| 7+ Person Families | 0 (0.0%) | $0 |
| Total | 158 (100.0%) | $73,333 |
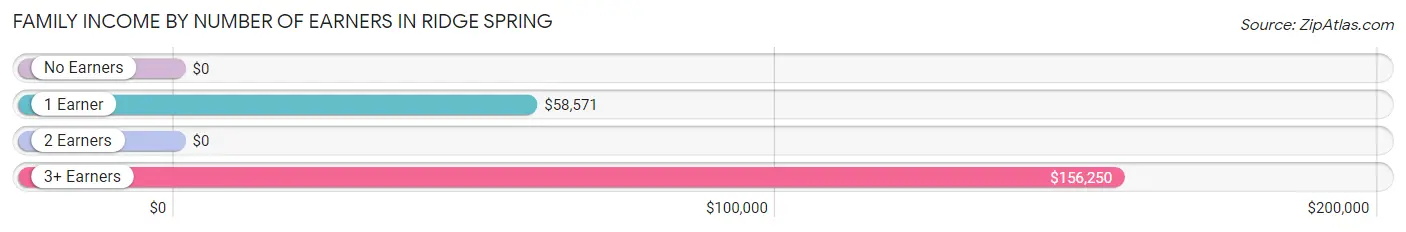
Family Income by Number of Earners in Ridge Spring
| Number of Earners | # Families | Median Income |
| No Earners | 41 (26.0%) | $0 |
| 1 Earner | 26 (16.5%) | $58,571 |
| 2 Earners | 71 (44.9%) | $0 |
| 3+ Earners | 20 (12.7%) | $156,250 |
| Total | 158 (100.0%) | $73,333 |
Household Income in Ridge Spring
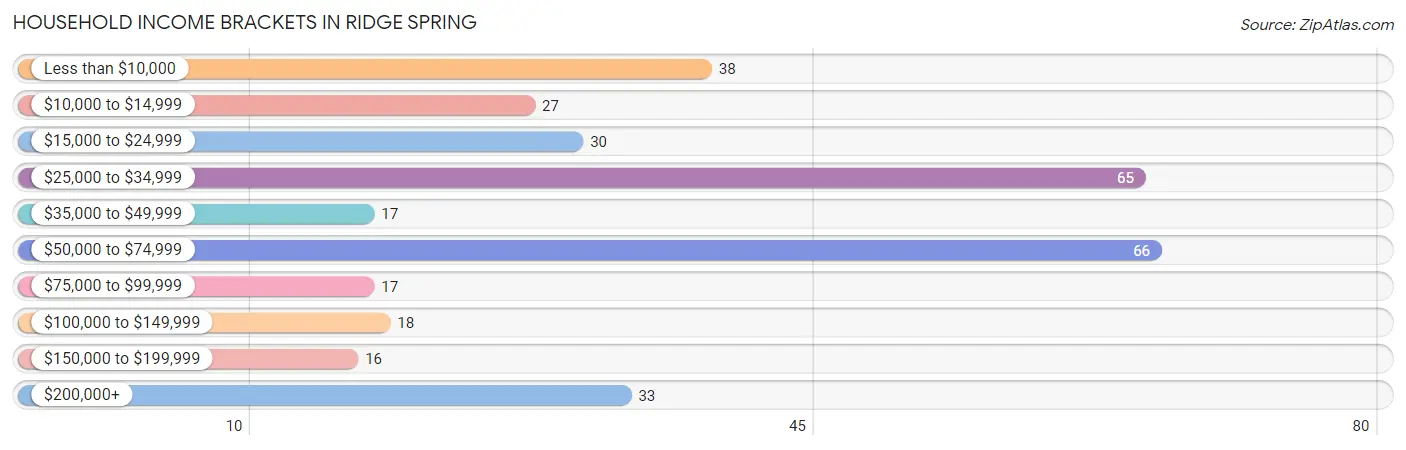
Household Income Brackets in Ridge Spring
With 66 households falling in the category, the $50,000 to $74,999 income range is the most frequent in Ridge Spring, accounting for 20.2% of all households. In contrast, only 16 households (4.9%) fall into the $150,000 to $199,999 income bracket, making it the least populous group.
| Income Bracket | # Households | % Households |
| Less than $10,000 | 38 | 11.6% |
| $10,000 to $14,999 | 27 | 8.3% |
| $15,000 to $24,999 | 30 | 9.2% |
| $25,000 to $34,999 | 65 | 19.9% |
| $35,000 to $49,999 | 17 | 5.2% |
| $50,000 to $74,999 | 66 | 20.2% |
| $75,000 to $99,999 | 17 | 5.2% |
| $100,000 to $149,999 | 18 | 5.5% |
| $150,000 to $199,999 | 16 | 4.9% |
| $200,000+ | 33 | 10.1% |
Household Income by Householder Age in Ridge Spring
The median household income in Ridge Spring is $37,969, with the highest median household income of $59,643 found in the 45 to 64 years age bracket for the primary householder. A total of 82 households (25.1%) fall into this category. Meanwhile, the 15 to 24 years age bracket for the primary householder has the lowest median household income of $0, with 5 households (1.5%) in this group.
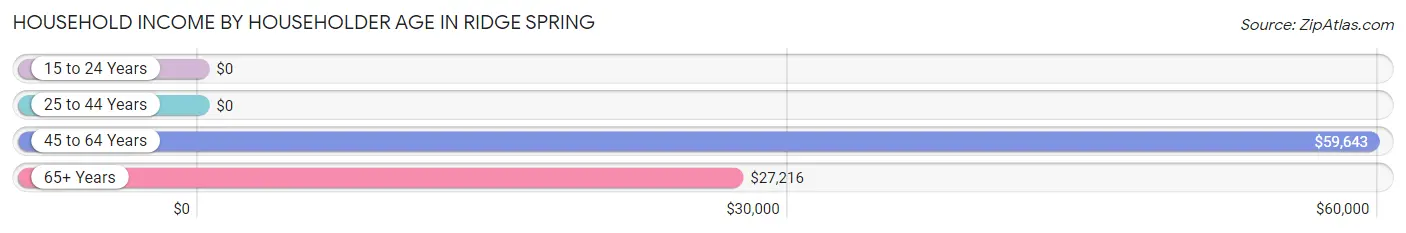
| Income Bracket | # Households | Median Income |
| 15 to 24 Years | 5 (1.5%) | $0 |
| 25 to 44 Years | 56 (17.1%) | $0 |
| 45 to 64 Years | 82 (25.1%) | $59,643 |
| 65+ Years | 184 (56.3%) | $27,216 |
| Total | 327 (100.0%) | $37,969 |
Poverty in Ridge Spring
Income Below Poverty by Sex and Age in Ridge Spring
With 10.3% poverty level for males and 22.5% for females among the residents of Ridge Spring, 15 year old males and under 5 year old females are the most vulnerable to poverty, with 2 males (100.0%) and 9 females (100.0%) in their respective age groups living below the poverty level.
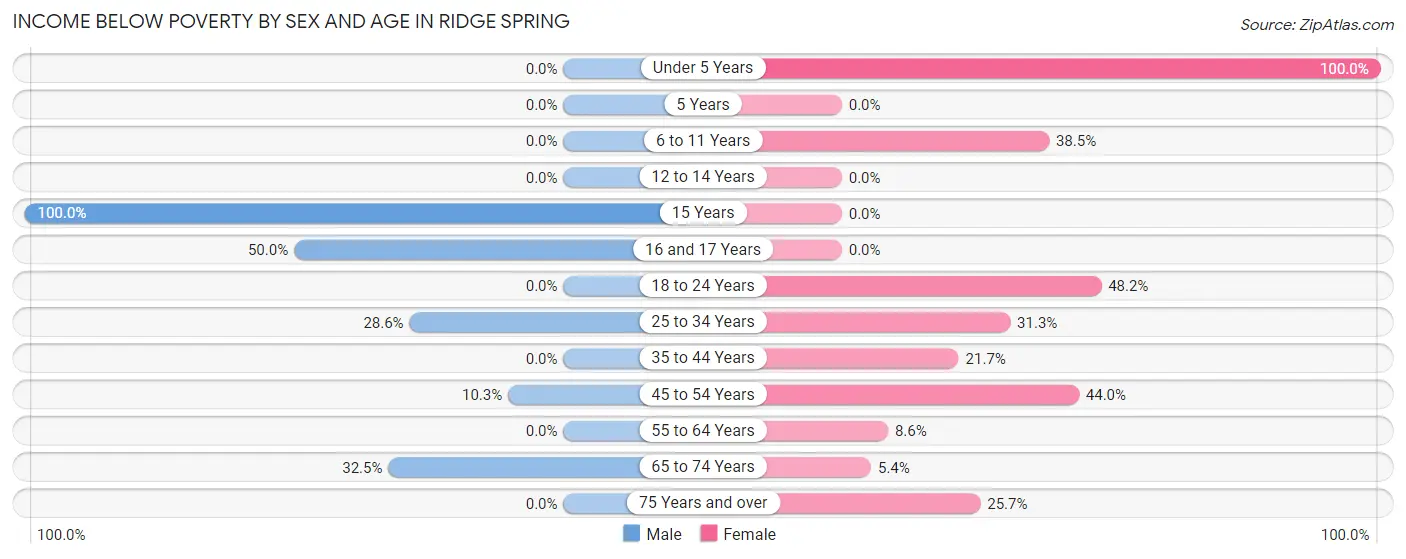
| Age Bracket | Male | Female |
| Under 5 Years | 0 (0.0%) | 9 (100.0%) |
| 5 Years | 0 (0.0%) | 0 (0.0%) |
| 6 to 11 Years | 0 (0.0%) | 5 (38.5%) |
| 12 to 14 Years | 0 (0.0%) | 0 (0.0%) |
| 15 Years | 2 (100.0%) | 0 (0.0%) |
| 16 and 17 Years | 6 (50.0%) | 0 (0.0%) |
| 18 to 24 Years | 0 (0.0%) | 13 (48.1%) |
| 25 to 34 Years | 6 (28.6%) | 10 (31.2%) |
| 35 to 44 Years | 0 (0.0%) | 18 (21.7%) |
| 45 to 54 Years | 4 (10.3%) | 11 (44.0%) |
| 55 to 64 Years | 0 (0.0%) | 3 (8.6%) |
| 65 to 74 Years | 13 (32.5%) | 5 (5.4%) |
| 75 Years and over | 0 (0.0%) | 18 (25.7%) |
| Total | 31 (10.3%) | 92 (22.5%) |
Income Above Poverty by Sex and Age in Ridge Spring
According to the poverty statistics in Ridge Spring, males aged under 5 years and females aged 5 years are the age groups that are most secure financially, with 100.0% of males and 100.0% of females in these age groups living above the poverty line.
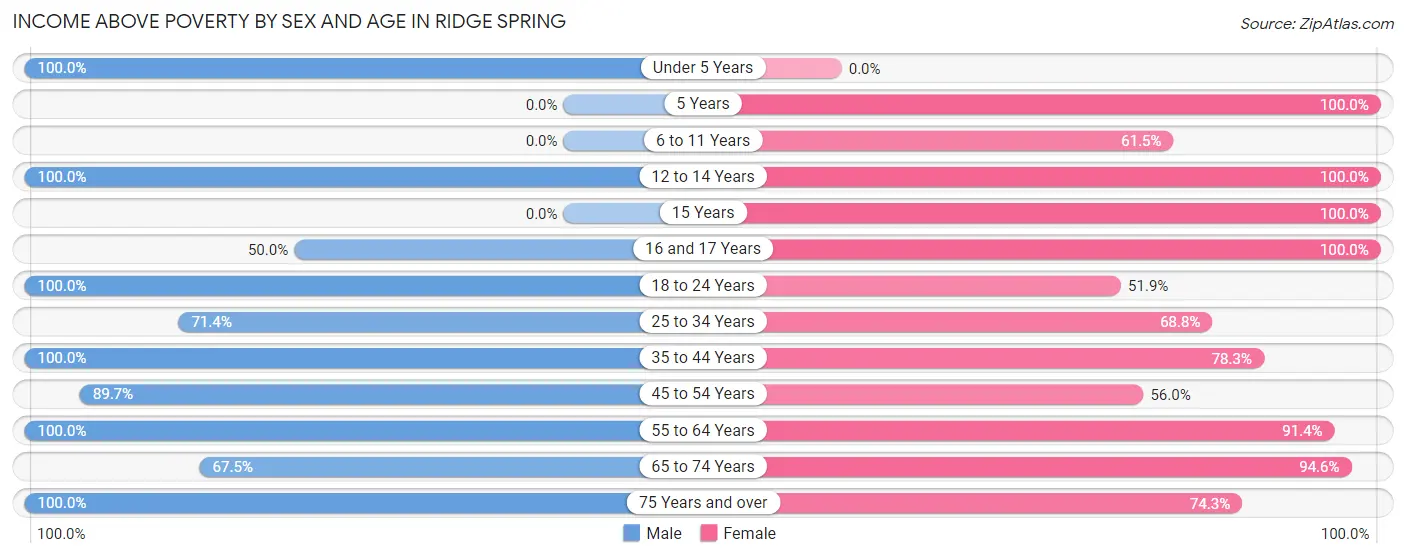
| Age Bracket | Male | Female |
| Under 5 Years | 8 (100.0%) | 0 (0.0%) |
| 5 Years | 0 (0.0%) | 2 (100.0%) |
| 6 to 11 Years | 0 (0.0%) | 8 (61.5%) |
| 12 to 14 Years | 26 (100.0%) | 16 (100.0%) |
| 15 Years | 0 (0.0%) | 3 (100.0%) |
| 16 and 17 Years | 6 (50.0%) | 2 (100.0%) |
| 18 to 24 Years | 28 (100.0%) | 14 (51.8%) |
| 25 to 34 Years | 15 (71.4%) | 22 (68.8%) |
| 35 to 44 Years | 74 (100.0%) | 65 (78.3%) |
| 45 to 54 Years | 35 (89.7%) | 14 (56.0%) |
| 55 to 64 Years | 38 (100.0%) | 32 (91.4%) |
| 65 to 74 Years | 27 (67.5%) | 87 (94.6%) |
| 75 Years and over | 13 (100.0%) | 52 (74.3%) |
| Total | 270 (89.7%) | 317 (77.5%) |
Income Below Poverty Among Married-Couple Families in Ridge Spring
The poverty statistics for married-couple families in Ridge Spring show that 2.9% or 2 of the total 70 families live below the poverty line. Families with 1 or 2 children have the highest poverty rate of 7.4%, comprising of 2 families. On the other hand, families with no children have the lowest poverty rate of 0.0%, which includes 0 families.
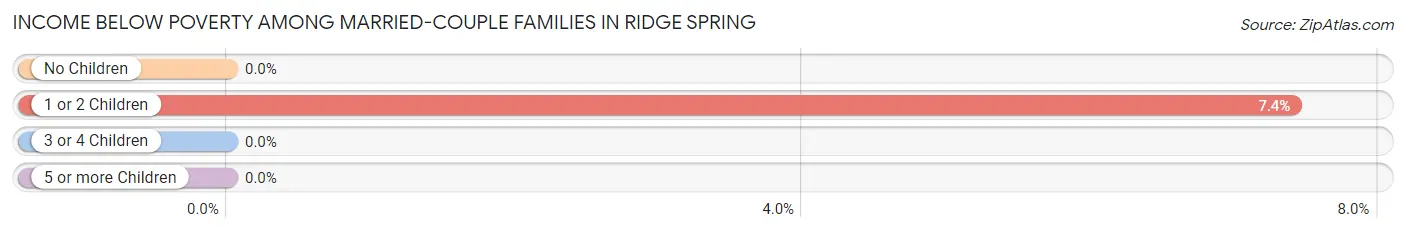
| Children | Above Poverty | Below Poverty |
| No Children | 41 (100.0%) | 0 (0.0%) |
| 1 or 2 Children | 25 (92.6%) | 2 (7.4%) |
| 3 or 4 Children | 2 (100.0%) | 0 (0.0%) |
| 5 or more Children | 0 (0.0%) | 0 (0.0%) |
| Total | 68 (97.1%) | 2 (2.9%) |
Income Below Poverty Among Single-Parent Households in Ridge Spring
According to the poverty data in Ridge Spring, 4.2% or 1 single-father households and 37.5% or 24 single-mother households are living below the poverty line. Among single-father households, those with 1 or 2 children have the highest poverty rate, with 1 households (7.1%) experiencing poverty. Likewise, among single-mother households, those with 1 or 2 children have the highest poverty rate, with 14 households (100.0%) falling below the poverty line.
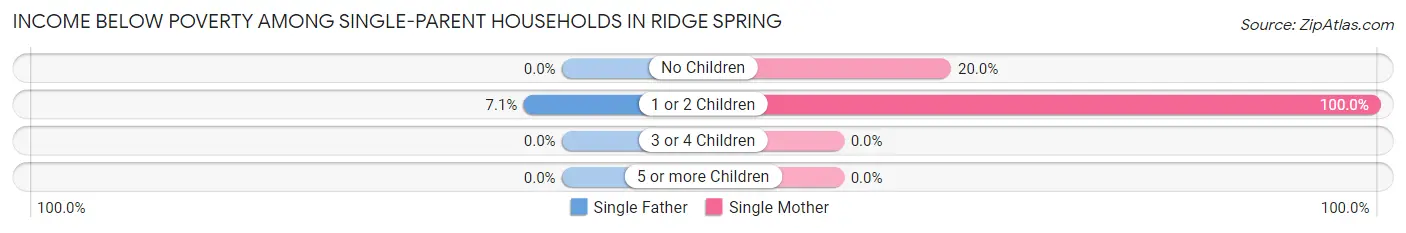
| Children | Single Father | Single Mother |
| No Children | 0 (0.0%) | 10 (20.0%) |
| 1 or 2 Children | 1 (7.1%) | 14 (100.0%) |
| 3 or 4 Children | 0 (0.0%) | 0 (0.0%) |
| 5 or more Children | 0 (0.0%) | 0 (0.0%) |
| Total | 1 (4.2%) | 24 (37.5%) |
Income Below Poverty Among Married-Couple vs Single-Parent Households in Ridge Spring
The poverty data for Ridge Spring shows that 2 of the married-couple family households (2.9%) and 25 of the single-parent households (28.4%) are living below the poverty level. Within the married-couple family households, those with 1 or 2 children have the highest poverty rate, with 2 households (7.4%) falling below the poverty line. Among the single-parent households, those with 1 or 2 children have the highest poverty rate, with 15 household (53.6%) living below poverty.
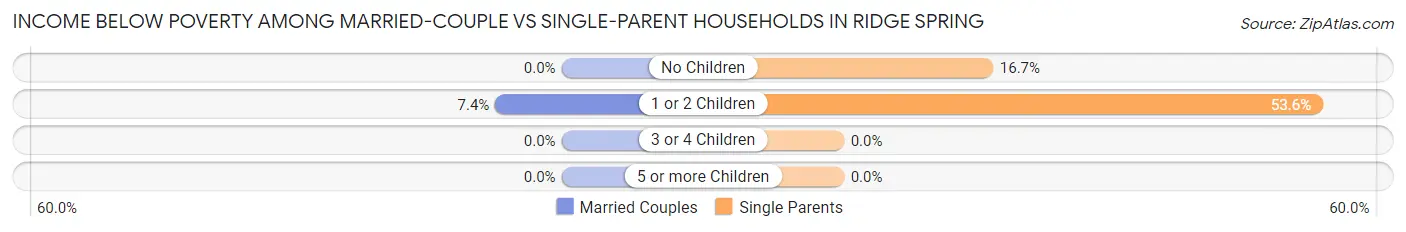
| Children | Married-Couple Families | Single-Parent Households |
| No Children | 0 (0.0%) | 10 (16.7%) |
| 1 or 2 Children | 2 (7.4%) | 15 (53.6%) |
| 3 or 4 Children | 0 (0.0%) | 0 (0.0%) |
| 5 or more Children | 0 (0.0%) | 0 (0.0%) |
| Total | 2 (2.9%) | 25 (28.4%) |
Race in Ridge Spring
The most populous races in Ridge Spring are Black / African American (447 | 62.1%), White / Caucasian (227 | 31.5%), and Hispanic or Latino (42 | 5.8%).
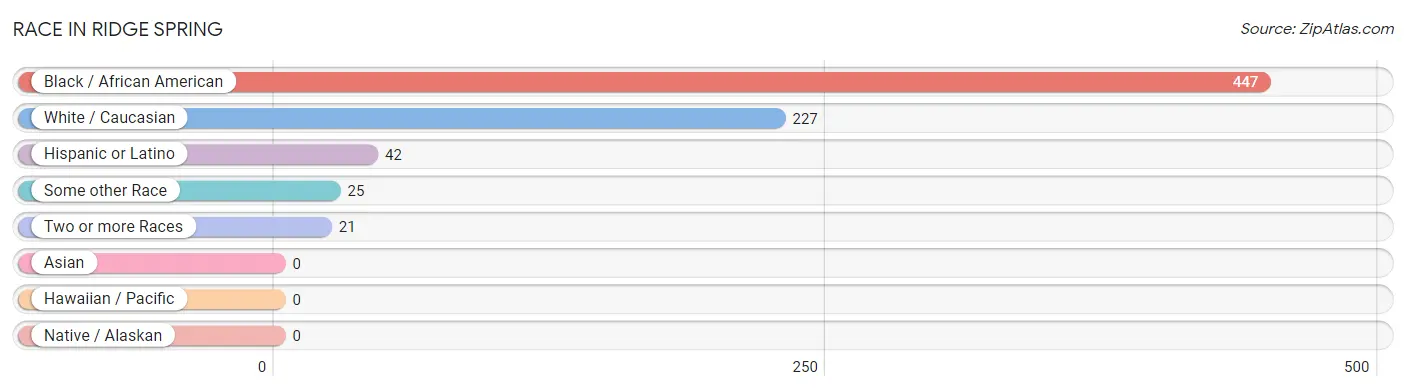
| Race | # Population | % Population |
| Asian | 0 | 0.0% |
| Black / African American | 447 | 62.1% |
| Hawaiian / Pacific | 0 | 0.0% |
| Hispanic or Latino | 42 | 5.8% |
| Native / Alaskan | 0 | 0.0% |
| White / Caucasian | 227 | 31.5% |
| Two or more Races | 21 | 2.9% |
| Some other Race | 25 | 3.5% |
| Total | 720 | 100.0% |
Ancestry in Ridge Spring
The most populous ancestries reported in Ridge Spring are American (77 | 10.7%), English (60 | 8.3%), Mexican (42 | 5.8%), German (37 | 5.1%), and Irish (27 | 3.7%), together accounting for 33.7% of all Ridge Spring residents.
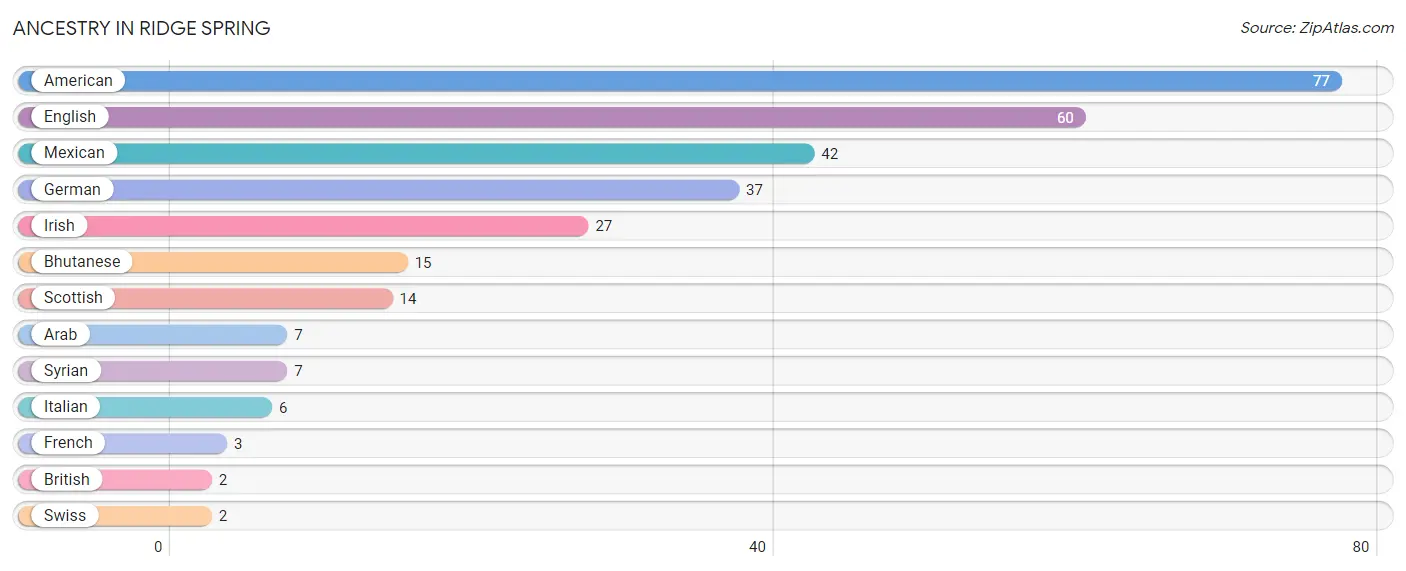
| Ancestry | # Population | % Population |
| American | 77 | 10.7% |
| Arab | 7 | 1.0% |
| Bhutanese | 15 | 2.1% |
| British | 2 | 0.3% |
| English | 60 | 8.3% |
| French | 3 | 0.4% |
| German | 37 | 5.1% |
| Irish | 27 | 3.7% |
| Italian | 6 | 0.8% |
| Mexican | 42 | 5.8% |
| Scottish | 14 | 1.9% |
| Swiss | 2 | 0.3% |
| Syrian | 7 | 1.0% | View All 13 Rows |
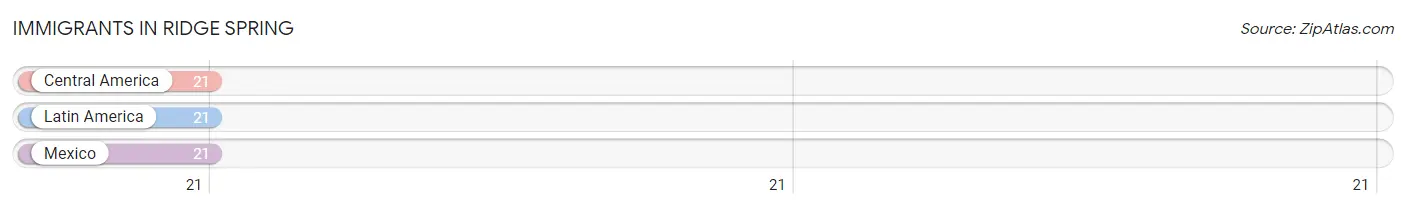
Immigrants in Ridge Spring
The most numerous immigrant groups reported in Ridge Spring came from Central America (21 | 2.9%), Latin America (21 | 2.9%), and Mexico (21 | 2.9%), together accounting for 8.8% of all Ridge Spring residents.
| Immigration Origin | # Population | % Population |
| Central America | 21 | 2.9% |
| Latin America | 21 | 2.9% |
| Mexico | 21 | 2.9% | View All 3 Rows |
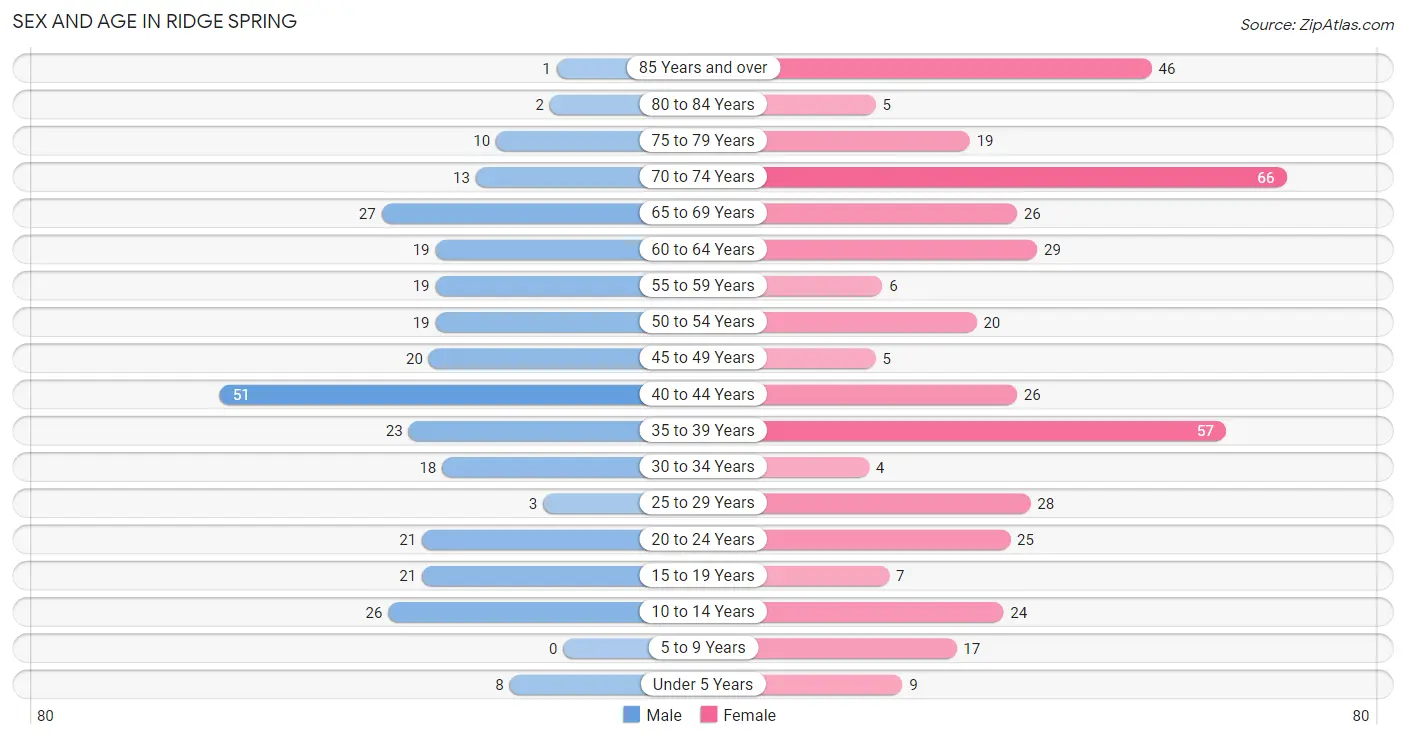
Sex and Age in Ridge Spring
Sex and Age in Ridge Spring
The most populous age groups in Ridge Spring are 40 to 44 Years (51 | 16.9%) for men and 70 to 74 Years (66 | 15.8%) for women.
| Age Bracket | Male | Female |
| Under 5 Years | 8 (2.7%) | 9 (2.1%) |
| 5 to 9 Years | 0 (0.0%) | 17 (4.1%) |
| 10 to 14 Years | 26 (8.6%) | 24 (5.7%) |
| 15 to 19 Years | 21 (7.0%) | 7 (1.7%) |
| 20 to 24 Years | 21 (7.0%) | 25 (6.0%) |
| 25 to 29 Years | 3 (1.0%) | 28 (6.7%) |
| 30 to 34 Years | 18 (6.0%) | 4 (0.9%) |
| 35 to 39 Years | 23 (7.6%) | 57 (13.6%) |
| 40 to 44 Years | 51 (16.9%) | 26 (6.2%) |
| 45 to 49 Years | 20 (6.6%) | 5 (1.2%) |
| 50 to 54 Years | 19 (6.3%) | 20 (4.8%) |
| 55 to 59 Years | 19 (6.3%) | 6 (1.4%) |
| 60 to 64 Years | 19 (6.3%) | 29 (6.9%) |
| 65 to 69 Years | 27 (9.0%) | 26 (6.2%) |
| 70 to 74 Years | 13 (4.3%) | 66 (15.8%) |
| 75 to 79 Years | 10 (3.3%) | 19 (4.5%) |
| 80 to 84 Years | 2 (0.7%) | 5 (1.2%) |
| 85 Years and over | 1 (0.3%) | 46 (11.0%) |
| Total | 301 (100.0%) | 419 (100.0%) |
Families and Households in Ridge Spring
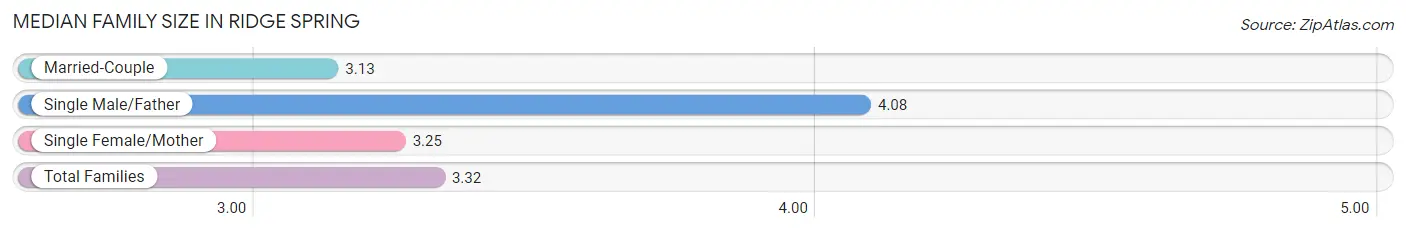
Median Family Size in Ridge Spring
The median family size in Ridge Spring is 3.32 persons per family, with single male/father families (24 | 15.2%) accounting for the largest median family size of 4.08 persons per family. On the other hand, married-couple families (70 | 44.3%) represent the smallest median family size with 3.13 persons per family.
| Family Type | # Families | Family Size |
| Married-Couple | 70 (44.3%) | 3.13 |
| Single Male/Father | 24 (15.2%) | 4.08 |
| Single Female/Mother | 64 (40.5%) | 3.25 |
| Total Families | 158 (100.0%) | 3.32 |
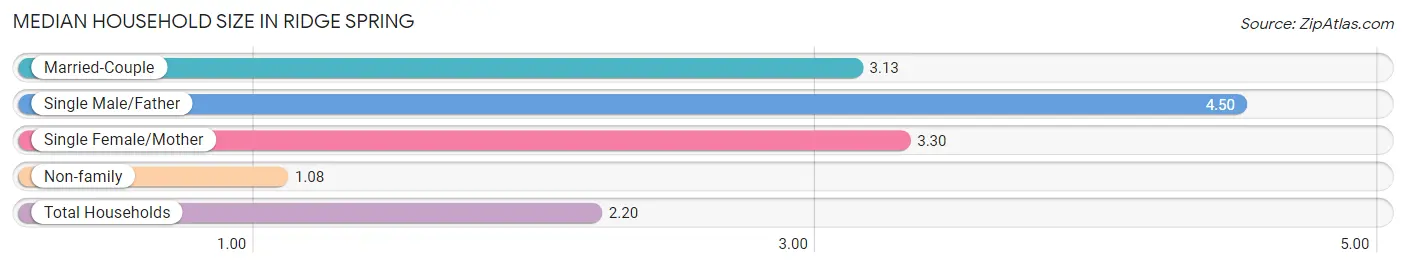
Median Household Size in Ridge Spring
The median household size in Ridge Spring is 2.20 persons per household, with single male/father households (24 | 7.3%) accounting for the largest median household size of 4.5 persons per household. non-family households (169 | 51.7%) represent the smallest median household size with 1.08 persons per household.
| Household Type | # Households | Household Size |
| Married-Couple | 70 (21.4%) | 3.13 |
| Single Male/Father | 24 (7.3%) | 4.50 |
| Single Female/Mother | 64 (19.6%) | 3.30 |
| Non-family | 169 (51.7%) | 1.08 |
| Total Households | 327 (100.0%) | 2.20 |
Household Size by Marriage Status in Ridge Spring
Out of a total of 327 households in Ridge Spring, 158 (48.3%) are family households, while 169 (51.7%) are nonfamily households. The most numerous type of family households are 2-person households, comprising 77, and the most common type of nonfamily households are 1-person households, comprising 161.
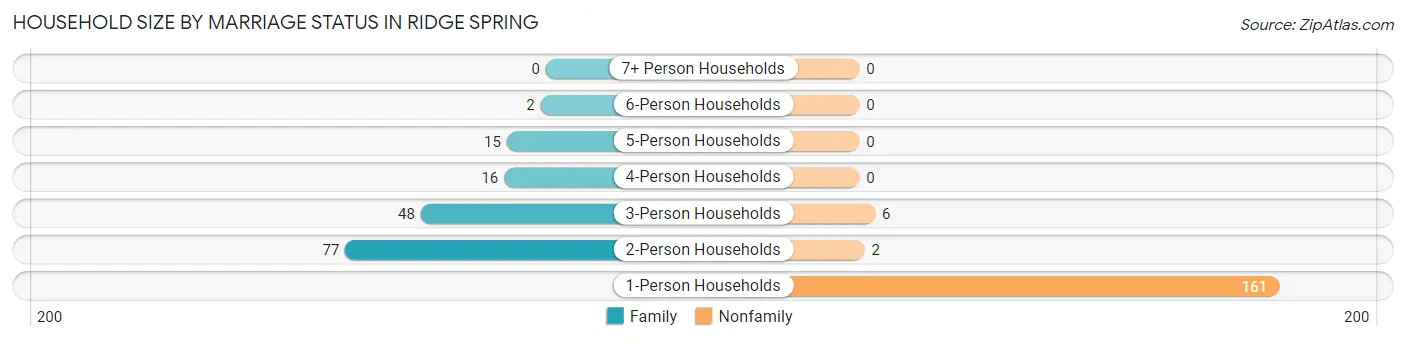
| Household Size | Family Households | Nonfamily Households |
| 1-Person Households | - | 161 (49.2%) |
| 2-Person Households | 77 (23.5%) | 2 (0.6%) |
| 3-Person Households | 48 (14.7%) | 6 (1.8%) |
| 4-Person Households | 16 (4.9%) | 0 (0.0%) |
| 5-Person Households | 15 (4.6%) | 0 (0.0%) |
| 6-Person Households | 2 (0.6%) | 0 (0.0%) |
| 7+ Person Households | 0 (0.0%) | 0 (0.0%) |
| Total | 158 (48.3%) | 169 (51.7%) |
Female Fertility in Ridge Spring
Fertility by Age in Ridge Spring
Average fertility rate in Ridge Spring is 44.0 births per 1,000 women. Women in the age bracket of 20 to 34 years have the highest fertility rate with 123.0 births per 1,000 women. Women in the age bracket of 20 to 34 years acount for 100.0% of all women with births.
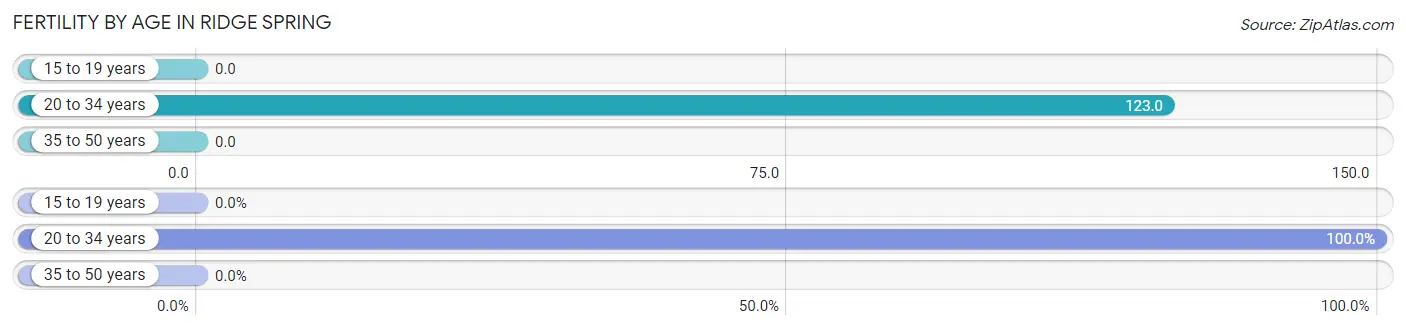
| Age Bracket | Women with Births | Births / 1,000 Women |
| 15 to 19 years | 0 (0.0%) | 0.0 |
| 20 to 34 years | 7 (100.0%) | 123.0 |
| 35 to 50 years | 0 (0.0%) | 0.0 |
| Total | 7 (100.0%) | 44.0 |
Fertility by Age by Marriage Status in Ridge Spring
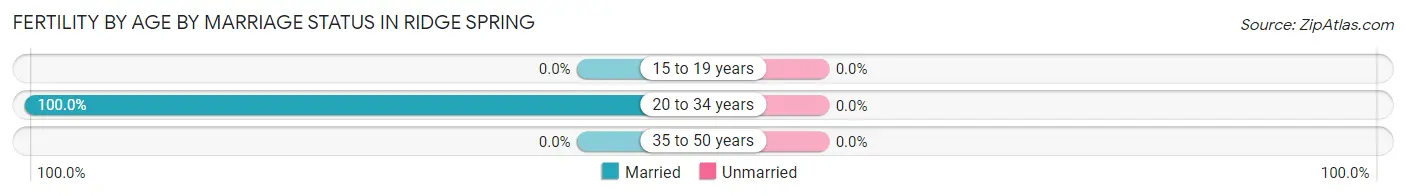
| Age Bracket | Married | Unmarried |
| 15 to 19 years | 0 (0.0%) | 0 (0.0%) |
| 20 to 34 years | 7 (100.0%) | 0 (0.0%) |
| 35 to 50 years | 0 (0.0%) | 0 (0.0%) |
| Total | 7 (100.0%) | 0 (0.0%) |
Fertility by Education in Ridge Spring
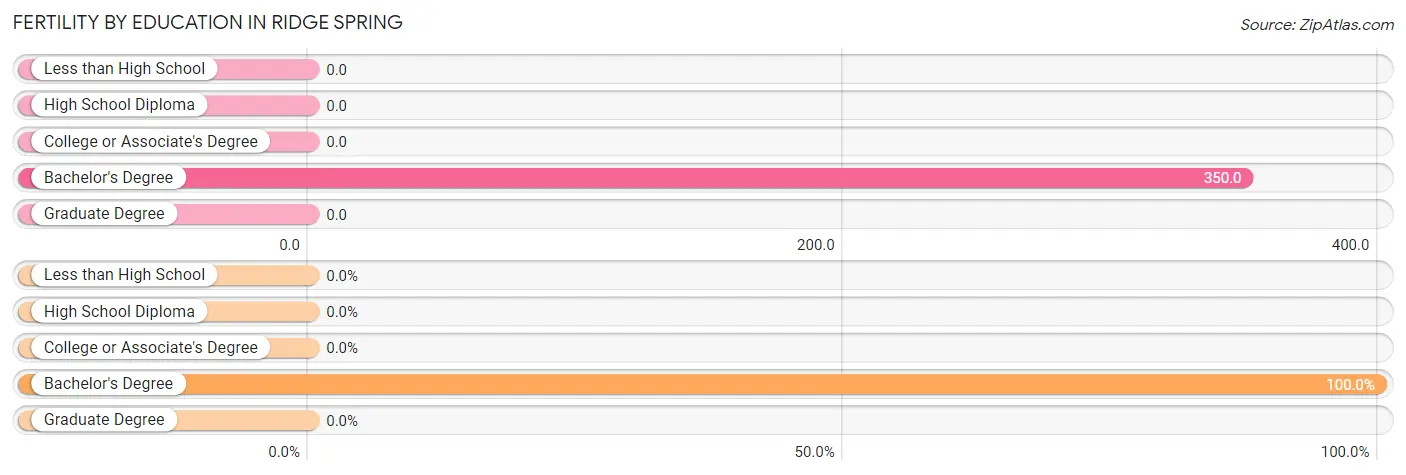
| Educational Attainment | Women with Births | Births / 1,000 Women |
| Less than High School | 0 (0.0%) | 0.0 |
| High School Diploma | 0 (0.0%) | 0.0 |
| College or Associate's Degree | 0 (0.0%) | 0.0 |
| Bachelor's Degree | 7 (100.0%) | 350.0 |
| Graduate Degree | 0 (0.0%) | 0.0 |
| Total | 7 (100.0%) | 44.0 |
Fertility by Education by Marriage Status in Ridge Spring
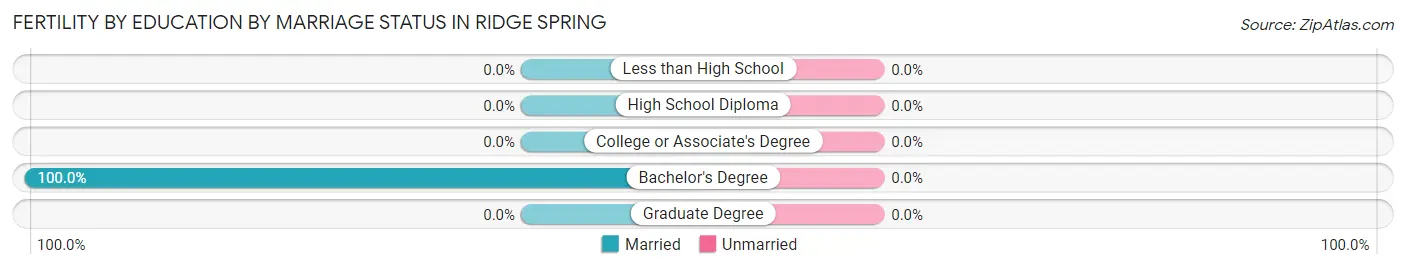
| Educational Attainment | Married | Unmarried |
| Less than High School | 0 (0.0%) | 0 (0.0%) |
| High School Diploma | 0 (0.0%) | 0 (0.0%) |
| College or Associate's Degree | 0 (0.0%) | 0 (0.0%) |
| Bachelor's Degree | 7 (100.0%) | 0 (0.0%) |
| Graduate Degree | 0 (0.0%) | 0 (0.0%) |
| Total | 7 (100.0%) | 0 (0.0%) |
Employment Characteristics in Ridge Spring
Employment by Class of Employer in Ridge Spring
Among the 329 employed individuals in Ridge Spring, private company employees (255 | 77.5%), self-employed (not incorporated) (23 | 7.0%), and self-employed (incorporated) (17 | 5.2%) make up the most common classes of employment.
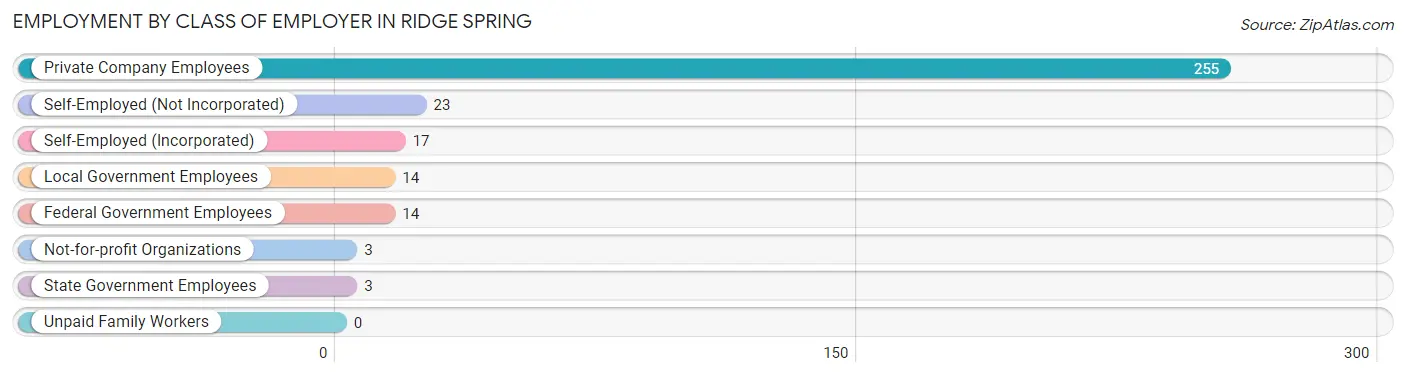
| Employer Class | # Employees | % Employees |
| Private Company Employees | 255 | 77.5% |
| Self-Employed (Incorporated) | 17 | 5.2% |
| Self-Employed (Not Incorporated) | 23 | 7.0% |
| Not-for-profit Organizations | 3 | 0.9% |
| Local Government Employees | 14 | 4.3% |
| State Government Employees | 3 | 0.9% |
| Federal Government Employees | 14 | 4.3% |
| Unpaid Family Workers | 0 | 0.0% |
| Total | 329 | 100.0% |
Employment Status by Age in Ridge Spring
According to the labor force statistics for Ridge Spring, out of the total population over 16 years of age (631), 54.2% or 342 individuals are in the labor force, with 1.5% or 5 of them unemployed. The age group with the highest labor force participation rate is 30 to 34 years, with 100.0% or 22 individuals in the labor force. Within the labor force, the 20 to 24 years age range has the highest percentage of unemployed individuals, with 16.1% or 5 of them being unemployed.
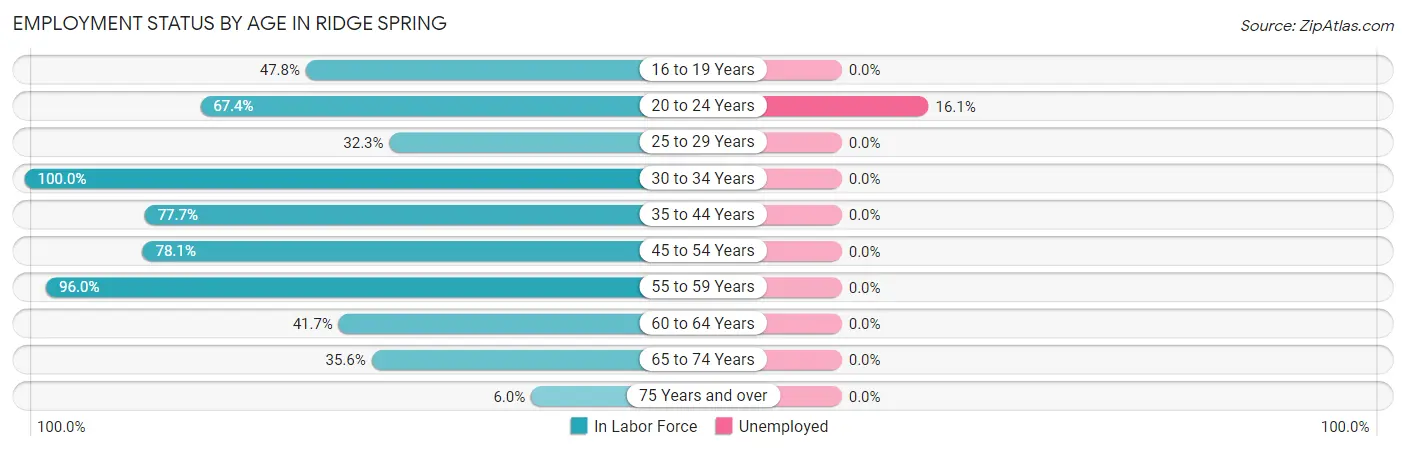
| Age Bracket | In Labor Force | Unemployed |
| 16 to 19 Years | 11 (47.8%) | 0 (0.0%) |
| 20 to 24 Years | 31 (67.4%) | 5 (16.1%) |
| 25 to 29 Years | 10 (32.3%) | 0 (0.0%) |
| 30 to 34 Years | 22 (100.0%) | 0 (0.0%) |
| 35 to 44 Years | 122 (77.7%) | 0 (0.0%) |
| 45 to 54 Years | 50 (78.1%) | 0 (0.0%) |
| 55 to 59 Years | 24 (96.0%) | 0 (0.0%) |
| 60 to 64 Years | 20 (41.7%) | 0 (0.0%) |
| 65 to 74 Years | 47 (35.6%) | 0 (0.0%) |
| 75 Years and over | 5 (6.0%) | 0 (0.0%) |
| Total | 342 (54.2%) | 5 (1.5%) |
Employment Status by Educational Attainment in Ridge Spring
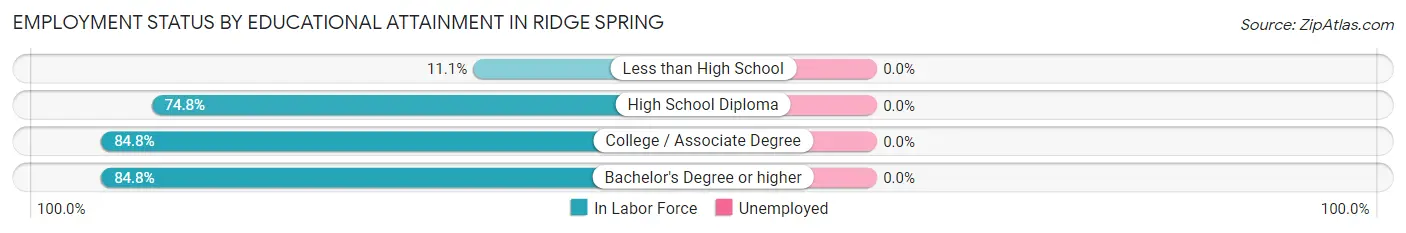
| Educational Attainment | In Labor Force | Unemployed |
| Less than High School | 5 (11.1%) | 0 (0.0%) |
| High School Diploma | 98 (74.8%) | 0 (0.0%) |
| College / Associate Degree | 56 (84.8%) | 0 (0.0%) |
| Bachelor's Degree or higher | 89 (84.8%) | 0 (0.0%) |
| Total | 248 (71.5%) | 0 (0.0%) |
Employment Occupations by Sex in Ridge Spring
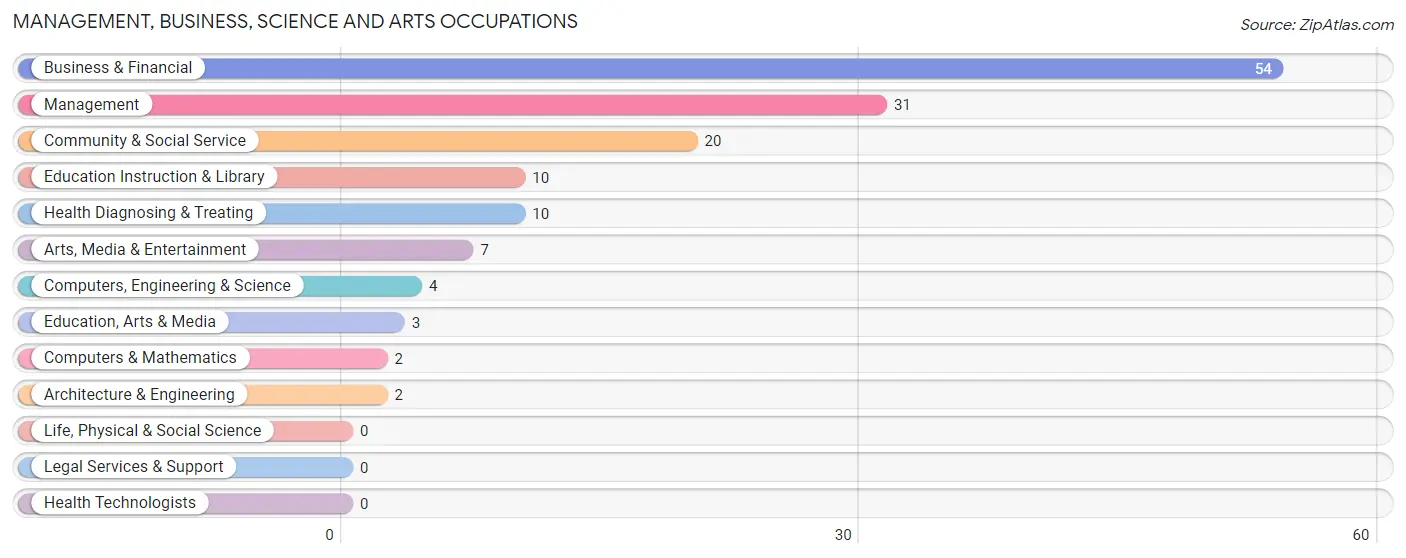
Management, Business, Science and Arts Occupations
The most common Management, Business, Science and Arts occupations in Ridge Spring are Business & Financial (54 | 16.4%), Management (31 | 9.4%), Community & Social Service (20 | 6.1%), Education Instruction & Library (10 | 3.0%), and Health Diagnosing & Treating (10 | 3.0%).
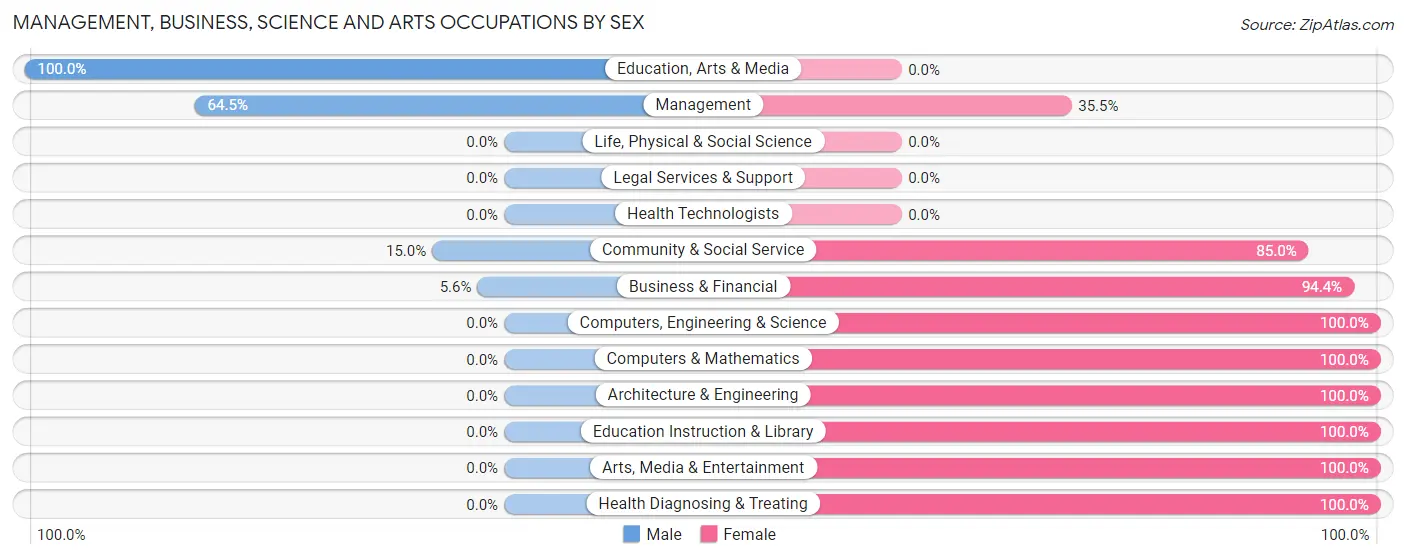
Management, Business, Science and Arts Occupations by Sex
Within the Management, Business, Science and Arts occupations in Ridge Spring, the most male-oriented occupations are Education, Arts & Media (100.0%), Management (64.5%), and Community & Social Service (15.0%), while the most female-oriented occupations are Computers, Engineering & Science (100.0%), Computers & Mathematics (100.0%), and Architecture & Engineering (100.0%).
| Occupation | Male | Female |
| Management | 20 (64.5%) | 11 (35.5%) |
| Business & Financial | 3 (5.6%) | 51 (94.4%) |
| Computers, Engineering & Science | 0 (0.0%) | 4 (100.0%) |
| Computers & Mathematics | 0 (0.0%) | 2 (100.0%) |
| Architecture & Engineering | 0 (0.0%) | 2 (100.0%) |
| Life, Physical & Social Science | 0 (0.0%) | 0 (0.0%) |
| Community & Social Service | 3 (15.0%) | 17 (85.0%) |
| Education, Arts & Media | 3 (100.0%) | 0 (0.0%) |
| Legal Services & Support | 0 (0.0%) | 0 (0.0%) |
| Education Instruction & Library | 0 (0.0%) | 10 (100.0%) |
| Arts, Media & Entertainment | 0 (0.0%) | 7 (100.0%) |
| Health Diagnosing & Treating | 0 (0.0%) | 10 (100.0%) |
| Health Technologists | 0 (0.0%) | 0 (0.0%) |
| Total (Category) | 26 (21.8%) | 93 (78.1%) |
| Total (Overall) | 191 (57.9%) | 139 (42.1%) |
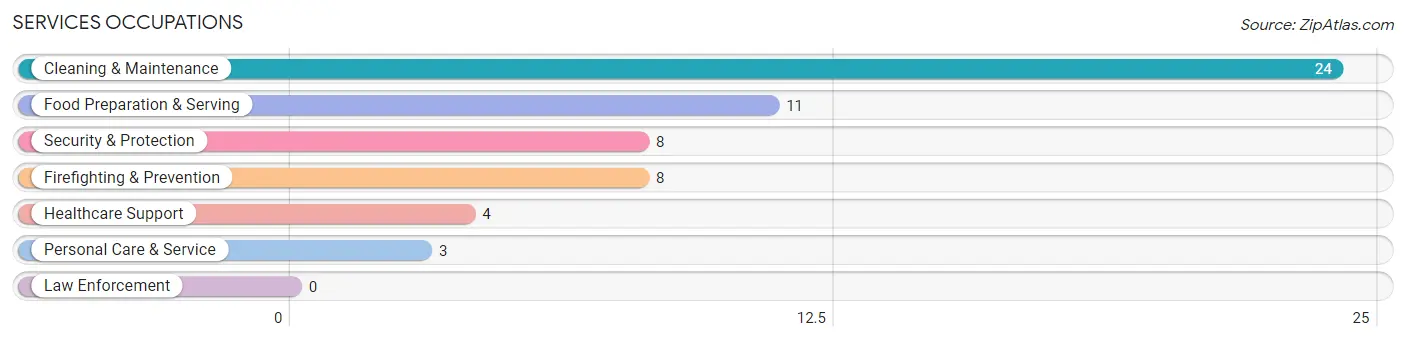
Services Occupations
The most common Services occupations in Ridge Spring are Cleaning & Maintenance (24 | 7.3%), Food Preparation & Serving (11 | 3.3%), Security & Protection (8 | 2.4%), Firefighting & Prevention (8 | 2.4%), and Healthcare Support (4 | 1.2%).
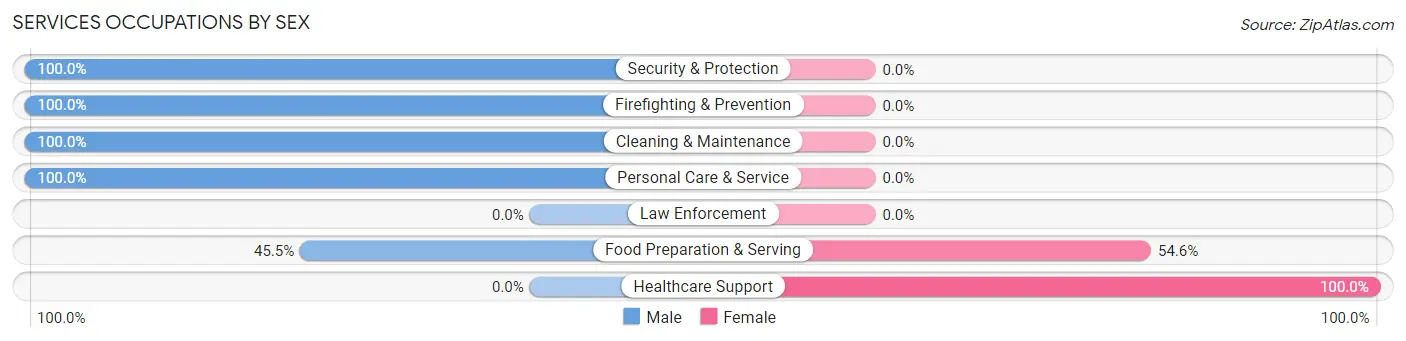
Services Occupations by Sex
Within the Services occupations in Ridge Spring, the most male-oriented occupations are Security & Protection (100.0%), Firefighting & Prevention (100.0%), and Cleaning & Maintenance (100.0%), while the most female-oriented occupations are Healthcare Support (100.0%), and Food Preparation & Serving (54.5%).
| Occupation | Male | Female |
| Healthcare Support | 0 (0.0%) | 4 (100.0%) |
| Security & Protection | 8 (100.0%) | 0 (0.0%) |
| Firefighting & Prevention | 8 (100.0%) | 0 (0.0%) |
| Law Enforcement | 0 (0.0%) | 0 (0.0%) |
| Food Preparation & Serving | 5 (45.5%) | 6 (54.5%) |
| Cleaning & Maintenance | 24 (100.0%) | 0 (0.0%) |
| Personal Care & Service | 3 (100.0%) | 0 (0.0%) |
| Total (Category) | 40 (80.0%) | 10 (20.0%) |
| Total (Overall) | 191 (57.9%) | 139 (42.1%) |
Sales and Office Occupations
The most common Sales and Office occupations in Ridge Spring are Office & Administration (22 | 6.7%), and Sales & Related (17 | 5.1%).
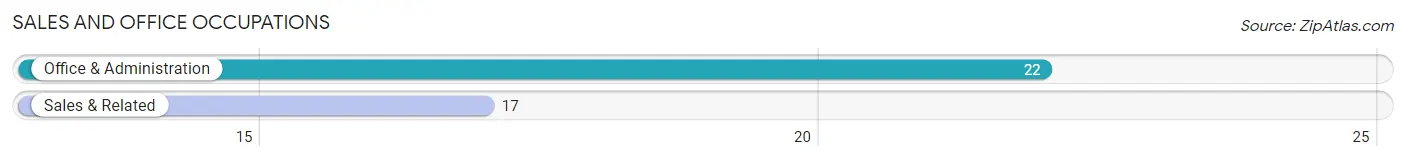
Sales and Office Occupations by Sex
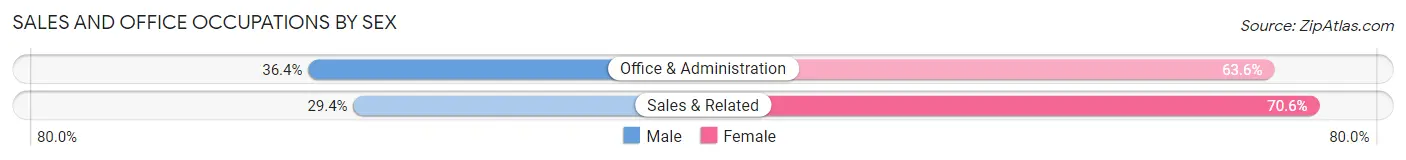
| Occupation | Male | Female |
| Sales & Related | 5 (29.4%) | 12 (70.6%) |
| Office & Administration | 8 (36.4%) | 14 (63.6%) |
| Total (Category) | 13 (33.3%) | 26 (66.7%) |
| Total (Overall) | 191 (57.9%) | 139 (42.1%) |
Natural Resources, Construction and Maintenance Occupations
The most common Natural Resources, Construction and Maintenance occupations in Ridge Spring are Installation, Maintenance & Repair (46 | 13.9%), Construction & Extraction (15 | 4.5%), and Farming, Fishing & Forestry (1 | 0.3%).
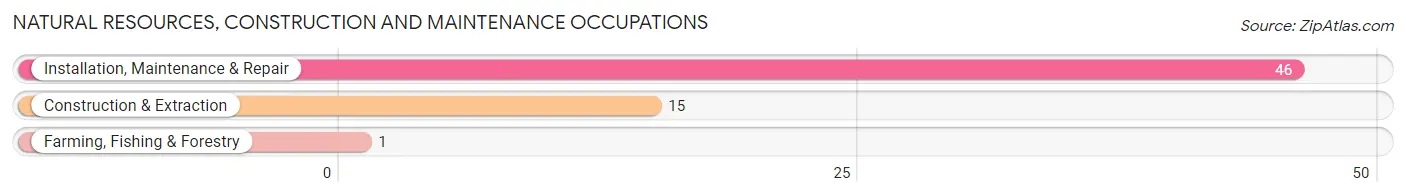
Natural Resources, Construction and Maintenance Occupations by Sex
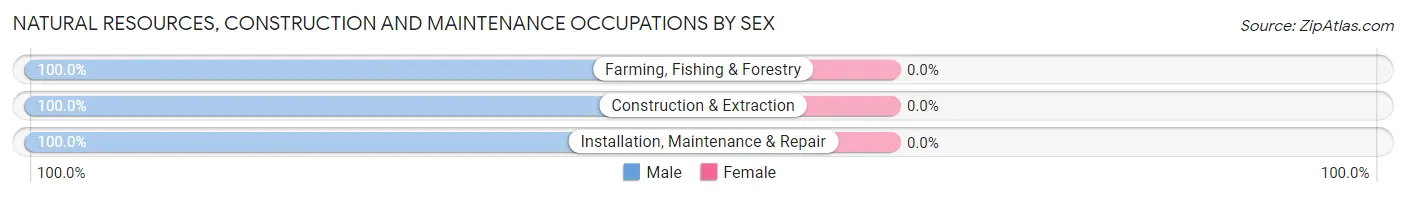
| Occupation | Male | Female |
| Farming, Fishing & Forestry | 1 (100.0%) | 0 (0.0%) |
| Construction & Extraction | 15 (100.0%) | 0 (0.0%) |
| Installation, Maintenance & Repair | 46 (100.0%) | 0 (0.0%) |
| Total (Category) | 62 (100.0%) | 0 (0.0%) |
| Total (Overall) | 191 (57.9%) | 139 (42.1%) |
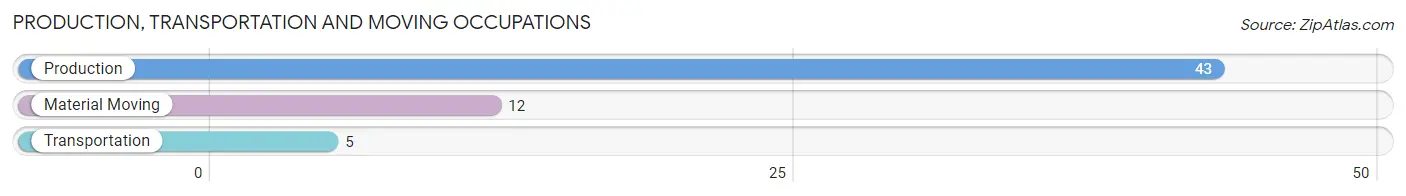
Production, Transportation and Moving Occupations
The most common Production, Transportation and Moving occupations in Ridge Spring are Production (43 | 13.0%), Material Moving (12 | 3.6%), and Transportation (5 | 1.5%).
Production, Transportation and Moving Occupations by Sex
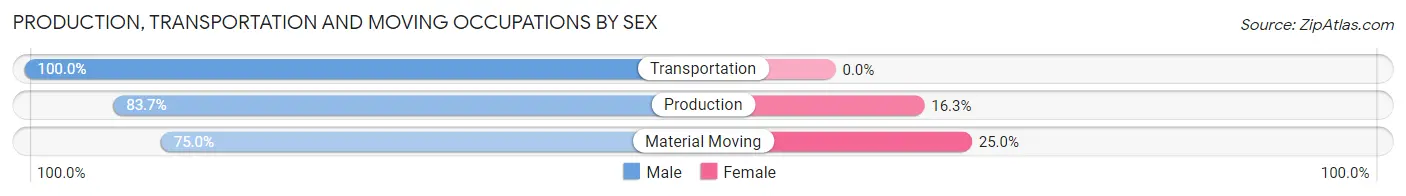
| Occupation | Male | Female |
| Production | 36 (83.7%) | 7 (16.3%) |
| Transportation | 5 (100.0%) | 0 (0.0%) |
| Material Moving | 9 (75.0%) | 3 (25.0%) |
| Total (Category) | 50 (83.3%) | 10 (16.7%) |
| Total (Overall) | 191 (57.9%) | 139 (42.1%) |
Employment Industries by Sex in Ridge Spring
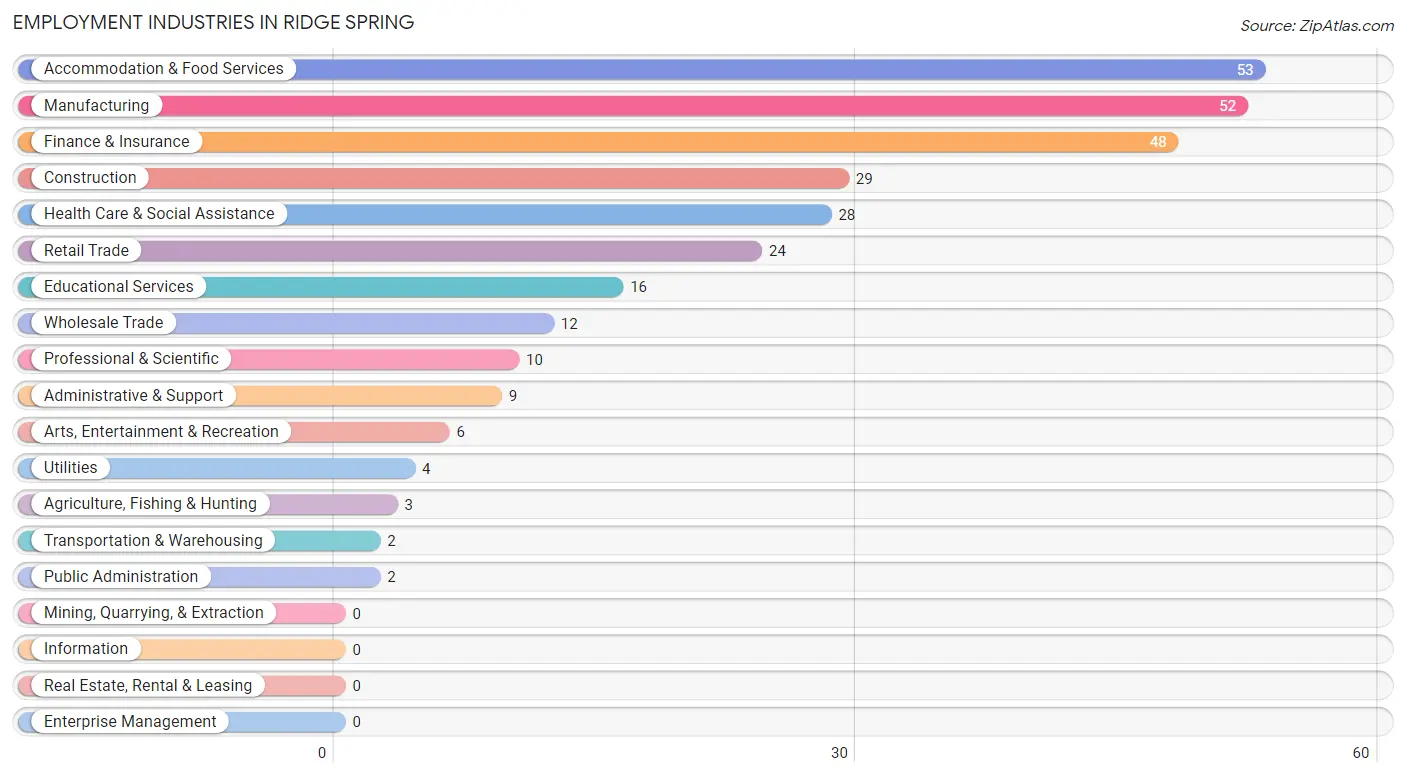
Employment Industries in Ridge Spring
The major employment industries in Ridge Spring include Accommodation & Food Services (53 | 16.1%), Manufacturing (52 | 15.8%), Finance & Insurance (48 | 14.5%), Construction (29 | 8.8%), and Health Care & Social Assistance (28 | 8.5%).
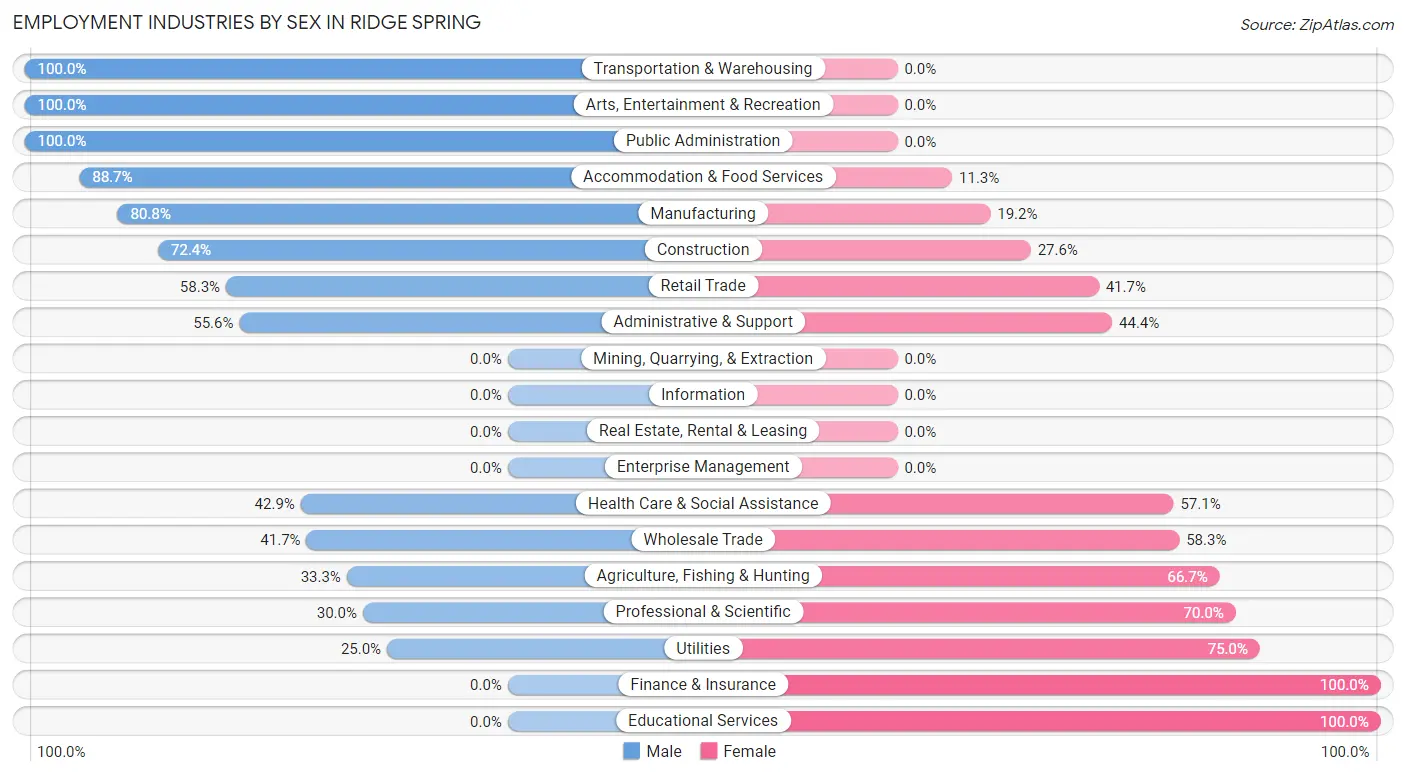
Employment Industries by Sex in Ridge Spring
The Ridge Spring industries that see more men than women are Transportation & Warehousing (100.0%), Arts, Entertainment & Recreation (100.0%), and Public Administration (100.0%), whereas the industries that tend to have a higher number of women are Finance & Insurance (100.0%), Educational Services (100.0%), and Utilities (75.0%).
| Industry | Male | Female |
| Agriculture, Fishing & Hunting | 1 (33.3%) | 2 (66.7%) |
| Mining, Quarrying, & Extraction | 0 (0.0%) | 0 (0.0%) |
| Construction | 21 (72.4%) | 8 (27.6%) |
| Manufacturing | 42 (80.8%) | 10 (19.2%) |
| Wholesale Trade | 5 (41.7%) | 7 (58.3%) |
| Retail Trade | 14 (58.3%) | 10 (41.7%) |
| Transportation & Warehousing | 2 (100.0%) | 0 (0.0%) |
| Utilities | 1 (25.0%) | 3 (75.0%) |
| Information | 0 (0.0%) | 0 (0.0%) |
| Finance & Insurance | 0 (0.0%) | 48 (100.0%) |
| Real Estate, Rental & Leasing | 0 (0.0%) | 0 (0.0%) |
| Professional & Scientific | 3 (30.0%) | 7 (70.0%) |
| Enterprise Management | 0 (0.0%) | 0 (0.0%) |
| Administrative & Support | 5 (55.6%) | 4 (44.4%) |
| Educational Services | 0 (0.0%) | 16 (100.0%) |
| Health Care & Social Assistance | 12 (42.9%) | 16 (57.1%) |
| Arts, Entertainment & Recreation | 6 (100.0%) | 0 (0.0%) |
| Accommodation & Food Services | 47 (88.7%) | 6 (11.3%) |
| Public Administration | 2 (100.0%) | 0 (0.0%) |
| Total | 191 (57.9%) | 139 (42.1%) |
Education in Ridge Spring
School Enrollment in Ridge Spring
The most common levels of schooling among the 105 students in Ridge Spring are middle school (36 | 34.3%), high school (34 | 32.4%), and college / undergraduate (18 | 17.1%).
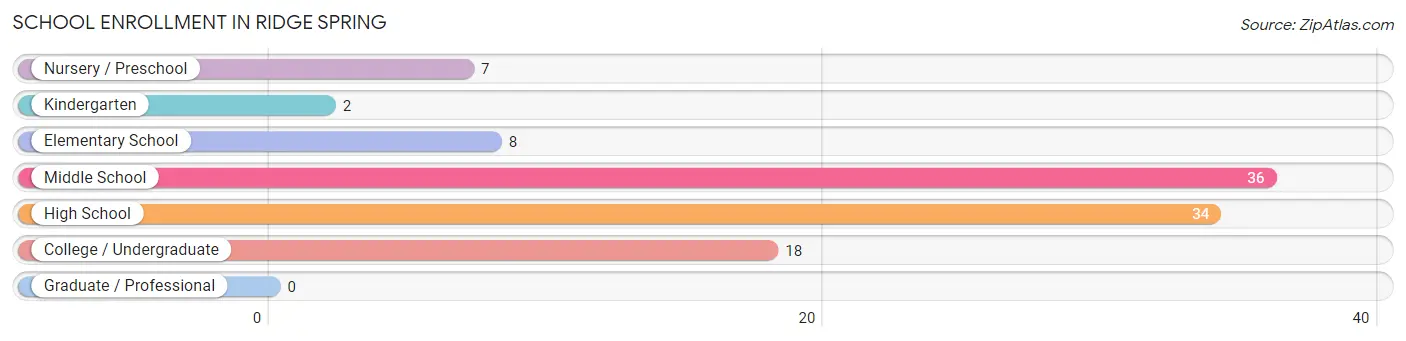
| School Level | # Students | % Students |
| Nursery / Preschool | 7 | 6.7% |
| Kindergarten | 2 | 1.9% |
| Elementary School | 8 | 7.6% |
| Middle School | 36 | 34.3% |
| High School | 34 | 32.4% |
| College / Undergraduate | 18 | 17.1% |
| Graduate / Professional | 0 | 0.0% |
| Total | 105 | 100.0% |
School Enrollment by Age by Funding Source in Ridge Spring
Out of a total of 105 students who are enrolled in schools in Ridge Spring, 2 (1.9%) attend a private institution, while the remaining 103 (98.1%) are enrolled in public schools. The age group of 15 to 17 year olds has the highest likelihood of being enrolled in private schools, with 2 (10.5% in the age bracket) enrolled. Conversely, the age group of 3 to 4 year olds has the lowest likelihood of being enrolled in a private school, with 7 (100.0% in the age bracket) attending a public institution.
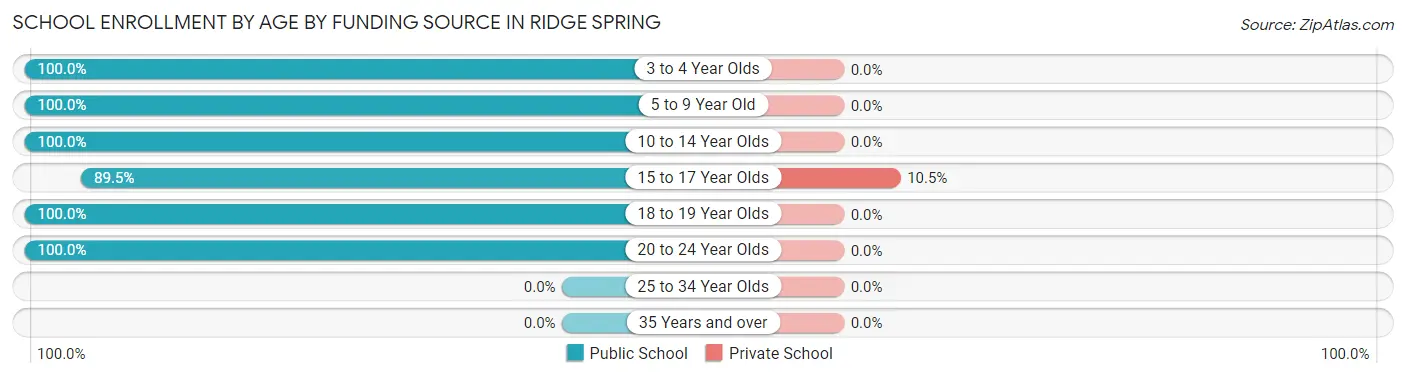
| Age Bracket | Public School | Private School |
| 3 to 4 Year Olds | 7 (100.0%) | 0 (0.0%) |
| 5 to 9 Year Old | 7 (100.0%) | 0 (0.0%) |
| 10 to 14 Year Olds | 50 (100.0%) | 0 (0.0%) |
| 15 to 17 Year Olds | 17 (89.5%) | 2 (10.5%) |
| 18 to 19 Year Olds | 2 (100.0%) | 0 (0.0%) |
| 20 to 24 Year Olds | 20 (100.0%) | 0 (0.0%) |
| 25 to 34 Year Olds | 0 (0.0%) | 0 (0.0%) |
| 35 Years and over | 0 (0.0%) | 0 (0.0%) |
| Total | 103 (98.1%) | 2 (1.9%) |
Educational Attainment by Field of Study in Ridge Spring
Education (82 | 44.8%), science & technology (46 | 25.1%), business (17 | 9.3%), social sciences (12 | 6.6%), and bio, nature & agricultural (7 | 3.8%) are the most common fields of study among 183 individuals in Ridge Spring who have obtained a bachelor's degree or higher.
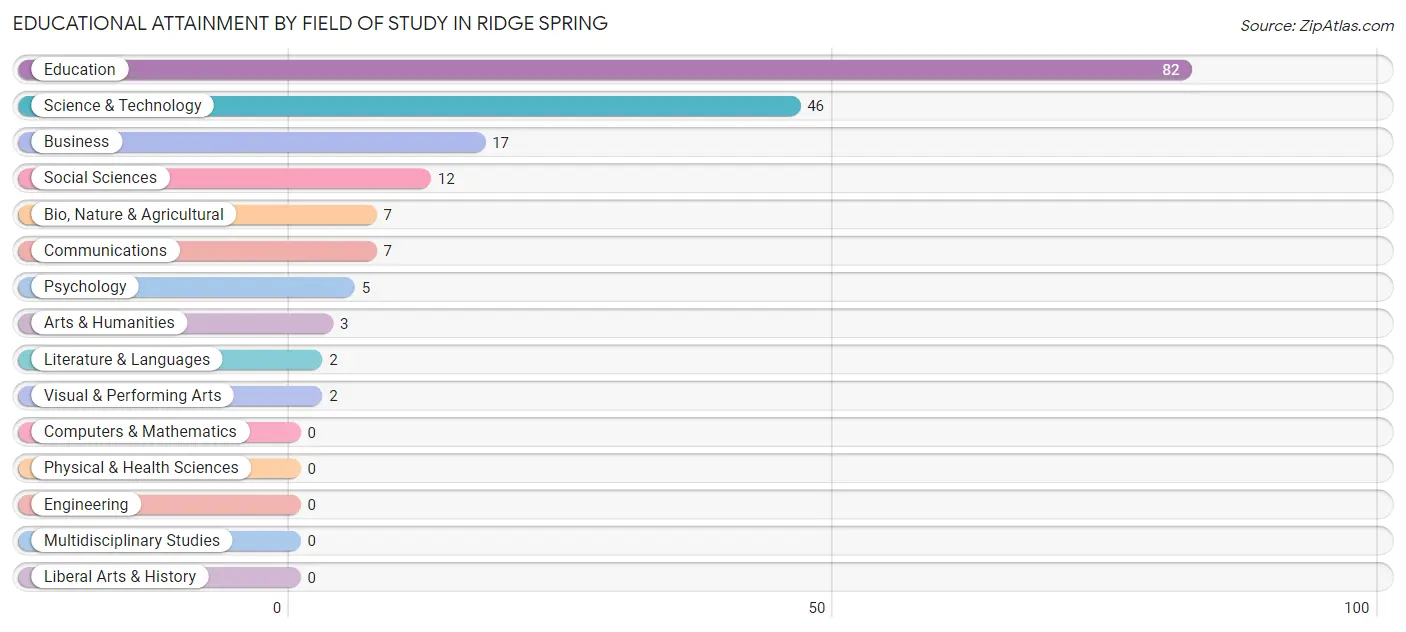
| Field of Study | # Graduates | % Graduates |
| Computers & Mathematics | 0 | 0.0% |
| Bio, Nature & Agricultural | 7 | 3.8% |
| Physical & Health Sciences | 0 | 0.0% |
| Psychology | 5 | 2.7% |
| Social Sciences | 12 | 6.6% |
| Engineering | 0 | 0.0% |
| Multidisciplinary Studies | 0 | 0.0% |
| Science & Technology | 46 | 25.1% |
| Business | 17 | 9.3% |
| Education | 82 | 44.8% |
| Literature & Languages | 2 | 1.1% |
| Liberal Arts & History | 0 | 0.0% |
| Visual & Performing Arts | 2 | 1.1% |
| Communications | 7 | 3.8% |
| Arts & Humanities | 3 | 1.6% |
| Total | 183 | 100.0% |
Transportation & Commute in Ridge Spring
Vehicle Availability by Sex in Ridge Spring
The most prevalent vehicle ownership categories in Ridge Spring are males with 5 or more vehicles (54, accounting for 28.4%) and females with 5 or more vehicles (51, making up 38.9%).
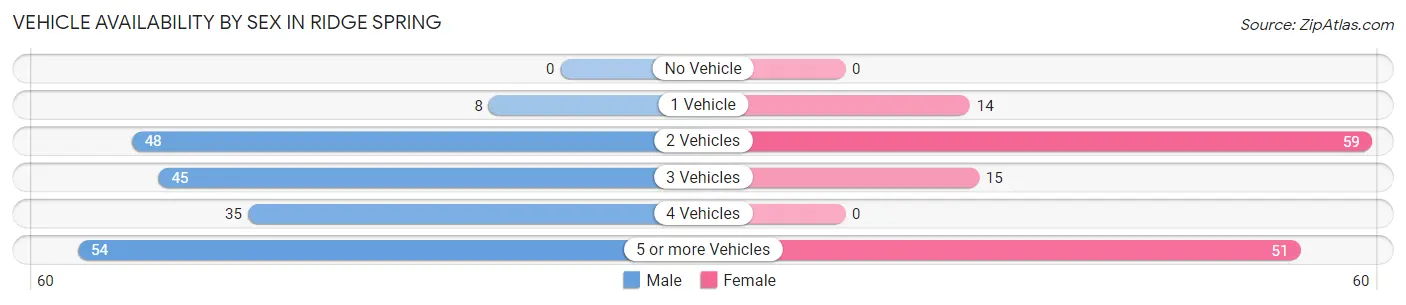
| Vehicles Available | Male | Female |
| No Vehicle | 0 (0.0%) | 0 (0.0%) |
| 1 Vehicle | 8 (4.2%) | 14 (10.1%) |
| 2 Vehicles | 48 (25.3%) | 59 (42.4%) |
| 3 Vehicles | 45 (23.7%) | 15 (10.8%) |
| 4 Vehicles | 35 (18.4%) | 0 (0.0%) |
| 5 or more Vehicles | 54 (28.4%) | 51 (36.7%) |
| Total | 190 (100.0%) | 139 (100.0%) |
Commute Time in Ridge Spring
The most frequently occuring commute durations in Ridge Spring are 45 to 59 minutes (71 commuters, 23.1%), 35 to 39 minutes (65 commuters, 21.1%), and 20 to 24 minutes (35 commuters, 11.4%).
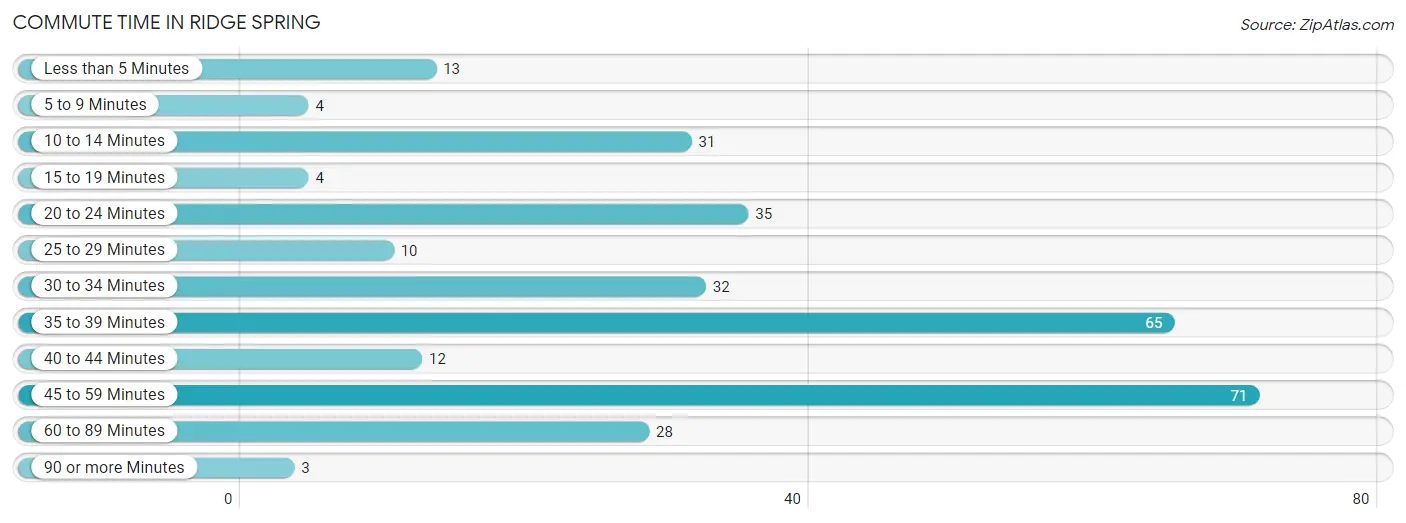
| Commute Time | # Commuters | % Commuters |
| Less than 5 Minutes | 13 | 4.2% |
| 5 to 9 Minutes | 4 | 1.3% |
| 10 to 14 Minutes | 31 | 10.1% |
| 15 to 19 Minutes | 4 | 1.3% |
| 20 to 24 Minutes | 35 | 11.4% |
| 25 to 29 Minutes | 10 | 3.3% |
| 30 to 34 Minutes | 32 | 10.4% |
| 35 to 39 Minutes | 65 | 21.1% |
| 40 to 44 Minutes | 12 | 3.9% |
| 45 to 59 Minutes | 71 | 23.1% |
| 60 to 89 Minutes | 28 | 9.1% |
| 90 or more Minutes | 3 | 1.0% |
Commute Time by Sex in Ridge Spring
The most common commute times in Ridge Spring are 45 to 59 minutes (64 commuters, 34.2%) for males and 35 to 39 minutes (62 commuters, 51.2%) for females.
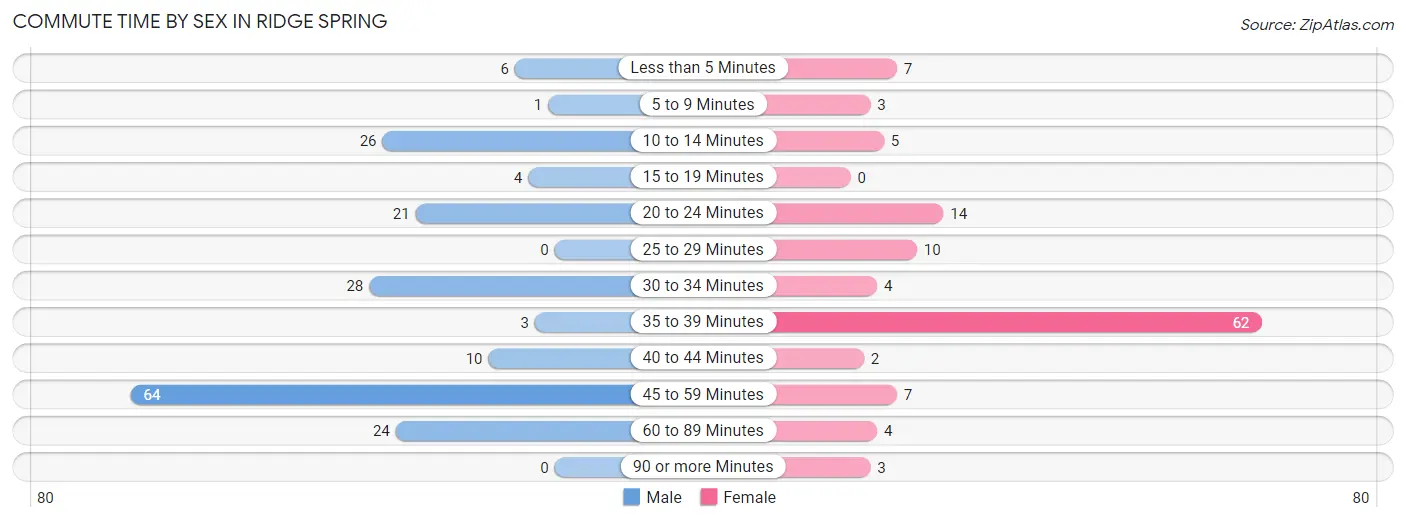
| Commute Time | Male | Female |
| Less than 5 Minutes | 6 (3.2%) | 7 (5.8%) |
| 5 to 9 Minutes | 1 (0.5%) | 3 (2.5%) |
| 10 to 14 Minutes | 26 (13.9%) | 5 (4.1%) |
| 15 to 19 Minutes | 4 (2.1%) | 0 (0.0%) |
| 20 to 24 Minutes | 21 (11.2%) | 14 (11.6%) |
| 25 to 29 Minutes | 0 (0.0%) | 10 (8.3%) |
| 30 to 34 Minutes | 28 (15.0%) | 4 (3.3%) |
| 35 to 39 Minutes | 3 (1.6%) | 62 (51.2%) |
| 40 to 44 Minutes | 10 (5.3%) | 2 (1.7%) |
| 45 to 59 Minutes | 64 (34.2%) | 7 (5.8%) |
| 60 to 89 Minutes | 24 (12.8%) | 4 (3.3%) |
| 90 or more Minutes | 0 (0.0%) | 3 (2.5%) |
Time of Departure to Work by Sex in Ridge Spring
The most frequent times of departure to work in Ridge Spring are 12:00 AM to 4:59 AM (62, 33.2%) for males and 8:30 AM to 8:59 AM (46, 38.0%) for females.
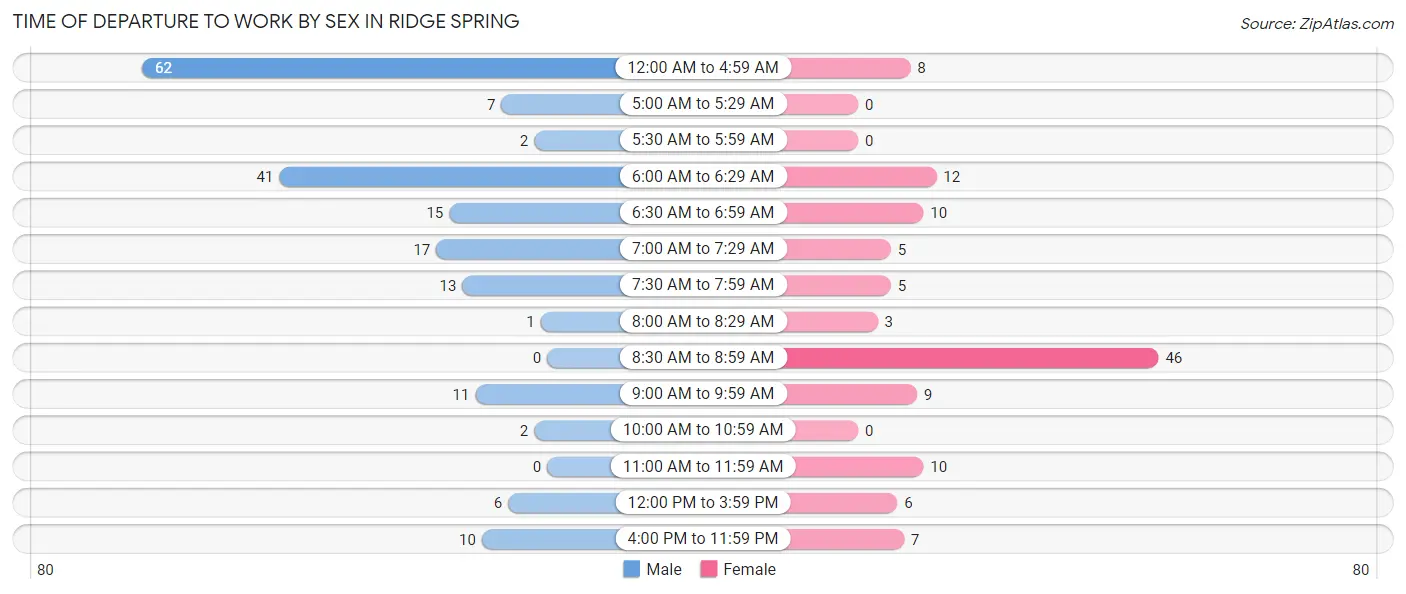
| Time of Departure | Male | Female |
| 12:00 AM to 4:59 AM | 62 (33.2%) | 8 (6.6%) |
| 5:00 AM to 5:29 AM | 7 (3.7%) | 0 (0.0%) |
| 5:30 AM to 5:59 AM | 2 (1.1%) | 0 (0.0%) |
| 6:00 AM to 6:29 AM | 41 (21.9%) | 12 (9.9%) |
| 6:30 AM to 6:59 AM | 15 (8.0%) | 10 (8.3%) |
| 7:00 AM to 7:29 AM | 17 (9.1%) | 5 (4.1%) |
| 7:30 AM to 7:59 AM | 13 (7.0%) | 5 (4.1%) |
| 8:00 AM to 8:29 AM | 1 (0.5%) | 3 (2.5%) |
| 8:30 AM to 8:59 AM | 0 (0.0%) | 46 (38.0%) |
| 9:00 AM to 9:59 AM | 11 (5.9%) | 9 (7.4%) |
| 10:00 AM to 10:59 AM | 2 (1.1%) | 0 (0.0%) |
| 11:00 AM to 11:59 AM | 0 (0.0%) | 10 (8.3%) |
| 12:00 PM to 3:59 PM | 6 (3.2%) | 6 (5.0%) |
| 4:00 PM to 11:59 PM | 10 (5.3%) | 7 (5.8%) |
| Total | 187 (100.0%) | 121 (100.0%) |
Housing Occupancy in Ridge Spring
Occupancy by Ownership in Ridge Spring
Of the total 327 dwellings in Ridge Spring, owner-occupied units account for 247 (75.5%), while renter-occupied units make up 80 (24.5%).
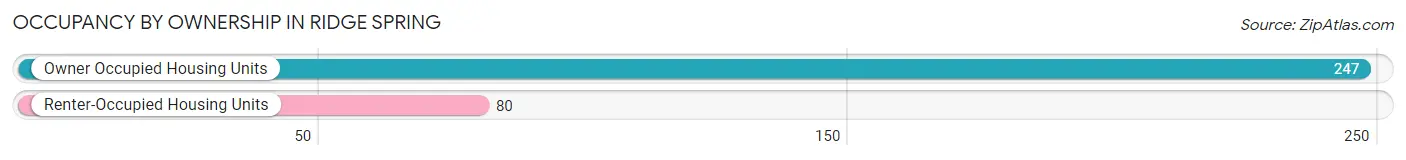
| Occupancy | # Housing Units | % Housing Units |
| Owner Occupied Housing Units | 247 | 75.5% |
| Renter-Occupied Housing Units | 80 | 24.5% |
| Total Occupied Housing Units | 327 | 100.0% |
Occupancy by Household Size in Ridge Spring
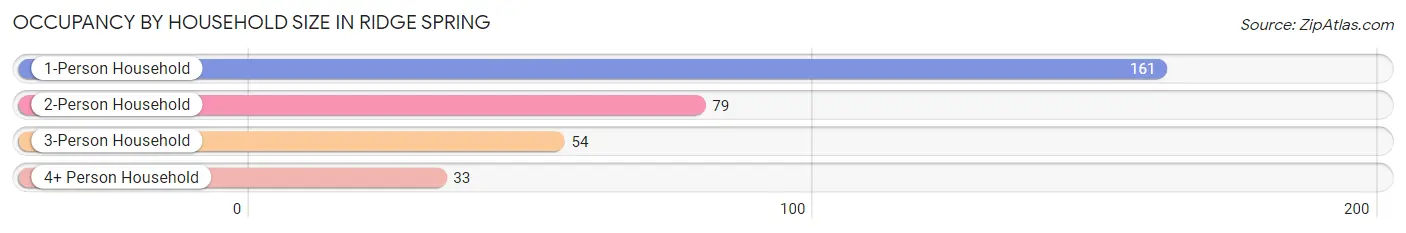
| Household Size | # Housing Units | % Housing Units |
| 1-Person Household | 161 | 49.2% |
| 2-Person Household | 79 | 24.2% |
| 3-Person Household | 54 | 16.5% |
| 4+ Person Household | 33 | 10.1% |
| Total Housing Units | 327 | 100.0% |
Occupancy by Ownership by Household Size in Ridge Spring
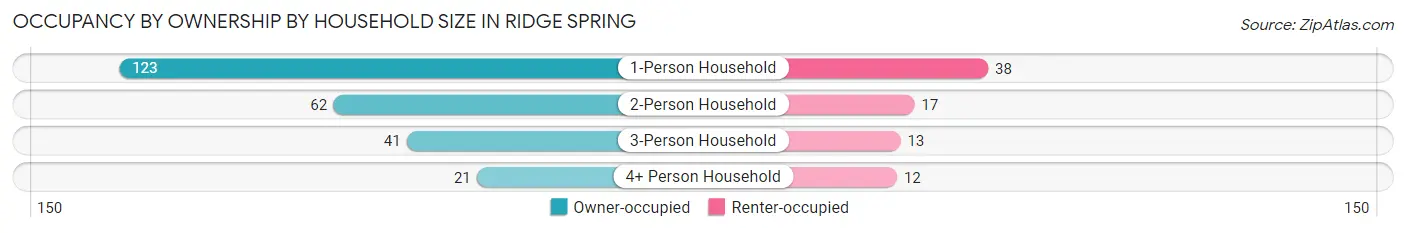
| Household Size | Owner-occupied | Renter-occupied |
| 1-Person Household | 123 (76.4%) | 38 (23.6%) |
| 2-Person Household | 62 (78.5%) | 17 (21.5%) |
| 3-Person Household | 41 (75.9%) | 13 (24.1%) |
| 4+ Person Household | 21 (63.6%) | 12 (36.4%) |
| Total Housing Units | 247 (75.5%) | 80 (24.5%) |
Occupancy by Educational Attainment in Ridge Spring
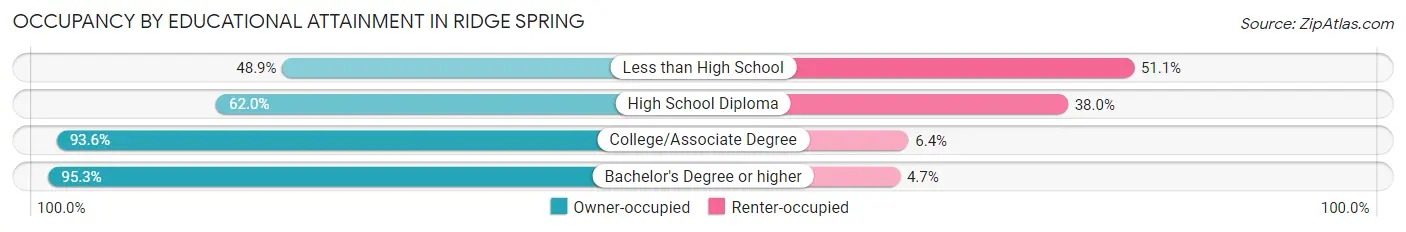
| Household Size | Owner-occupied | Renter-occupied |
| Less than High School | 22 (48.9%) | 23 (51.1%) |
| High School Diploma | 80 (62.0%) | 49 (38.0%) |
| College/Associate Degree | 44 (93.6%) | 3 (6.4%) |
| Bachelor's Degree or higher | 101 (95.3%) | 5 (4.7%) |
Occupancy by Age of Householder in Ridge Spring
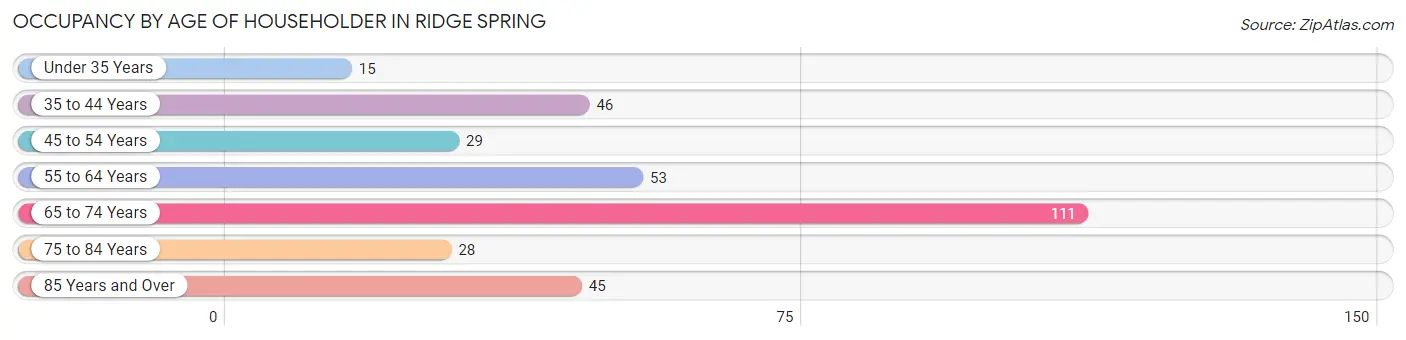
| Age Bracket | # Households | % Households |
| Under 35 Years | 15 | 4.6% |
| 35 to 44 Years | 46 | 14.1% |
| 45 to 54 Years | 29 | 8.9% |
| 55 to 64 Years | 53 | 16.2% |
| 65 to 74 Years | 111 | 33.9% |
| 75 to 84 Years | 28 | 8.6% |
| 85 Years and Over | 45 | 13.8% |
| Total | 327 | 100.0% |
Housing Finances in Ridge Spring
Median Income by Occupancy in Ridge Spring
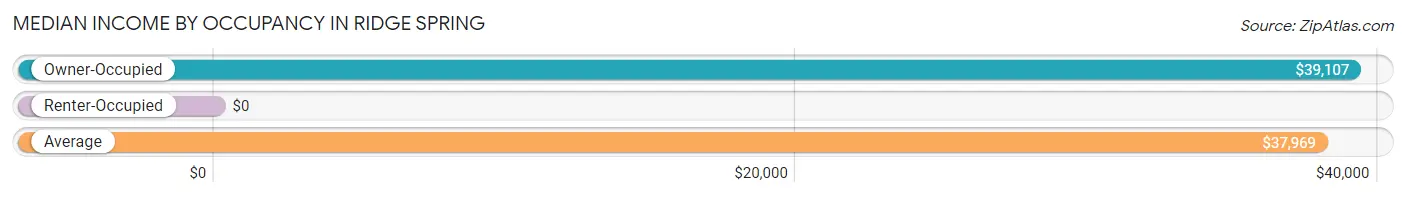
| Occupancy Type | # Households | Median Income |
| Owner-Occupied | 247 (75.5%) | $39,107 |
| Renter-Occupied | 80 (24.5%) | $0 |
| Average | 327 (100.0%) | $37,969 |
Occupancy by Householder Income Bracket in Ridge Spring
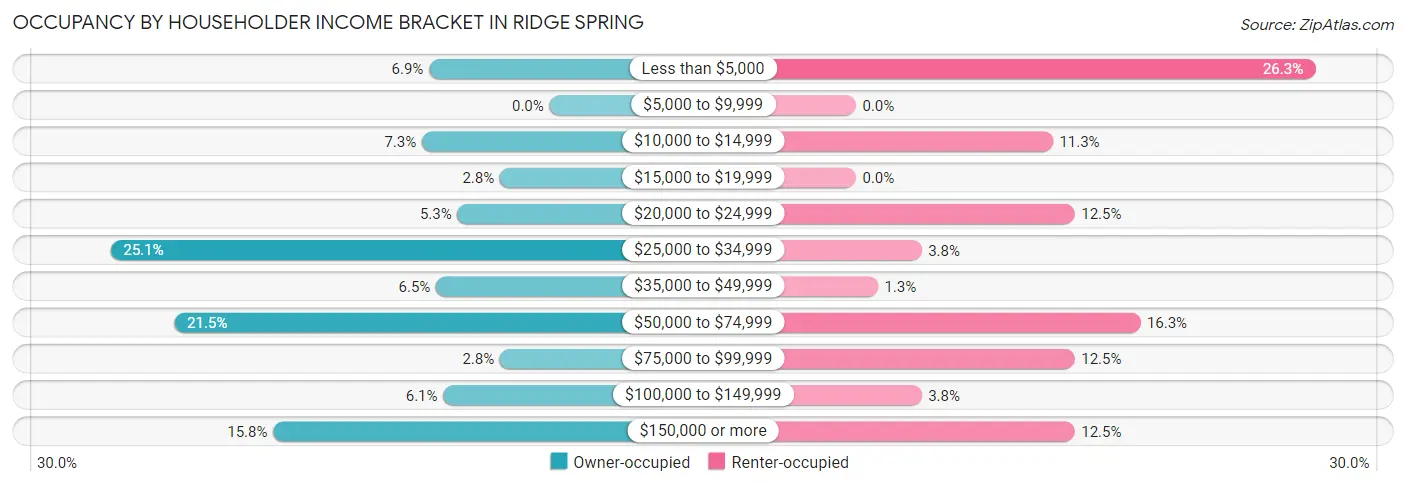
| Income Bracket | Owner-occupied | Renter-occupied |
| Less than $5,000 | 17 (6.9%) | 21 (26.3%) |
| $5,000 to $9,999 | 0 (0.0%) | 0 (0.0%) |
| $10,000 to $14,999 | 18 (7.3%) | 9 (11.3%) |
| $15,000 to $19,999 | 7 (2.8%) | 0 (0.0%) |
| $20,000 to $24,999 | 13 (5.3%) | 10 (12.5%) |
| $25,000 to $34,999 | 62 (25.1%) | 3 (3.7%) |
| $35,000 to $49,999 | 16 (6.5%) | 1 (1.3%) |
| $50,000 to $74,999 | 53 (21.5%) | 13 (16.3%) |
| $75,000 to $99,999 | 7 (2.8%) | 10 (12.5%) |
| $100,000 to $149,999 | 15 (6.1%) | 3 (3.7%) |
| $150,000 or more | 39 (15.8%) | 10 (12.5%) |
| Total | 247 (100.0%) | 80 (100.0%) |
Monthly Housing Cost Tiers in Ridge Spring
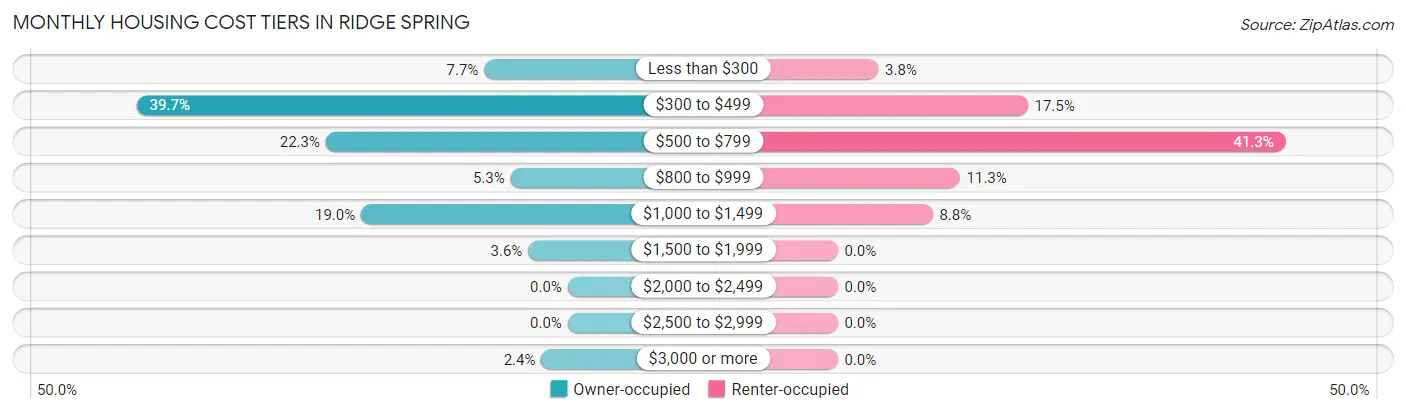
| Monthly Cost | Owner-occupied | Renter-occupied |
| Less than $300 | 19 (7.7%) | 3 (3.7%) |
| $300 to $499 | 98 (39.7%) | 14 (17.5%) |
| $500 to $799 | 55 (22.3%) | 33 (41.2%) |
| $800 to $999 | 13 (5.3%) | 9 (11.3%) |
| $1,000 to $1,499 | 47 (19.0%) | 7 (8.7%) |
| $1,500 to $1,999 | 9 (3.6%) | 0 (0.0%) |
| $2,000 to $2,499 | 0 (0.0%) | 0 (0.0%) |
| $2,500 to $2,999 | 0 (0.0%) | 0 (0.0%) |
| $3,000 or more | 6 (2.4%) | 0 (0.0%) |
| Total | 247 (100.0%) | 80 (100.0%) |
Physical Housing Characteristics in Ridge Spring
Housing Structures in Ridge Spring
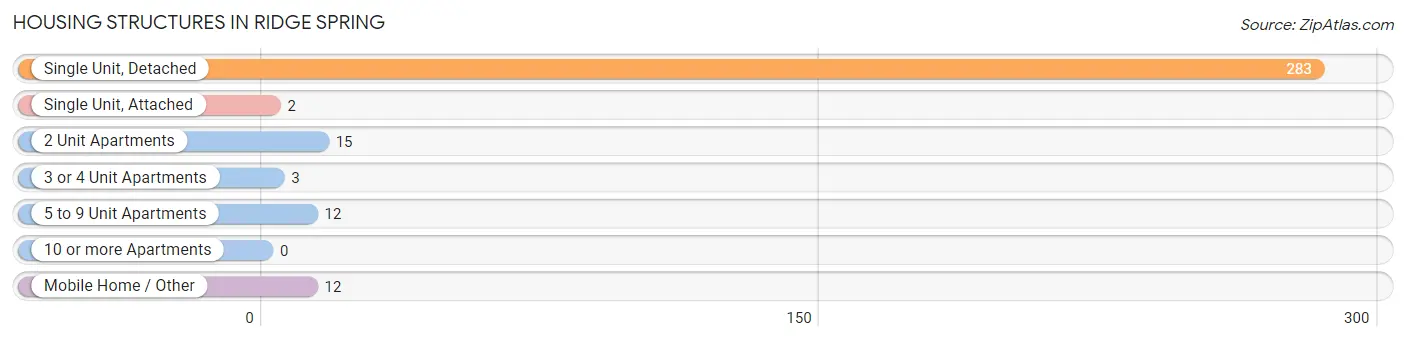
| Structure Type | # Housing Units | % Housing Units |
| Single Unit, Detached | 283 | 86.5% |
| Single Unit, Attached | 2 | 0.6% |
| 2 Unit Apartments | 15 | 4.6% |
| 3 or 4 Unit Apartments | 3 | 0.9% |
| 5 to 9 Unit Apartments | 12 | 3.7% |
| 10 or more Apartments | 0 | 0.0% |
| Mobile Home / Other | 12 | 3.7% |
| Total | 327 | 100.0% |
Housing Structures by Occupancy in Ridge Spring
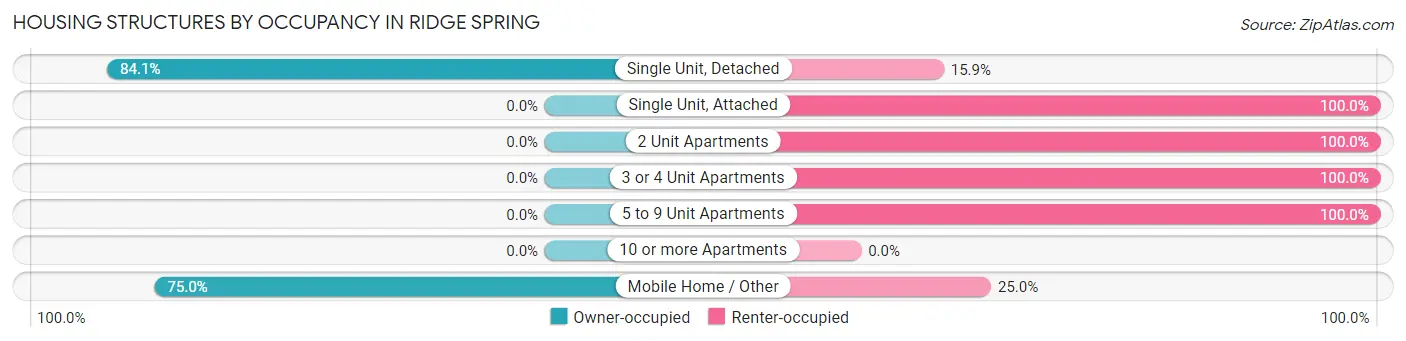
| Structure Type | Owner-occupied | Renter-occupied |
| Single Unit, Detached | 238 (84.1%) | 45 (15.9%) |
| Single Unit, Attached | 0 (0.0%) | 2 (100.0%) |
| 2 Unit Apartments | 0 (0.0%) | 15 (100.0%) |
| 3 or 4 Unit Apartments | 0 (0.0%) | 3 (100.0%) |
| 5 to 9 Unit Apartments | 0 (0.0%) | 12 (100.0%) |
| 10 or more Apartments | 0 (0.0%) | 0 (0.0%) |
| Mobile Home / Other | 9 (75.0%) | 3 (25.0%) |
| Total | 247 (75.5%) | 80 (24.5%) |
Housing Structures by Number of Rooms in Ridge Spring
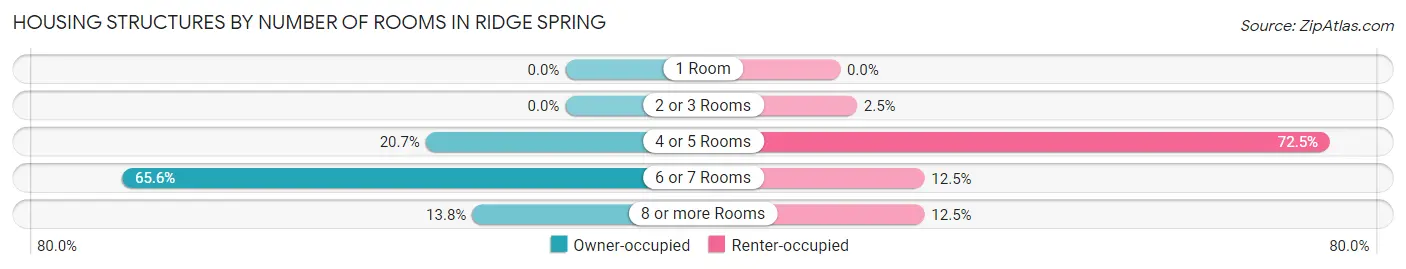
| Number of Rooms | Owner-occupied | Renter-occupied |
| 1 Room | 0 (0.0%) | 0 (0.0%) |
| 2 or 3 Rooms | 0 (0.0%) | 2 (2.5%) |
| 4 or 5 Rooms | 51 (20.6%) | 58 (72.5%) |
| 6 or 7 Rooms | 162 (65.6%) | 10 (12.5%) |
| 8 or more Rooms | 34 (13.8%) | 10 (12.5%) |
| Total | 247 (100.0%) | 80 (100.0%) |
Housing Structure by Heating Type in Ridge Spring
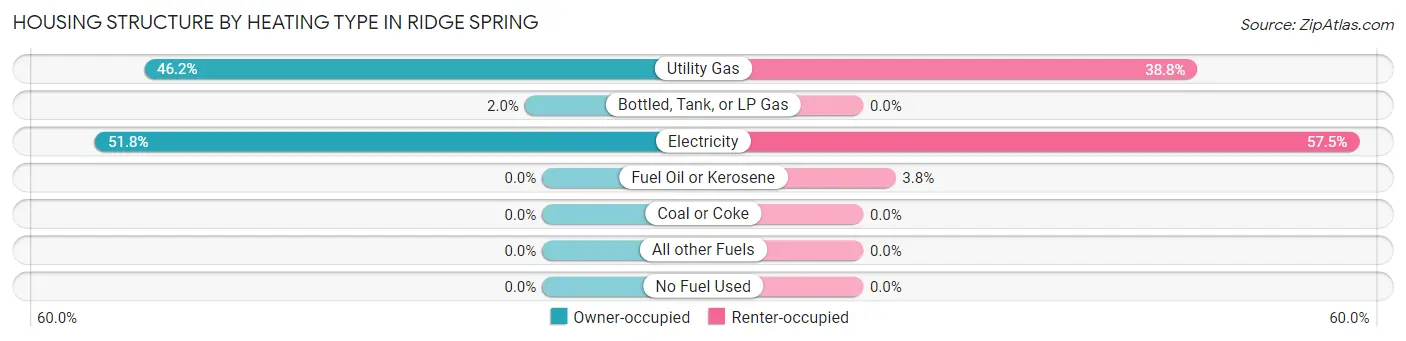
| Heating Type | Owner-occupied | Renter-occupied |
| Utility Gas | 114 (46.2%) | 31 (38.8%) |
| Bottled, Tank, or LP Gas | 5 (2.0%) | 0 (0.0%) |
| Electricity | 128 (51.8%) | 46 (57.5%) |
| Fuel Oil or Kerosene | 0 (0.0%) | 3 (3.7%) |
| Coal or Coke | 0 (0.0%) | 0 (0.0%) |
| All other Fuels | 0 (0.0%) | 0 (0.0%) |
| No Fuel Used | 0 (0.0%) | 0 (0.0%) |
| Total | 247 (100.0%) | 80 (100.0%) |
Household Vehicle Usage in Ridge Spring
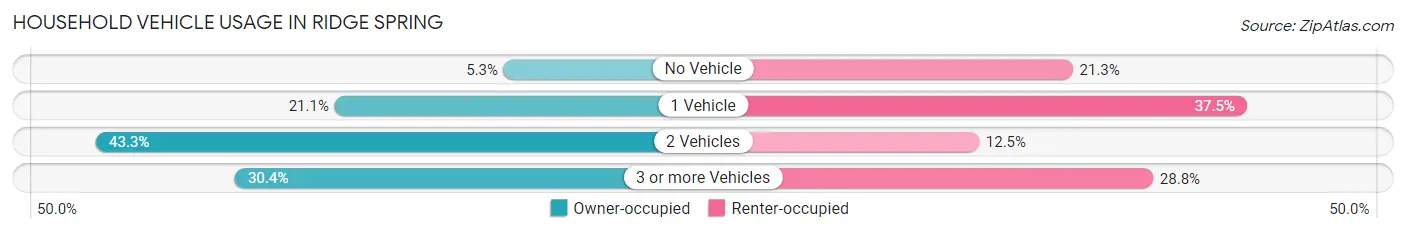
| Vehicles per Household | Owner-occupied | Renter-occupied |
| No Vehicle | 13 (5.3%) | 17 (21.2%) |
| 1 Vehicle | 52 (21.0%) | 30 (37.5%) |
| 2 Vehicles | 107 (43.3%) | 10 (12.5%) |
| 3 or more Vehicles | 75 (30.4%) | 23 (28.7%) |
| Total | 247 (100.0%) | 80 (100.0%) |
Real Estate & Mortgages in Ridge Spring
Real Estate and Mortgage Overview in Ridge Spring
| Characteristic | Without Mortgage | With Mortgage |
| Housing Units | 180 | 67 |
| Median Property Value | $65,800 | $122,900 |
| Median Household Income | - | - |
| Monthly Housing Costs | $395 | $6 |
| Real Estate Taxes | $675 | $2 |
Property Value by Mortgage Status in Ridge Spring
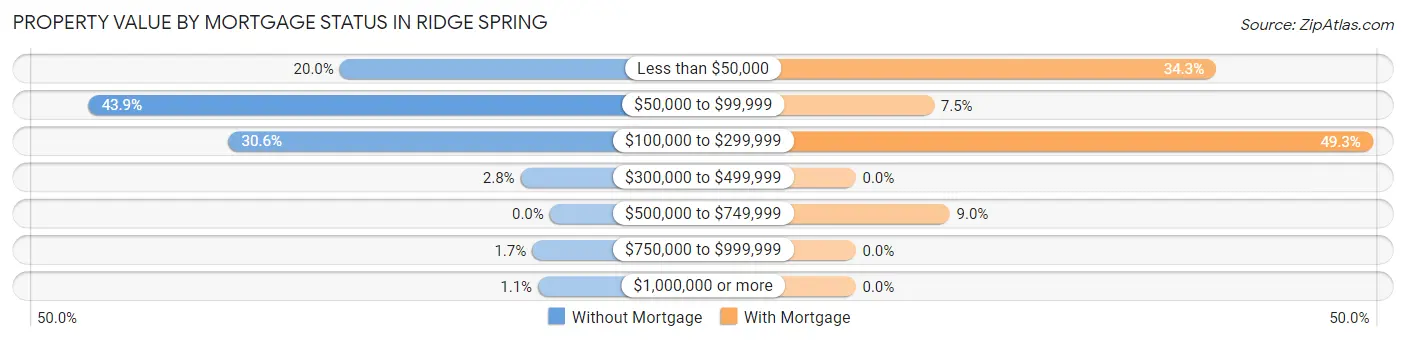
| Property Value | Without Mortgage | With Mortgage |
| Less than $50,000 | 36 (20.0%) | 23 (34.3%) |
| $50,000 to $99,999 | 79 (43.9%) | 5 (7.5%) |
| $100,000 to $299,999 | 55 (30.6%) | 33 (49.2%) |
| $300,000 to $499,999 | 5 (2.8%) | 0 (0.0%) |
| $500,000 to $749,999 | 0 (0.0%) | 6 (9.0%) |
| $750,000 to $999,999 | 3 (1.7%) | 0 (0.0%) |
| $1,000,000 or more | 2 (1.1%) | 0 (0.0%) |
| Total | 180 (100.0%) | 67 (100.0%) |
Household Income by Mortgage Status in Ridge Spring
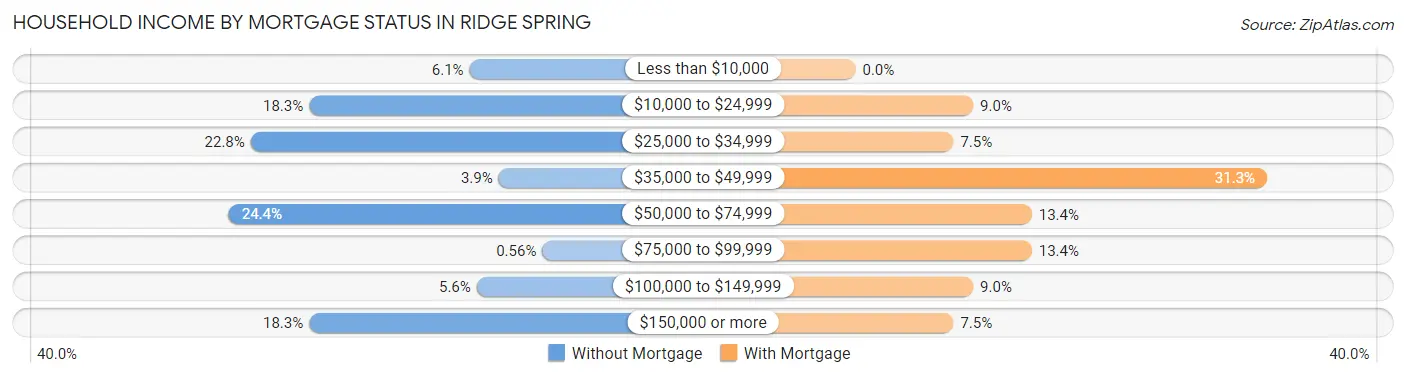
| Household Income | Without Mortgage | With Mortgage |
| Less than $10,000 | 11 (6.1%) | 0 (0.0%) |
| $10,000 to $24,999 | 33 (18.3%) | 6 (9.0%) |
| $25,000 to $34,999 | 41 (22.8%) | 5 (7.5%) |
| $35,000 to $49,999 | 7 (3.9%) | 21 (31.3%) |
| $50,000 to $74,999 | 44 (24.4%) | 9 (13.4%) |
| $75,000 to $99,999 | 1 (0.6%) | 9 (13.4%) |
| $100,000 to $149,999 | 10 (5.6%) | 6 (9.0%) |
| $150,000 or more | 33 (18.3%) | 5 (7.5%) |
| Total | 180 (100.0%) | 67 (100.0%) |
Property Value to Household Income Ratio in Ridge Spring
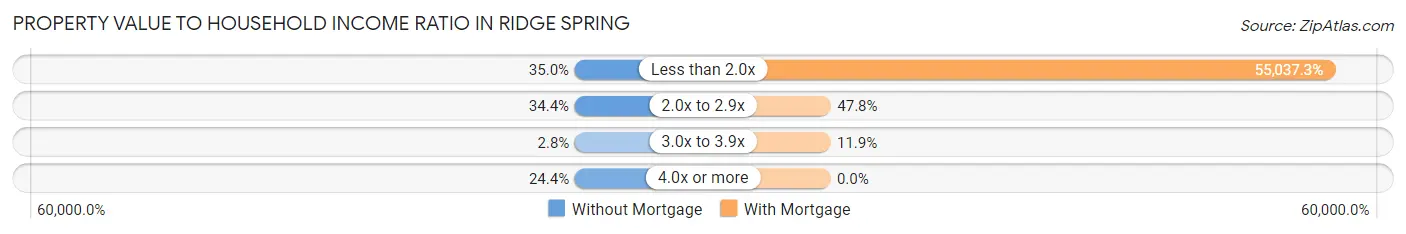
| Value-to-Income Ratio | Without Mortgage | With Mortgage |
| Less than 2.0x | 63 (35.0%) | 36,875 (55,037.3%) |
| 2.0x to 2.9x | 62 (34.4%) | 32 (47.8%) |
| 3.0x to 3.9x | 5 (2.8%) | 8 (11.9%) |
| 4.0x or more | 44 (24.4%) | 0 (0.0%) |
| Total | 180 (100.0%) | 67 (100.0%) |
Real Estate Taxes by Mortgage Status in Ridge Spring
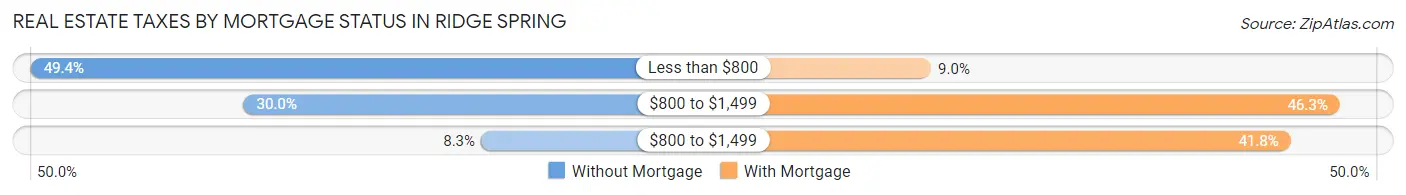
| Property Taxes | Without Mortgage | With Mortgage |
| Less than $800 | 89 (49.4%) | 6 (9.0%) |
| $800 to $1,499 | 54 (30.0%) | 31 (46.3%) |
| $800 to $1,499 | 15 (8.3%) | 28 (41.8%) |
| Total | 180 (100.0%) | 67 (100.0%) |
Health & Disability in Ridge Spring
Health Insurance Coverage by Age in Ridge Spring
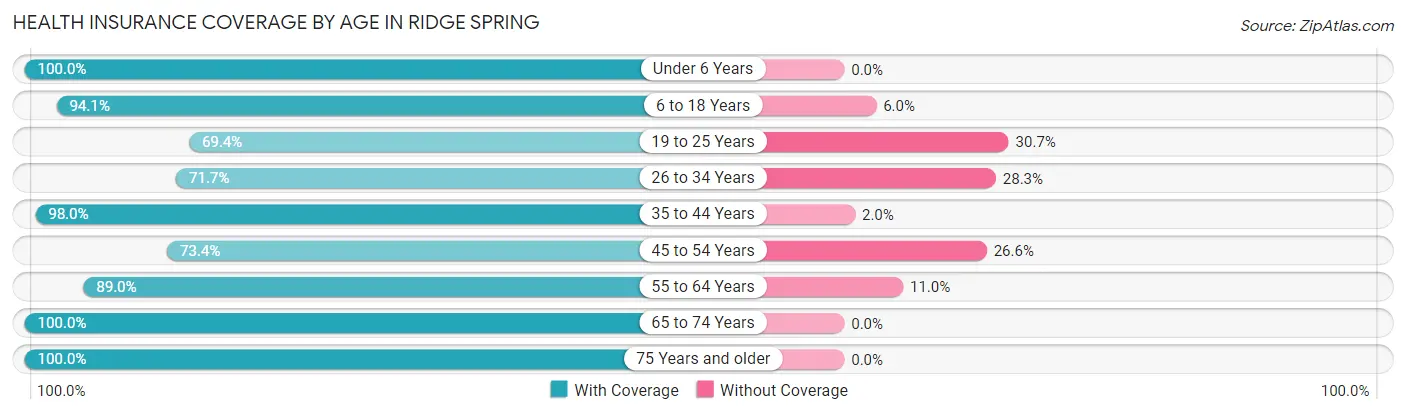
| Age Bracket | With Coverage | Without Coverage |
| Under 6 Years | 19 (100.0%) | 0 (0.0%) |
| 6 to 18 Years | 79 (94.1%) | 5 (5.9%) |
| 19 to 25 Years | 43 (69.4%) | 19 (30.6%) |
| 26 to 34 Years | 33 (71.7%) | 13 (28.3%) |
| 35 to 44 Years | 147 (98.0%) | 3 (2.0%) |
| 45 to 54 Years | 47 (73.4%) | 17 (26.6%) |
| 55 to 64 Years | 65 (89.0%) | 8 (11.0%) |
| 65 to 74 Years | 132 (100.0%) | 0 (0.0%) |
| 75 Years and older | 83 (100.0%) | 0 (0.0%) |
| Total | 648 (90.9%) | 65 (9.1%) |
Health Insurance Coverage by Citizenship Status in Ridge Spring
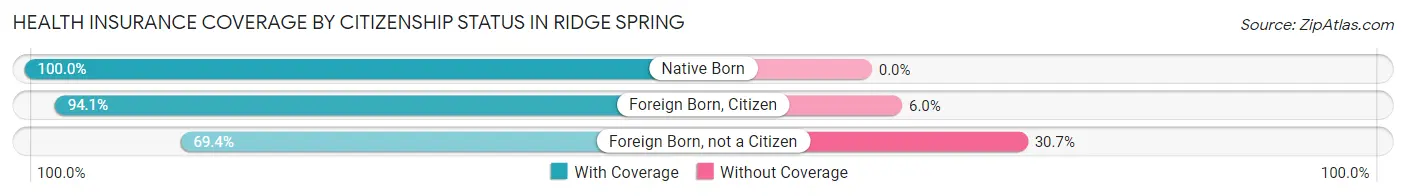
| Citizenship Status | With Coverage | Without Coverage |
| Native Born | 19 (100.0%) | 0 (0.0%) |
| Foreign Born, Citizen | 79 (94.1%) | 5 (5.9%) |
| Foreign Born, not a Citizen | 43 (69.4%) | 19 (30.6%) |
Health Insurance Coverage by Household Income in Ridge Spring
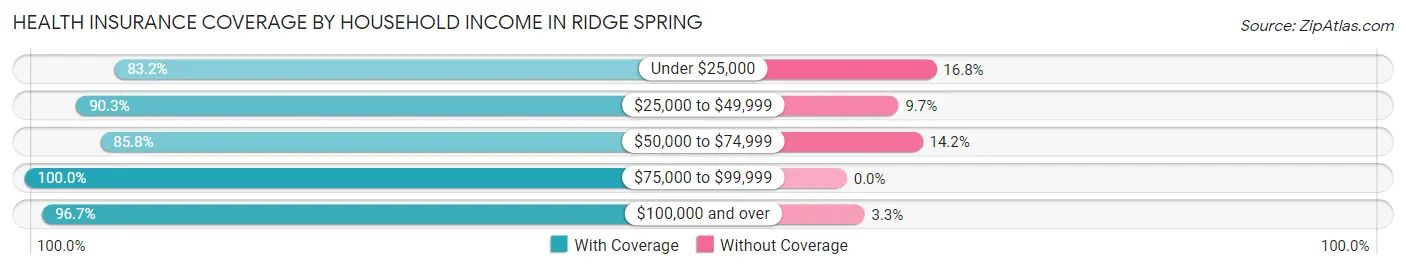
| Household Income | With Coverage | Without Coverage |
| Under $25,000 | 114 (83.2%) | 23 (16.8%) |
| $25,000 to $49,999 | 112 (90.3%) | 12 (9.7%) |
| $50,000 to $74,999 | 127 (85.8%) | 21 (14.2%) |
| $75,000 to $99,999 | 32 (100.0%) | 0 (0.0%) |
| $100,000 and over | 263 (96.7%) | 9 (3.3%) |
Public vs Private Health Insurance Coverage by Age in Ridge Spring
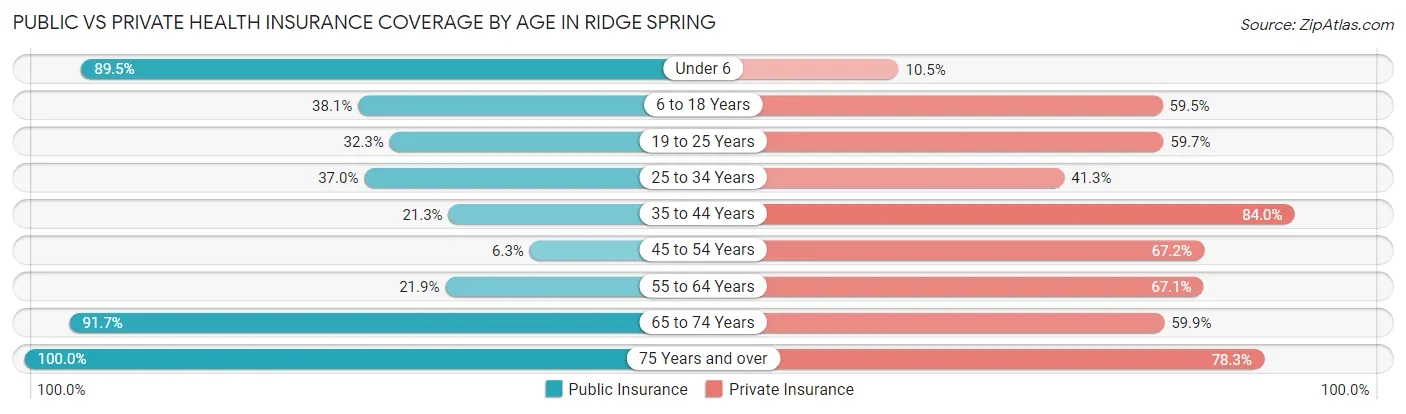
| Age Bracket | Public Insurance | Private Insurance |
| Under 6 | 17 (89.5%) | 2 (10.5%) |
| 6 to 18 Years | 32 (38.1%) | 50 (59.5%) |
| 19 to 25 Years | 20 (32.3%) | 37 (59.7%) |
| 25 to 34 Years | 17 (37.0%) | 19 (41.3%) |
| 35 to 44 Years | 32 (21.3%) | 126 (84.0%) |
| 45 to 54 Years | 4 (6.2%) | 43 (67.2%) |
| 55 to 64 Years | 16 (21.9%) | 49 (67.1%) |
| 65 to 74 Years | 121 (91.7%) | 79 (59.9%) |
| 75 Years and over | 83 (100.0%) | 65 (78.3%) |
| Total | 342 (48.0%) | 470 (65.9%) |
Disability Status by Sex by Age in Ridge Spring
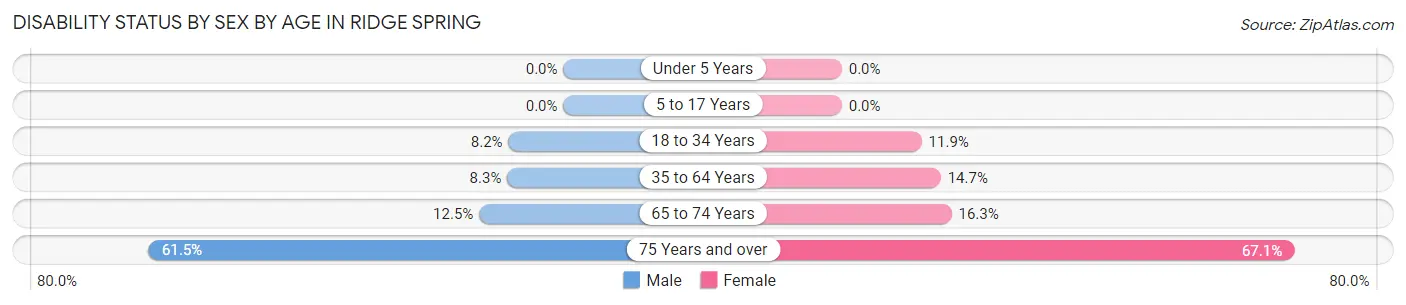
| Age Bracket | Male | Female |
| Under 5 Years | 0 (0.0%) | 0 (0.0%) |
| 5 to 17 Years | 0 (0.0%) | 0 (0.0%) |
| 18 to 34 Years | 4 (8.2%) | 7 (11.9%) |
| 35 to 64 Years | 12 (8.3%) | 21 (14.7%) |
| 65 to 74 Years | 5 (12.5%) | 15 (16.3%) |
| 75 Years and over | 8 (61.5%) | 47 (67.1%) |
Disability Class by Sex by Age in Ridge Spring
Disability Class: Hearing Difficulty
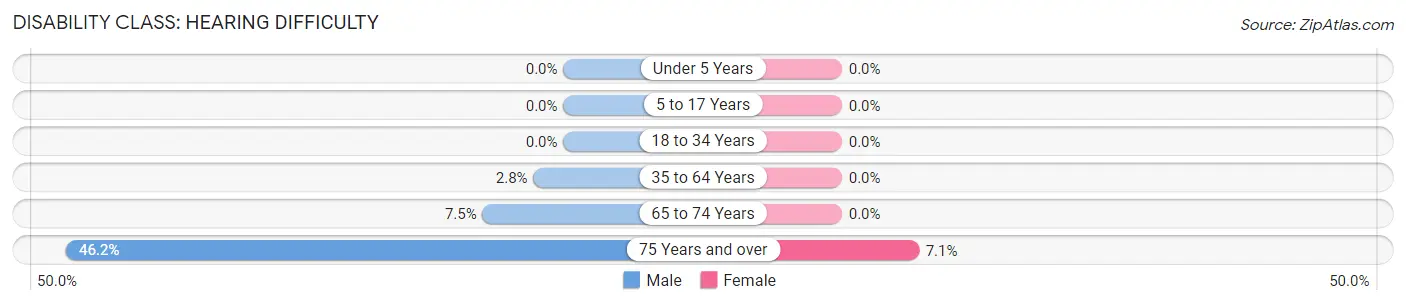
| Age Bracket | Male | Female |
| Under 5 Years | 0 (0.0%) | 0 (0.0%) |
| 5 to 17 Years | 0 (0.0%) | 0 (0.0%) |
| 18 to 34 Years | 0 (0.0%) | 0 (0.0%) |
| 35 to 64 Years | 4 (2.8%) | 0 (0.0%) |
| 65 to 74 Years | 3 (7.5%) | 0 (0.0%) |
| 75 Years and over | 6 (46.2%) | 5 (7.1%) |
Disability Class: Vision Difficulty
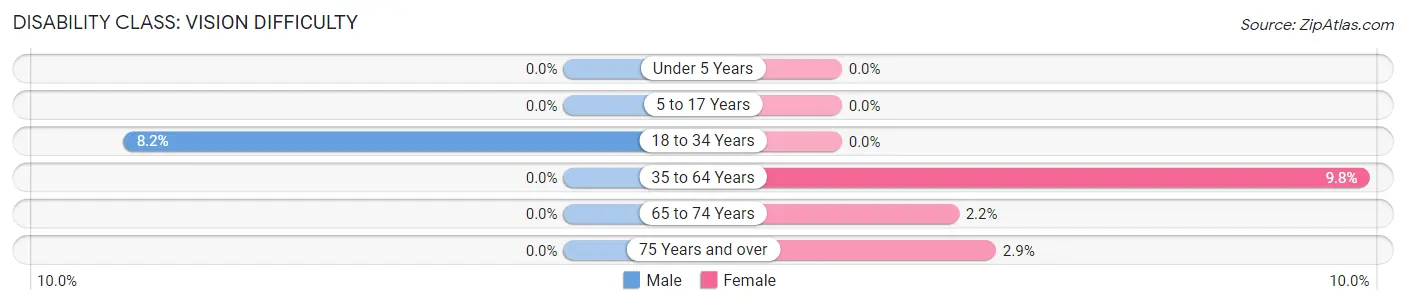
| Age Bracket | Male | Female |
| Under 5 Years | 0 (0.0%) | 0 (0.0%) |
| 5 to 17 Years | 0 (0.0%) | 0 (0.0%) |
| 18 to 34 Years | 4 (8.2%) | 0 (0.0%) |
| 35 to 64 Years | 0 (0.0%) | 14 (9.8%) |
| 65 to 74 Years | 0 (0.0%) | 2 (2.2%) |
| 75 Years and over | 0 (0.0%) | 2 (2.9%) |
Disability Class: Cognitive Difficulty
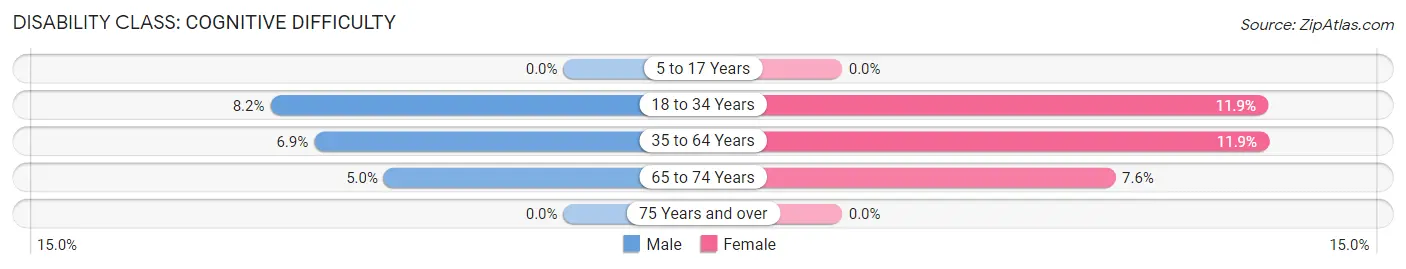
| Age Bracket | Male | Female |
| 5 to 17 Years | 0 (0.0%) | 0 (0.0%) |
| 18 to 34 Years | 4 (8.2%) | 7 (11.9%) |
| 35 to 64 Years | 10 (6.9%) | 17 (11.9%) |
| 65 to 74 Years | 2 (5.0%) | 7 (7.6%) |
| 75 Years and over | 0 (0.0%) | 0 (0.0%) |
Disability Class: Ambulatory Difficulty
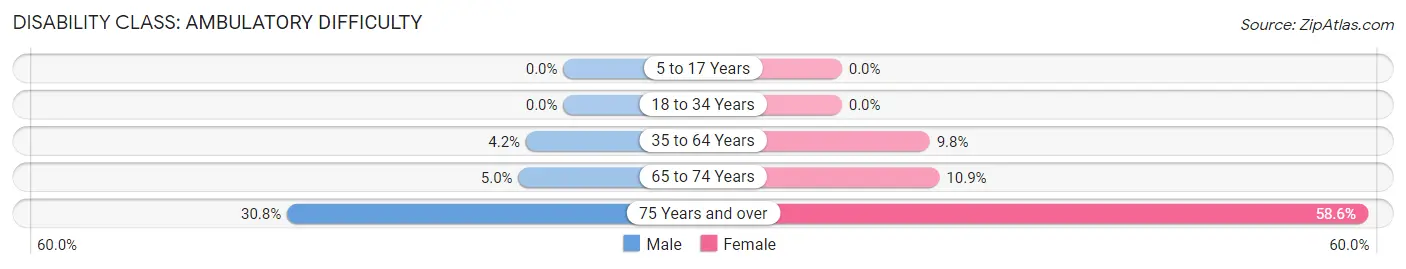
| Age Bracket | Male | Female |
| 5 to 17 Years | 0 (0.0%) | 0 (0.0%) |
| 18 to 34 Years | 0 (0.0%) | 0 (0.0%) |
| 35 to 64 Years | 6 (4.2%) | 14 (9.8%) |
| 65 to 74 Years | 2 (5.0%) | 10 (10.9%) |
| 75 Years and over | 4 (30.8%) | 41 (58.6%) |
Disability Class: Self-Care Difficulty
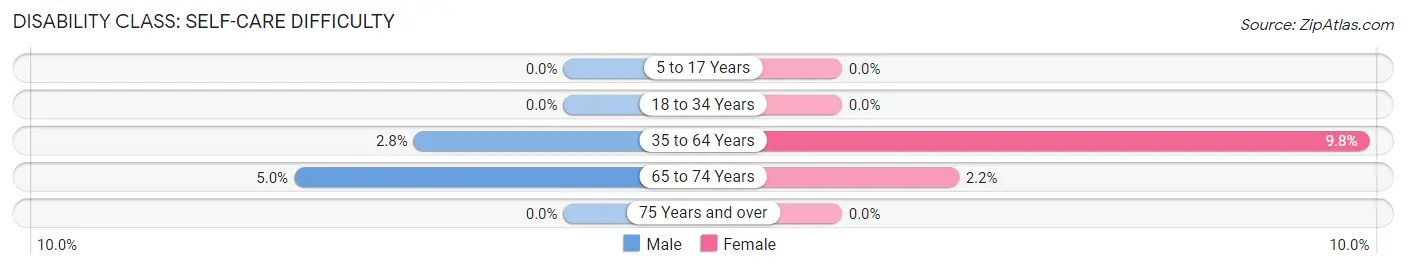
| Age Bracket | Male | Female |
| 5 to 17 Years | 0 (0.0%) | 0 (0.0%) |
| 18 to 34 Years | 0 (0.0%) | 0 (0.0%) |
| 35 to 64 Years | 4 (2.8%) | 14 (9.8%) |
| 65 to 74 Years | 2 (5.0%) | 2 (2.2%) |
| 75 Years and over | 0 (0.0%) | 0 (0.0%) |
Technology Access in Ridge Spring
Computing Device Access in Ridge Spring
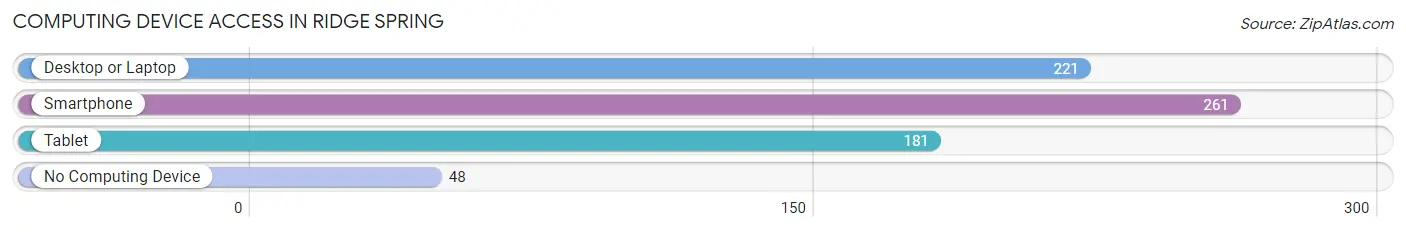
| Device Type | # Households | % Households |
| Desktop or Laptop | 221 | 67.6% |
| Smartphone | 261 | 79.8% |
| Tablet | 181 | 55.3% |
| No Computing Device | 48 | 14.7% |
| Total | 327 | 100.0% |
Internet Access in Ridge Spring
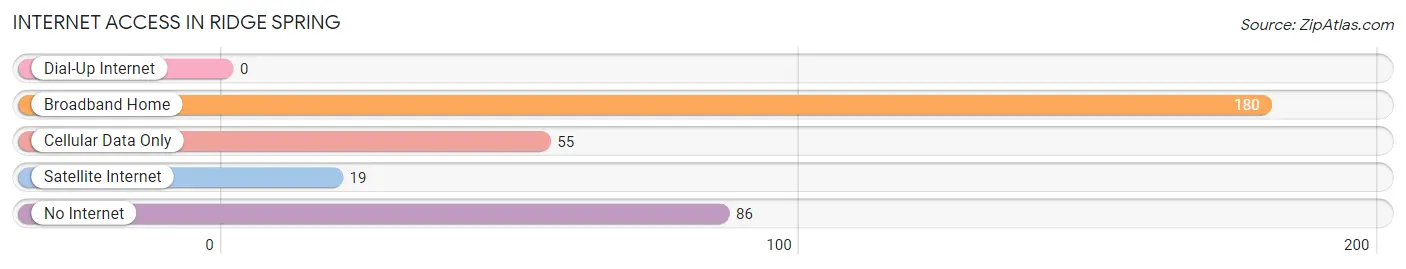
| Internet Type | # Households | % Households |
| Dial-Up Internet | 0 | 0.0% |
| Broadband Home | 180 | 55.0% |
| Cellular Data Only | 55 | 16.8% |
| Satellite Internet | 19 | 5.8% |
| No Internet | 86 | 26.3% |
| Total | 327 | 100.0% |
Ridge Spring Summary
Ridge Spring is a small town located in Saluda County, South Carolina. It is situated in the foothills of the Blue Ridge Mountains, approximately 25 miles northwest of Aiken, South Carolina. The town is home to approximately 1,000 people and is known for its rural charm and friendly atmosphere.
Geography
Ridge Spring is located in the Piedmont region of South Carolina, which is characterized by rolling hills and valleys. The town is situated in the foothills of the Blue Ridge Mountains, approximately 25 miles northwest of Aiken, South Carolina. The town is located on the banks of the Saluda River, which is a tributary of the Savannah River. The town is surrounded by farmland and is home to several small lakes and ponds.
Climate
Ridge Spring has a humid subtropical climate, with hot, humid summers and mild winters. The average annual temperature is around 70 degrees Fahrenheit, with temperatures reaching as high as 95 degrees in the summer and as low as 20 degrees in the winter. The town receives an average of 48 inches of precipitation per year, with most of it falling in the form of rain.
Demographics
As of the 2010 census, the population of Ridge Spring was 1,039. The racial makeup of the town was 79.3% White, 17.7% African American, 0.3% Native American, 0.7% Asian, 0.1% Pacific Islander, and 1.7% from other races. The median household income was $30,938, and the median family income was $37,917.
Economy
Ridge Spring is a small, rural town with a primarily agricultural economy. The town is home to several farms, which produce a variety of crops, including corn, soybeans, cotton, and tobacco. The town is also home to several small businesses, including a grocery store, a hardware store, and a few restaurants.
The town is also home to several manufacturing companies, including a furniture factory and a textile mill. The town is also home to several small businesses, including a gas station, a convenience store, and a few restaurants.
History
Ridge Spring was founded in 1820 by a group of settlers from North Carolina. The town was originally known as “Ridge”, but the name was changed to “Ridge Spring” in 1835. The town was named after the nearby spring, which was a popular spot for travelers and settlers.
The town grew slowly over the years, and by the late 19th century, it had become a thriving agricultural center. The town was home to several cotton mills, which provided employment for many of the town’s residents. The town also had several stores, churches, and a post office.
In the early 20th century, the town began to decline as the cotton industry moved away from the area. The town’s population began to decline, and by the 1950s, the town had become a small, rural community.
Today, Ridge Spring is a small, rural town with a population of approximately 1,000 people. The town is known for its rural charm and friendly atmosphere. The town is home to several small businesses, including a grocery store, a hardware store, and a few restaurants. The town is also home to several manufacturing companies, including a furniture factory and a textile mill.
Common Questions
What is Per Capita Income in Ridge Spring?
Per Capita income in Ridge Spring is $36,338.
What is the Median Family Income in Ridge Spring?
Median Family Income in Ridge Spring is $73,333.
What is the Median Household income in Ridge Spring?
Median Household Income in Ridge Spring is $37,969.
What is Income or Wage Gap in Ridge Spring?
Income or Wage Gap in Ridge Spring is 17.3%.
Women in Ridge Spring earn 82.7 cents for every dollar earned by a man.
What is Inequality or Gini Index in Ridge Spring?
Inequality or Gini Index in Ridge Spring is 0.56.
What is the Total Population of Ridge Spring?
Total Population of Ridge Spring is 720.
What is the Total Male Population of Ridge Spring?
Total Male Population of Ridge Spring is 301.
What is the Total Female Population of Ridge Spring?
Total Female Population of Ridge Spring is 419.
What is the Ratio of Males per 100 Females in Ridge Spring?
There are 71.84 Males per 100 Females in Ridge Spring.
What is the Ratio of Females per 100 Males in Ridge Spring?
There are 139.20 Females per 100 Males in Ridge Spring.
What is the Median Population Age in Ridge Spring?
Median Population Age in Ridge Spring is 44.3 Years.
What is the Average Family Size in Ridge Spring
Average Family Size in Ridge Spring is 3.3 People.
What is the Average Household Size in Ridge Spring
Average Household Size in Ridge Spring is 2.2 People.
How Large is the Labor Force in Ridge Spring?
There are 342 People in the Labor Forcein in Ridge Spring.
What is the Percentage of People in the Labor Force in Ridge Spring?
54.2% of People are in the Labor Force in Ridge Spring.
What is the Unemployment Rate in Ridge Spring?
Unemployment Rate in Ridge Spring is 1.5%.