Reevesville, SC Map & Demographics
Reevesville Map
Reevesville Overview
$22,406
PER CAPITA INCOME
$70,417
AVG FAMILY INCOME
$57,031
AVG HOUSEHOLD INCOME
47.2%
WAGE / INCOME GAP [ % ]
52.8¢/ $1
WAGE / INCOME GAP [ $ ]
0.35
INEQUALITY / GINI INDEX
272
TOTAL POPULATION
136
MALE POPULATION
136
FEMALE POPULATION
100.00
MALES / 100 FEMALES
100.00
FEMALES / 100 MALES
41.1
MEDIAN AGE
2.8
AVG FAMILY SIZE
2.5
AVG HOUSEHOLD SIZE
119
LABOR FORCE [ PEOPLE ]
57.8%
PERCENT IN LABOR FORCE
2.5%
UNEMPLOYMENT RATE
Reevesville Zip Codes
Reevesville Area Codes
Income in Reevesville
Income Overview in Reevesville
Per Capita Income in Reevesville is $22,406, while median incomes of families and households are $70,417 and $57,031 respectively.
| Characteristic | Number | Measure |
| Per Capita Income | 272 | $22,406 |
| Median Family Income | 83 | $70,417 |
| Mean Family Income | 83 | $72,172 |
| Median Household Income | 107 | $57,031 |
| Mean Household Income | 107 | $66,415 |
| Income Deficit | 83 | $0 |
| Wage / Income Gap (%) | 272 | 47.17% |
| Wage / Income Gap ($) | 272 | 52.83¢ per $1 |
| Gini / Inequality Index | 272 | 0.35 |
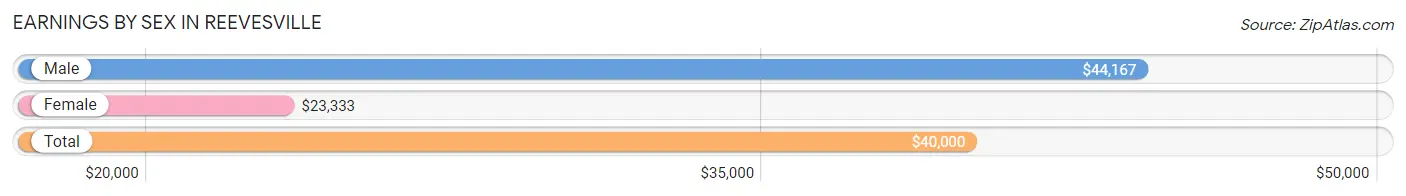
Earnings by Sex in Reevesville
Average Earnings in Reevesville are $40,000, $44,167 for men and $23,333 for women, a difference of 47.2%.
| Sex | Number | Average Earnings |
| Male | 54 (45.8%) | $44,167 |
| Female | 64 (54.2%) | $23,333 |
| Total | 118 (100.0%) | $40,000 |
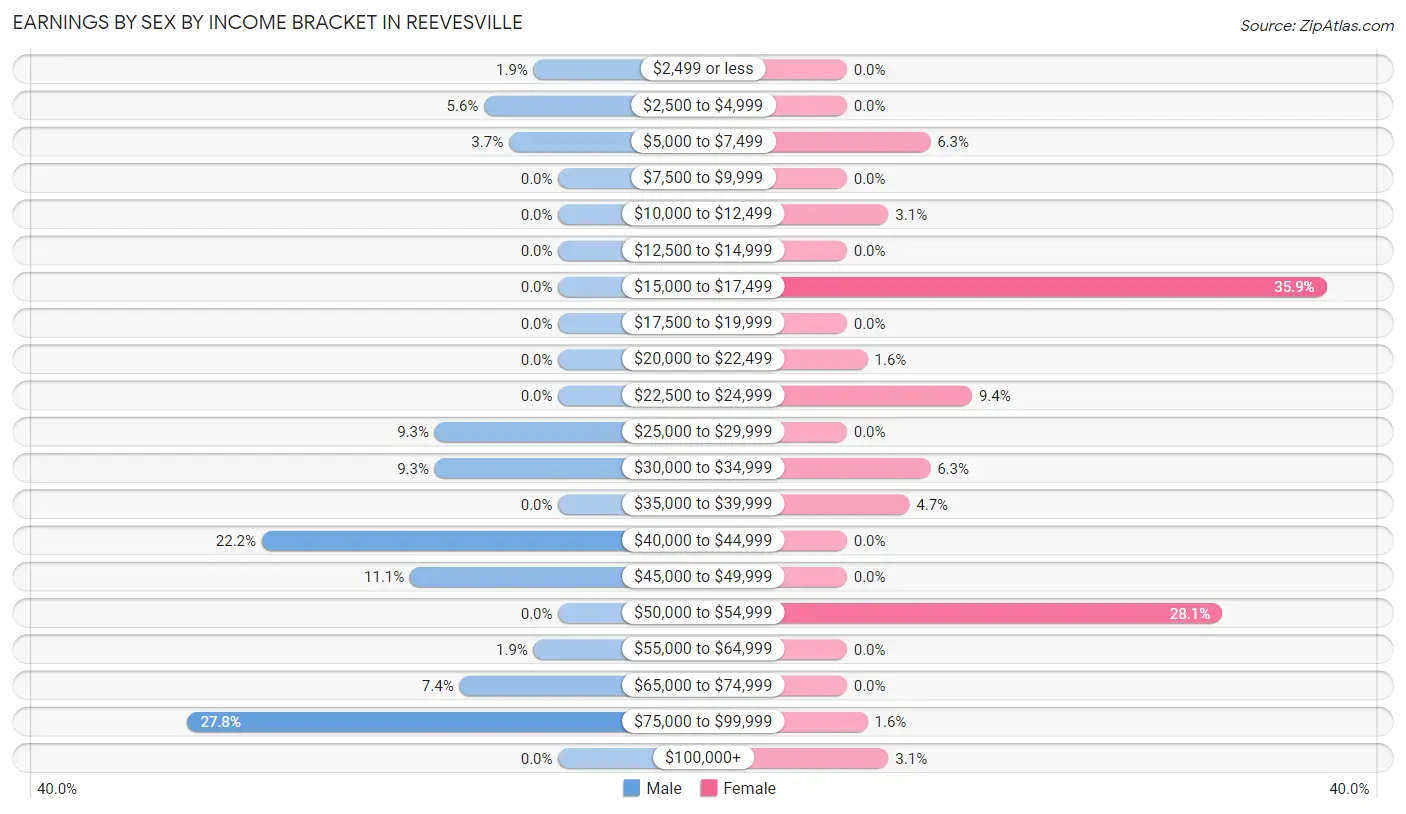
Earnings by Sex by Income Bracket in Reevesville
The most common earnings brackets in Reevesville are $75,000 to $99,999 for men (15 | 27.8%) and $15,000 to $17,499 for women (23 | 35.9%).
| Income | Male | Female |
| $2,499 or less | 1 (1.8%) | 0 (0.0%) |
| $2,500 to $4,999 | 3 (5.6%) | 0 (0.0%) |
| $5,000 to $7,499 | 2 (3.7%) | 4 (6.2%) |
| $7,500 to $9,999 | 0 (0.0%) | 0 (0.0%) |
| $10,000 to $12,499 | 0 (0.0%) | 2 (3.1%) |
| $12,500 to $14,999 | 0 (0.0%) | 0 (0.0%) |
| $15,000 to $17,499 | 0 (0.0%) | 23 (35.9%) |
| $17,500 to $19,999 | 0 (0.0%) | 0 (0.0%) |
| $20,000 to $22,499 | 0 (0.0%) | 1 (1.6%) |
| $22,500 to $24,999 | 0 (0.0%) | 6 (9.4%) |
| $25,000 to $29,999 | 5 (9.3%) | 0 (0.0%) |
| $30,000 to $34,999 | 5 (9.3%) | 4 (6.2%) |
| $35,000 to $39,999 | 0 (0.0%) | 3 (4.7%) |
| $40,000 to $44,999 | 12 (22.2%) | 0 (0.0%) |
| $45,000 to $49,999 | 6 (11.1%) | 0 (0.0%) |
| $50,000 to $54,999 | 0 (0.0%) | 18 (28.1%) |
| $55,000 to $64,999 | 1 (1.8%) | 0 (0.0%) |
| $65,000 to $74,999 | 4 (7.4%) | 0 (0.0%) |
| $75,000 to $99,999 | 15 (27.8%) | 1 (1.6%) |
| $100,000+ | 0 (0.0%) | 2 (3.1%) |
| Total | 54 (100.0%) | 64 (100.0%) |
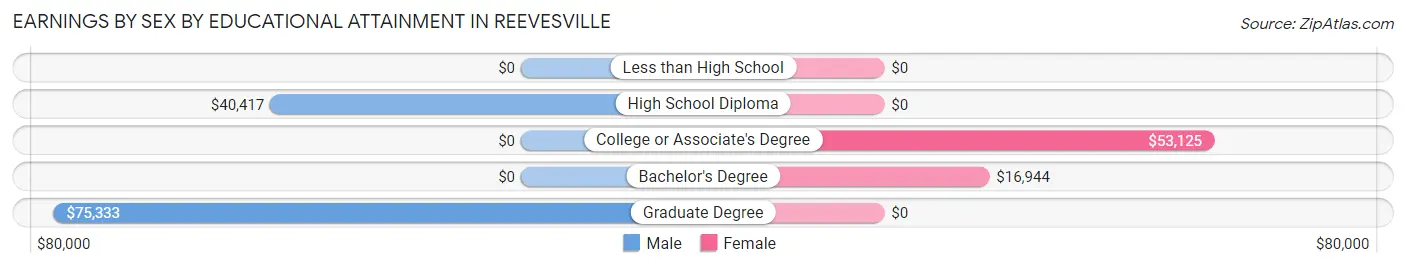
Earnings by Sex by Educational Attainment in Reevesville
Average earnings in Reevesville are $45,250 for men and $30,417 for women, a difference of 32.8%. Men with an educational attainment of graduate degree enjoy the highest average annual earnings of $75,333, while those with high school diploma education earn the least with $40,417. Women with an educational attainment of college or associate's degree earn the most with the average annual earnings of $53,125, while those with bachelor's degree education have the smallest earnings of $16,944.
| Educational Attainment | Male Income | Female Income |
| Less than High School | - | - |
| High School Diploma | $40,417 | $0 |
| College or Associate's Degree | - | - |
| Bachelor's Degree | - | - |
| Graduate Degree | $75,333 | $0 |
| Total | $45,250 | $30,417 |
Family Income in Reevesville
Family Income Brackets in Reevesville
According to the Reevesville family income data, there are 32 families falling into the $100,000 to $149,999 income range, which is the most common income bracket and makes up 38.6% of all families.
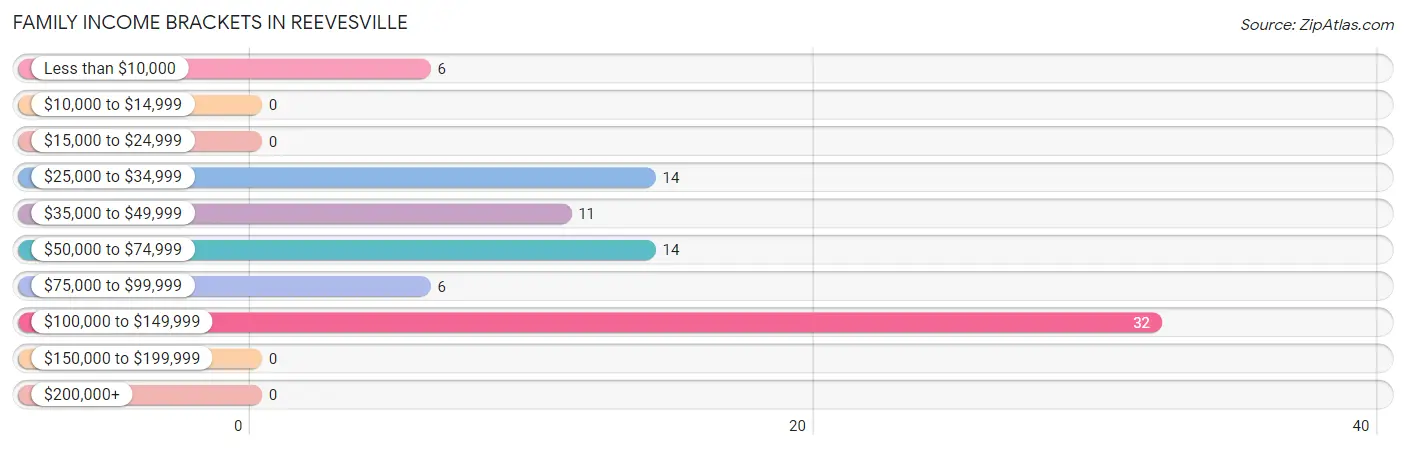
| Income Bracket | # Families | % Families |
| Less than $10,000 | 6 | 7.2% |
| $10,000 to $14,999 | 0 | 0.0% |
| $15,000 to $24,999 | 0 | 0.0% |
| $25,000 to $34,999 | 14 | 16.9% |
| $35,000 to $49,999 | 11 | 13.3% |
| $50,000 to $74,999 | 14 | 16.9% |
| $75,000 to $99,999 | 6 | 7.2% |
| $100,000 to $149,999 | 32 | 38.6% |
| $150,000 to $199,999 | 0 | 0.0% |
| $200,000+ | 0 | 0.0% |
Family Income by Famaliy Size in Reevesville
4-person families (27 | 32.5%) account for the highest median family income in Reevesville with $130,089 per family, while 4-person families (27 | 32.5%) have the highest median income of $32,522 per family member.
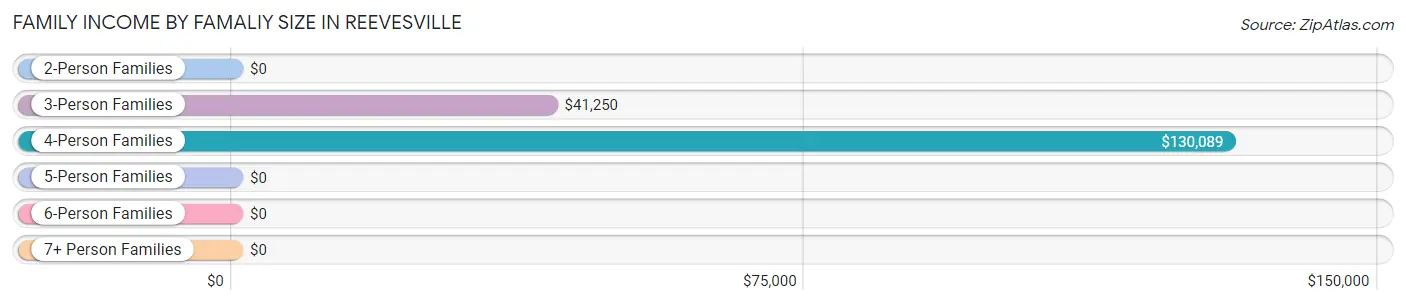
| Income Bracket | # Families | Median Income |
| 2-Person Families | 45 (54.2%) | $0 |
| 3-Person Families | 4 (4.8%) | $41,250 |
| 4-Person Families | 27 (32.5%) | $130,089 |
| 5-Person Families | 0 (0.0%) | $0 |
| 6-Person Families | 5 (6.0%) | $0 |
| 7+ Person Families | 2 (2.4%) | $0 |
| Total | 83 (100.0%) | $70,417 |
Family Income by Number of Earners in Reevesville
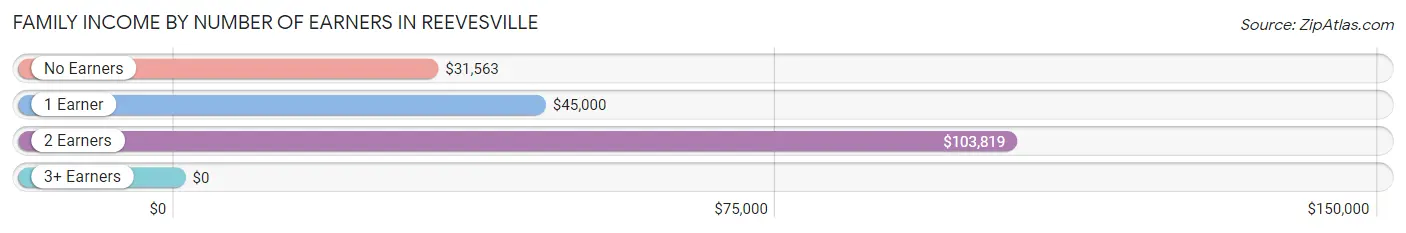
| Number of Earners | # Families | Median Income |
| No Earners | 22 (26.5%) | $31,563 |
| 1 Earner | 16 (19.3%) | $45,000 |
| 2 Earners | 45 (54.2%) | $103,819 |
| 3+ Earners | 0 (0.0%) | $0 |
| Total | 83 (100.0%) | $70,417 |
Household Income in Reevesville
Household Income Brackets in Reevesville
With 32 households falling in the category, the $100,000 to $149,999 income range is the most frequent in Reevesville, accounting for 29.9% of all households.
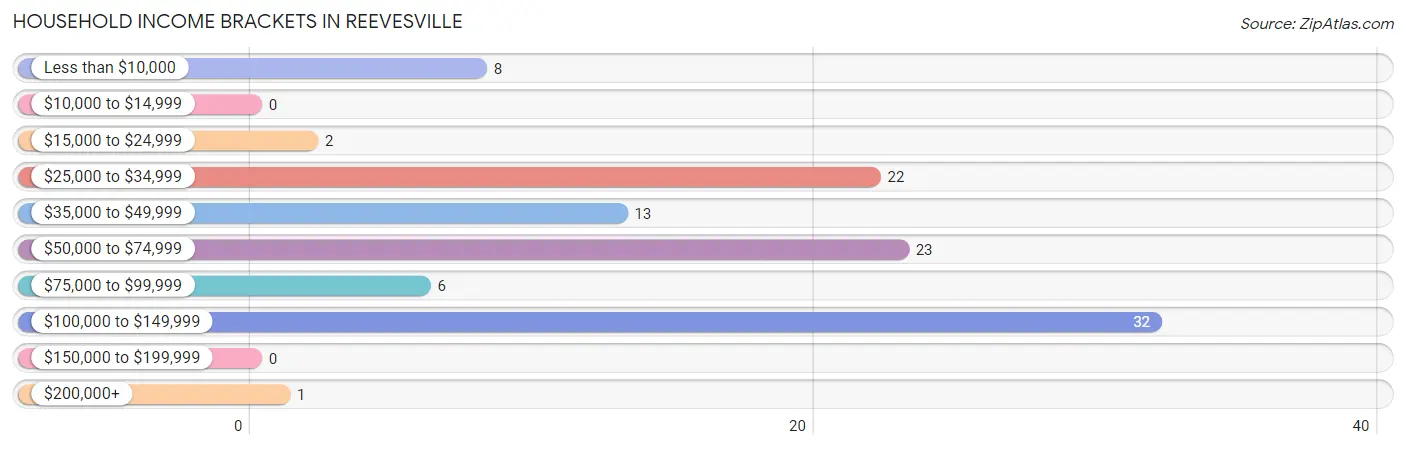
| Income Bracket | # Households | % Households |
| Less than $10,000 | 8 | 7.5% |
| $10,000 to $14,999 | 0 | 0.0% |
| $15,000 to $24,999 | 2 | 1.9% |
| $25,000 to $34,999 | 22 | 20.6% |
| $35,000 to $49,999 | 13 | 12.1% |
| $50,000 to $74,999 | 23 | 21.5% |
| $75,000 to $99,999 | 6 | 5.6% |
| $100,000 to $149,999 | 32 | 29.9% |
| $150,000 to $199,999 | 0 | 0.0% |
| $200,000+ | 1 | 0.9% |
Household Income by Householder Age in Reevesville
The median household income in Reevesville is $57,031, with the highest median household income of $103,125 found in the 45 to 64 years age bracket for the primary householder. A total of 27 households (25.2%) fall into this category. Meanwhile, the 15 to 24 years age bracket for the primary householder has the lowest median household income of $0, with 4 households (3.7%) in this group.
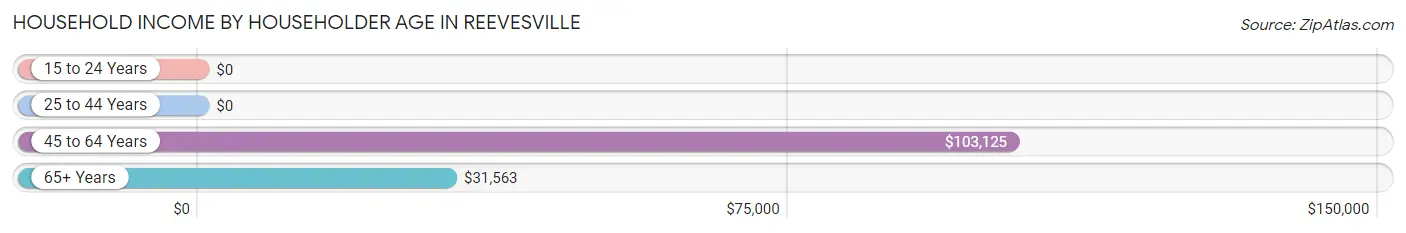
| Income Bracket | # Households | Median Income |
| 15 to 24 Years | 4 (3.7%) | $0 |
| 25 to 44 Years | 34 (31.8%) | $0 |
| 45 to 64 Years | 27 (25.2%) | $103,125 |
| 65+ Years | 42 (39.3%) | $31,563 |
| Total | 107 (100.0%) | $57,031 |
Poverty in Reevesville
Income Below Poverty by Sex and Age in Reevesville
With 7.3% poverty level for males and 12.5% for females among the residents of Reevesville, 55 to 64 year old males and 25 to 34 year old females are the most vulnerable to poverty, with 2 males (66.7%) and 3 females (75.0%) in their respective age groups living below the poverty level.
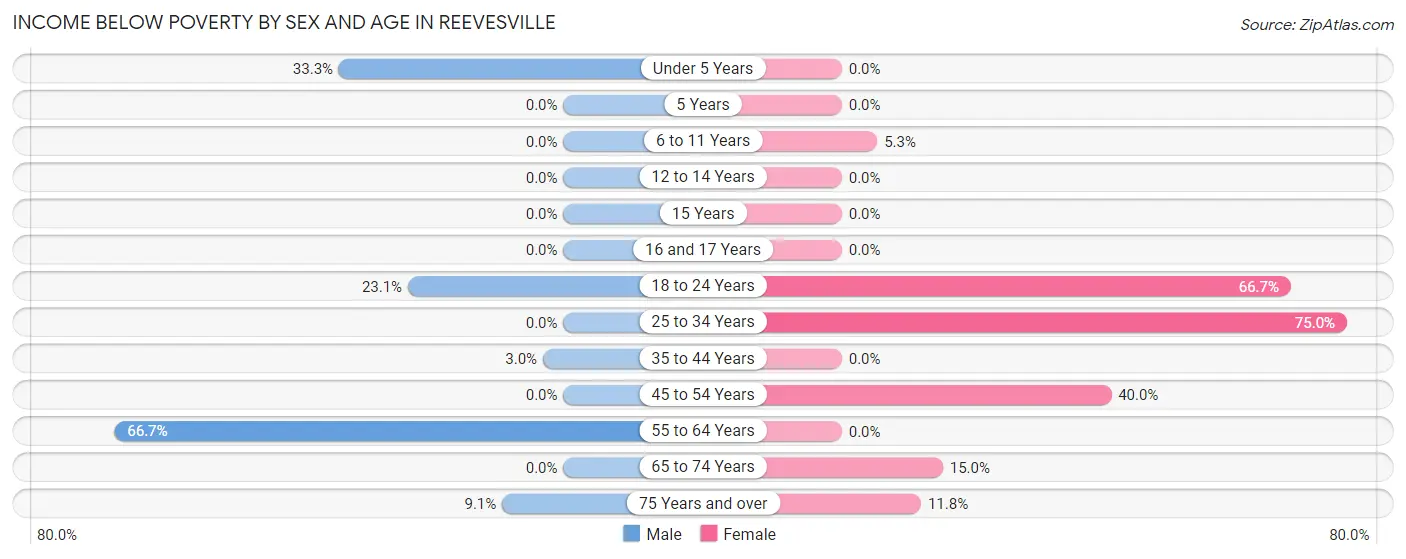
| Age Bracket | Male | Female |
| Under 5 Years | 2 (33.3%) | 0 (0.0%) |
| 5 Years | 0 (0.0%) | 0 (0.0%) |
| 6 to 11 Years | 0 (0.0%) | 1 (5.3%) |
| 12 to 14 Years | 0 (0.0%) | 0 (0.0%) |
| 15 Years | 0 (0.0%) | 0 (0.0%) |
| 16 and 17 Years | 0 (0.0%) | 0 (0.0%) |
| 18 to 24 Years | 3 (23.1%) | 6 (66.7%) |
| 25 to 34 Years | 0 (0.0%) | 3 (75.0%) |
| 35 to 44 Years | 1 (3.0%) | 0 (0.0%) |
| 45 to 54 Years | 0 (0.0%) | 2 (40.0%) |
| 55 to 64 Years | 2 (66.7%) | 0 (0.0%) |
| 65 to 74 Years | 0 (0.0%) | 3 (15.0%) |
| 75 Years and over | 2 (9.1%) | 2 (11.8%) |
| Total | 10 (7.3%) | 17 (12.5%) |
Income Above Poverty by Sex and Age in Reevesville
According to the poverty statistics in Reevesville, males aged 5 years and females aged under 5 years are the age groups that are most secure financially, with 100.0% of males and 100.0% of females in these age groups living above the poverty line.
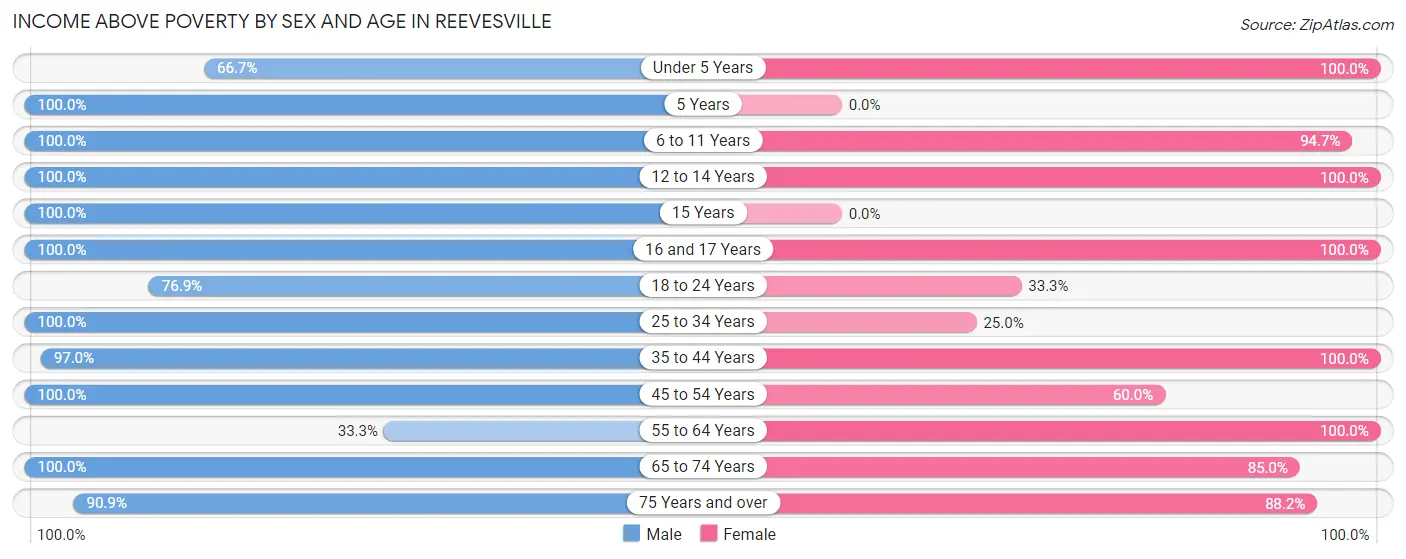
| Age Bracket | Male | Female |
| Under 5 Years | 4 (66.7%) | 4 (100.0%) |
| 5 Years | 3 (100.0%) | 0 (0.0%) |
| 6 to 11 Years | 23 (100.0%) | 18 (94.7%) |
| 12 to 14 Years | 9 (100.0%) | 1 (100.0%) |
| 15 Years | 1 (100.0%) | 0 (0.0%) |
| 16 and 17 Years | 2 (100.0%) | 1 (100.0%) |
| 18 to 24 Years | 10 (76.9%) | 3 (33.3%) |
| 25 to 34 Years | 9 (100.0%) | 1 (25.0%) |
| 35 to 44 Years | 32 (97.0%) | 33 (100.0%) |
| 45 to 54 Years | 2 (100.0%) | 3 (60.0%) |
| 55 to 64 Years | 1 (33.3%) | 23 (100.0%) |
| 65 to 74 Years | 10 (100.0%) | 17 (85.0%) |
| 75 Years and over | 20 (90.9%) | 15 (88.2%) |
| Total | 126 (92.6%) | 119 (87.5%) |
Income Below Poverty Among Married-Couple Families in Reevesville
The poverty statistics for married-couple families in Reevesville show that 2.6% or 2 of the total 76 families live below the poverty line. Families with 1 or 2 children have the highest poverty rate of 6.9%, comprising of 2 families. On the other hand, families with no children have the lowest poverty rate of 0.0%, which includes 0 families.
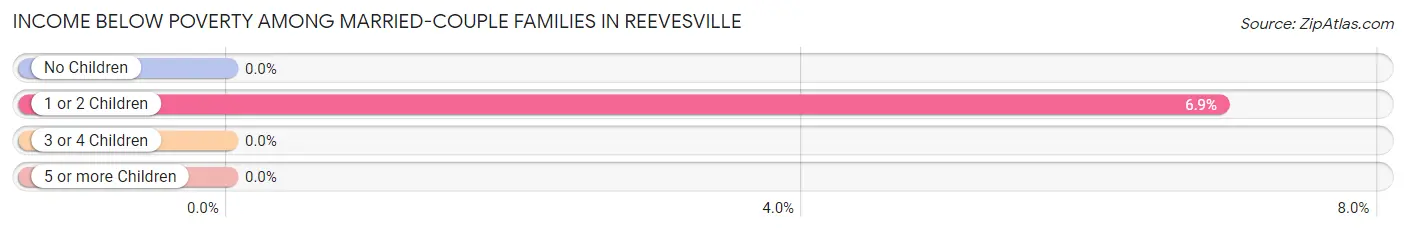
| Children | Above Poverty | Below Poverty |
| No Children | 40 (100.0%) | 0 (0.0%) |
| 1 or 2 Children | 27 (93.1%) | 2 (6.9%) |
| 3 or 4 Children | 5 (100.0%) | 0 (0.0%) |
| 5 or more Children | 2 (100.0%) | 0 (0.0%) |
| Total | 74 (97.4%) | 2 (2.6%) |
Income Below Poverty Among Single-Parent Households in Reevesville
According to the poverty data in Reevesville, 100.0% or 1 single-father households and 50.0% or 3 single-mother households are living below the poverty line. Among single-father households, those with no children have the highest poverty rate, with 1 households (100.0%) experiencing poverty. Likewise, among single-mother households, those with no children have the highest poverty rate, with 3 households (50.0%) falling below the poverty line.
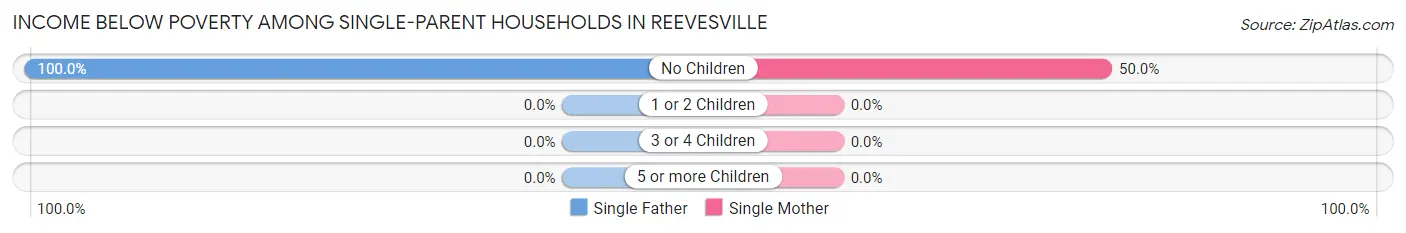
| Children | Single Father | Single Mother |
| No Children | 1 (100.0%) | 3 (50.0%) |
| 1 or 2 Children | 0 (0.0%) | 0 (0.0%) |
| 3 or 4 Children | 0 (0.0%) | 0 (0.0%) |
| 5 or more Children | 0 (0.0%) | 0 (0.0%) |
| Total | 1 (100.0%) | 3 (50.0%) |
Income Below Poverty Among Married-Couple vs Single-Parent Households in Reevesville
The poverty data for Reevesville shows that 2 of the married-couple family households (2.6%) and 4 of the single-parent households (57.1%) are living below the poverty level. Within the married-couple family households, those with 1 or 2 children have the highest poverty rate, with 2 households (6.9%) falling below the poverty line. Among the single-parent households, those with no children have the highest poverty rate, with 4 household (57.1%) living below poverty.
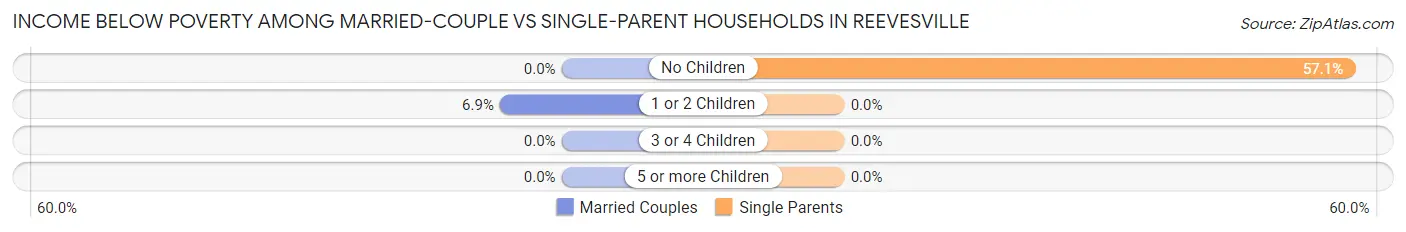
| Children | Married-Couple Families | Single-Parent Households |
| No Children | 0 (0.0%) | 4 (57.1%) |
| 1 or 2 Children | 2 (6.9%) | 0 (0.0%) |
| 3 or 4 Children | 0 (0.0%) | 0 (0.0%) |
| 5 or more Children | 0 (0.0%) | 0 (0.0%) |
| Total | 2 (2.6%) | 4 (57.1%) |
Race in Reevesville
The most populous races in Reevesville are White / Caucasian (187 | 68.8%), Black / African American (84 | 30.9%), and Hispanic or Latino (1 | 0.4%).
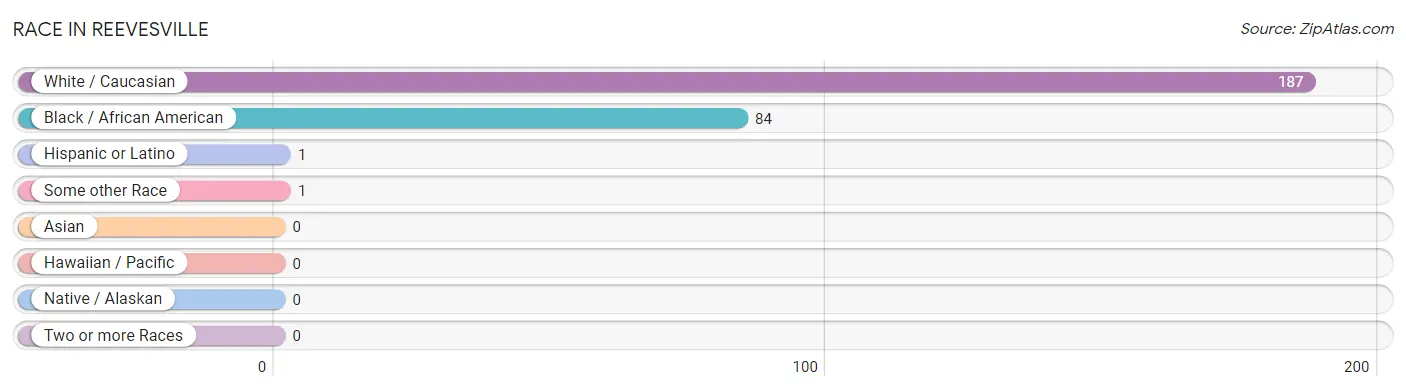
| Race | # Population | % Population |
| Asian | 0 | 0.0% |
| Black / African American | 84 | 30.9% |
| Hawaiian / Pacific | 0 | 0.0% |
| Hispanic or Latino | 1 | 0.4% |
| Native / Alaskan | 0 | 0.0% |
| White / Caucasian | 187 | 68.8% |
| Two or more Races | 0 | 0.0% |
| Some other Race | 1 | 0.4% |
| Total | 272 | 100.0% |
Ancestry in Reevesville
The most populous ancestries reported in Reevesville are English (78 | 28.7%), Scottish (9 | 3.3%), American (4 | 1.5%), European (4 | 1.5%), and French Canadian (3 | 1.1%), together accounting for 36.0% of all Reevesville residents.
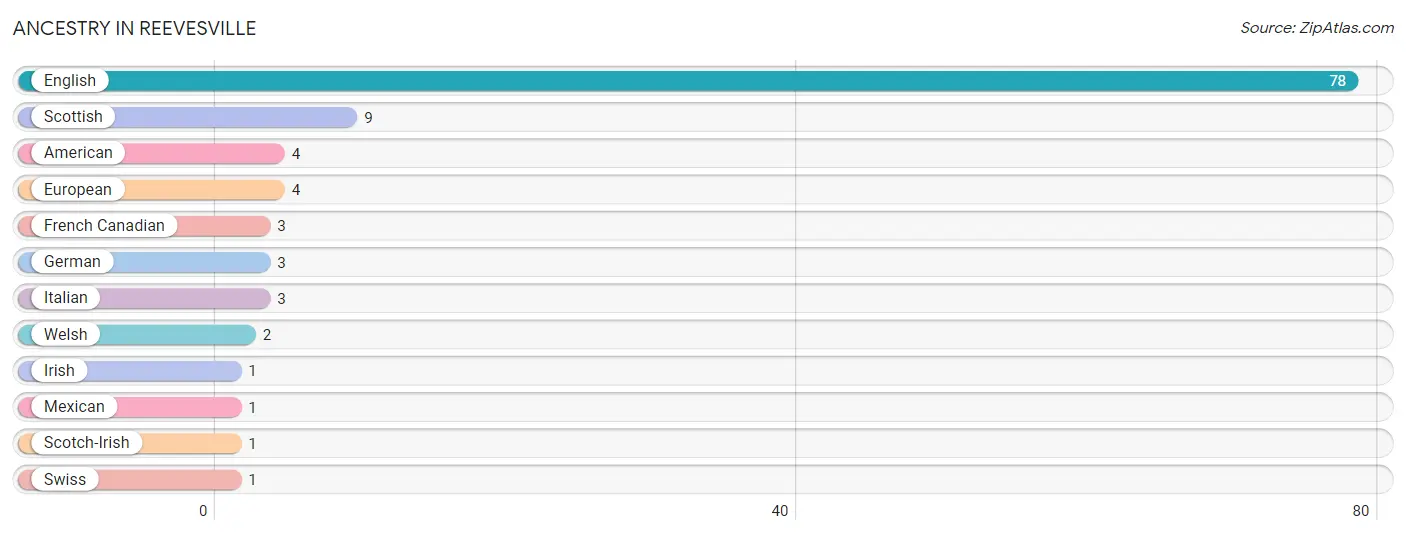
| Ancestry | # Population | % Population |
| American | 4 | 1.5% |
| English | 78 | 28.7% |
| European | 4 | 1.5% |
| French Canadian | 3 | 1.1% |
| German | 3 | 1.1% |
| Irish | 1 | 0.4% |
| Italian | 3 | 1.1% |
| Mexican | 1 | 0.4% |
| Scotch-Irish | 1 | 0.4% |
| Scottish | 9 | 3.3% |
| Swiss | 1 | 0.4% |
| Welsh | 2 | 0.7% | View All 12 Rows |
Immigrants in Reevesville

| Immigration Origin | # Population | % Population | View All 0 Rows |
Sex and Age in Reevesville
Sex and Age in Reevesville
The most populous age groups in Reevesville are 10 to 14 Years (24 | 17.6%) for men and 40 to 44 Years (19 | 14.0%) for women.
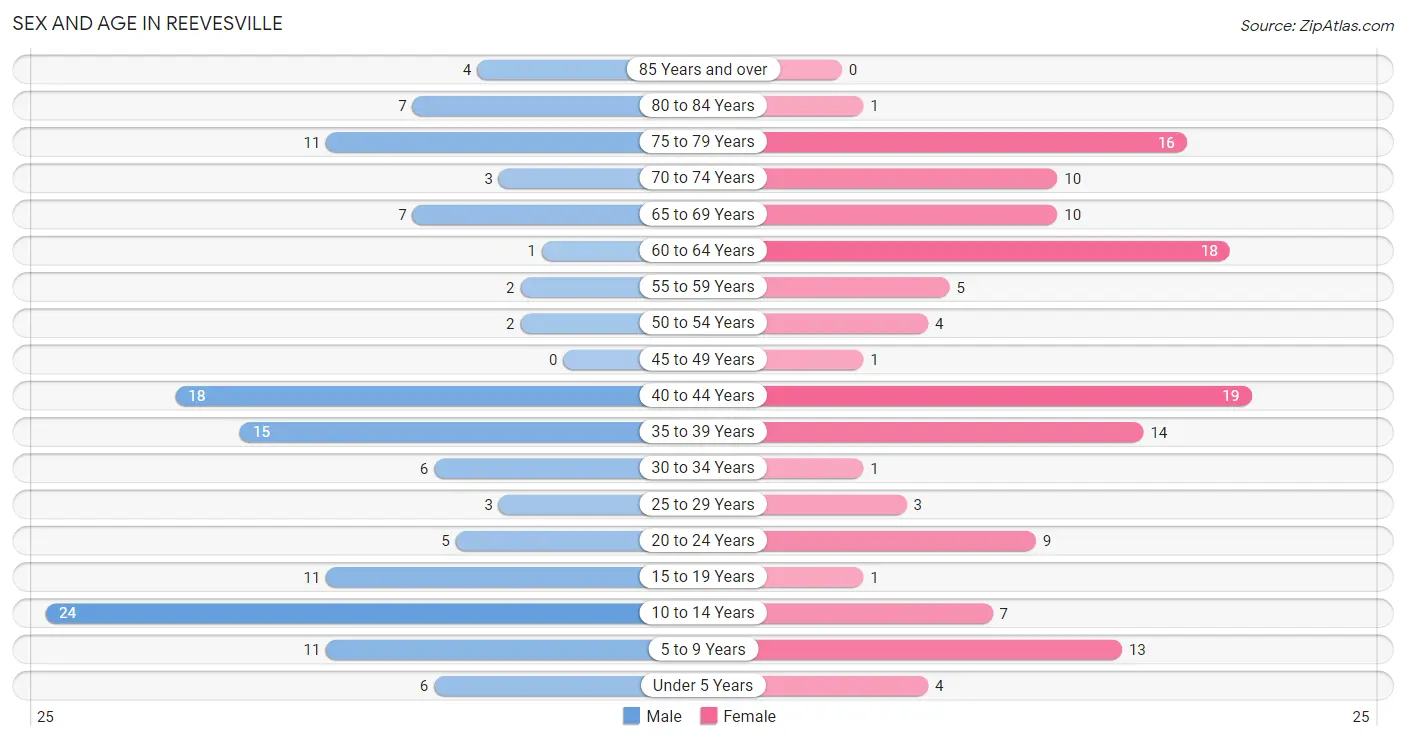
| Age Bracket | Male | Female |
| Under 5 Years | 6 (4.4%) | 4 (2.9%) |
| 5 to 9 Years | 11 (8.1%) | 13 (9.6%) |
| 10 to 14 Years | 24 (17.6%) | 7 (5.1%) |
| 15 to 19 Years | 11 (8.1%) | 1 (0.7%) |
| 20 to 24 Years | 5 (3.7%) | 9 (6.6%) |
| 25 to 29 Years | 3 (2.2%) | 3 (2.2%) |
| 30 to 34 Years | 6 (4.4%) | 1 (0.7%) |
| 35 to 39 Years | 15 (11.0%) | 14 (10.3%) |
| 40 to 44 Years | 18 (13.2%) | 19 (14.0%) |
| 45 to 49 Years | 0 (0.0%) | 1 (0.7%) |
| 50 to 54 Years | 2 (1.5%) | 4 (2.9%) |
| 55 to 59 Years | 2 (1.5%) | 5 (3.7%) |
| 60 to 64 Years | 1 (0.7%) | 18 (13.2%) |
| 65 to 69 Years | 7 (5.1%) | 10 (7.3%) |
| 70 to 74 Years | 3 (2.2%) | 10 (7.3%) |
| 75 to 79 Years | 11 (8.1%) | 16 (11.8%) |
| 80 to 84 Years | 7 (5.1%) | 1 (0.7%) |
| 85 Years and over | 4 (2.9%) | 0 (0.0%) |
| Total | 136 (100.0%) | 136 (100.0%) |
Families and Households in Reevesville
Median Family Size in Reevesville
The median family size in Reevesville is 2.84 persons per family, with single male/father families (1 | 1.2%) accounting for the largest median family size of 3 persons per family. On the other hand, single female/mother families (6 | 7.2%) represent the smallest median family size with 2.50 persons per family.
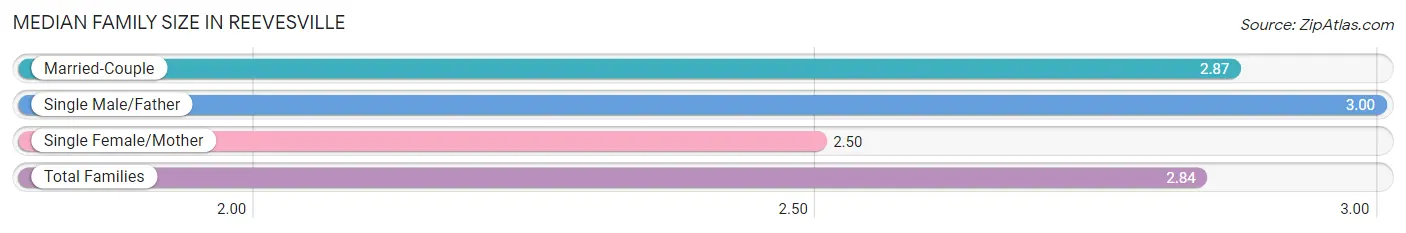
| Family Type | # Families | Family Size |
| Married-Couple | 76 (91.6%) | 2.87 |
| Single Male/Father | 1 (1.2%) | 3.00 |
| Single Female/Mother | 6 (7.2%) | 2.50 |
| Total Families | 83 (100.0%) | 2.84 |
Median Household Size in Reevesville
The median household size in Reevesville is 2.54 persons per household, with single male/father households (1 | 0.9%) accounting for the largest median household size of 3 persons per household. non-family households (24 | 22.4%) represent the smallest median household size with 1.21 persons per household.
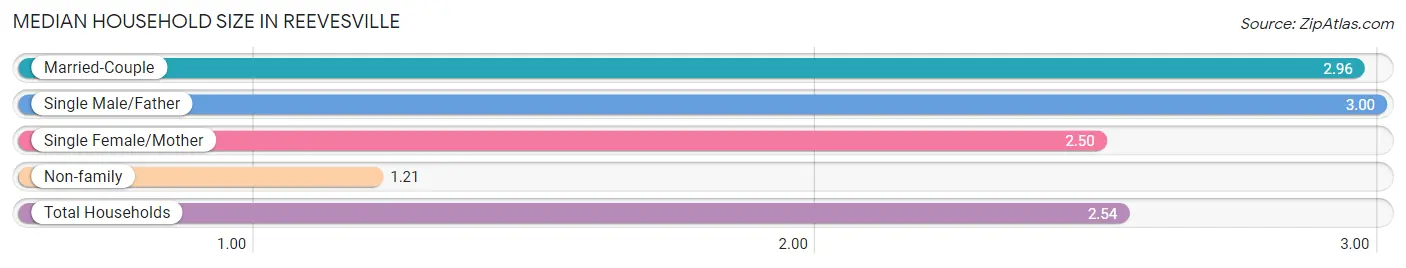
| Household Type | # Households | Household Size |
| Married-Couple | 76 (71.0%) | 2.96 |
| Single Male/Father | 1 (0.9%) | 3.00 |
| Single Female/Mother | 6 (5.6%) | 2.50 |
| Non-family | 24 (22.4%) | 1.21 |
| Total Households | 107 (100.0%) | 2.54 |
Household Size by Marriage Status in Reevesville
Out of a total of 107 households in Reevesville, 83 (77.6%) are family households, while 24 (22.4%) are nonfamily households. The most numerous type of family households are 2-person households, comprising 45, and the most common type of nonfamily households are 1-person households, comprising 21.
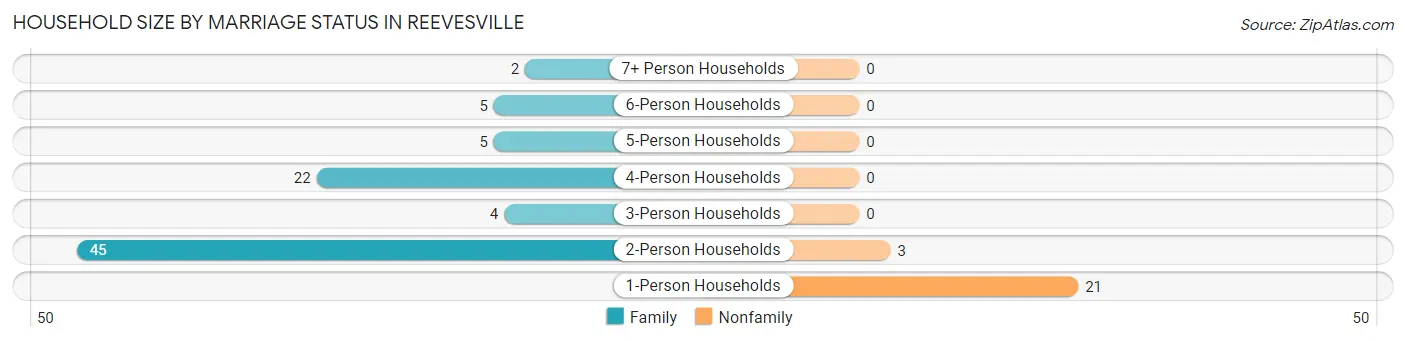
| Household Size | Family Households | Nonfamily Households |
| 1-Person Households | - | 21 (19.6%) |
| 2-Person Households | 45 (42.1%) | 3 (2.8%) |
| 3-Person Households | 4 (3.7%) | 0 (0.0%) |
| 4-Person Households | 22 (20.6%) | 0 (0.0%) |
| 5-Person Households | 5 (4.7%) | 0 (0.0%) |
| 6-Person Households | 5 (4.7%) | 0 (0.0%) |
| 7+ Person Households | 2 (1.9%) | 0 (0.0%) |
| Total | 83 (77.6%) | 24 (22.4%) |
Female Fertility in Reevesville
Fertility by Age in Reevesville
| Age Bracket | Women with Births | Births / 1,000 Women |
| 15 to 19 years | 0 (0.0%) | 0.0 |
| 20 to 34 years | 0 (0.0%) | 0.0 |
| 35 to 50 years | 0 (0.0%) | 0.0 |
| Total | 0 (0.0%) | 0.0 |
Fertility by Age by Marriage Status in Reevesville
| Age Bracket | Married | Unmarried |
| 15 to 19 years | 0 (0.0%) | 0 (0.0%) |
| 20 to 34 years | 0 (0.0%) | 0 (0.0%) |
| 35 to 50 years | 0 (0.0%) | 0 (0.0%) |
| Total | 0 (0.0%) | 0 (0.0%) |
Fertility by Education in Reevesville
| Educational Attainment | Women with Births | Births / 1,000 Women |
| Less than High School | 0 (0.0%) | 0.0 |
| High School Diploma | 0 (0.0%) | 0.0 |
| College or Associate's Degree | 0 (0.0%) | 0.0 |
| Bachelor's Degree | 0 (0.0%) | 0.0 |
| Graduate Degree | 0 (0.0%) | 0.0 |
| Total | 0 (0.0%) | 0.0 |
Fertility by Education by Marriage Status in Reevesville
| Educational Attainment | Married | Unmarried |
| Less than High School | 0 (0.0%) | 0 (0.0%) |
| High School Diploma | 0 (0.0%) | 0 (0.0%) |
| College or Associate's Degree | 0 (0.0%) | 0 (0.0%) |
| Bachelor's Degree | 0 (0.0%) | 0 (0.0%) |
| Graduate Degree | 0 (0.0%) | 0 (0.0%) |
| Total | 0 (0.0%) | 0 (0.0%) |
Employment Characteristics in Reevesville
Employment by Class of Employer in Reevesville
Among the 114 employed individuals in Reevesville, private company employees (73 | 64.0%), local government employees (22 | 19.3%), and not-for-profit organizations (14 | 12.3%) make up the most common classes of employment.
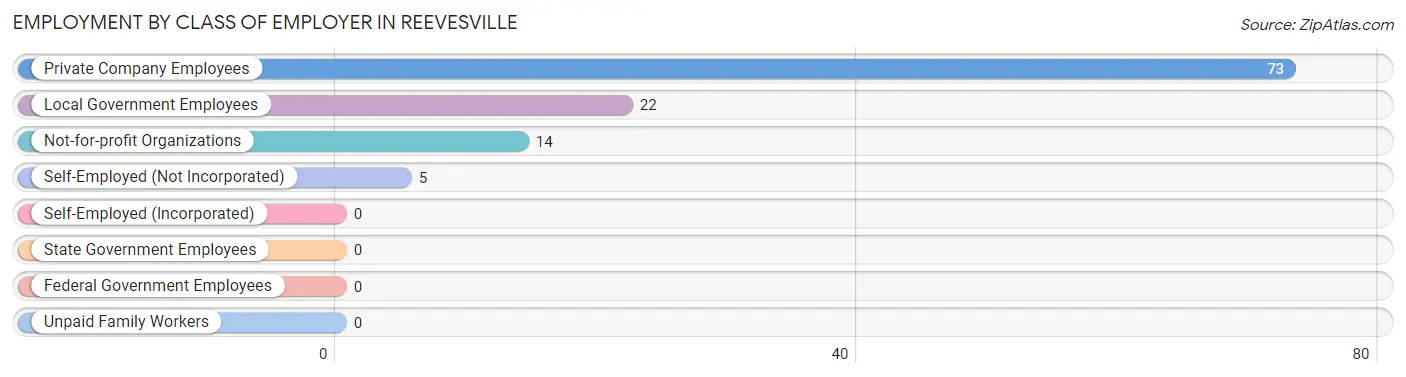
| Employer Class | # Employees | % Employees |
| Private Company Employees | 73 | 64.0% |
| Self-Employed (Incorporated) | 0 | 0.0% |
| Self-Employed (Not Incorporated) | 5 | 4.4% |
| Not-for-profit Organizations | 14 | 12.3% |
| Local Government Employees | 22 | 19.3% |
| State Government Employees | 0 | 0.0% |
| Federal Government Employees | 0 | 0.0% |
| Unpaid Family Workers | 0 | 0.0% |
| Total | 114 | 100.0% |
Employment Status by Age in Reevesville
According to the labor force statistics for Reevesville, out of the total population over 16 years of age (206), 57.8% or 119 individuals are in the labor force, with 2.5% or 3 of them unemployed. The age group with the highest labor force participation rate is 20 to 24 years, with 100.0% or 14 individuals in the labor force. Within the labor force, the 25 to 29 years age range has the highest percentage of unemployed individuals, with 50.0% or 3 of them being unemployed.
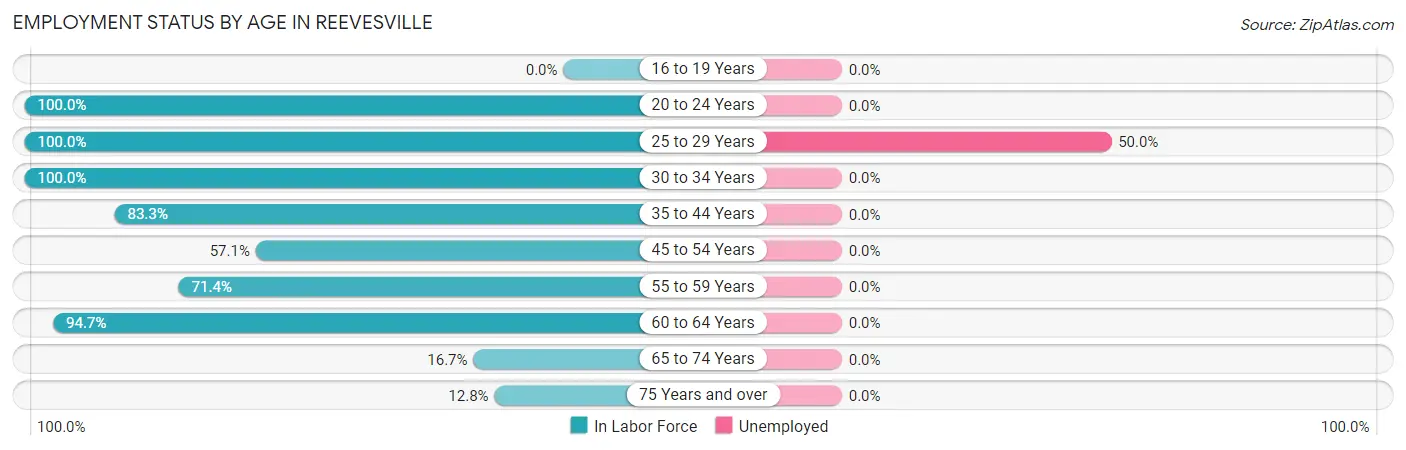
| Age Bracket | In Labor Force | Unemployed |
| 16 to 19 Years | 0 (0.0%) | 0 (0.0%) |
| 20 to 24 Years | 14 (100.0%) | 0 (0.0%) |
| 25 to 29 Years | 6 (100.0%) | 3 (50.0%) |
| 30 to 34 Years | 7 (100.0%) | 0 (0.0%) |
| 35 to 44 Years | 55 (83.3%) | 0 (0.0%) |
| 45 to 54 Years | 4 (57.1%) | 0 (0.0%) |
| 55 to 59 Years | 5 (71.4%) | 0 (0.0%) |
| 60 to 64 Years | 18 (94.7%) | 0 (0.0%) |
| 65 to 74 Years | 5 (16.7%) | 0 (0.0%) |
| 75 Years and over | 5 (12.8%) | 0 (0.0%) |
| Total | 119 (57.8%) | 3 (2.5%) |
Employment Status by Educational Attainment in Reevesville
According to labor force statistics for Reevesville, 84.8% of individuals (95) out of the total population between 25 and 64 years of age (112) are in the labor force, with 3.2% or 3 of them being unemployed. The group with the highest labor force participation rate are those with the educational attainment of bachelor's degree or higher, with 87.3% or 55 individuals in the labor force. Within the labor force, individuals with high school diploma education have the highest percentage of unemployment, with 23.1% or 3 of them being unemployed.
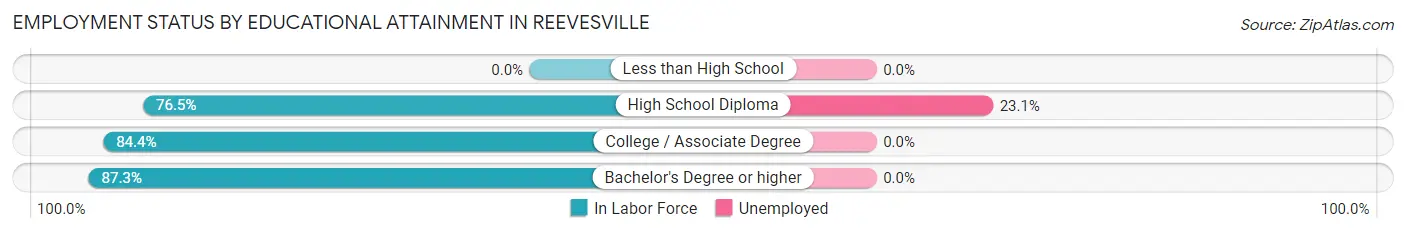
| Educational Attainment | In Labor Force | Unemployed |
| Less than High School | 0 (0.0%) | 0 (0.0%) |
| High School Diploma | 13 (76.5%) | 4 (23.1%) |
| College / Associate Degree | 27 (84.4%) | 0 (0.0%) |
| Bachelor's Degree or higher | 55 (87.3%) | 0 (0.0%) |
| Total | 95 (84.8%) | 4 (3.2%) |
Employment Occupations by Sex in Reevesville
Management, Business, Science and Arts Occupations
The most common Management, Business, Science and Arts occupations in Reevesville are Health Diagnosing & Treating (33 | 28.4%), Community & Social Service (30 | 25.9%), Education Instruction & Library (20 | 17.2%), Health Technologists (19 | 16.4%), and Education, Arts & Media (10 | 8.6%).
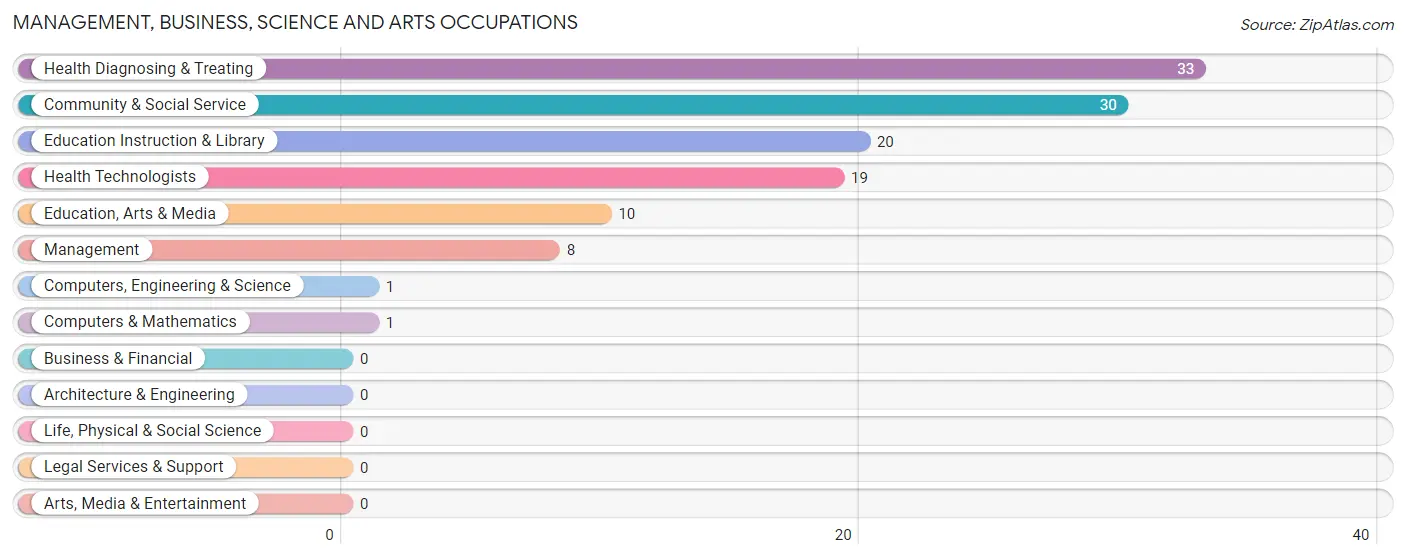
Management, Business, Science and Arts Occupations by Sex
Within the Management, Business, Science and Arts occupations in Reevesville, the most male-oriented occupations are Computers, Engineering & Science (100.0%), Computers & Mathematics (100.0%), and Education, Arts & Media (100.0%), while the most female-oriented occupations are Education Instruction & Library (100.0%), Community & Social Service (66.7%), and Health Diagnosing & Treating (54.5%).
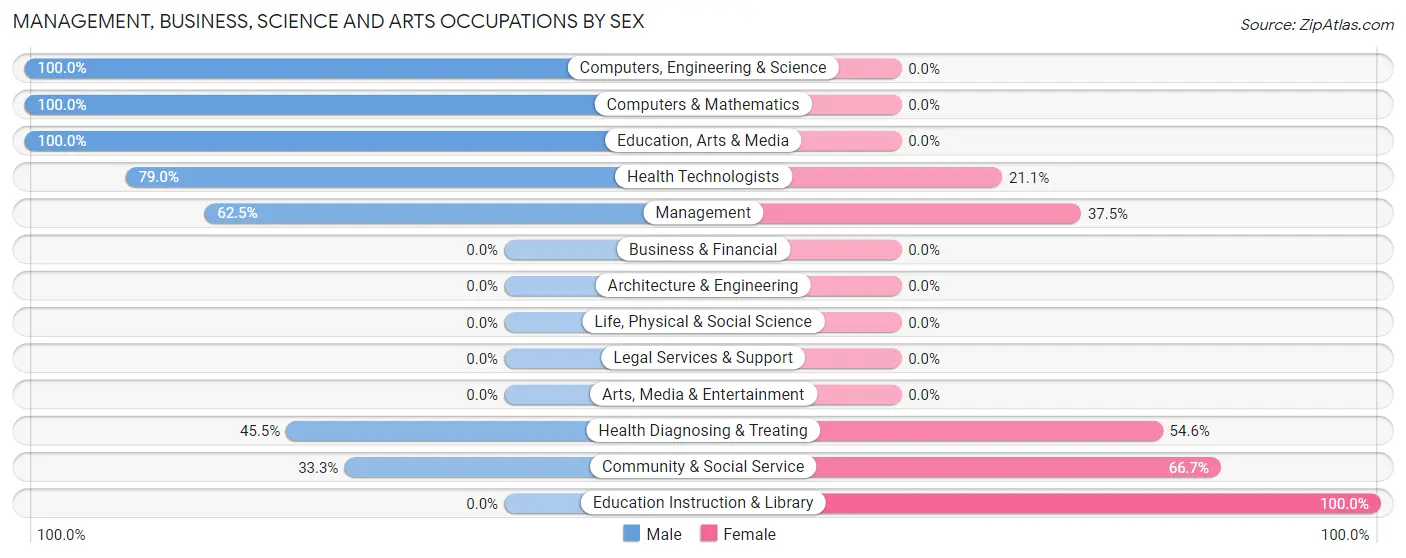
| Occupation | Male | Female |
| Management | 5 (62.5%) | 3 (37.5%) |
| Business & Financial | 0 (0.0%) | 0 (0.0%) |
| Computers, Engineering & Science | 1 (100.0%) | 0 (0.0%) |
| Computers & Mathematics | 1 (100.0%) | 0 (0.0%) |
| Architecture & Engineering | 0 (0.0%) | 0 (0.0%) |
| Life, Physical & Social Science | 0 (0.0%) | 0 (0.0%) |
| Community & Social Service | 10 (33.3%) | 20 (66.7%) |
| Education, Arts & Media | 10 (100.0%) | 0 (0.0%) |
| Legal Services & Support | 0 (0.0%) | 0 (0.0%) |
| Education Instruction & Library | 0 (0.0%) | 20 (100.0%) |
| Arts, Media & Entertainment | 0 (0.0%) | 0 (0.0%) |
| Health Diagnosing & Treating | 15 (45.5%) | 18 (54.5%) |
| Health Technologists | 15 (78.9%) | 4 (21.0%) |
| Total (Category) | 31 (43.1%) | 41 (56.9%) |
| Total (Overall) | 52 (44.8%) | 64 (55.2%) |
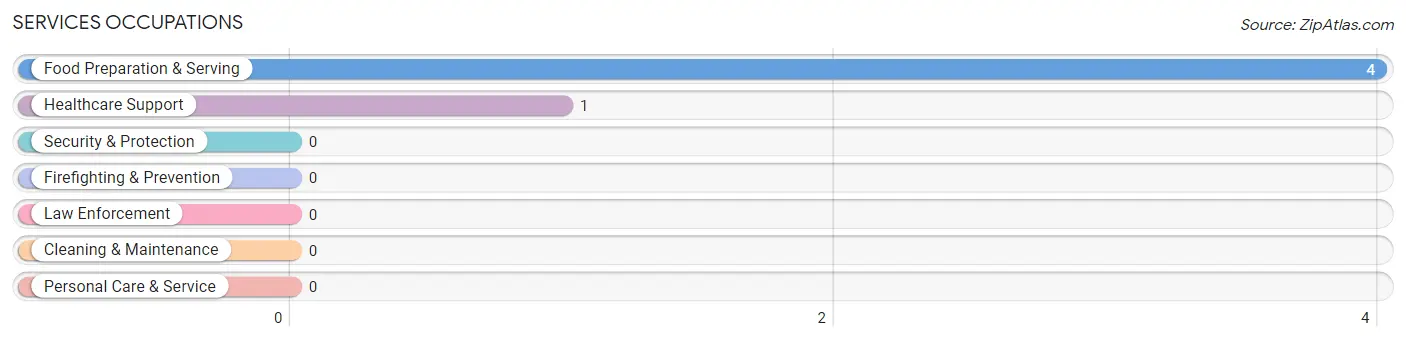
Services Occupations
The most common Services occupations in Reevesville are Food Preparation & Serving (4 | 3.5%), and Healthcare Support (1 | 0.9%).
Services Occupations by Sex
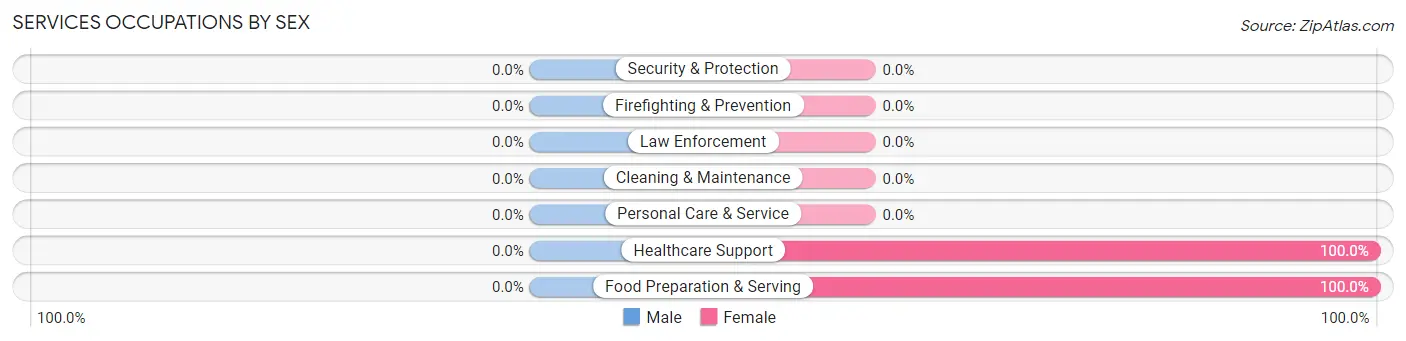
| Occupation | Male | Female |
| Healthcare Support | 0 (0.0%) | 1 (100.0%) |
| Security & Protection | 0 (0.0%) | 0 (0.0%) |
| Firefighting & Prevention | 0 (0.0%) | 0 (0.0%) |
| Law Enforcement | 0 (0.0%) | 0 (0.0%) |
| Food Preparation & Serving | 0 (0.0%) | 4 (100.0%) |
| Cleaning & Maintenance | 0 (0.0%) | 0 (0.0%) |
| Personal Care & Service | 0 (0.0%) | 0 (0.0%) |
| Total (Category) | 0 (0.0%) | 5 (100.0%) |
| Total (Overall) | 52 (44.8%) | 64 (55.2%) |
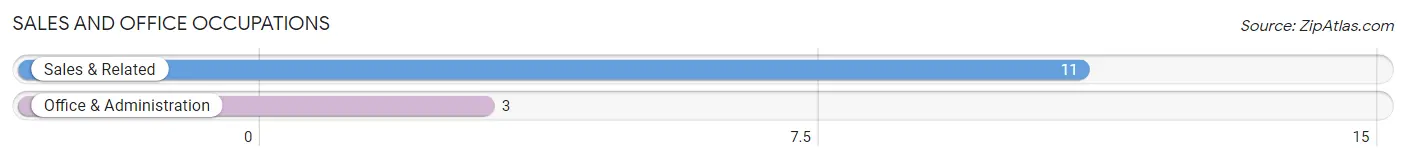
Sales and Office Occupations
The most common Sales and Office occupations in Reevesville are Sales & Related (11 | 9.5%), and Office & Administration (3 | 2.6%).
Sales and Office Occupations by Sex
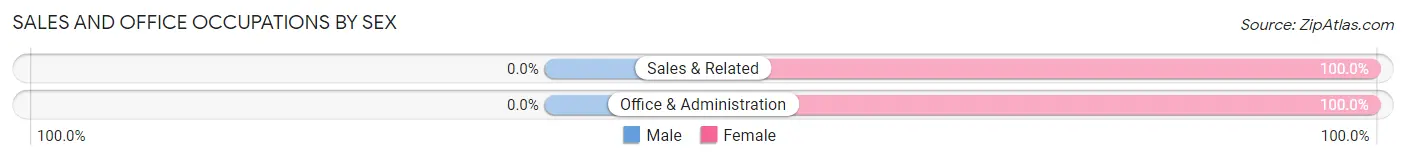
| Occupation | Male | Female |
| Sales & Related | 0 (0.0%) | 11 (100.0%) |
| Office & Administration | 0 (0.0%) | 3 (100.0%) |
| Total (Category) | 0 (0.0%) | 14 (100.0%) |
| Total (Overall) | 52 (44.8%) | 64 (55.2%) |
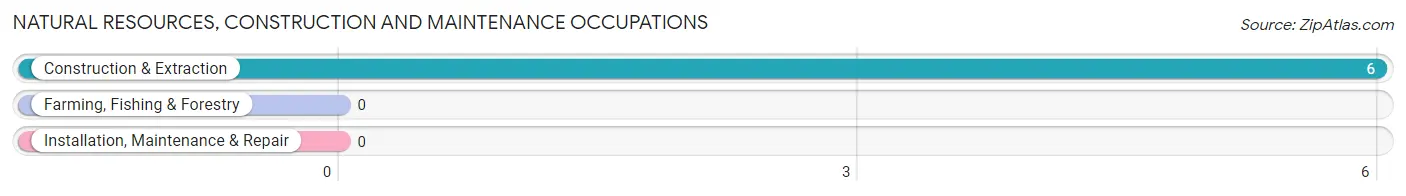
Natural Resources, Construction and Maintenance Occupations
The most common Natural Resources, Construction and Maintenance occupations in Reevesville are , and Construction & Extraction (6 | 5.2%).
Natural Resources, Construction and Maintenance Occupations by Sex
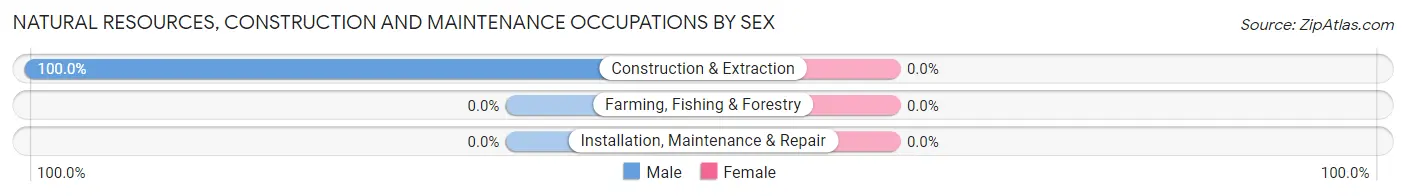
| Occupation | Male | Female |
| Farming, Fishing & Forestry | 0 (0.0%) | 0 (0.0%) |
| Construction & Extraction | 6 (100.0%) | 0 (0.0%) |
| Installation, Maintenance & Repair | 0 (0.0%) | 0 (0.0%) |
| Total (Category) | 6 (100.0%) | 0 (0.0%) |
| Total (Overall) | 52 (44.8%) | 64 (55.2%) |
Production, Transportation and Moving Occupations
The most common Production, Transportation and Moving occupations in Reevesville are Material Moving (10 | 8.6%), Transportation (5 | 4.3%), and Production (4 | 3.5%).
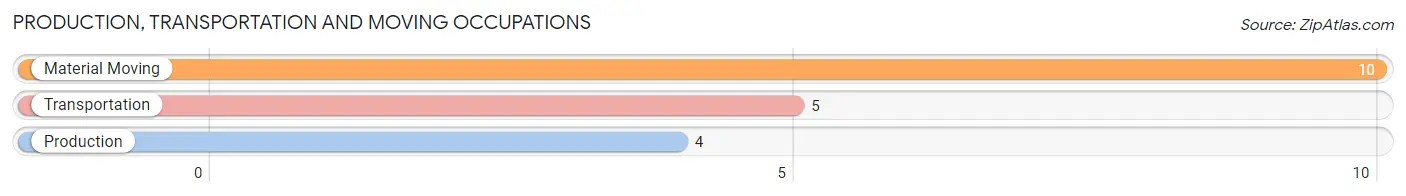
Production, Transportation and Moving Occupations by Sex
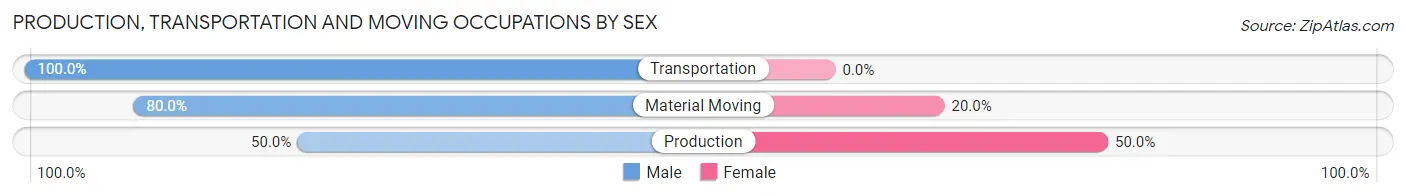
| Occupation | Male | Female |
| Production | 2 (50.0%) | 2 (50.0%) |
| Transportation | 5 (100.0%) | 0 (0.0%) |
| Material Moving | 8 (80.0%) | 2 (20.0%) |
| Total (Category) | 15 (78.9%) | 4 (21.0%) |
| Total (Overall) | 52 (44.8%) | 64 (55.2%) |
Employment Industries by Sex in Reevesville
Employment Industries in Reevesville
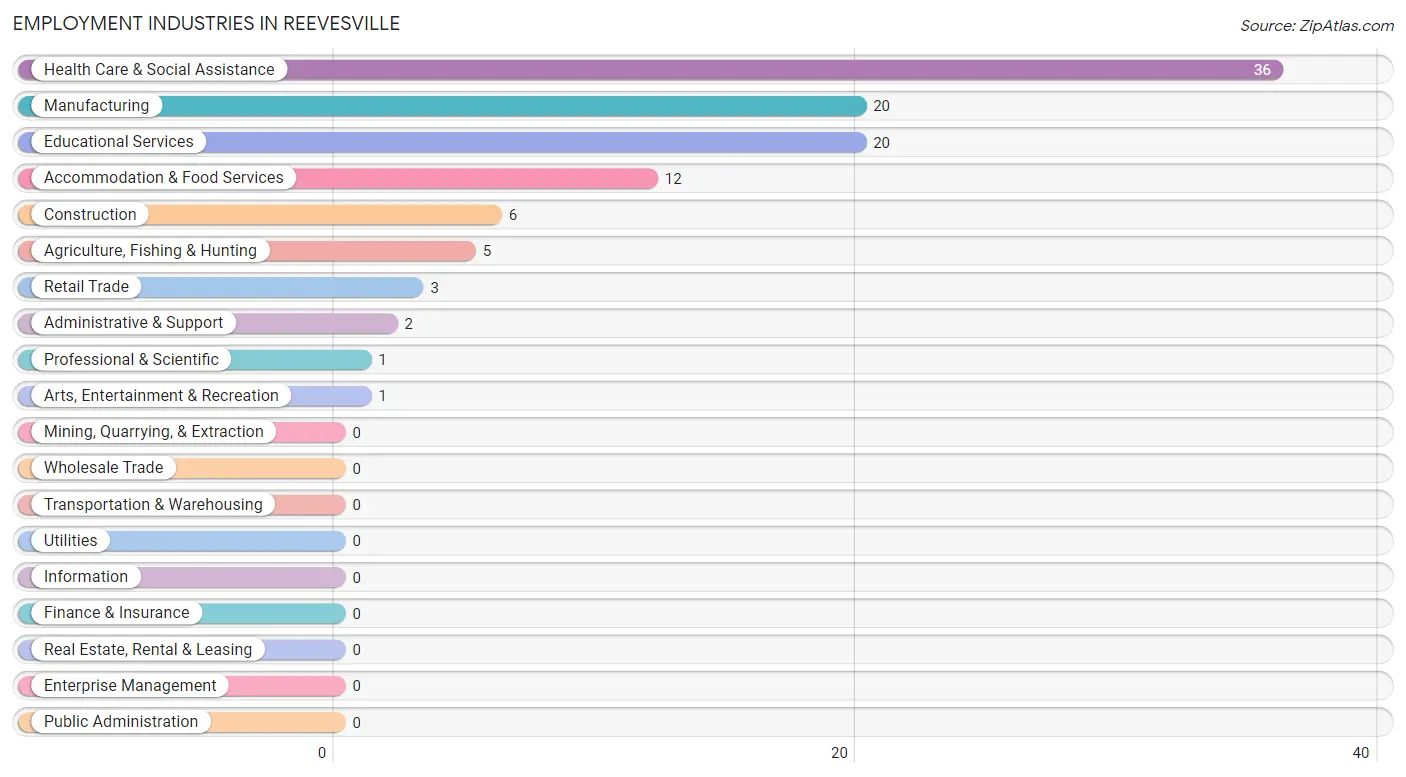
The major employment industries in Reevesville include Health Care & Social Assistance (36 | 31.0%), Manufacturing (20 | 17.2%), Educational Services (20 | 17.2%), Accommodation & Food Services (12 | 10.3%), and Construction (6 | 5.2%).
Employment Industries by Sex in Reevesville
The Reevesville industries that see more men than women are Agriculture, Fishing & Hunting (100.0%), Construction (100.0%), and Arts, Entertainment & Recreation (100.0%), whereas the industries that tend to have a higher number of women are Retail Trade (100.0%), Professional & Scientific (100.0%), and Administrative & Support (100.0%).
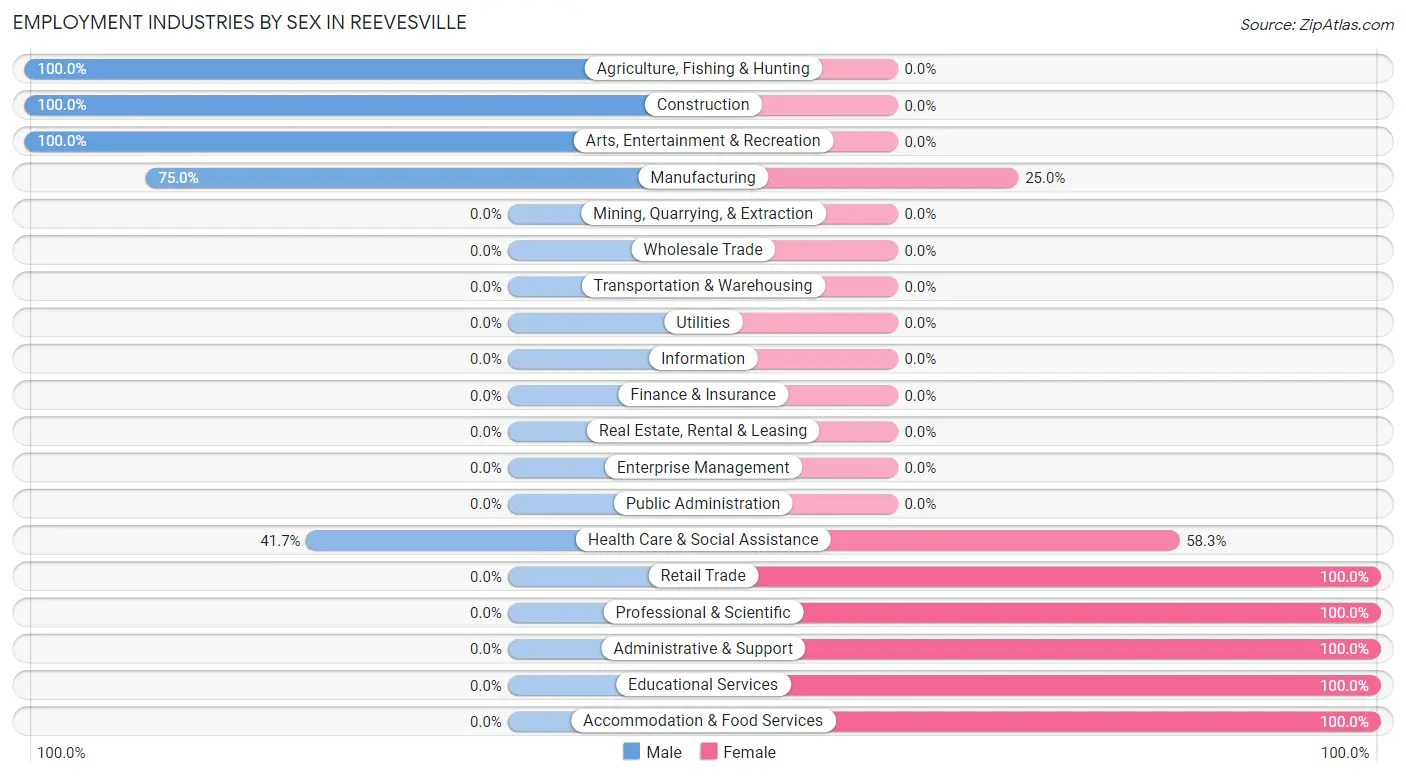
| Industry | Male | Female |
| Agriculture, Fishing & Hunting | 5 (100.0%) | 0 (0.0%) |
| Mining, Quarrying, & Extraction | 0 (0.0%) | 0 (0.0%) |
| Construction | 6 (100.0%) | 0 (0.0%) |
| Manufacturing | 15 (75.0%) | 5 (25.0%) |
| Wholesale Trade | 0 (0.0%) | 0 (0.0%) |
| Retail Trade | 0 (0.0%) | 3 (100.0%) |
| Transportation & Warehousing | 0 (0.0%) | 0 (0.0%) |
| Utilities | 0 (0.0%) | 0 (0.0%) |
| Information | 0 (0.0%) | 0 (0.0%) |
| Finance & Insurance | 0 (0.0%) | 0 (0.0%) |
| Real Estate, Rental & Leasing | 0 (0.0%) | 0 (0.0%) |
| Professional & Scientific | 0 (0.0%) | 1 (100.0%) |
| Enterprise Management | 0 (0.0%) | 0 (0.0%) |
| Administrative & Support | 0 (0.0%) | 2 (100.0%) |
| Educational Services | 0 (0.0%) | 20 (100.0%) |
| Health Care & Social Assistance | 15 (41.7%) | 21 (58.3%) |
| Arts, Entertainment & Recreation | 1 (100.0%) | 0 (0.0%) |
| Accommodation & Food Services | 0 (0.0%) | 12 (100.0%) |
| Public Administration | 0 (0.0%) | 0 (0.0%) |
| Total | 52 (44.8%) | 64 (55.2%) |
Education in Reevesville
School Enrollment in Reevesville
The most common levels of schooling among the 72 students in Reevesville are middle school (31 | 43.1%), elementary school (19 | 26.4%), and high school (12 | 16.7%).
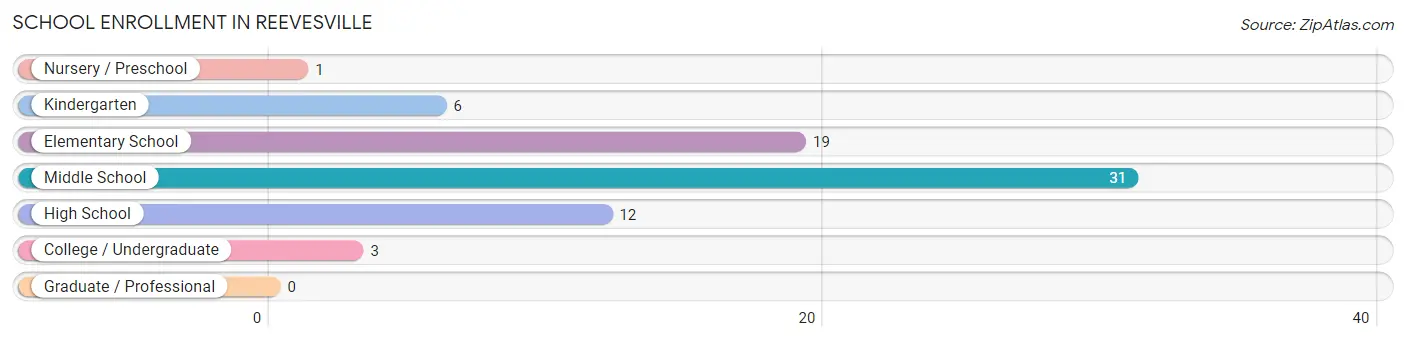
| School Level | # Students | % Students |
| Nursery / Preschool | 1 | 1.4% |
| Kindergarten | 6 | 8.3% |
| Elementary School | 19 | 26.4% |
| Middle School | 31 | 43.1% |
| High School | 12 | 16.7% |
| College / Undergraduate | 3 | 4.2% |
| Graduate / Professional | 0 | 0.0% |
| Total | 72 | 100.0% |
School Enrollment by Age by Funding Source in Reevesville
Out of a total of 72 students who are enrolled in schools in Reevesville, 10 (13.9%) attend a private institution, while the remaining 62 (86.1%) are enrolled in public schools. The age group of 3 to 4 year olds has the highest likelihood of being enrolled in private schools, with 2 (100.0% in the age bracket) enrolled. Conversely, the age group of 10 to 14 year olds has the lowest likelihood of being enrolled in a private school, with 31 (100.0% in the age bracket) attending a public institution.
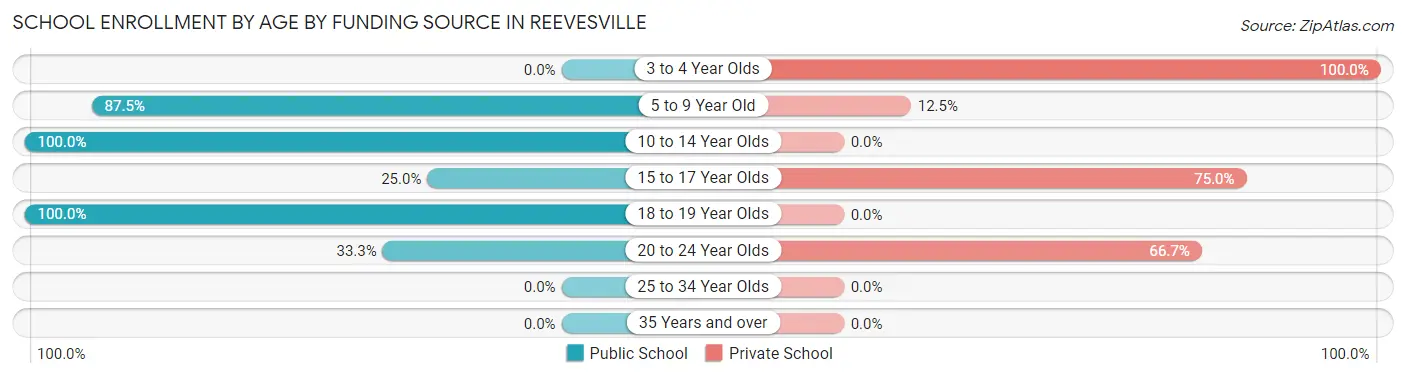
| Age Bracket | Public School | Private School |
| 3 to 4 Year Olds | 0 (0.0%) | 2 (100.0%) |
| 5 to 9 Year Old | 21 (87.5%) | 3 (12.5%) |
| 10 to 14 Year Olds | 31 (100.0%) | 0 (0.0%) |
| 15 to 17 Year Olds | 1 (25.0%) | 3 (75.0%) |
| 18 to 19 Year Olds | 8 (100.0%) | 0 (0.0%) |
| 20 to 24 Year Olds | 1 (33.3%) | 2 (66.7%) |
| 25 to 34 Year Olds | 0 (0.0%) | 0 (0.0%) |
| 35 Years and over | 0 (0.0%) | 0 (0.0%) |
| Total | 62 (86.1%) | 10 (13.9%) |
Educational Attainment by Field of Study in Reevesville
Science & technology (44 | 65.7%), liberal arts & history (7 | 10.4%), business (5 | 7.5%), communications (5 | 7.5%), and education (3 | 4.5%) are the most common fields of study among 67 individuals in Reevesville who have obtained a bachelor's degree or higher.
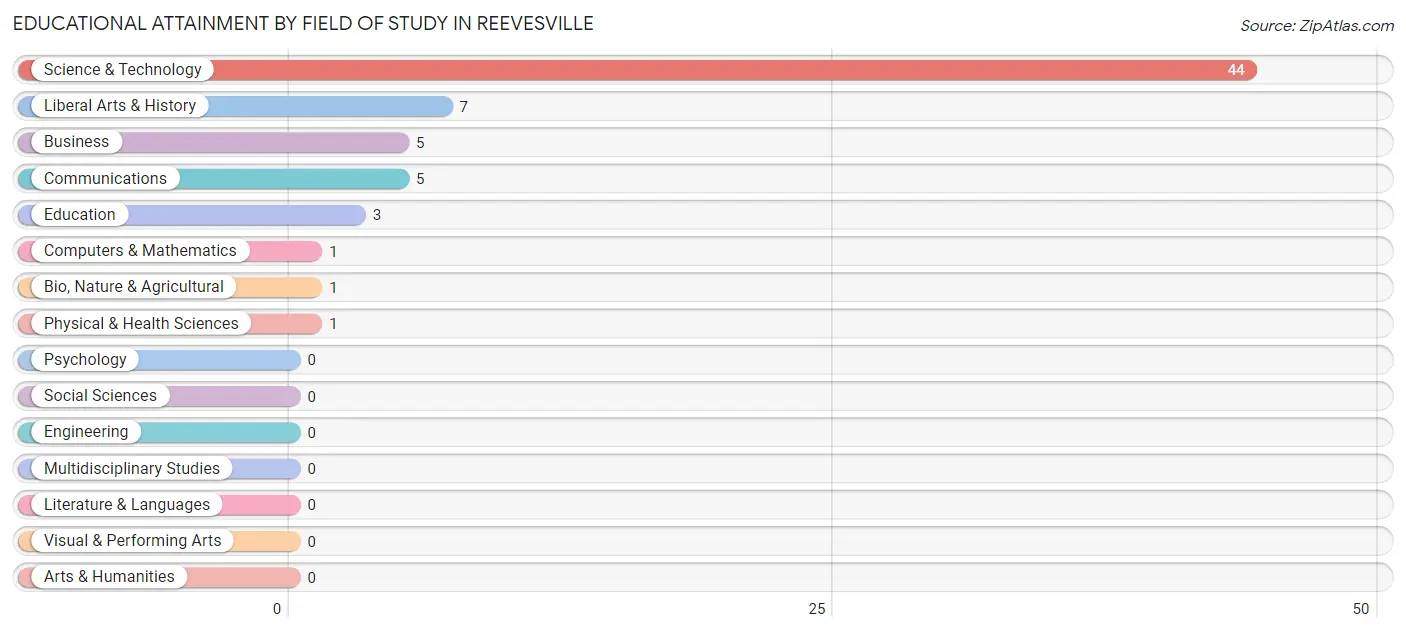
| Field of Study | # Graduates | % Graduates |
| Computers & Mathematics | 1 | 1.5% |
| Bio, Nature & Agricultural | 1 | 1.5% |
| Physical & Health Sciences | 1 | 1.5% |
| Psychology | 0 | 0.0% |
| Social Sciences | 0 | 0.0% |
| Engineering | 0 | 0.0% |
| Multidisciplinary Studies | 0 | 0.0% |
| Science & Technology | 44 | 65.7% |
| Business | 5 | 7.5% |
| Education | 3 | 4.5% |
| Literature & Languages | 0 | 0.0% |
| Liberal Arts & History | 7 | 10.4% |
| Visual & Performing Arts | 0 | 0.0% |
| Communications | 5 | 7.5% |
| Arts & Humanities | 0 | 0.0% |
| Total | 67 | 100.0% |
Transportation & Commute in Reevesville
Vehicle Availability by Sex in Reevesville
The most prevalent vehicle ownership categories in Reevesville are males with 2 vehicles (28, accounting for 53.8%) and females with 2 vehicles (40, making up 45.2%).
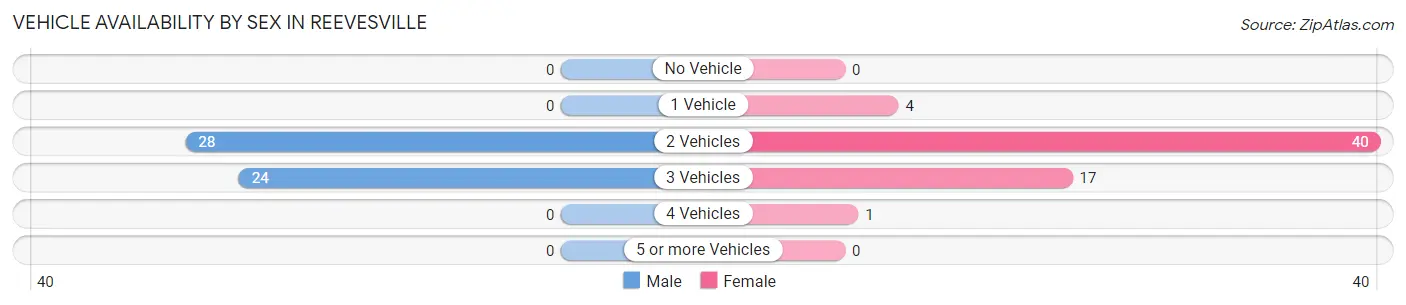
| Vehicles Available | Male | Female |
| No Vehicle | 0 (0.0%) | 0 (0.0%) |
| 1 Vehicle | 0 (0.0%) | 4 (6.5%) |
| 2 Vehicles | 28 (53.8%) | 40 (64.5%) |
| 3 Vehicles | 24 (46.2%) | 17 (27.4%) |
| 4 Vehicles | 0 (0.0%) | 1 (1.6%) |
| 5 or more Vehicles | 0 (0.0%) | 0 (0.0%) |
| Total | 52 (100.0%) | 62 (100.0%) |
Commute Time in Reevesville
The most frequently occuring commute durations in Reevesville are 10 to 14 minutes (29 commuters, 25.4%), 20 to 24 minutes (18 commuters, 15.8%), and 90 or more minutes (15 commuters, 13.2%).
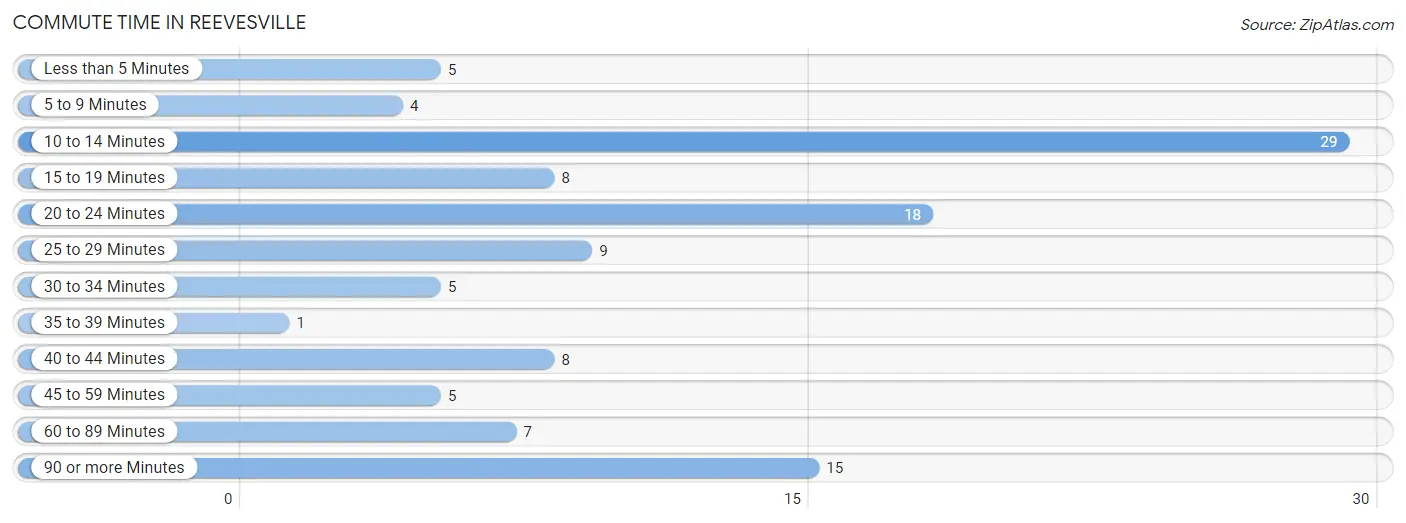
| Commute Time | # Commuters | % Commuters |
| Less than 5 Minutes | 5 | 4.4% |
| 5 to 9 Minutes | 4 | 3.5% |
| 10 to 14 Minutes | 29 | 25.4% |
| 15 to 19 Minutes | 8 | 7.0% |
| 20 to 24 Minutes | 18 | 15.8% |
| 25 to 29 Minutes | 9 | 7.9% |
| 30 to 34 Minutes | 5 | 4.4% |
| 35 to 39 Minutes | 1 | 0.9% |
| 40 to 44 Minutes | 8 | 7.0% |
| 45 to 59 Minutes | 5 | 4.4% |
| 60 to 89 Minutes | 7 | 6.1% |
| 90 or more Minutes | 15 | 13.2% |
Commute Time by Sex in Reevesville
The most common commute times in Reevesville are 90 or more minutes (15 commuters, 28.8%) for males and 10 to 14 minutes (22 commuters, 35.5%) for females.
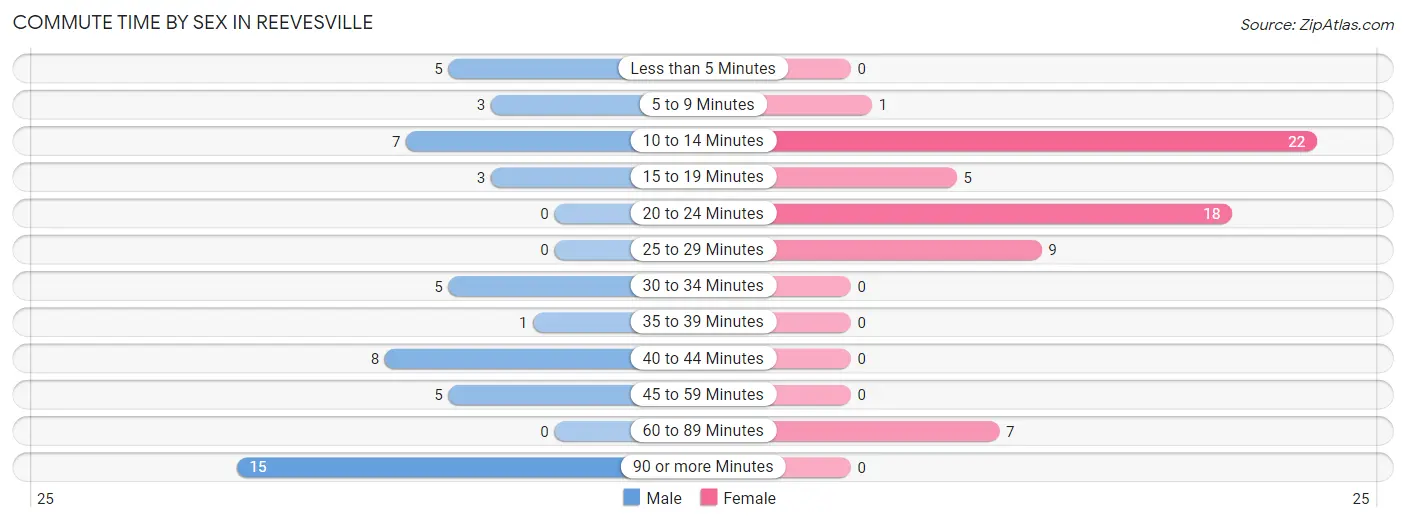
| Commute Time | Male | Female |
| Less than 5 Minutes | 5 (9.6%) | 0 (0.0%) |
| 5 to 9 Minutes | 3 (5.8%) | 1 (1.6%) |
| 10 to 14 Minutes | 7 (13.5%) | 22 (35.5%) |
| 15 to 19 Minutes | 3 (5.8%) | 5 (8.1%) |
| 20 to 24 Minutes | 0 (0.0%) | 18 (29.0%) |
| 25 to 29 Minutes | 0 (0.0%) | 9 (14.5%) |
| 30 to 34 Minutes | 5 (9.6%) | 0 (0.0%) |
| 35 to 39 Minutes | 1 (1.9%) | 0 (0.0%) |
| 40 to 44 Minutes | 8 (15.4%) | 0 (0.0%) |
| 45 to 59 Minutes | 5 (9.6%) | 0 (0.0%) |
| 60 to 89 Minutes | 0 (0.0%) | 7 (11.3%) |
| 90 or more Minutes | 15 (28.8%) | 0 (0.0%) |
Time of Departure to Work by Sex in Reevesville
The most frequent times of departure to work in Reevesville are 6:00 AM to 6:29 AM (27, 51.9%) for males and 7:00 AM to 7:29 AM (23, 37.1%) for females.
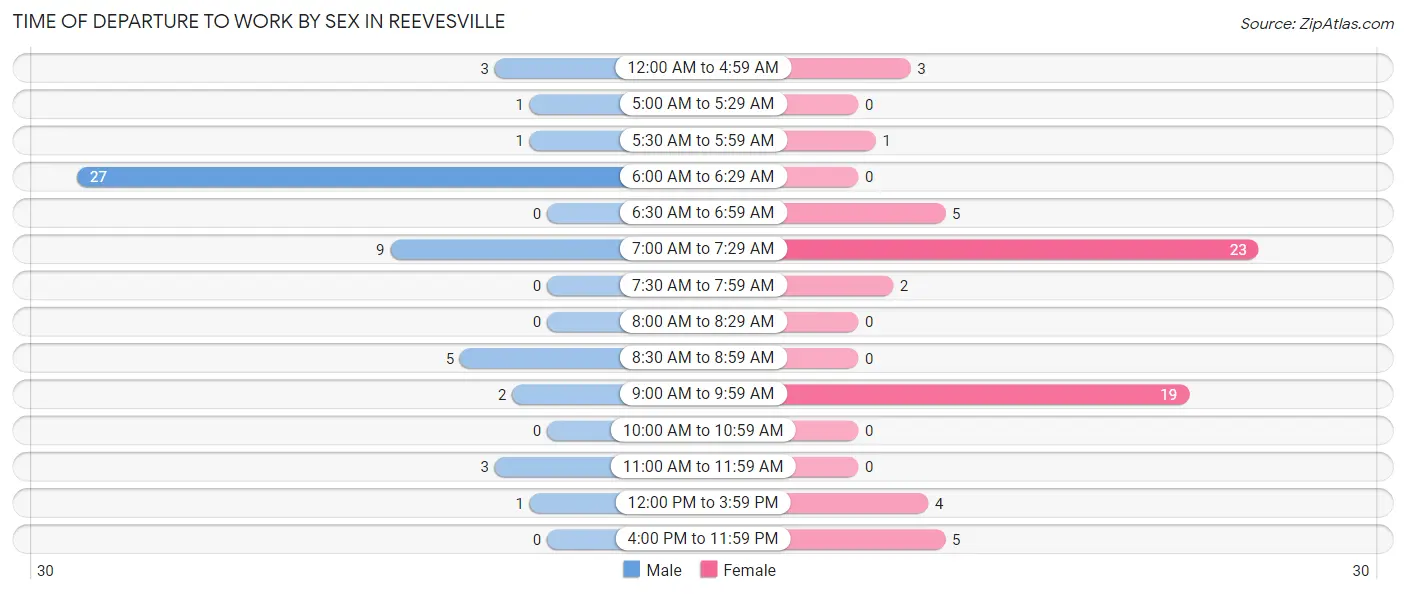
| Time of Departure | Male | Female |
| 12:00 AM to 4:59 AM | 3 (5.8%) | 3 (4.8%) |
| 5:00 AM to 5:29 AM | 1 (1.9%) | 0 (0.0%) |
| 5:30 AM to 5:59 AM | 1 (1.9%) | 1 (1.6%) |
| 6:00 AM to 6:29 AM | 27 (51.9%) | 0 (0.0%) |
| 6:30 AM to 6:59 AM | 0 (0.0%) | 5 (8.1%) |
| 7:00 AM to 7:29 AM | 9 (17.3%) | 23 (37.1%) |
| 7:30 AM to 7:59 AM | 0 (0.0%) | 2 (3.2%) |
| 8:00 AM to 8:29 AM | 0 (0.0%) | 0 (0.0%) |
| 8:30 AM to 8:59 AM | 5 (9.6%) | 0 (0.0%) |
| 9:00 AM to 9:59 AM | 2 (3.8%) | 19 (30.6%) |
| 10:00 AM to 10:59 AM | 0 (0.0%) | 0 (0.0%) |
| 11:00 AM to 11:59 AM | 3 (5.8%) | 0 (0.0%) |
| 12:00 PM to 3:59 PM | 1 (1.9%) | 4 (6.5%) |
| 4:00 PM to 11:59 PM | 0 (0.0%) | 5 (8.1%) |
| Total | 52 (100.0%) | 62 (100.0%) |
Housing Occupancy in Reevesville
Occupancy by Ownership in Reevesville
Of the total 107 dwellings in Reevesville, owner-occupied units account for 95 (88.8%), while renter-occupied units make up 12 (11.2%).
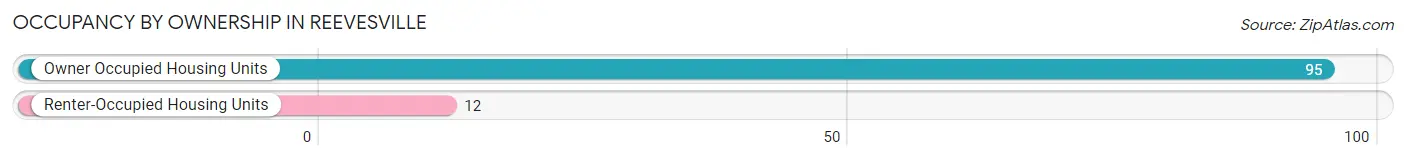
| Occupancy | # Housing Units | % Housing Units |
| Owner Occupied Housing Units | 95 | 88.8% |
| Renter-Occupied Housing Units | 12 | 11.2% |
| Total Occupied Housing Units | 107 | 100.0% |
Occupancy by Household Size in Reevesville
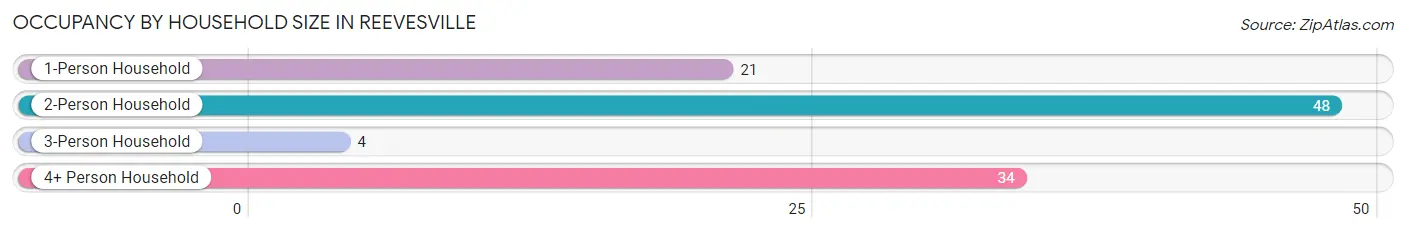
| Household Size | # Housing Units | % Housing Units |
| 1-Person Household | 21 | 19.6% |
| 2-Person Household | 48 | 44.9% |
| 3-Person Household | 4 | 3.7% |
| 4+ Person Household | 34 | 31.8% |
| Total Housing Units | 107 | 100.0% |
Occupancy by Ownership by Household Size in Reevesville
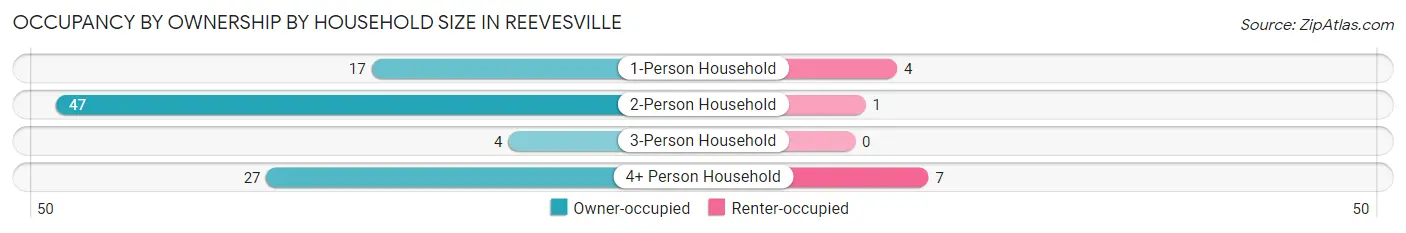
| Household Size | Owner-occupied | Renter-occupied |
| 1-Person Household | 17 (80.9%) | 4 (19.1%) |
| 2-Person Household | 47 (97.9%) | 1 (2.1%) |
| 3-Person Household | 4 (100.0%) | 0 (0.0%) |
| 4+ Person Household | 27 (79.4%) | 7 (20.6%) |
| Total Housing Units | 95 (88.8%) | 12 (11.2%) |
Occupancy by Educational Attainment in Reevesville
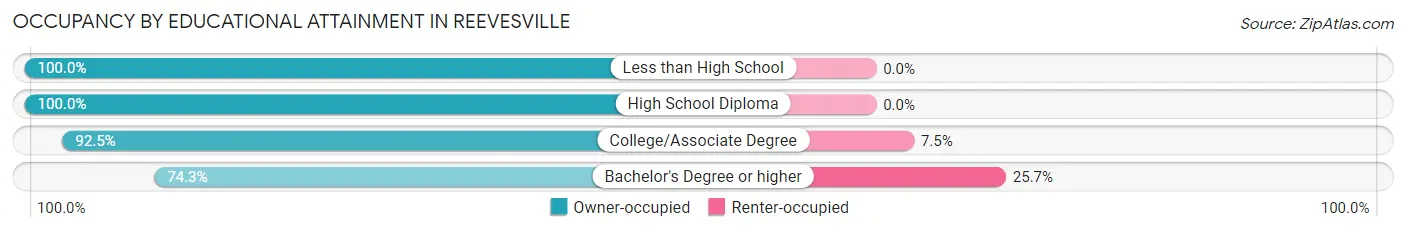
| Household Size | Owner-occupied | Renter-occupied |
| Less than High School | 9 (100.0%) | 0 (0.0%) |
| High School Diploma | 23 (100.0%) | 0 (0.0%) |
| College/Associate Degree | 37 (92.5%) | 3 (7.5%) |
| Bachelor's Degree or higher | 26 (74.3%) | 9 (25.7%) |
Occupancy by Age of Householder in Reevesville
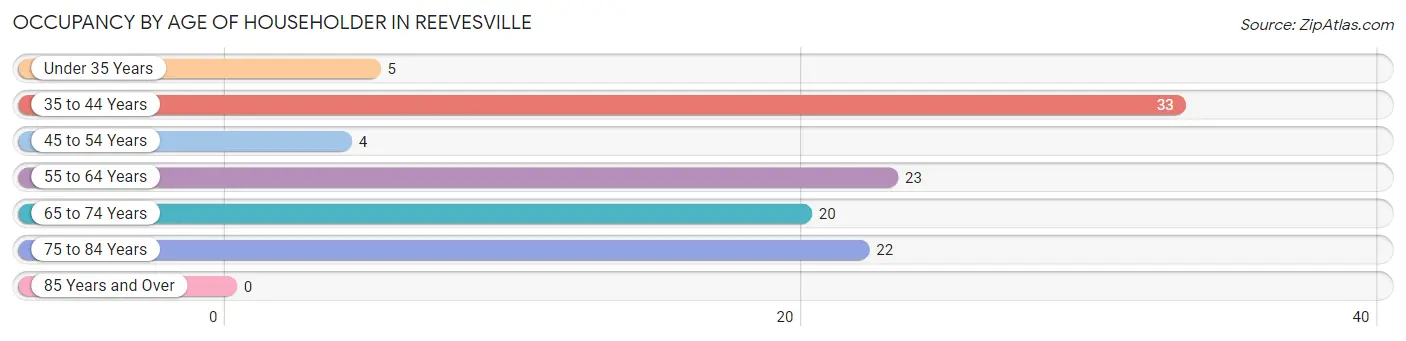
| Age Bracket | # Households | % Households |
| Under 35 Years | 5 | 4.7% |
| 35 to 44 Years | 33 | 30.8% |
| 45 to 54 Years | 4 | 3.7% |
| 55 to 64 Years | 23 | 21.5% |
| 65 to 74 Years | 20 | 18.7% |
| 75 to 84 Years | 22 | 20.6% |
| 85 Years and Over | 0 | 0.0% |
| Total | 107 | 100.0% |
Housing Finances in Reevesville
Median Income by Occupancy in Reevesville
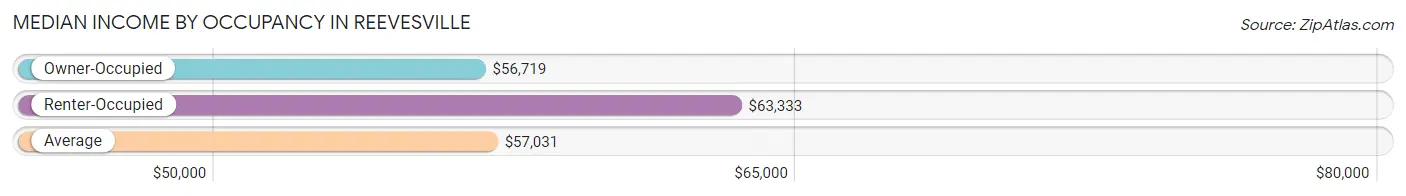
| Occupancy Type | # Households | Median Income |
| Owner-Occupied | 95 (88.8%) | $56,719 |
| Renter-Occupied | 12 (11.2%) | $63,333 |
| Average | 107 (100.0%) | $57,031 |
Occupancy by Householder Income Bracket in Reevesville
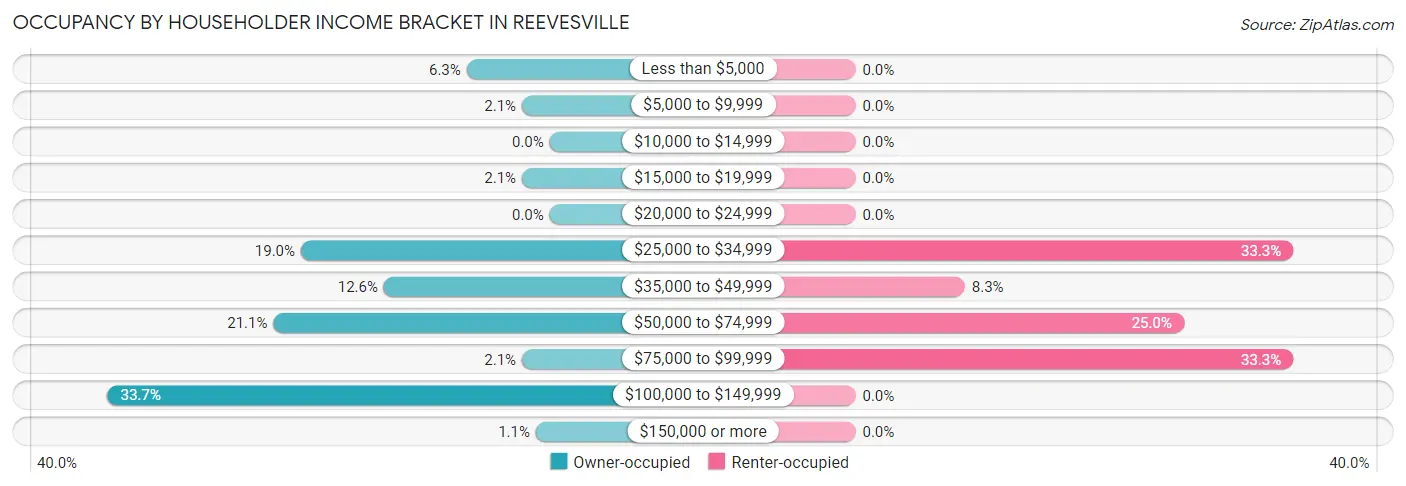
| Income Bracket | Owner-occupied | Renter-occupied |
| Less than $5,000 | 6 (6.3%) | 0 (0.0%) |
| $5,000 to $9,999 | 2 (2.1%) | 0 (0.0%) |
| $10,000 to $14,999 | 0 (0.0%) | 0 (0.0%) |
| $15,000 to $19,999 | 2 (2.1%) | 0 (0.0%) |
| $20,000 to $24,999 | 0 (0.0%) | 0 (0.0%) |
| $25,000 to $34,999 | 18 (19.0%) | 4 (33.3%) |
| $35,000 to $49,999 | 12 (12.6%) | 1 (8.3%) |
| $50,000 to $74,999 | 20 (21.0%) | 3 (25.0%) |
| $75,000 to $99,999 | 2 (2.1%) | 4 (33.3%) |
| $100,000 to $149,999 | 32 (33.7%) | 0 (0.0%) |
| $150,000 or more | 1 (1.1%) | 0 (0.0%) |
| Total | 95 (100.0%) | 12 (100.0%) |
Monthly Housing Cost Tiers in Reevesville
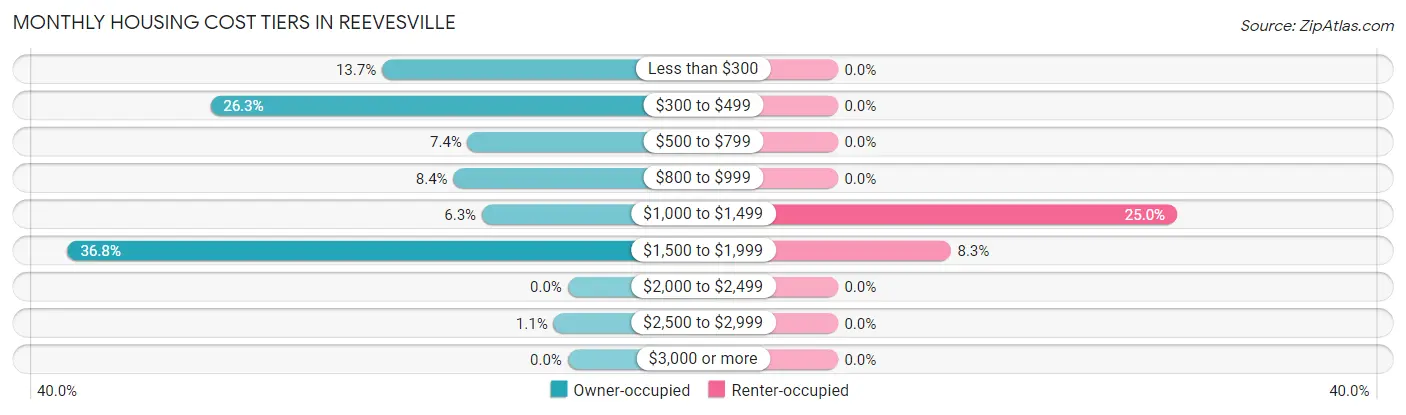
| Monthly Cost | Owner-occupied | Renter-occupied |
| Less than $300 | 13 (13.7%) | 0 (0.0%) |
| $300 to $499 | 25 (26.3%) | 0 (0.0%) |
| $500 to $799 | 7 (7.4%) | 0 (0.0%) |
| $800 to $999 | 8 (8.4%) | 0 (0.0%) |
| $1,000 to $1,499 | 6 (6.3%) | 3 (25.0%) |
| $1,500 to $1,999 | 35 (36.8%) | 1 (8.3%) |
| $2,000 to $2,499 | 0 (0.0%) | 0 (0.0%) |
| $2,500 to $2,999 | 1 (1.1%) | 0 (0.0%) |
| $3,000 or more | 0 (0.0%) | 0 (0.0%) |
| Total | 95 (100.0%) | 12 (100.0%) |
Physical Housing Characteristics in Reevesville
Housing Structures in Reevesville
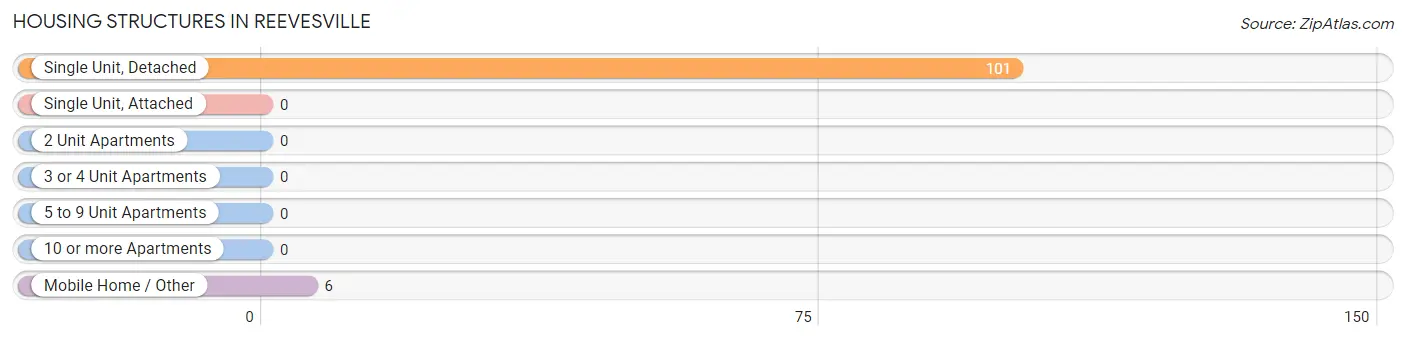
| Structure Type | # Housing Units | % Housing Units |
| Single Unit, Detached | 101 | 94.4% |
| Single Unit, Attached | 0 | 0.0% |
| 2 Unit Apartments | 0 | 0.0% |
| 3 or 4 Unit Apartments | 0 | 0.0% |
| 5 to 9 Unit Apartments | 0 | 0.0% |
| 10 or more Apartments | 0 | 0.0% |
| Mobile Home / Other | 6 | 5.6% |
| Total | 107 | 100.0% |
Housing Structures by Occupancy in Reevesville
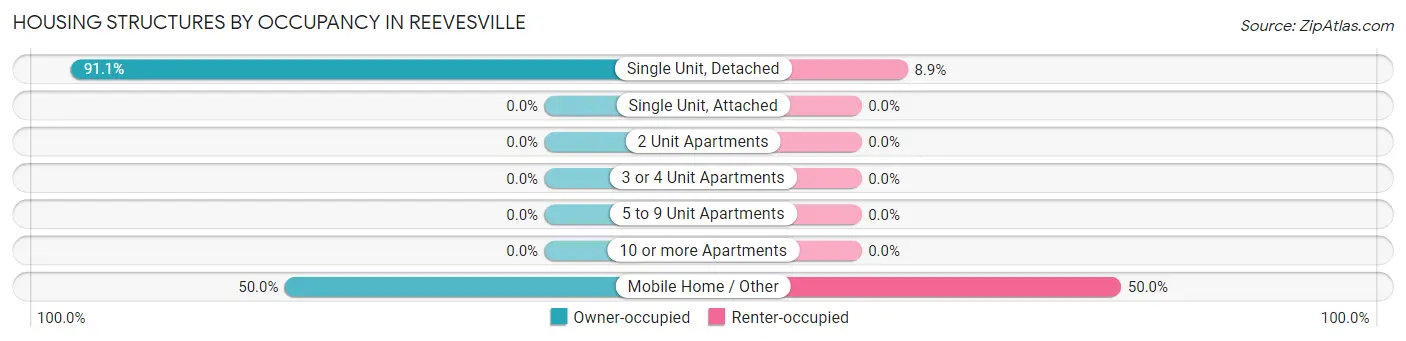
| Structure Type | Owner-occupied | Renter-occupied |
| Single Unit, Detached | 92 (91.1%) | 9 (8.9%) |
| Single Unit, Attached | 0 (0.0%) | 0 (0.0%) |
| 2 Unit Apartments | 0 (0.0%) | 0 (0.0%) |
| 3 or 4 Unit Apartments | 0 (0.0%) | 0 (0.0%) |
| 5 to 9 Unit Apartments | 0 (0.0%) | 0 (0.0%) |
| 10 or more Apartments | 0 (0.0%) | 0 (0.0%) |
| Mobile Home / Other | 3 (50.0%) | 3 (50.0%) |
| Total | 95 (88.8%) | 12 (11.2%) |
Housing Structures by Number of Rooms in Reevesville
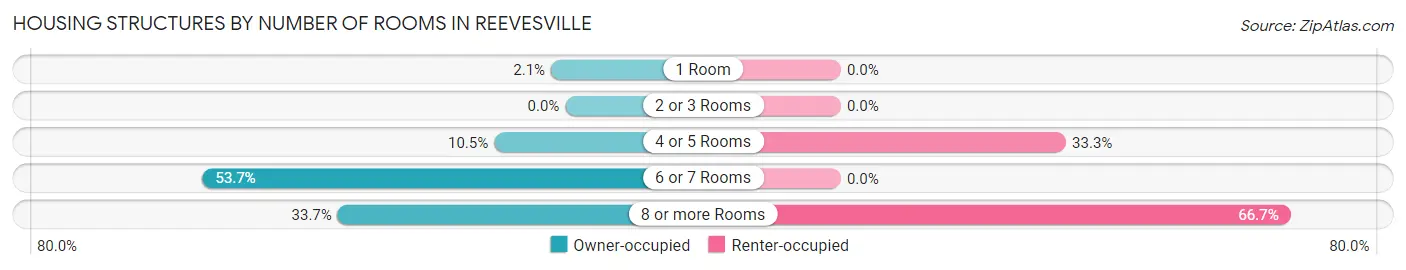
| Number of Rooms | Owner-occupied | Renter-occupied |
| 1 Room | 2 (2.1%) | 0 (0.0%) |
| 2 or 3 Rooms | 0 (0.0%) | 0 (0.0%) |
| 4 or 5 Rooms | 10 (10.5%) | 4 (33.3%) |
| 6 or 7 Rooms | 51 (53.7%) | 0 (0.0%) |
| 8 or more Rooms | 32 (33.7%) | 8 (66.7%) |
| Total | 95 (100.0%) | 12 (100.0%) |
Housing Structure by Heating Type in Reevesville
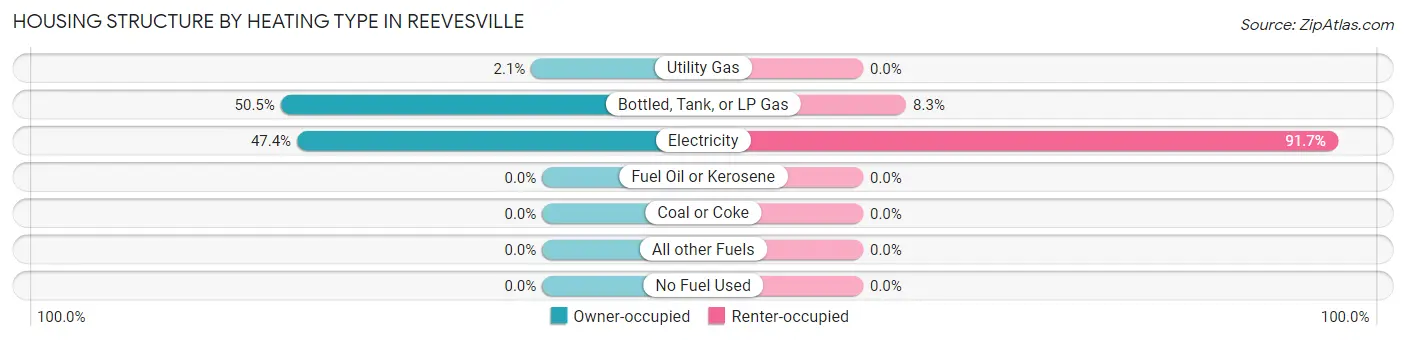
| Heating Type | Owner-occupied | Renter-occupied |
| Utility Gas | 2 (2.1%) | 0 (0.0%) |
| Bottled, Tank, or LP Gas | 48 (50.5%) | 1 (8.3%) |
| Electricity | 45 (47.4%) | 11 (91.7%) |
| Fuel Oil or Kerosene | 0 (0.0%) | 0 (0.0%) |
| Coal or Coke | 0 (0.0%) | 0 (0.0%) |
| All other Fuels | 0 (0.0%) | 0 (0.0%) |
| No Fuel Used | 0 (0.0%) | 0 (0.0%) |
| Total | 95 (100.0%) | 12 (100.0%) |
Household Vehicle Usage in Reevesville
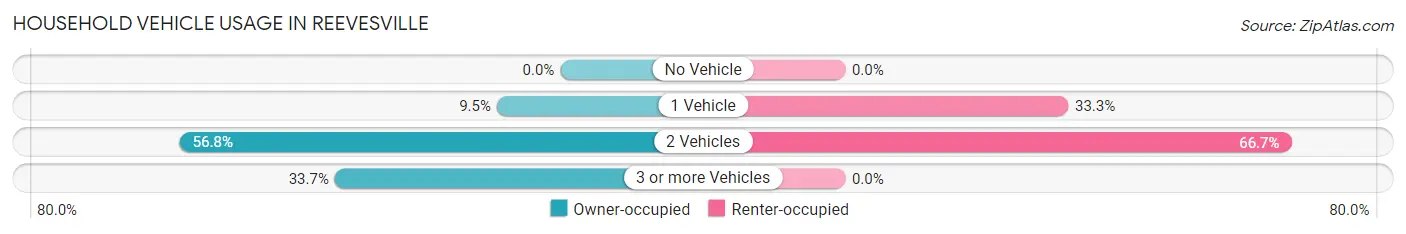
| Vehicles per Household | Owner-occupied | Renter-occupied |
| No Vehicle | 0 (0.0%) | 0 (0.0%) |
| 1 Vehicle | 9 (9.5%) | 4 (33.3%) |
| 2 Vehicles | 54 (56.8%) | 8 (66.7%) |
| 3 or more Vehicles | 32 (33.7%) | 0 (0.0%) |
| Total | 95 (100.0%) | 12 (100.0%) |
Real Estate & Mortgages in Reevesville
Real Estate and Mortgage Overview in Reevesville
| Characteristic | Without Mortgage | With Mortgage |
| Housing Units | 53 | 42 |
| Median Property Value | $99,000 | $0 |
| Median Household Income | $32,344 | $0 |
| Monthly Housing Costs | $375 | $0 |
| Real Estate Taxes | $346 | $0 |
Property Value by Mortgage Status in Reevesville
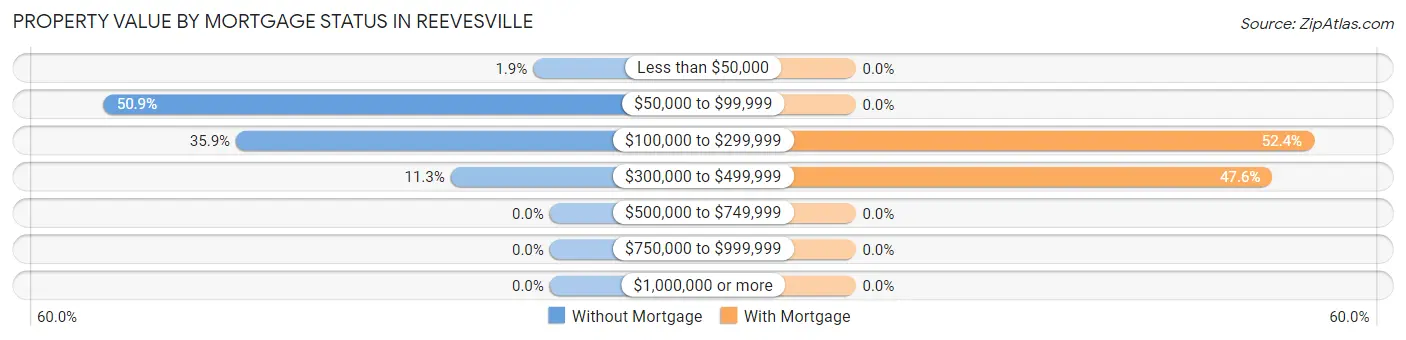
| Property Value | Without Mortgage | With Mortgage |
| Less than $50,000 | 1 (1.9%) | 0 (0.0%) |
| $50,000 to $99,999 | 27 (50.9%) | 0 (0.0%) |
| $100,000 to $299,999 | 19 (35.8%) | 22 (52.4%) |
| $300,000 to $499,999 | 6 (11.3%) | 20 (47.6%) |
| $500,000 to $749,999 | 0 (0.0%) | 0 (0.0%) |
| $750,000 to $999,999 | 0 (0.0%) | 0 (0.0%) |
| $1,000,000 or more | 0 (0.0%) | 0 (0.0%) |
| Total | 53 (100.0%) | 42 (100.0%) |
Household Income by Mortgage Status in Reevesville
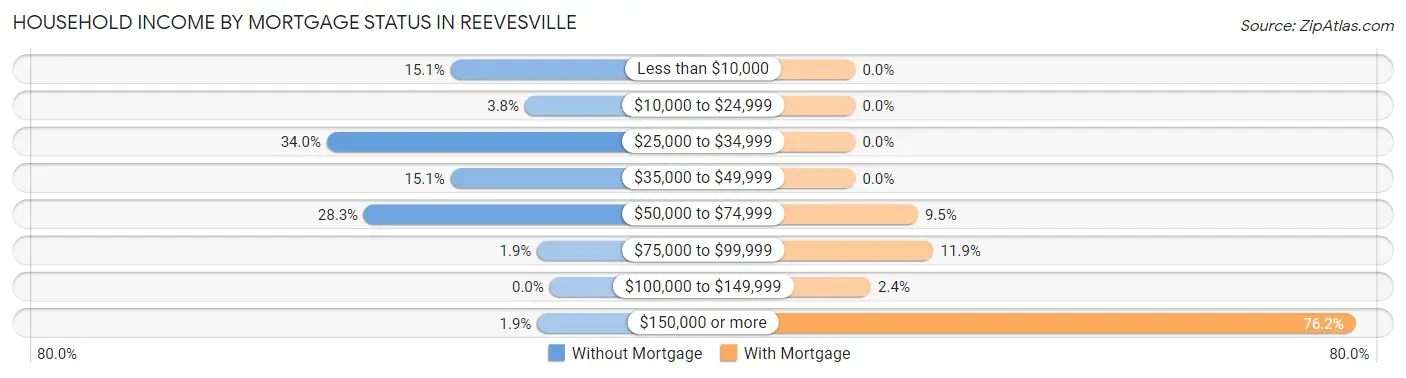
| Household Income | Without Mortgage | With Mortgage |
| Less than $10,000 | 8 (15.1%) | 0 (0.0%) |
| $10,000 to $24,999 | 2 (3.8%) | 0 (0.0%) |
| $25,000 to $34,999 | 18 (34.0%) | 0 (0.0%) |
| $35,000 to $49,999 | 8 (15.1%) | 0 (0.0%) |
| $50,000 to $74,999 | 15 (28.3%) | 4 (9.5%) |
| $75,000 to $99,999 | 1 (1.9%) | 5 (11.9%) |
| $100,000 to $149,999 | 0 (0.0%) | 1 (2.4%) |
| $150,000 or more | 1 (1.9%) | 32 (76.2%) |
| Total | 53 (100.0%) | 42 (100.0%) |
Property Value to Household Income Ratio in Reevesville
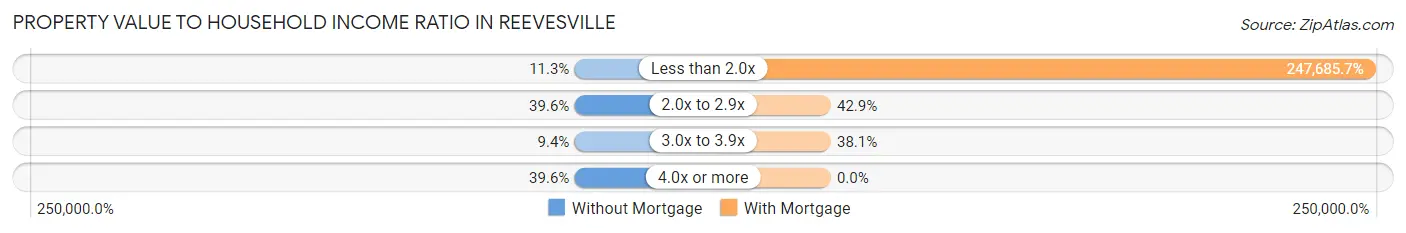
| Value-to-Income Ratio | Without Mortgage | With Mortgage |
| Less than 2.0x | 6 (11.3%) | 104,028 (247,685.7%) |
| 2.0x to 2.9x | 21 (39.6%) | 18 (42.9%) |
| 3.0x to 3.9x | 5 (9.4%) | 16 (38.1%) |
| 4.0x or more | 21 (39.6%) | 0 (0.0%) |
| Total | 53 (100.0%) | 42 (100.0%) |
Real Estate Taxes by Mortgage Status in Reevesville
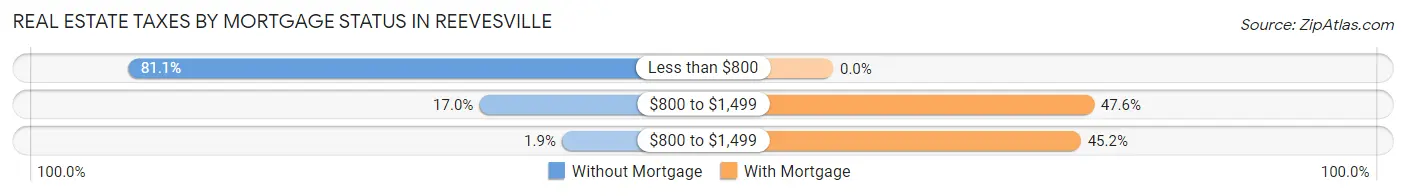
| Property Taxes | Without Mortgage | With Mortgage |
| Less than $800 | 43 (81.1%) | 0 (0.0%) |
| $800 to $1,499 | 9 (17.0%) | 20 (47.6%) |
| $800 to $1,499 | 1 (1.9%) | 19 (45.2%) |
| Total | 53 (100.0%) | 42 (100.0%) |
Health & Disability in Reevesville
Health Insurance Coverage by Age in Reevesville
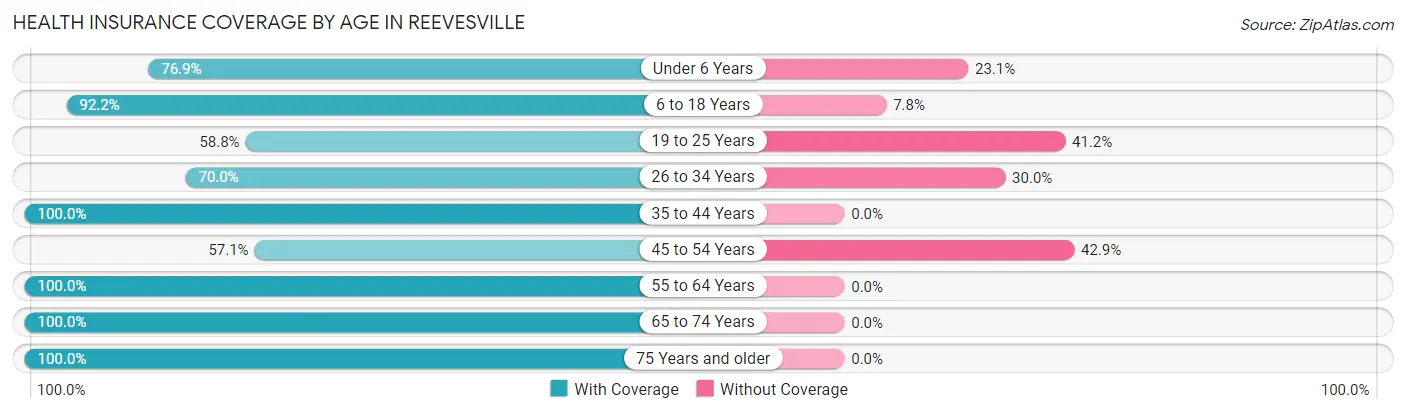
| Age Bracket | With Coverage | Without Coverage |
| Under 6 Years | 10 (76.9%) | 3 (23.1%) |
| 6 to 18 Years | 59 (92.2%) | 5 (7.8%) |
| 19 to 25 Years | 10 (58.8%) | 7 (41.2%) |
| 26 to 34 Years | 7 (70.0%) | 3 (30.0%) |
| 35 to 44 Years | 66 (100.0%) | 0 (0.0%) |
| 45 to 54 Years | 4 (57.1%) | 3 (42.9%) |
| 55 to 64 Years | 26 (100.0%) | 0 (0.0%) |
| 65 to 74 Years | 30 (100.0%) | 0 (0.0%) |
| 75 Years and older | 39 (100.0%) | 0 (0.0%) |
| Total | 251 (92.3%) | 21 (7.7%) |
Health Insurance Coverage by Citizenship Status in Reevesville
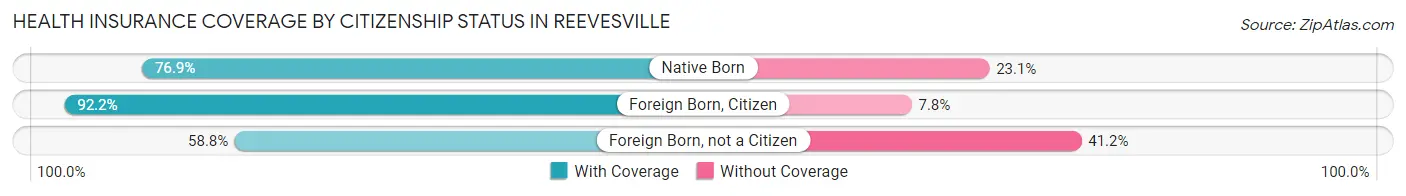
| Citizenship Status | With Coverage | Without Coverage |
| Native Born | 10 (76.9%) | 3 (23.1%) |
| Foreign Born, Citizen | 59 (92.2%) | 5 (7.8%) |
| Foreign Born, not a Citizen | 10 (58.8%) | 7 (41.2%) |
Health Insurance Coverage by Household Income in Reevesville
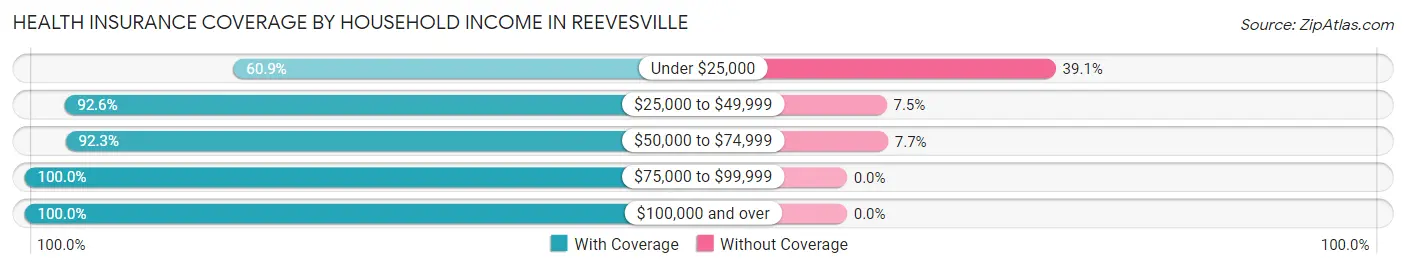
| Household Income | With Coverage | Without Coverage |
| Under $25,000 | 14 (60.9%) | 9 (39.1%) |
| $25,000 to $49,999 | 87 (92.5%) | 7 (7.4%) |
| $50,000 to $74,999 | 60 (92.3%) | 5 (7.7%) |
| $75,000 to $99,999 | 19 (100.0%) | 0 (0.0%) |
| $100,000 and over | 71 (100.0%) | 0 (0.0%) |
Public vs Private Health Insurance Coverage by Age in Reevesville
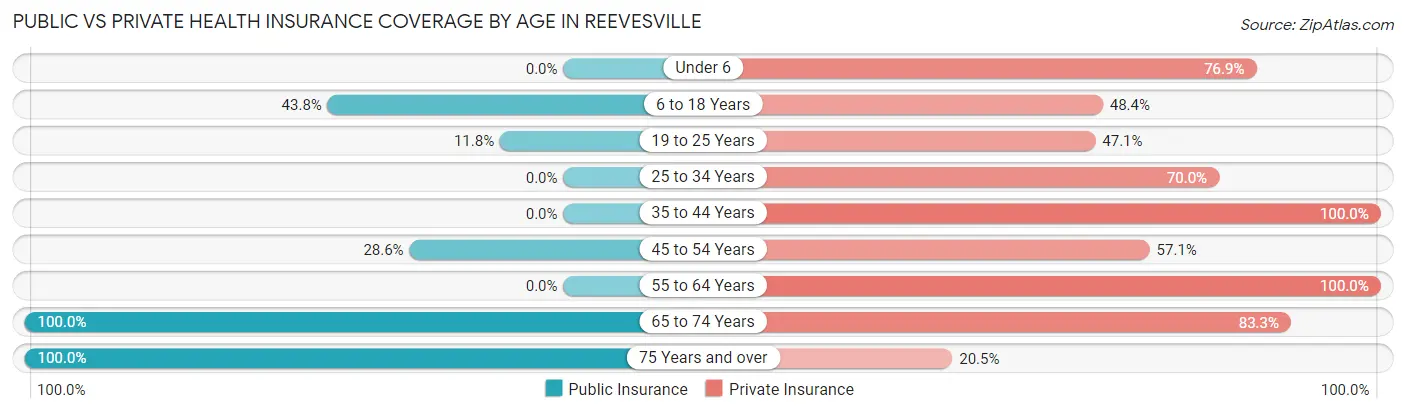
| Age Bracket | Public Insurance | Private Insurance |
| Under 6 | 0 (0.0%) | 10 (76.9%) |
| 6 to 18 Years | 28 (43.8%) | 31 (48.4%) |
| 19 to 25 Years | 2 (11.8%) | 8 (47.1%) |
| 25 to 34 Years | 0 (0.0%) | 7 (70.0%) |
| 35 to 44 Years | 0 (0.0%) | 66 (100.0%) |
| 45 to 54 Years | 2 (28.6%) | 4 (57.1%) |
| 55 to 64 Years | 0 (0.0%) | 26 (100.0%) |
| 65 to 74 Years | 30 (100.0%) | 25 (83.3%) |
| 75 Years and over | 39 (100.0%) | 8 (20.5%) |
| Total | 101 (37.1%) | 185 (68.0%) |
Disability Status by Sex by Age in Reevesville
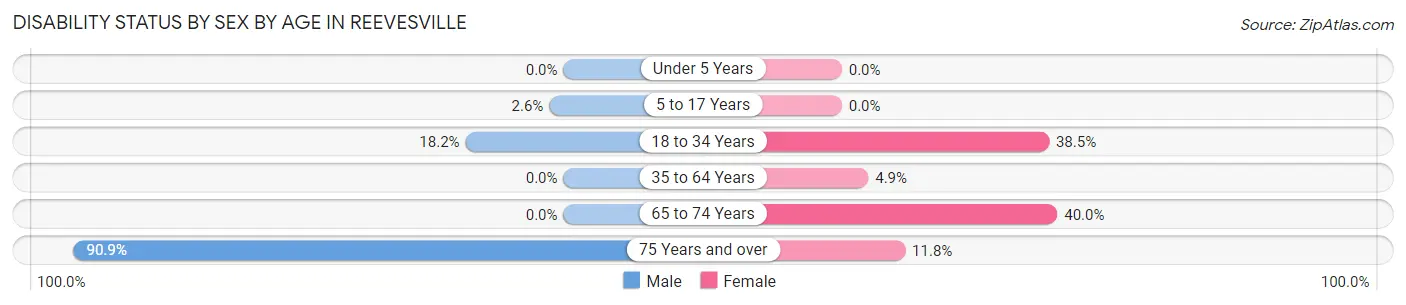
| Age Bracket | Male | Female |
| Under 5 Years | 0 (0.0%) | 0 (0.0%) |
| 5 to 17 Years | 1 (2.6%) | 0 (0.0%) |
| 18 to 34 Years | 4 (18.2%) | 5 (38.5%) |
| 35 to 64 Years | 0 (0.0%) | 3 (4.9%) |
| 65 to 74 Years | 0 (0.0%) | 8 (40.0%) |
| 75 Years and over | 20 (90.9%) | 2 (11.8%) |
Disability Class by Sex by Age in Reevesville
Disability Class: Hearing Difficulty
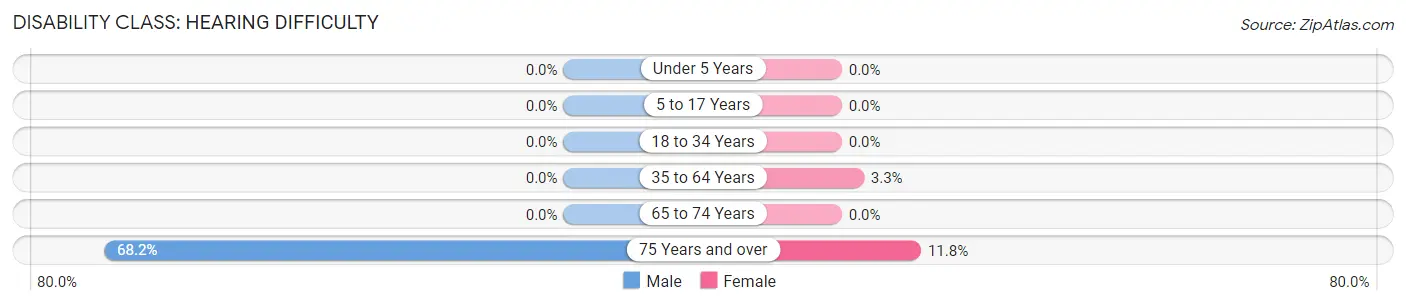
| Age Bracket | Male | Female |
| Under 5 Years | 0 (0.0%) | 0 (0.0%) |
| 5 to 17 Years | 0 (0.0%) | 0 (0.0%) |
| 18 to 34 Years | 0 (0.0%) | 0 (0.0%) |
| 35 to 64 Years | 0 (0.0%) | 2 (3.3%) |
| 65 to 74 Years | 0 (0.0%) | 0 (0.0%) |
| 75 Years and over | 15 (68.2%) | 2 (11.8%) |
Disability Class: Vision Difficulty
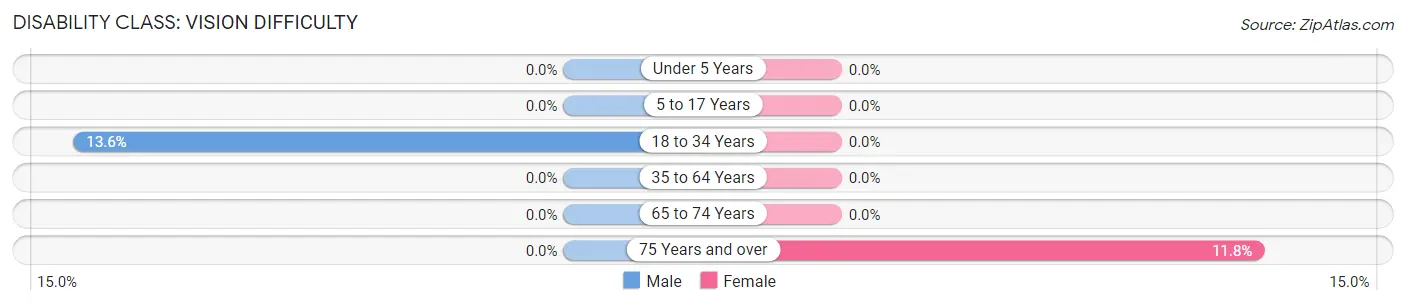
| Age Bracket | Male | Female |
| Under 5 Years | 0 (0.0%) | 0 (0.0%) |
| 5 to 17 Years | 0 (0.0%) | 0 (0.0%) |
| 18 to 34 Years | 3 (13.6%) | 0 (0.0%) |
| 35 to 64 Years | 0 (0.0%) | 0 (0.0%) |
| 65 to 74 Years | 0 (0.0%) | 0 (0.0%) |
| 75 Years and over | 0 (0.0%) | 2 (11.8%) |
Disability Class: Cognitive Difficulty
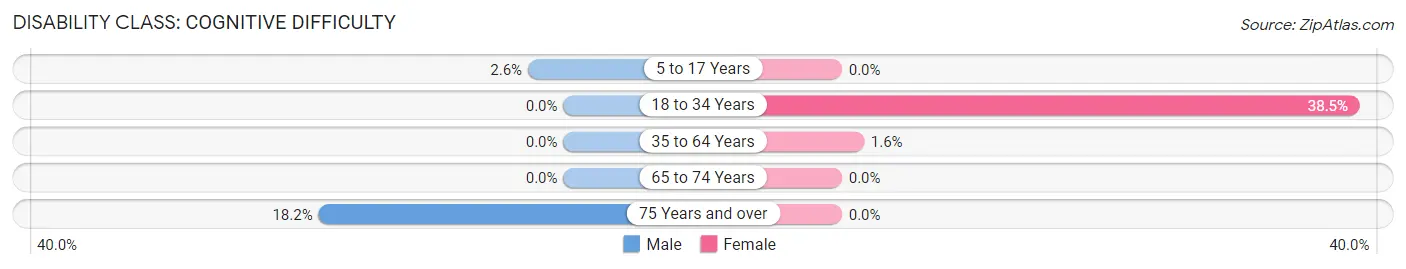
| Age Bracket | Male | Female |
| 5 to 17 Years | 1 (2.6%) | 0 (0.0%) |
| 18 to 34 Years | 0 (0.0%) | 5 (38.5%) |
| 35 to 64 Years | 0 (0.0%) | 1 (1.6%) |
| 65 to 74 Years | 0 (0.0%) | 0 (0.0%) |
| 75 Years and over | 4 (18.2%) | 0 (0.0%) |
Disability Class: Ambulatory Difficulty
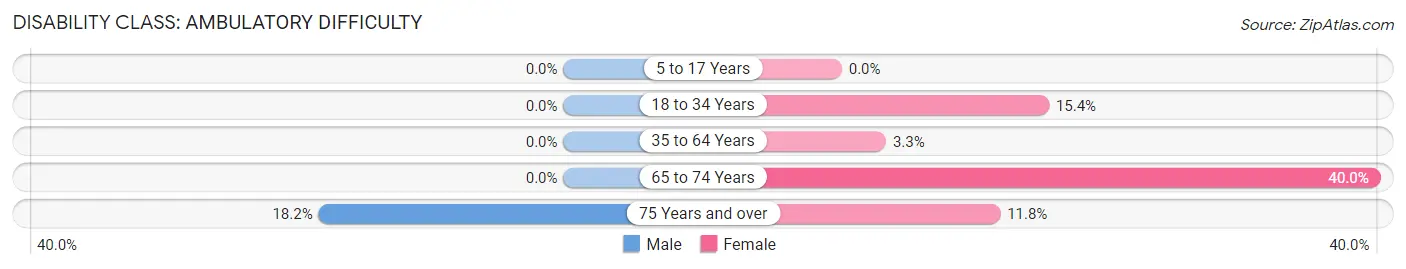
| Age Bracket | Male | Female |
| 5 to 17 Years | 0 (0.0%) | 0 (0.0%) |
| 18 to 34 Years | 0 (0.0%) | 2 (15.4%) |
| 35 to 64 Years | 0 (0.0%) | 2 (3.3%) |
| 65 to 74 Years | 0 (0.0%) | 8 (40.0%) |
| 75 Years and over | 4 (18.2%) | 2 (11.8%) |
Disability Class: Self-Care Difficulty
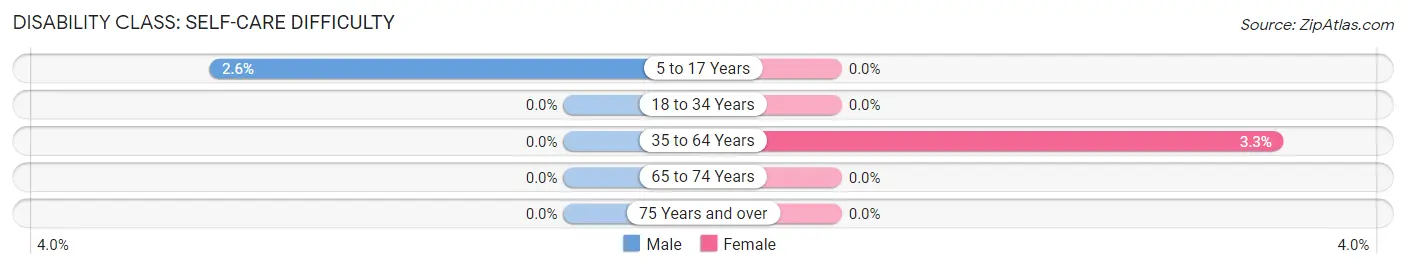
| Age Bracket | Male | Female |
| 5 to 17 Years | 1 (2.6%) | 0 (0.0%) |
| 18 to 34 Years | 0 (0.0%) | 0 (0.0%) |
| 35 to 64 Years | 0 (0.0%) | 2 (3.3%) |
| 65 to 74 Years | 0 (0.0%) | 0 (0.0%) |
| 75 Years and over | 0 (0.0%) | 0 (0.0%) |
Technology Access in Reevesville
Computing Device Access in Reevesville
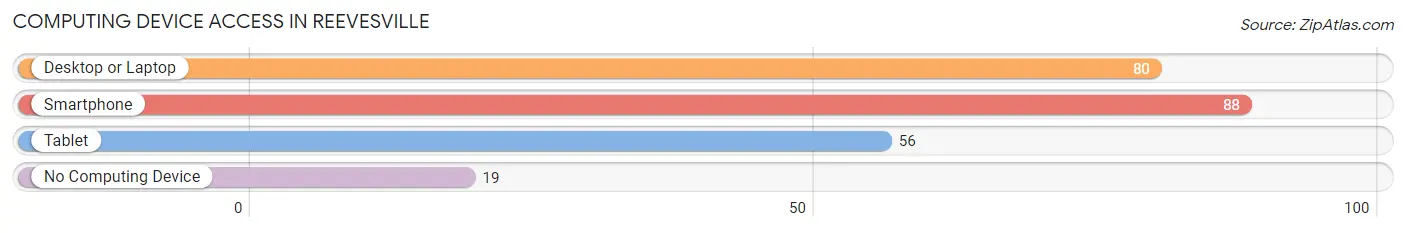
| Device Type | # Households | % Households |
| Desktop or Laptop | 80 | 74.8% |
| Smartphone | 88 | 82.2% |
| Tablet | 56 | 52.3% |
| No Computing Device | 19 | 17.8% |
| Total | 107 | 100.0% |
Internet Access in Reevesville
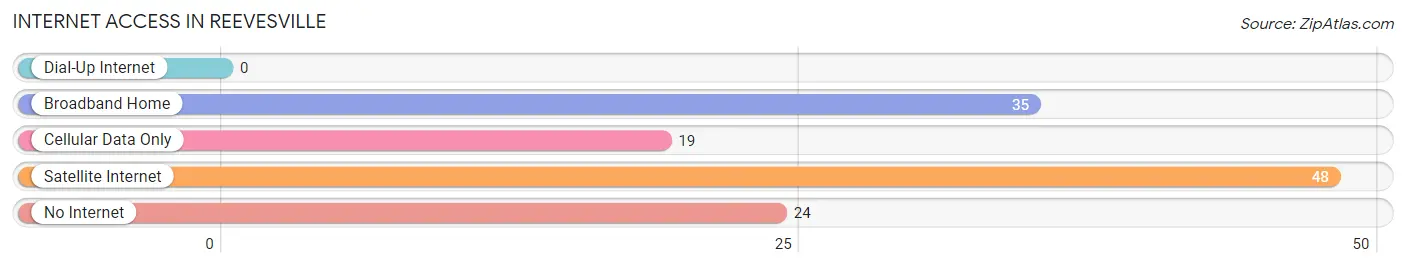
| Internet Type | # Households | % Households |
| Dial-Up Internet | 0 | 0.0% |
| Broadband Home | 35 | 32.7% |
| Cellular Data Only | 19 | 17.8% |
| Satellite Internet | 48 | 44.9% |
| No Internet | 24 | 22.4% |
| Total | 107 | 100.0% |
Reevesville Summary
Reevesville is a small town located in Dorchester County, South Carolina. It is situated on the banks of the Ashley River, about 20 miles northwest of Charleston. The town was founded in 1820 and named after the Reeves family, who were among the first settlers in the area.
Geography
Reevesville is located in the Lowcountry region of South Carolina, which is characterized by its flat terrain and coastal plains. The town is situated on the banks of the Ashley River, which is a major tributary of the Cooper River. The town is surrounded by forests and wetlands, and is home to a variety of wildlife, including deer, wild turkeys, and alligators. The town is also located near the Francis Marion National Forest, which is a popular destination for outdoor recreation.
Economy
Reevesville is a small, rural town with a population of just over 500 people. The town’s economy is largely based on agriculture, with many of the town’s residents employed in farming and related industries. The town is also home to several small businesses, including a grocery store, a hardware store, and a few restaurants.
Demographics
As of the 2010 census, the population of Reevesville was 514 people. The racial makeup of the town was 94.3% White, 3.3% African American, 0.6% Native American, 0.2% Asian, and 1.6% from other races. The median household income was $37,500, and the median age was 44.
History
Reevesville was founded in 1820 by the Reeves family, who were among the first settlers in the area. The town was originally known as Reevesville Crossroads, and was a popular stop for travelers on their way to Charleston. In the late 19th century, the town was home to a cotton mill, which provided employment for many of the town’s residents. The mill closed in the early 20th century, and the town’s economy shifted to agriculture.
Today, Reevesville is a small, rural town with a population of just over 500 people. The town is home to a variety of businesses, including a grocery store, a hardware store, and a few restaurants. The town is also home to a number of historic sites, including the Reevesville Cemetery, which is the final resting place of many of the town’s earliest settlers.
Common Questions
What is Per Capita Income in Reevesville?
Per Capita income in Reevesville is $22,406.
What is the Median Family Income in Reevesville?
Median Family Income in Reevesville is $70,417.
What is the Median Household income in Reevesville?
Median Household Income in Reevesville is $57,031.
What is Income or Wage Gap in Reevesville?
Income or Wage Gap in Reevesville is 47.2%.
Women in Reevesville earn 52.8 cents for every dollar earned by a man.
What is Inequality or Gini Index in Reevesville?
Inequality or Gini Index in Reevesville is 0.35.
What is the Total Population of Reevesville?
Total Population of Reevesville is 272.
What is the Total Male Population of Reevesville?
Total Male Population of Reevesville is 136.
What is the Total Female Population of Reevesville?
Total Female Population of Reevesville is 136.
What is the Ratio of Males per 100 Females in Reevesville?
There are 100.00 Males per 100 Females in Reevesville.
What is the Ratio of Females per 100 Males in Reevesville?
There are 100.00 Females per 100 Males in Reevesville.
What is the Median Population Age in Reevesville?
Median Population Age in Reevesville is 41.1 Years.
What is the Average Family Size in Reevesville
Average Family Size in Reevesville is 2.8 People.
What is the Average Household Size in Reevesville
Average Household Size in Reevesville is 2.5 People.
How Large is the Labor Force in Reevesville?
There are 119 People in the Labor Forcein in Reevesville.
What is the Percentage of People in the Labor Force in Reevesville?
57.8% of People are in the Labor Force in Reevesville.
What is the Unemployment Rate in Reevesville?
Unemployment Rate in Reevesville is 2.5%.