Pawleys Island, SC Map & Demographics
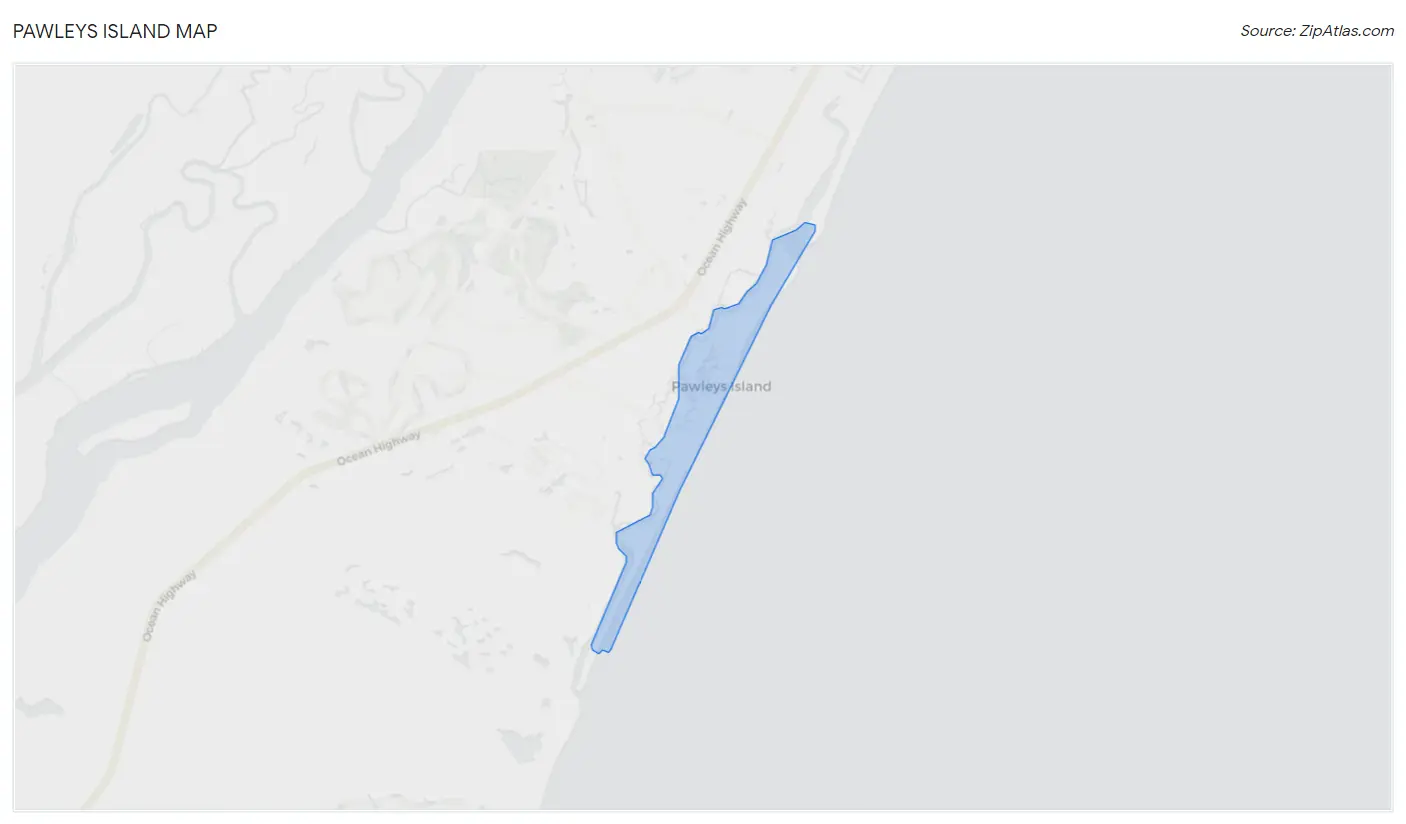
Pawleys Island Map
Pawleys Island Overview
$146,647
PER CAPITA INCOME
$162,500
AVG FAMILY INCOME
$91,250
AVG HOUSEHOLD INCOME
0.65
INEQUALITY / GINI INDEX
104
TOTAL POPULATION
45
MALE POPULATION
59
FEMALE POPULATION
76.27
MALES / 100 FEMALES
131.11
FEMALES / 100 MALES
70.4
MEDIAN AGE
2.0
AVG FAMILY SIZE
1.6
AVG HOUSEHOLD SIZE
28
LABOR FORCE [ PEOPLE ]
27.5%
PERCENT IN LABOR FORCE
Pawleys Island Zip Codes
Pawleys Island Area Codes
Income in Pawleys Island
Income Overview in Pawleys Island
Per Capita Income in Pawleys Island is $146,647, while median incomes of families and households are $162,500 and $91,250 respectively.
| Characteristic | Number | Measure |
| Per Capita Income | 104 | $146,647 |
| Median Family Income | 38 | $162,500 |
| Mean Family Income | 38 | $326,671 |
| Median Household Income | 64 | $91,250 |
| Mean Household Income | 64 | $224,528 |
| Income Deficit | 38 | $0 |
| Wage / Income Gap (%) | 104 | 0.00% |
| Wage / Income Gap ($) | 104 | 100.00¢ per $1 |
| Gini / Inequality Index | 104 | 0.65 |
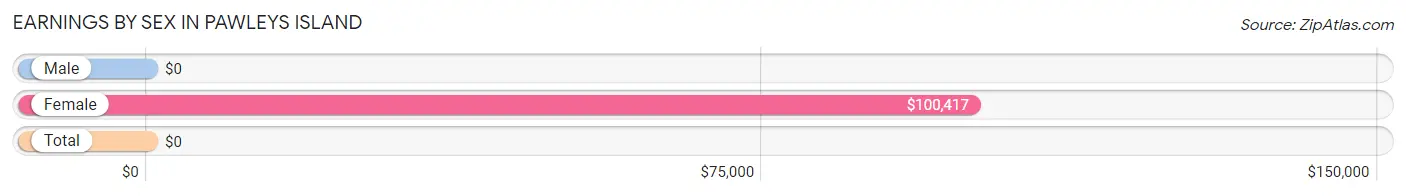
Earnings by Sex in Pawleys Island
| Sex | Number | Average Earnings |
| Male | 21 (65.6%) | $0 |
| Female | 11 (34.4%) | $100,417 |
| Total | 32 (100.0%) | $0 |
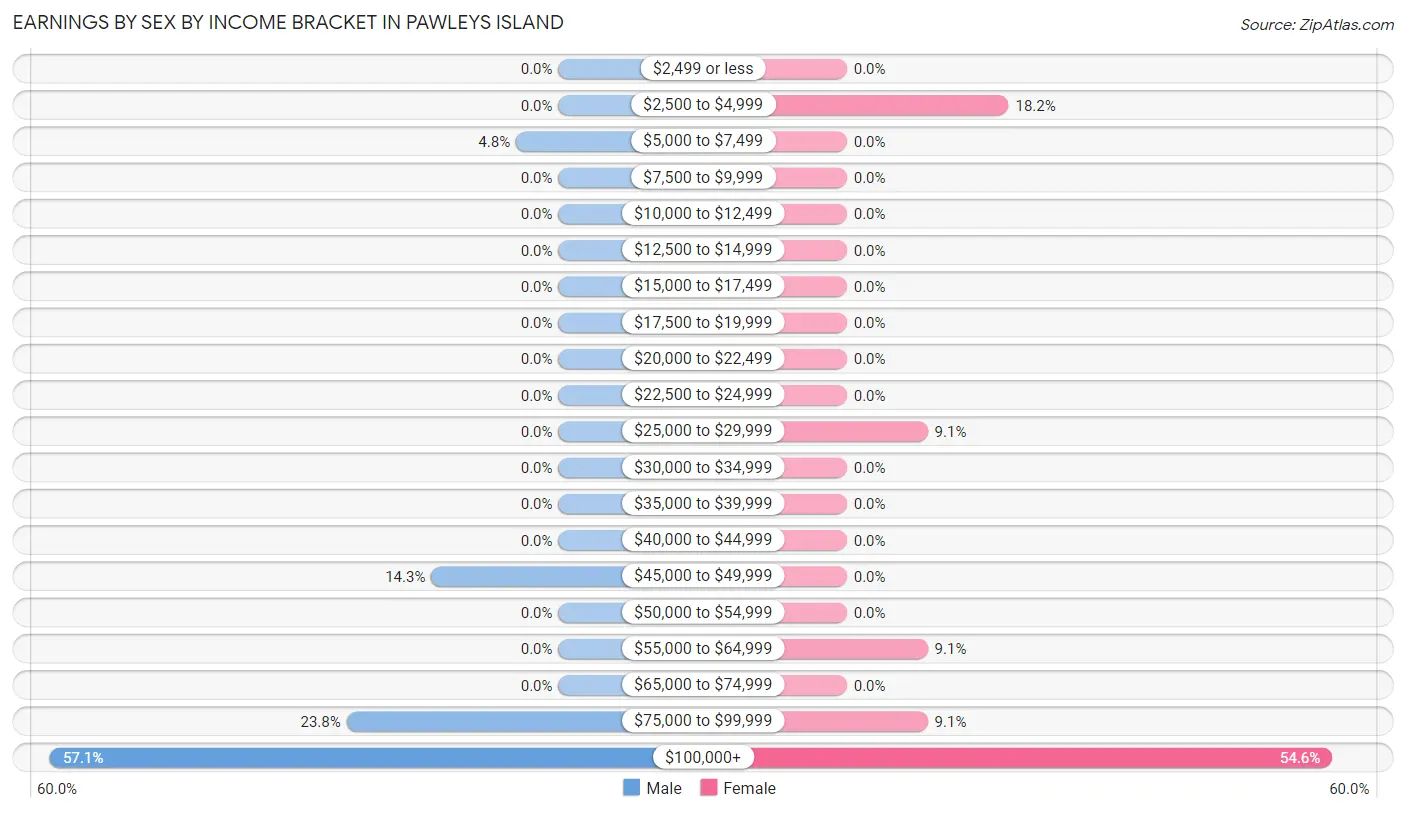
Earnings by Sex by Income Bracket in Pawleys Island
The most common earnings brackets in Pawleys Island are $100,000+ for men (12 | 57.1%) and $100,000+ for women (6 | 54.5%).
| Income | Male | Female |
| $2,499 or less | 0 (0.0%) | 0 (0.0%) |
| $2,500 to $4,999 | 0 (0.0%) | 2 (18.2%) |
| $5,000 to $7,499 | 1 (4.8%) | 0 (0.0%) |
| $7,500 to $9,999 | 0 (0.0%) | 0 (0.0%) |
| $10,000 to $12,499 | 0 (0.0%) | 0 (0.0%) |
| $12,500 to $14,999 | 0 (0.0%) | 0 (0.0%) |
| $15,000 to $17,499 | 0 (0.0%) | 0 (0.0%) |
| $17,500 to $19,999 | 0 (0.0%) | 0 (0.0%) |
| $20,000 to $22,499 | 0 (0.0%) | 0 (0.0%) |
| $22,500 to $24,999 | 0 (0.0%) | 0 (0.0%) |
| $25,000 to $29,999 | 0 (0.0%) | 1 (9.1%) |
| $30,000 to $34,999 | 0 (0.0%) | 0 (0.0%) |
| $35,000 to $39,999 | 0 (0.0%) | 0 (0.0%) |
| $40,000 to $44,999 | 0 (0.0%) | 0 (0.0%) |
| $45,000 to $49,999 | 3 (14.3%) | 0 (0.0%) |
| $50,000 to $54,999 | 0 (0.0%) | 0 (0.0%) |
| $55,000 to $64,999 | 0 (0.0%) | 1 (9.1%) |
| $65,000 to $74,999 | 0 (0.0%) | 0 (0.0%) |
| $75,000 to $99,999 | 5 (23.8%) | 1 (9.1%) |
| $100,000+ | 12 (57.1%) | 6 (54.5%) |
| Total | 21 (100.0%) | 11 (100.0%) |
Earnings by Sex by Educational Attainment in Pawleys Island
| Educational Attainment | Male Income | Female Income |
| Less than High School | - | - |
| High School Diploma | - | - |
| College or Associate's Degree | - | - |
| Bachelor's Degree | - | - |
| Graduate Degree | - | - |
| Total | - | - |
Family Income in Pawleys Island
Family Income Brackets in Pawleys Island
According to the Pawleys Island family income data, there are 16 families falling into the $200,000+ income range, which is the most common income bracket and makes up 42.1% of all families.
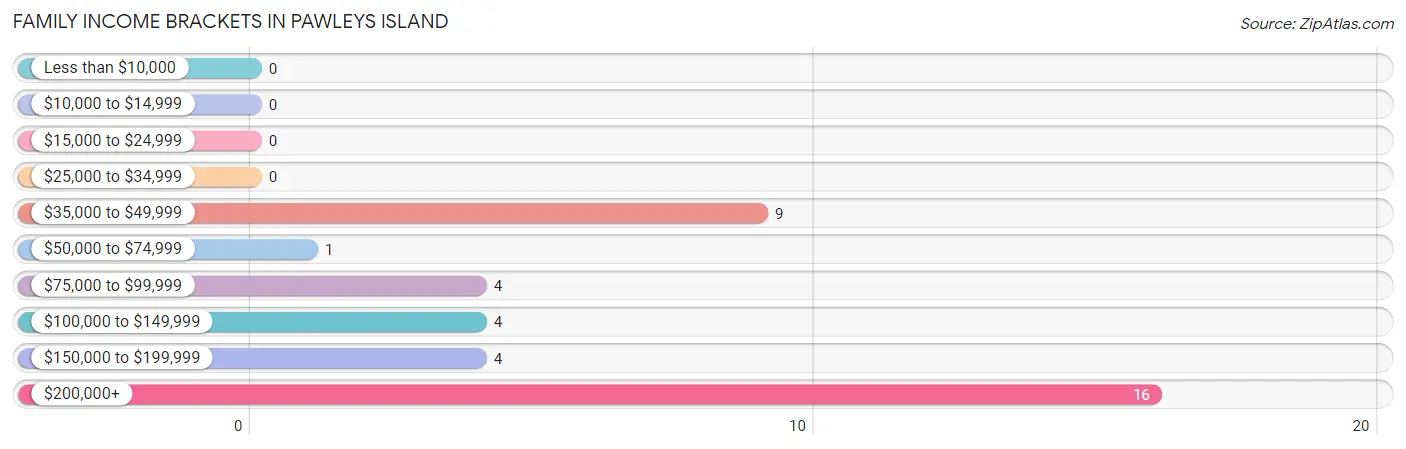
| Income Bracket | # Families | % Families |
| Less than $10,000 | 0 | 0.0% |
| $10,000 to $14,999 | 0 | 0.0% |
| $15,000 to $24,999 | 0 | 0.0% |
| $25,000 to $34,999 | 0 | 0.0% |
| $35,000 to $49,999 | 9 | 23.7% |
| $50,000 to $74,999 | 1 | 2.6% |
| $75,000 to $99,999 | 4 | 10.5% |
| $100,000 to $149,999 | 4 | 10.5% |
| $150,000 to $199,999 | 4 | 10.5% |
| $200,000+ | 16 | 42.1% |
Family Income by Famaliy Size in Pawleys Island
2-person families (38 | 100.0%) account for the highest median family income in Pawleys Island with $162,500 per family, while 2-person families (38 | 100.0%) have the highest median income of $81,250 per family member.
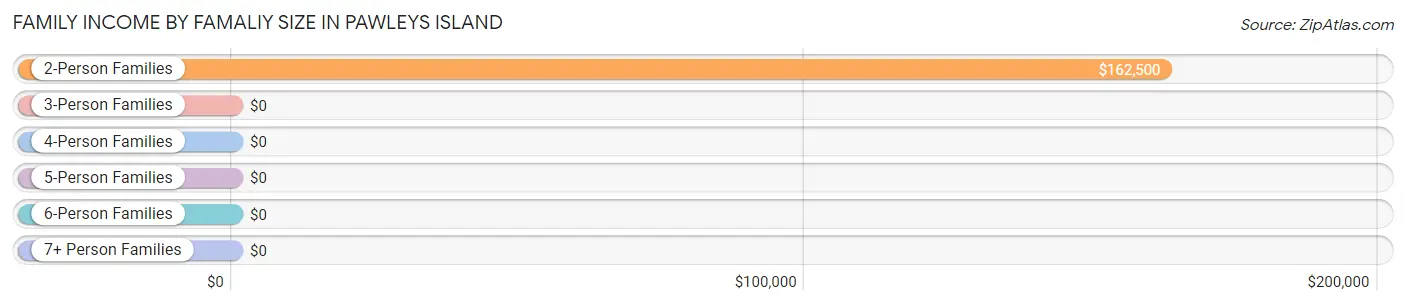
| Income Bracket | # Families | Median Income |
| 2-Person Families | 38 (100.0%) | $162,500 |
| 3-Person Families | 0 (0.0%) | $0 |
| 4-Person Families | 0 (0.0%) | $0 |
| 5-Person Families | 0 (0.0%) | $0 |
| 6-Person Families | 0 (0.0%) | $0 |
| 7+ Person Families | 0 (0.0%) | $0 |
| Total | 38 (100.0%) | $162,500 |
Family Income by Number of Earners in Pawleys Island
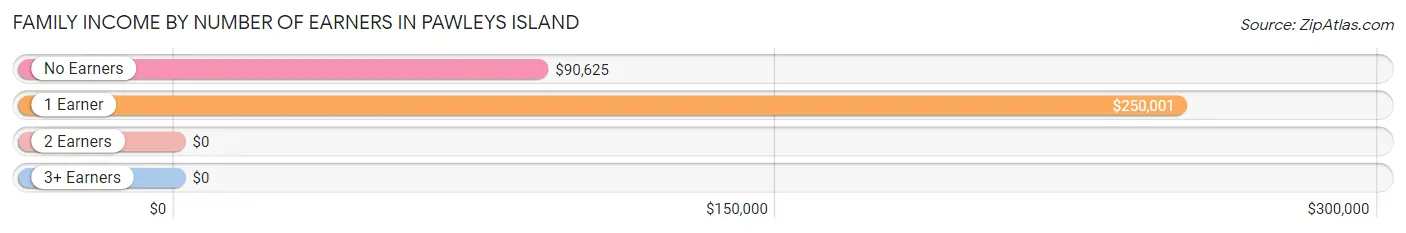
| Number of Earners | # Families | Median Income |
| No Earners | 19 (50.0%) | $90,625 |
| 1 Earner | 18 (47.4%) | $250,001 |
| 2 Earners | 1 (2.6%) | $0 |
| 3+ Earners | 0 (0.0%) | $0 |
| Total | 38 (100.0%) | $162,500 |
Household Income in Pawleys Island
Household Income Brackets in Pawleys Island
With 18 households falling in the category, the $200,000+ income range is the most frequent in Pawleys Island, accounting for 28.1% of all households. In contrast, only 1 households (1.6%) fall into the $15,000 to $24,999 income bracket, making it the least populous group.
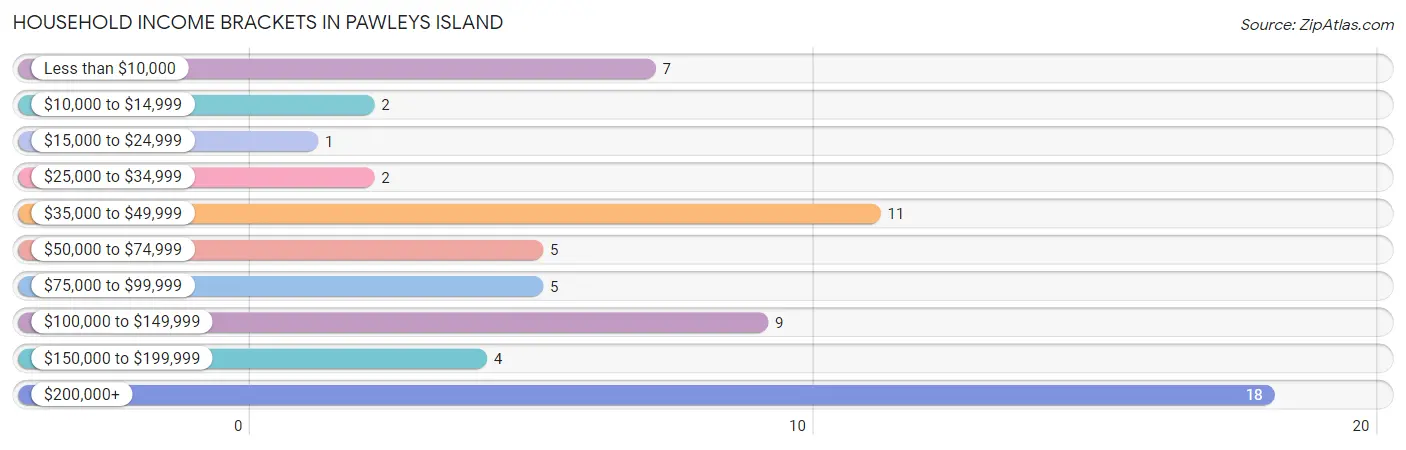
| Income Bracket | # Households | % Households |
| Less than $10,000 | 7 | 10.9% |
| $10,000 to $14,999 | 2 | 3.1% |
| $15,000 to $24,999 | 1 | 1.6% |
| $25,000 to $34,999 | 2 | 3.1% |
| $35,000 to $49,999 | 11 | 17.2% |
| $50,000 to $74,999 | 5 | 7.8% |
| $75,000 to $99,999 | 5 | 7.8% |
| $100,000 to $149,999 | 9 | 14.1% |
| $150,000 to $199,999 | 4 | 6.3% |
| $200,000+ | 18 | 28.1% |
Household Income by Householder Age in Pawleys Island
The median household income in Pawleys Island is $91,250, with the highest median household income of $250,001 found in the 45 to 64 years age bracket for the primary householder. A total of 17 households (26.6%) fall into this category.
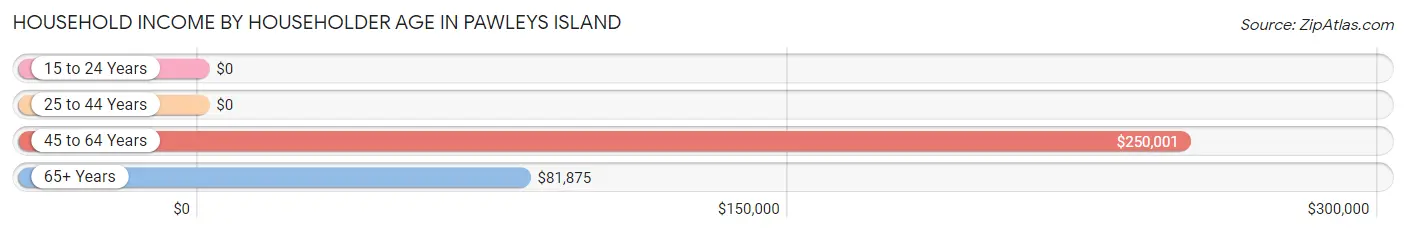
| Income Bracket | # Households | Median Income |
| 15 to 24 Years | 0 (0.0%) | $0 |
| 25 to 44 Years | 0 (0.0%) | $0 |
| 45 to 64 Years | 17 (26.6%) | $250,001 |
| 65+ Years | 47 (73.4%) | $81,875 |
| Total | 64 (100.0%) | $91,250 |
Poverty in Pawleys Island
Income Below Poverty by Sex and Age in Pawleys Island
With 2.2% poverty level for males and 11.9% for females among the residents of Pawleys Island, 45 to 54 year old males and 45 to 54 year old females are the most vulnerable to poverty, with 1 males (100.0%) and 3 females (60.0%) in their respective age groups living below the poverty level.
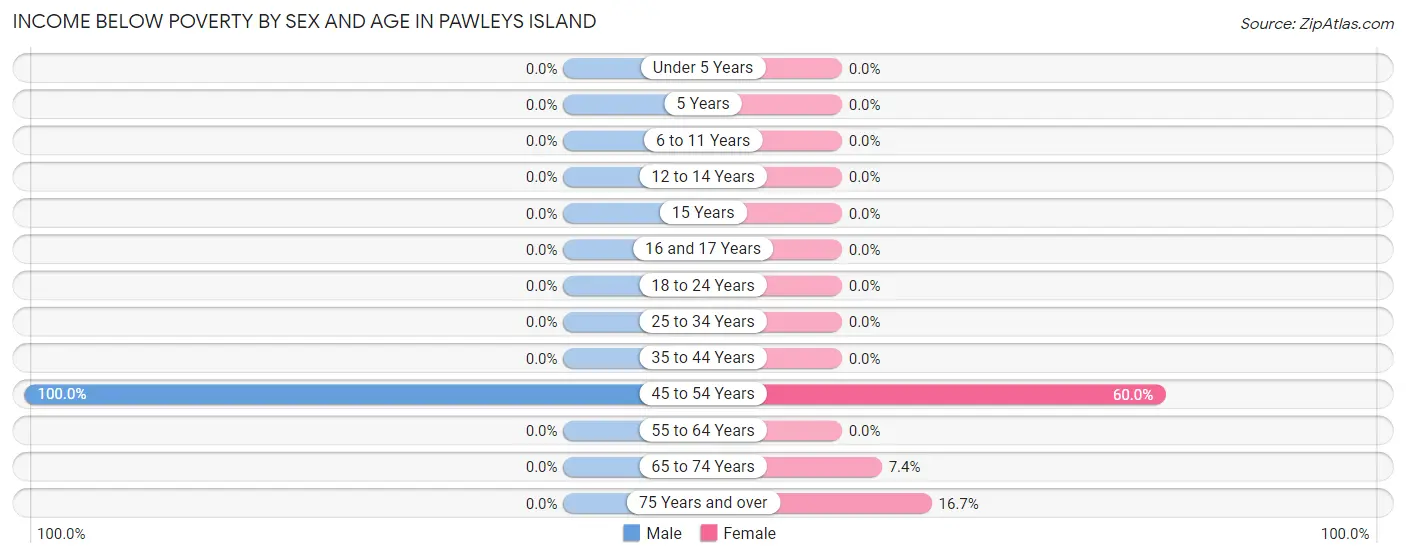
| Age Bracket | Male | Female |
| Under 5 Years | 0 (0.0%) | 0 (0.0%) |
| 5 Years | 0 (0.0%) | 0 (0.0%) |
| 6 to 11 Years | 0 (0.0%) | 0 (0.0%) |
| 12 to 14 Years | 0 (0.0%) | 0 (0.0%) |
| 15 Years | 0 (0.0%) | 0 (0.0%) |
| 16 and 17 Years | 0 (0.0%) | 0 (0.0%) |
| 18 to 24 Years | 0 (0.0%) | 0 (0.0%) |
| 25 to 34 Years | 0 (0.0%) | 0 (0.0%) |
| 35 to 44 Years | 0 (0.0%) | 0 (0.0%) |
| 45 to 54 Years | 1 (100.0%) | 3 (60.0%) |
| 55 to 64 Years | 0 (0.0%) | 0 (0.0%) |
| 65 to 74 Years | 0 (0.0%) | 2 (7.4%) |
| 75 Years and over | 0 (0.0%) | 2 (16.7%) |
| Total | 1 (2.2%) | 7 (11.9%) |
Income Above Poverty by Sex and Age in Pawleys Island
According to the poverty statistics in Pawleys Island, males aged 6 to 11 years and females aged 55 to 64 years are the age groups that are most secure financially, with 100.0% of males and 100.0% of females in these age groups living above the poverty line.
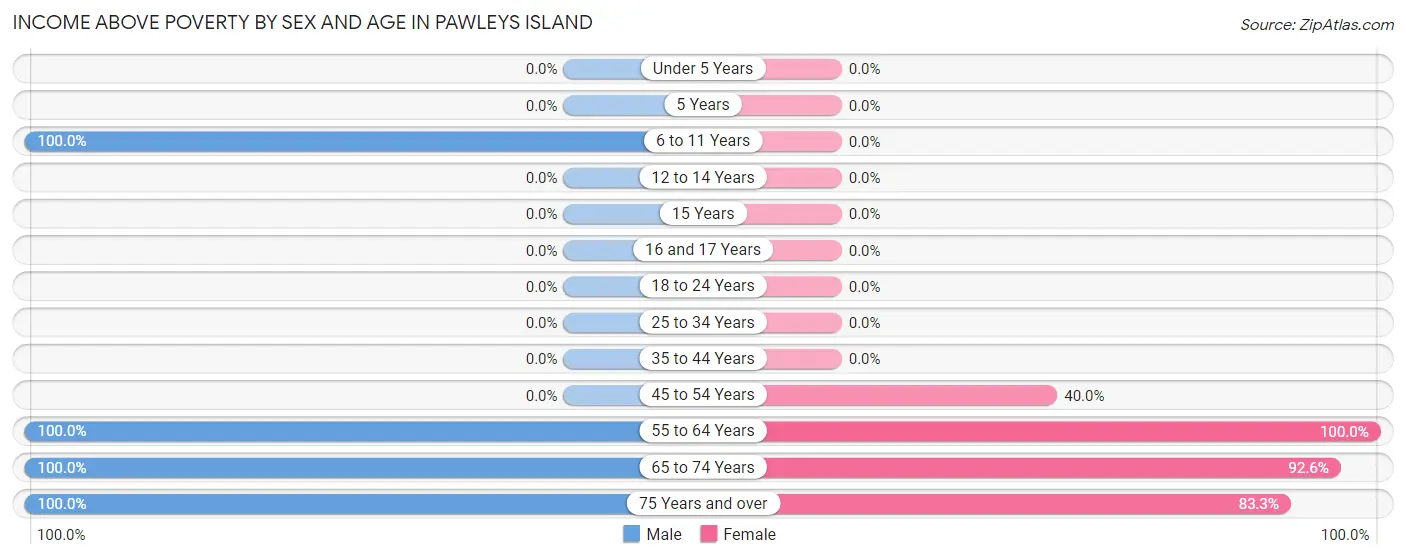
| Age Bracket | Male | Female |
| Under 5 Years | 0 (0.0%) | 0 (0.0%) |
| 5 Years | 0 (0.0%) | 0 (0.0%) |
| 6 to 11 Years | 2 (100.0%) | 0 (0.0%) |
| 12 to 14 Years | 0 (0.0%) | 0 (0.0%) |
| 15 Years | 0 (0.0%) | 0 (0.0%) |
| 16 and 17 Years | 0 (0.0%) | 0 (0.0%) |
| 18 to 24 Years | 0 (0.0%) | 0 (0.0%) |
| 25 to 34 Years | 0 (0.0%) | 0 (0.0%) |
| 35 to 44 Years | 0 (0.0%) | 0 (0.0%) |
| 45 to 54 Years | 0 (0.0%) | 2 (40.0%) |
| 55 to 64 Years | 7 (100.0%) | 15 (100.0%) |
| 65 to 74 Years | 24 (100.0%) | 25 (92.6%) |
| 75 Years and over | 11 (100.0%) | 10 (83.3%) |
| Total | 44 (97.8%) | 52 (88.1%) |
Income Below Poverty Among Married-Couple Families in Pawleys Island
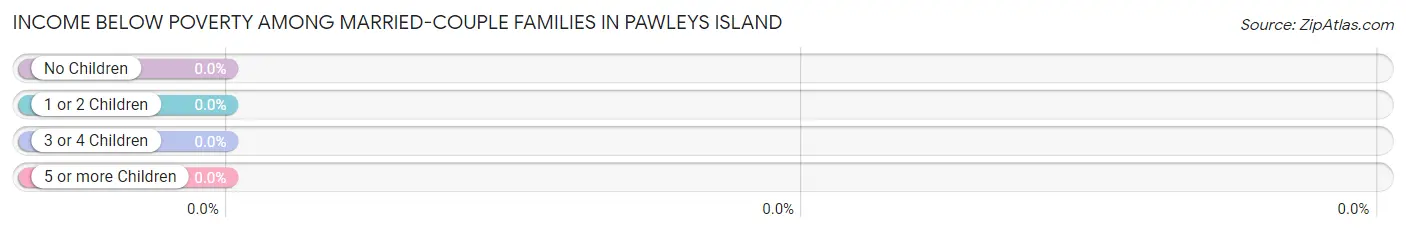
| Children | Above Poverty | Below Poverty |
| No Children | 36 (100.0%) | 0 (0.0%) |
| 1 or 2 Children | 0 (0.0%) | 0 (0.0%) |
| 3 or 4 Children | 0 (0.0%) | 0 (0.0%) |
| 5 or more Children | 0 (0.0%) | 0 (0.0%) |
| Total | 36 (100.0%) | 0 (0.0%) |
Income Below Poverty Among Single-Parent Households in Pawleys Island
| Children | Single Father | Single Mother |
| No Children | 0 (0.0%) | 0 (0.0%) |
| 1 or 2 Children | 0 (0.0%) | 0 (0.0%) |
| 3 or 4 Children | 0 (0.0%) | 0 (0.0%) |
| 5 or more Children | 0 (0.0%) | 0 (0.0%) |
| Total | 0 (0.0%) | 0 (0.0%) |
Income Below Poverty Among Married-Couple vs Single-Parent Households in Pawleys Island
| Children | Married-Couple Families | Single-Parent Households |
| No Children | 0 (0.0%) | 0 (0.0%) |
| 1 or 2 Children | 0 (0.0%) | 0 (0.0%) |
| 3 or 4 Children | 0 (0.0%) | 0 (0.0%) |
| 5 or more Children | 0 (0.0%) | 0 (0.0%) |
| Total | 0 (0.0%) | 0 (0.0%) |
Race in Pawleys Island
The most populous races in Pawleys Island are , and White / Caucasian (104 | 100.0%).
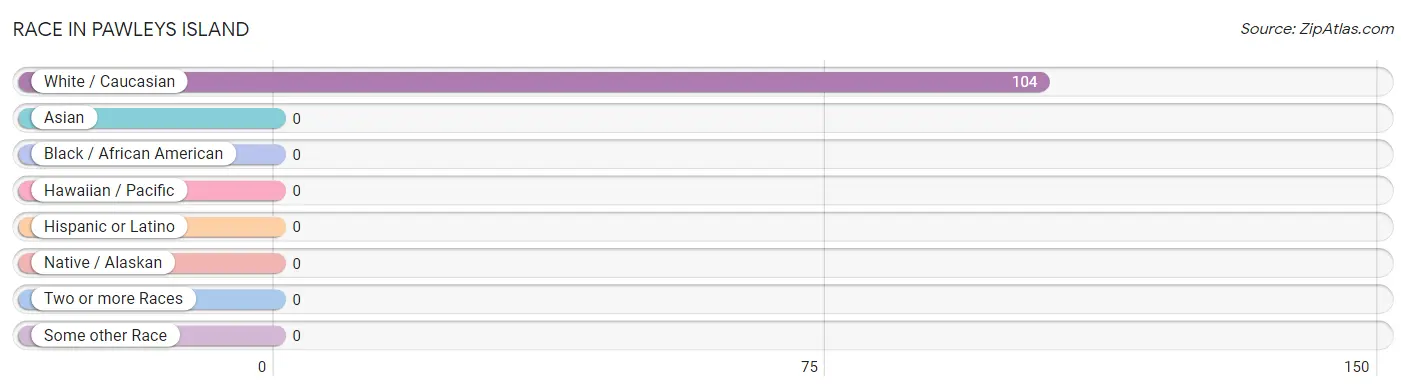
| Race | # Population | % Population |
| Asian | 0 | 0.0% |
| Black / African American | 0 | 0.0% |
| Hawaiian / Pacific | 0 | 0.0% |
| Hispanic or Latino | 0 | 0.0% |
| Native / Alaskan | 0 | 0.0% |
| White / Caucasian | 104 | 100.0% |
| Two or more Races | 0 | 0.0% |
| Some other Race | 0 | 0.0% |
| Total | 104 | 100.0% |
Ancestry in Pawleys Island
The most populous ancestries reported in Pawleys Island are English (38 | 36.5%), Irish (12 | 11.5%), Scotch-Irish (9 | 8.6%), Scottish (9 | 8.6%), and German (7 | 6.7%), together accounting for 72.1% of all Pawleys Island residents.
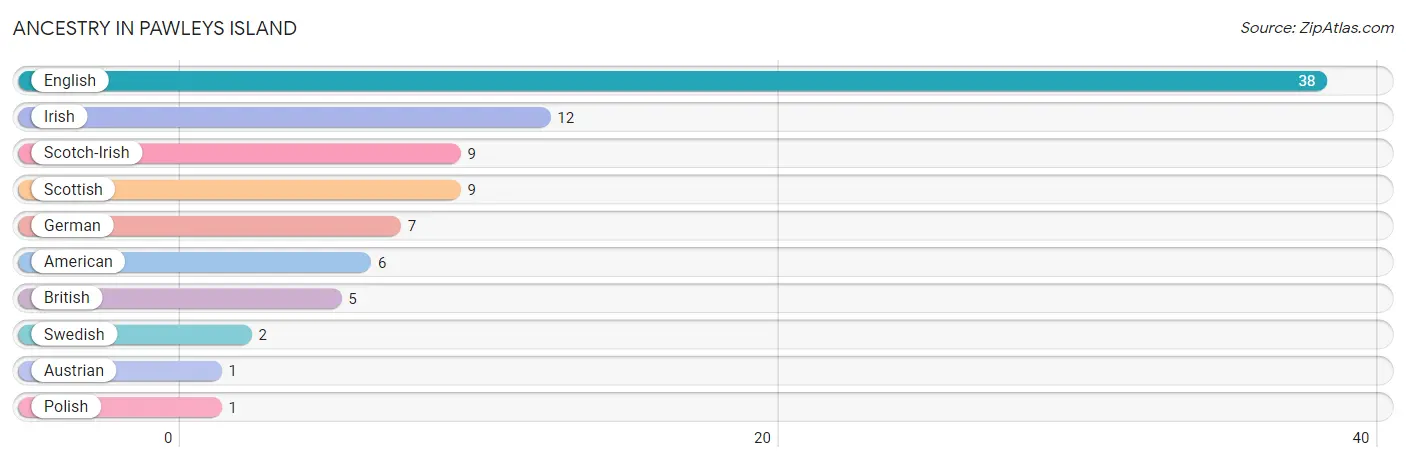
| Ancestry | # Population | % Population |
| American | 6 | 5.8% |
| Austrian | 1 | 1.0% |
| British | 5 | 4.8% |
| English | 38 | 36.5% |
| German | 7 | 6.7% |
| Irish | 12 | 11.5% |
| Polish | 1 | 1.0% |
| Scotch-Irish | 9 | 8.6% |
| Scottish | 9 | 8.6% |
| Swedish | 2 | 1.9% | View All 10 Rows |
Immigrants in Pawleys Island

| Immigration Origin | # Population | % Population | View All 0 Rows |
Sex and Age in Pawleys Island
Sex and Age in Pawleys Island
The most populous age groups in Pawleys Island are 65 to 69 Years (13 | 28.9%) for men and 70 to 74 Years (20 | 33.9%) for women.
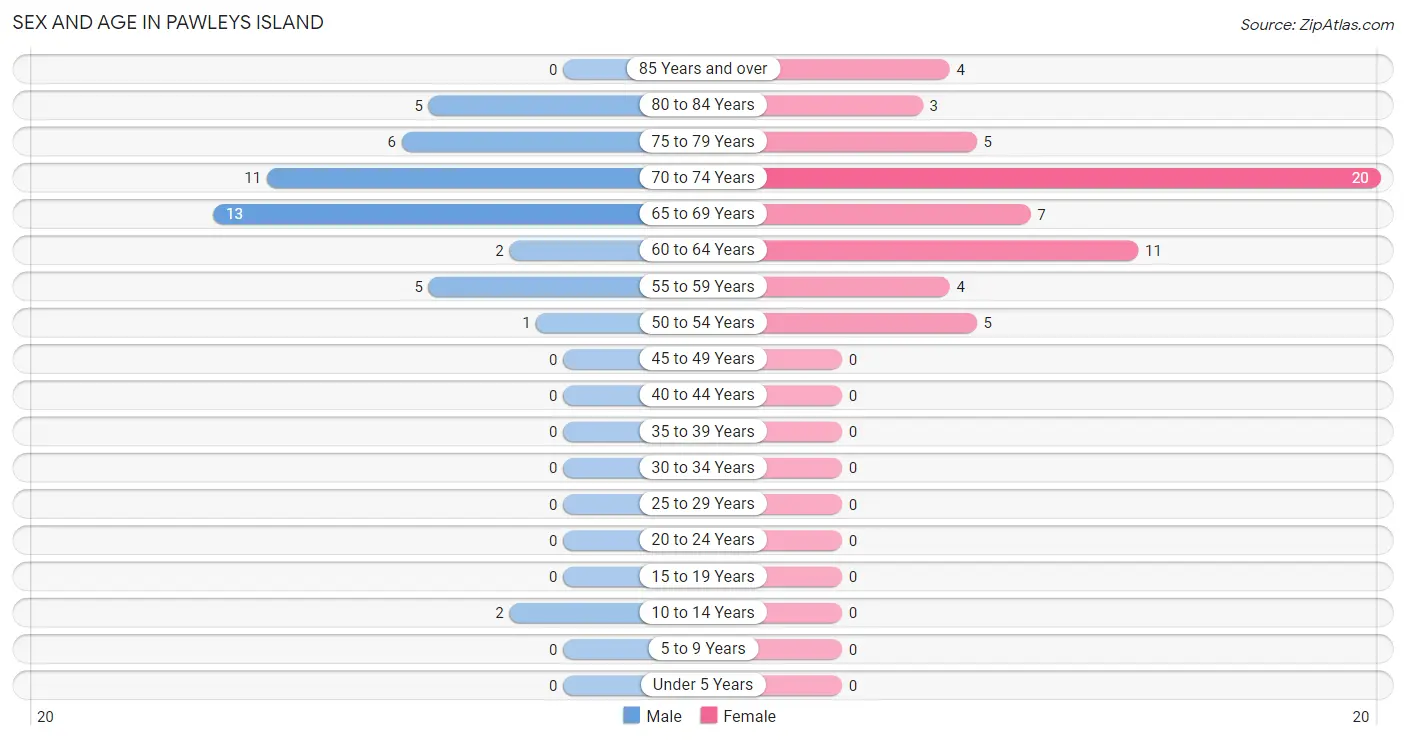
| Age Bracket | Male | Female |
| Under 5 Years | 0 (0.0%) | 0 (0.0%) |
| 5 to 9 Years | 0 (0.0%) | 0 (0.0%) |
| 10 to 14 Years | 2 (4.4%) | 0 (0.0%) |
| 15 to 19 Years | 0 (0.0%) | 0 (0.0%) |
| 20 to 24 Years | 0 (0.0%) | 0 (0.0%) |
| 25 to 29 Years | 0 (0.0%) | 0 (0.0%) |
| 30 to 34 Years | 0 (0.0%) | 0 (0.0%) |
| 35 to 39 Years | 0 (0.0%) | 0 (0.0%) |
| 40 to 44 Years | 0 (0.0%) | 0 (0.0%) |
| 45 to 49 Years | 0 (0.0%) | 0 (0.0%) |
| 50 to 54 Years | 1 (2.2%) | 5 (8.5%) |
| 55 to 59 Years | 5 (11.1%) | 4 (6.8%) |
| 60 to 64 Years | 2 (4.4%) | 11 (18.6%) |
| 65 to 69 Years | 13 (28.9%) | 7 (11.9%) |
| 70 to 74 Years | 11 (24.4%) | 20 (33.9%) |
| 75 to 79 Years | 6 (13.3%) | 5 (8.5%) |
| 80 to 84 Years | 5 (11.1%) | 3 (5.1%) |
| 85 Years and over | 0 (0.0%) | 4 (6.8%) |
| Total | 45 (100.0%) | 59 (100.0%) |
Families and Households in Pawleys Island
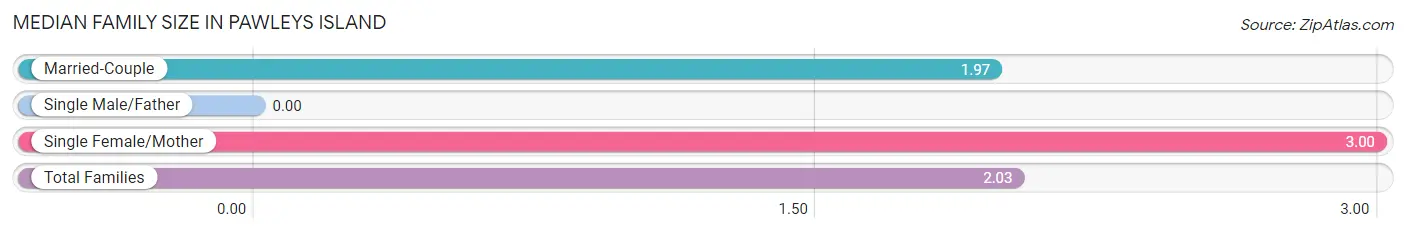
Median Family Size in Pawleys Island
| Family Type | # Families | Family Size |
| Married-Couple | 36 (94.7%) | 1.97 |
| Single Male/Father | 0 (0.0%) | - |
| Single Female/Mother | 2 (5.3%) | 3.00 |
| Total Families | 38 (100.0%) | 2.03 |
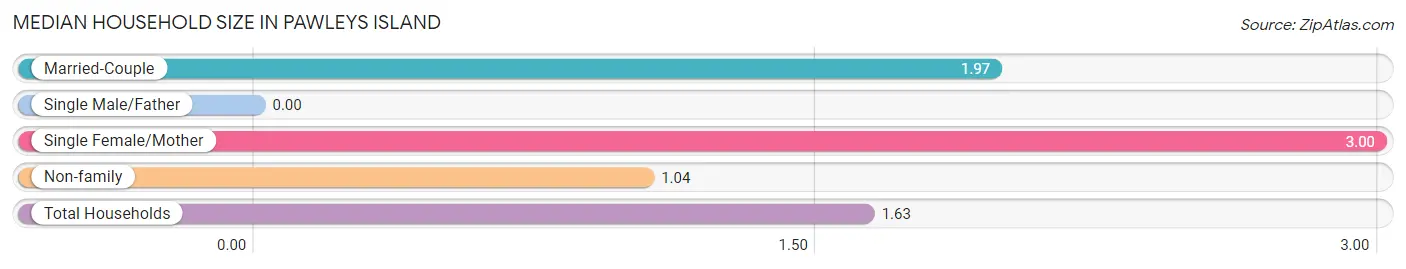
Median Household Size in Pawleys Island
| Household Type | # Households | Household Size |
| Married-Couple | 36 (56.2%) | 1.97 |
| Single Male/Father | 0 (0.0%) | - |
| Single Female/Mother | 2 (3.1%) | 3.00 |
| Non-family | 26 (40.6%) | 1.04 |
| Total Households | 64 (100.0%) | 1.63 |
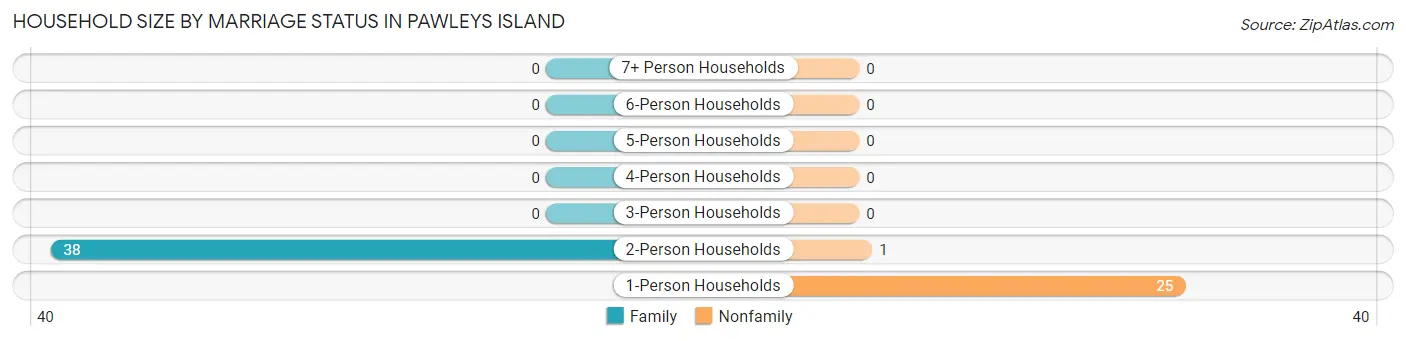
Household Size by Marriage Status in Pawleys Island
Out of a total of 64 households in Pawleys Island, 38 (59.4%) are family households, while 26 (40.6%) are nonfamily households. The most numerous type of family households are 2-person households, comprising 38, and the most common type of nonfamily households are 1-person households, comprising 25.
| Household Size | Family Households | Nonfamily Households |
| 1-Person Households | - | 25 (39.1%) |
| 2-Person Households | 38 (59.4%) | 1 (1.6%) |
| 3-Person Households | 0 (0.0%) | 0 (0.0%) |
| 4-Person Households | 0 (0.0%) | 0 (0.0%) |
| 5-Person Households | 0 (0.0%) | 0 (0.0%) |
| 6-Person Households | 0 (0.0%) | 0 (0.0%) |
| 7+ Person Households | 0 (0.0%) | 0 (0.0%) |
| Total | 38 (59.4%) | 26 (40.6%) |
Female Fertility in Pawleys Island
Fertility by Age in Pawleys Island
| Age Bracket | Women with Births | Births / 1,000 Women |
| 15 to 19 years | 0 (0.0%) | 0.0 |
| 20 to 34 years | 0 (0.0%) | 0.0 |
| 35 to 50 years | 0 (0.0%) | 0.0 |
| Total | 0 (0.0%) | 0.0 |
Fertility by Age by Marriage Status in Pawleys Island
| Age Bracket | Married | Unmarried |
| 15 to 19 years | 0 (0.0%) | 0 (0.0%) |
| 20 to 34 years | 0 (0.0%) | 0 (0.0%) |
| 35 to 50 years | 0 (0.0%) | 0 (0.0%) |
| Total | 0 (0.0%) | 0 (0.0%) |
Fertility by Education in Pawleys Island
| Educational Attainment | Women with Births | Births / 1,000 Women |
| Less than High School | 0 (0.0%) | 0.0 |
| High School Diploma | 0 (0.0%) | 0.0 |
| College or Associate's Degree | 0 (0.0%) | 0.0 |
| Bachelor's Degree | 0 (0.0%) | 0.0 |
| Graduate Degree | 0 (0.0%) | 0.0 |
| Total | 0 (0.0%) | 0.0 |
Fertility by Education by Marriage Status in Pawleys Island
| Educational Attainment | Married | Unmarried |
| Less than High School | 0 (0.0%) | 0 (0.0%) |
| High School Diploma | 0 (0.0%) | 0 (0.0%) |
| College or Associate's Degree | 0 (0.0%) | 0 (0.0%) |
| Bachelor's Degree | 0 (0.0%) | 0 (0.0%) |
| Graduate Degree | 0 (0.0%) | 0 (0.0%) |
| Total | 0 (0.0%) | 0 (0.0%) |
Employment Characteristics in Pawleys Island
Employment by Class of Employer in Pawleys Island
Among the 28 employed individuals in Pawleys Island, self-employed (not incorporated) (10 | 35.7%), private company employees (7 | 25.0%), and not-for-profit organizations (7 | 25.0%) make up the most common classes of employment.
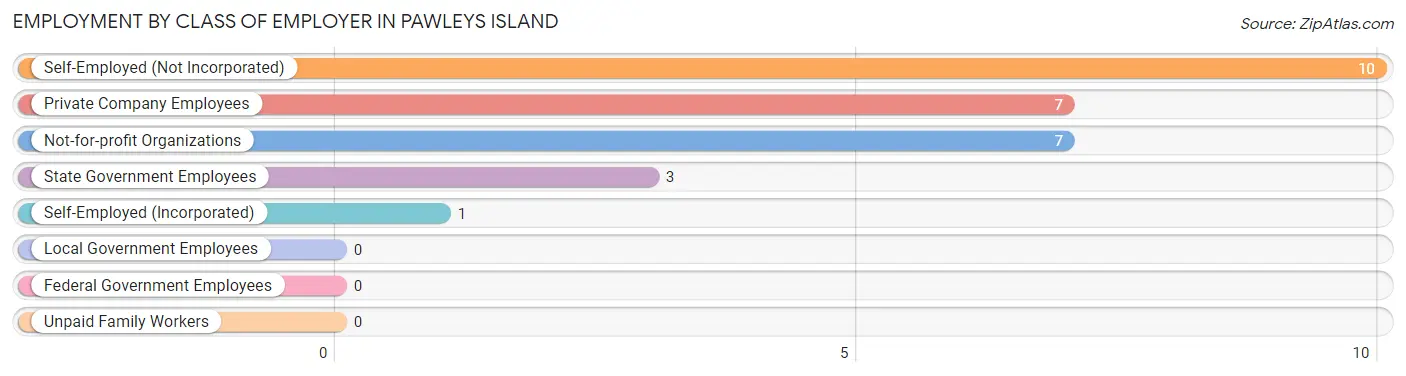
| Employer Class | # Employees | % Employees |
| Private Company Employees | 7 | 25.0% |
| Self-Employed (Incorporated) | 1 | 3.6% |
| Self-Employed (Not Incorporated) | 10 | 35.7% |
| Not-for-profit Organizations | 7 | 25.0% |
| Local Government Employees | 0 | 0.0% |
| State Government Employees | 3 | 10.7% |
| Federal Government Employees | 0 | 0.0% |
| Unpaid Family Workers | 0 | 0.0% |
| Total | 28 | 100.0% |
Employment Status by Age in Pawleys Island
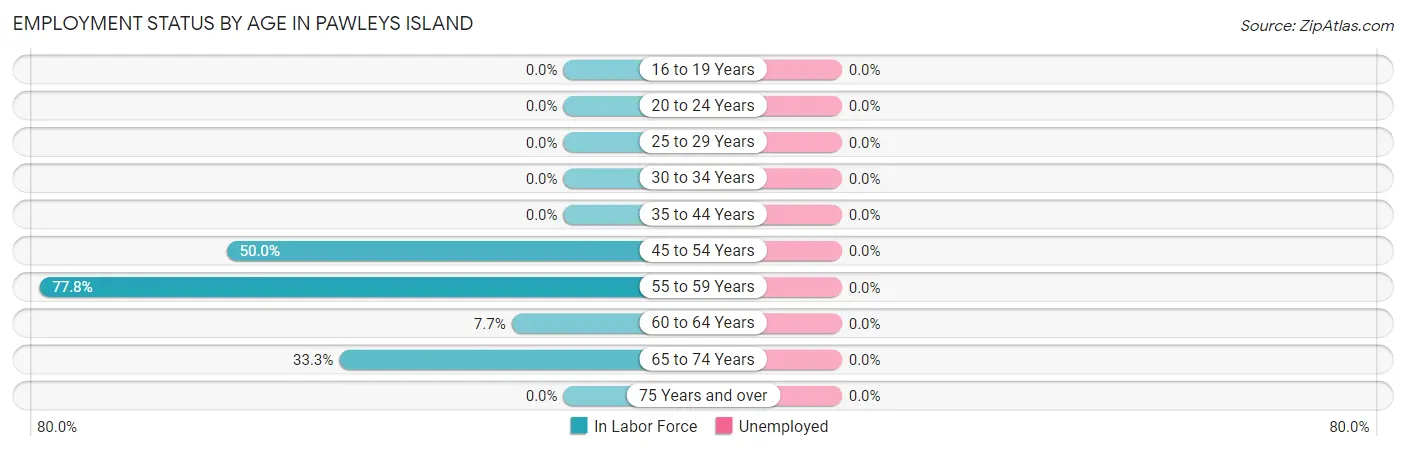
| Age Bracket | In Labor Force | Unemployed |
| 16 to 19 Years | 0 (0.0%) | 0 (0.0%) |
| 20 to 24 Years | 0 (0.0%) | 0 (0.0%) |
| 25 to 29 Years | 0 (0.0%) | 0 (0.0%) |
| 30 to 34 Years | 0 (0.0%) | 0 (0.0%) |
| 35 to 44 Years | 0 (0.0%) | 0 (0.0%) |
| 45 to 54 Years | 3 (50.0%) | 0 (0.0%) |
| 55 to 59 Years | 7 (77.8%) | 0 (0.0%) |
| 60 to 64 Years | 1 (7.7%) | 0 (0.0%) |
| 65 to 74 Years | 17 (33.3%) | 0 (0.0%) |
| 75 Years and over | 0 (0.0%) | 0 (0.0%) |
| Total | 28 (27.5%) | 0 (0.0%) |
Employment Status by Educational Attainment in Pawleys Island
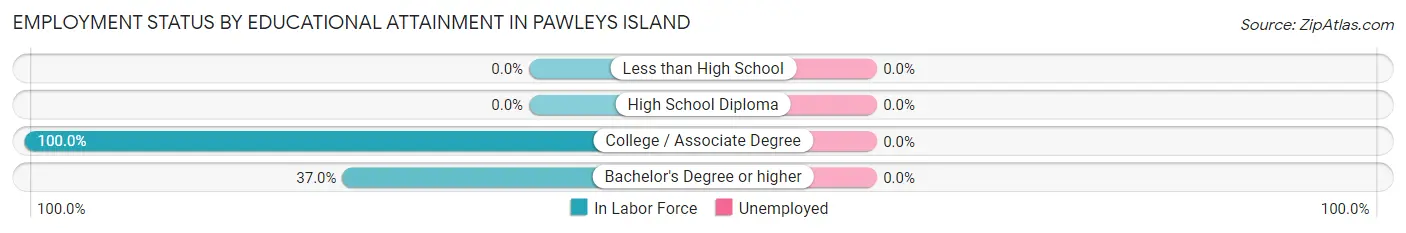
| Educational Attainment | In Labor Force | Unemployed |
| Less than High School | 0 (0.0%) | 0 (0.0%) |
| High School Diploma | 0 (0.0%) | 0 (0.0%) |
| College / Associate Degree | 1 (100.0%) | 0 (0.0%) |
| Bachelor's Degree or higher | 10 (37.0%) | 0 (0.0%) |
| Total | 11 (39.3%) | 0 (0.0%) |
Employment Occupations by Sex in Pawleys Island
Management, Business, Science and Arts Occupations
The most common Management, Business, Science and Arts occupations in Pawleys Island are Management (9 | 32.1%), Community & Social Service (7 | 25.0%), Health Diagnosing & Treating (6 | 21.4%), Health Technologists (6 | 21.4%), and Education Instruction & Library (3 | 10.7%).
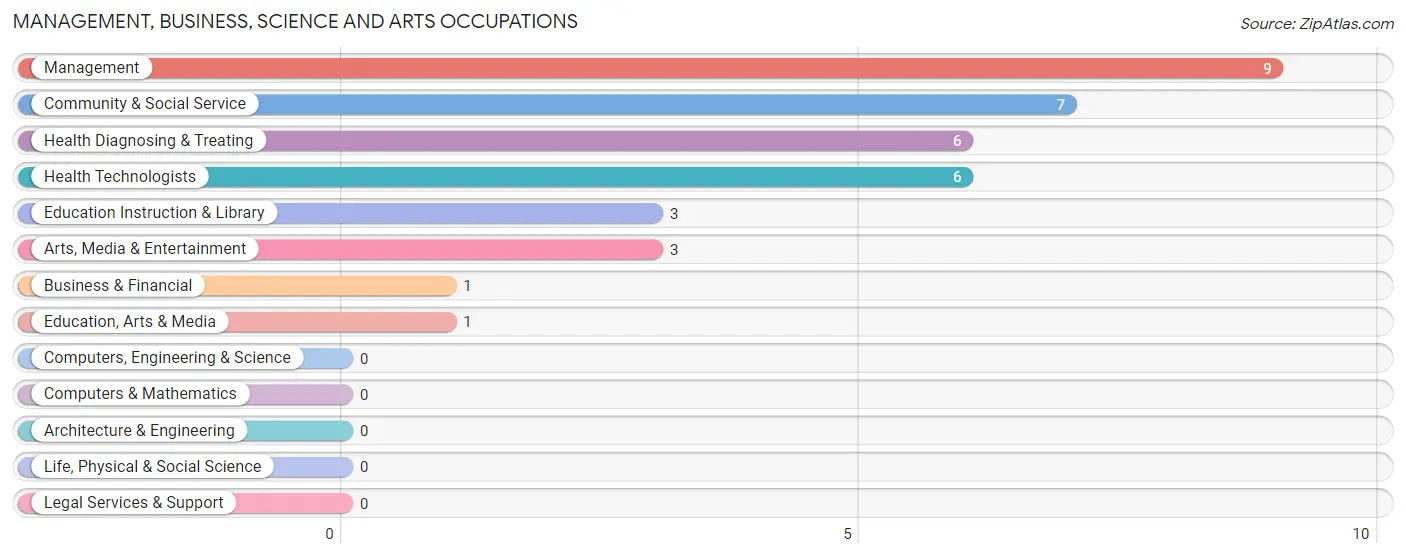
Management, Business, Science and Arts Occupations by Sex
Within the Management, Business, Science and Arts occupations in Pawleys Island, the most male-oriented occupations are Education Instruction & Library (100.0%), Health Diagnosing & Treating (100.0%), and Health Technologists (100.0%), while the most female-oriented occupations are Business & Financial (100.0%), Education, Arts & Media (100.0%), and Arts, Media & Entertainment (100.0%).
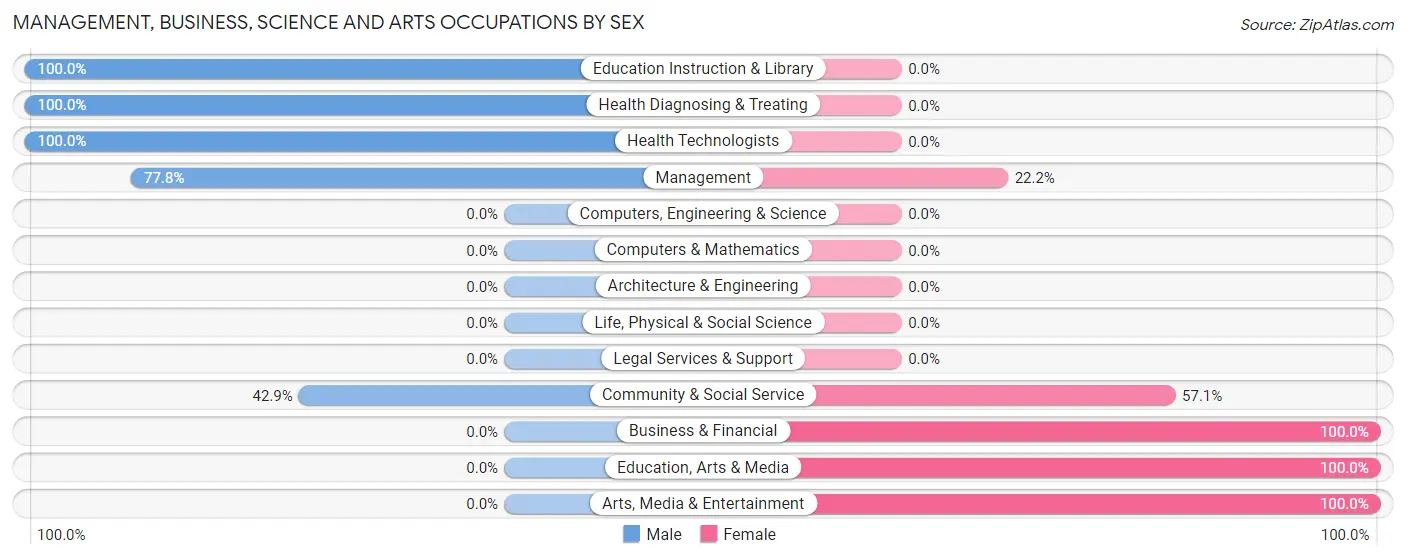
| Occupation | Male | Female |
| Management | 7 (77.8%) | 2 (22.2%) |
| Business & Financial | 0 (0.0%) | 1 (100.0%) |
| Computers, Engineering & Science | 0 (0.0%) | 0 (0.0%) |
| Computers & Mathematics | 0 (0.0%) | 0 (0.0%) |
| Architecture & Engineering | 0 (0.0%) | 0 (0.0%) |
| Life, Physical & Social Science | 0 (0.0%) | 0 (0.0%) |
| Community & Social Service | 3 (42.9%) | 4 (57.1%) |
| Education, Arts & Media | 0 (0.0%) | 1 (100.0%) |
| Legal Services & Support | 0 (0.0%) | 0 (0.0%) |
| Education Instruction & Library | 3 (100.0%) | 0 (0.0%) |
| Arts, Media & Entertainment | 0 (0.0%) | 3 (100.0%) |
| Health Diagnosing & Treating | 6 (100.0%) | 0 (0.0%) |
| Health Technologists | 6 (100.0%) | 0 (0.0%) |
| Total (Category) | 16 (69.6%) | 7 (30.4%) |
| Total (Overall) | 17 (60.7%) | 11 (39.3%) |
Services Occupations
Services Occupations by Sex
| Occupation | Male | Female |
| Healthcare Support | 0 (0.0%) | 0 (0.0%) |
| Security & Protection | 0 (0.0%) | 0 (0.0%) |
| Firefighting & Prevention | 0 (0.0%) | 0 (0.0%) |
| Law Enforcement | 0 (0.0%) | 0 (0.0%) |
| Food Preparation & Serving | 0 (0.0%) | 0 (0.0%) |
| Cleaning & Maintenance | 0 (0.0%) | 0 (0.0%) |
| Personal Care & Service | 0 (0.0%) | 0 (0.0%) |
| Total (Category) | 0 (0.0%) | 0 (0.0%) |
| Total (Overall) | 17 (60.7%) | 11 (39.3%) |
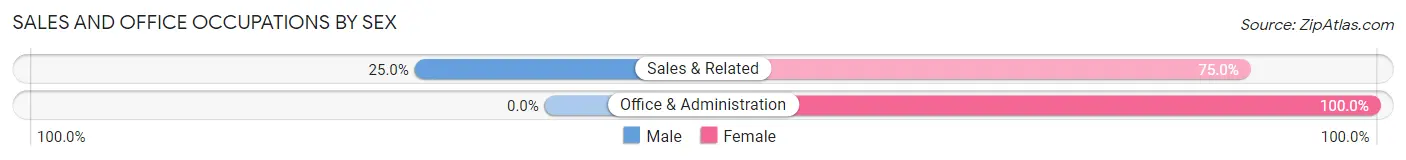
Sales and Office Occupations
The most common Sales and Office occupations in Pawleys Island are Sales & Related (4 | 14.3%), and Office & Administration (1 | 3.6%).
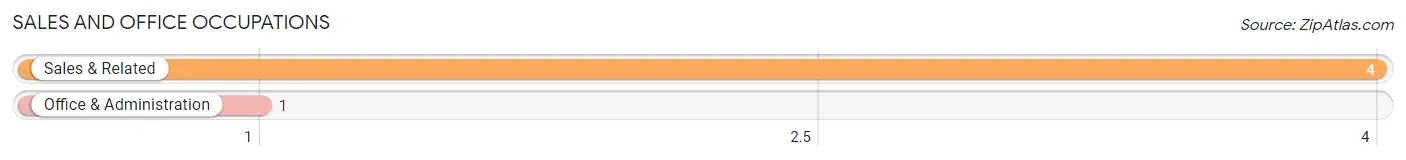
Sales and Office Occupations by Sex
| Occupation | Male | Female |
| Sales & Related | 1 (25.0%) | 3 (75.0%) |
| Office & Administration | 0 (0.0%) | 1 (100.0%) |
| Total (Category) | 1 (20.0%) | 4 (80.0%) |
| Total (Overall) | 17 (60.7%) | 11 (39.3%) |
Natural Resources, Construction and Maintenance Occupations
Natural Resources, Construction and Maintenance Occupations by Sex
| Occupation | Male | Female |
| Farming, Fishing & Forestry | 0 (0.0%) | 0 (0.0%) |
| Construction & Extraction | 0 (0.0%) | 0 (0.0%) |
| Installation, Maintenance & Repair | 0 (0.0%) | 0 (0.0%) |
| Total (Category) | 0 (0.0%) | 0 (0.0%) |
| Total (Overall) | 17 (60.7%) | 11 (39.3%) |
Production, Transportation and Moving Occupations
Production, Transportation and Moving Occupations by Sex
| Occupation | Male | Female |
| Production | 0 (0.0%) | 0 (0.0%) |
| Transportation | 0 (0.0%) | 0 (0.0%) |
| Material Moving | 0 (0.0%) | 0 (0.0%) |
| Total (Category) | 0 (0.0%) | 0 (0.0%) |
| Total (Overall) | 17 (60.7%) | 11 (39.3%) |
Employment Industries by Sex in Pawleys Island
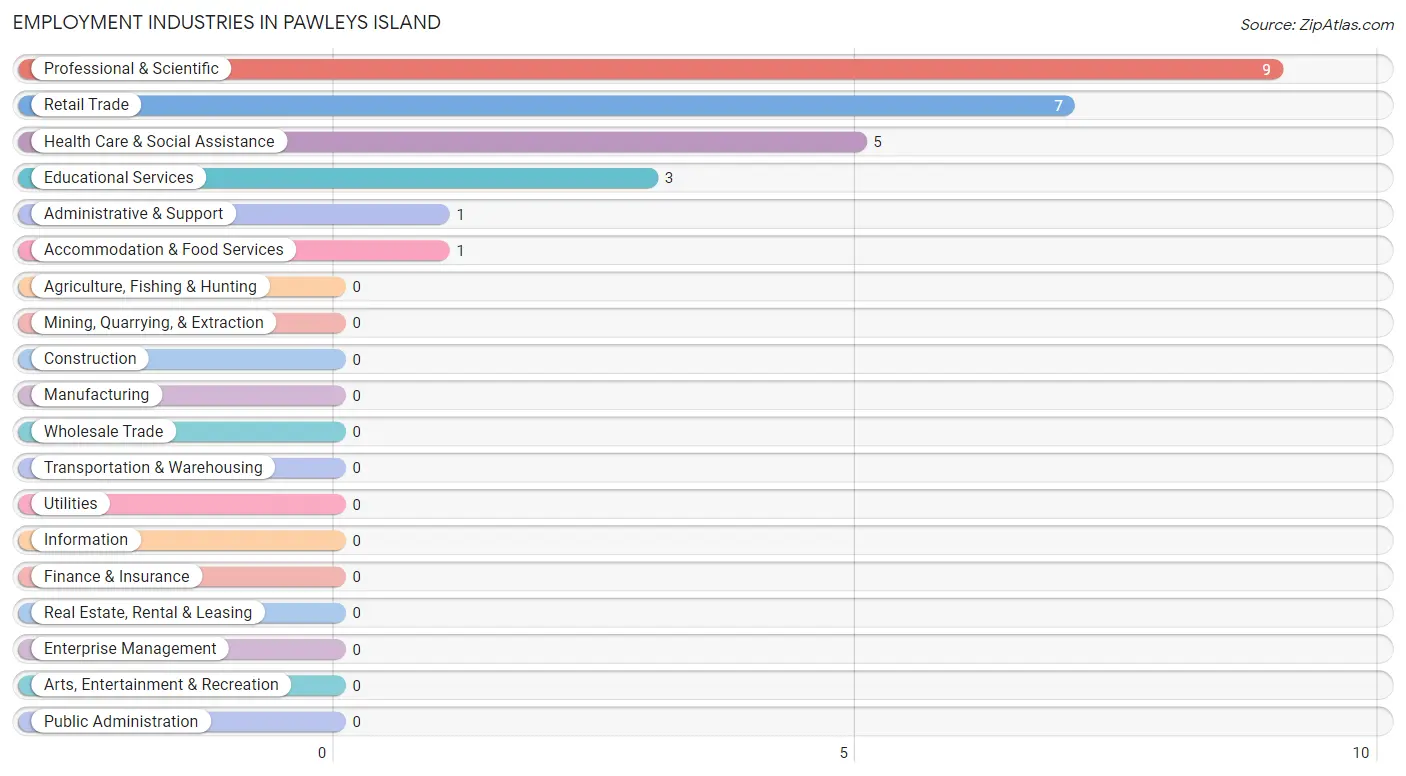
Employment Industries in Pawleys Island
The major employment industries in Pawleys Island include Professional & Scientific (9 | 32.1%), Retail Trade (7 | 25.0%), Health Care & Social Assistance (5 | 17.9%), Educational Services (3 | 10.7%), and Administrative & Support (1 | 3.6%).
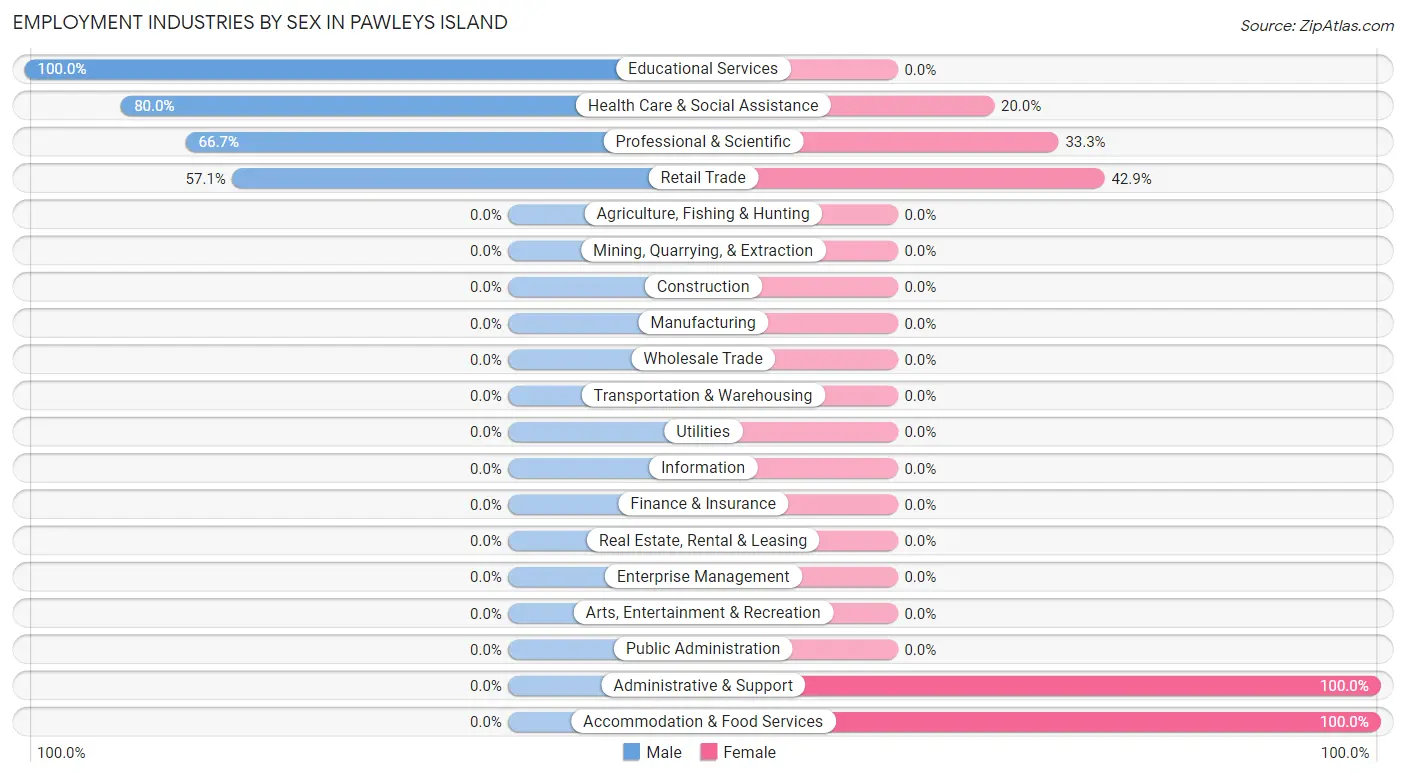
Employment Industries by Sex in Pawleys Island
The Pawleys Island industries that see more men than women are Educational Services (100.0%), Health Care & Social Assistance (80.0%), and Professional & Scientific (66.7%), whereas the industries that tend to have a higher number of women are Administrative & Support (100.0%), Accommodation & Food Services (100.0%), and Retail Trade (42.9%).
| Industry | Male | Female |
| Agriculture, Fishing & Hunting | 0 (0.0%) | 0 (0.0%) |
| Mining, Quarrying, & Extraction | 0 (0.0%) | 0 (0.0%) |
| Construction | 0 (0.0%) | 0 (0.0%) |
| Manufacturing | 0 (0.0%) | 0 (0.0%) |
| Wholesale Trade | 0 (0.0%) | 0 (0.0%) |
| Retail Trade | 4 (57.1%) | 3 (42.9%) |
| Transportation & Warehousing | 0 (0.0%) | 0 (0.0%) |
| Utilities | 0 (0.0%) | 0 (0.0%) |
| Information | 0 (0.0%) | 0 (0.0%) |
| Finance & Insurance | 0 (0.0%) | 0 (0.0%) |
| Real Estate, Rental & Leasing | 0 (0.0%) | 0 (0.0%) |
| Professional & Scientific | 6 (66.7%) | 3 (33.3%) |
| Enterprise Management | 0 (0.0%) | 0 (0.0%) |
| Administrative & Support | 0 (0.0%) | 1 (100.0%) |
| Educational Services | 3 (100.0%) | 0 (0.0%) |
| Health Care & Social Assistance | 4 (80.0%) | 1 (20.0%) |
| Arts, Entertainment & Recreation | 0 (0.0%) | 0 (0.0%) |
| Accommodation & Food Services | 0 (0.0%) | 1 (100.0%) |
| Public Administration | 0 (0.0%) | 0 (0.0%) |
| Total | 17 (60.7%) | 11 (39.3%) |
Education in Pawleys Island
School Enrollment in Pawleys Island
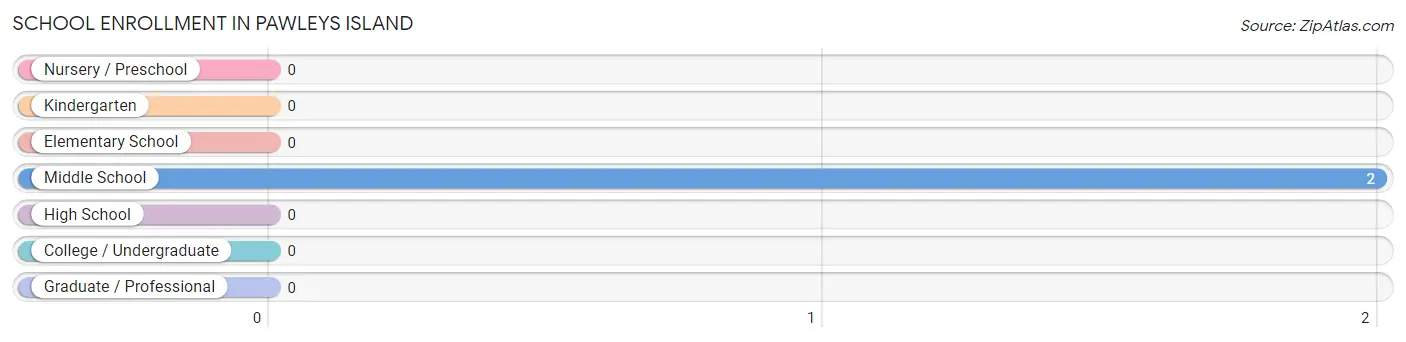
| School Level | # Students | % Students |
| Nursery / Preschool | 0 | 0.0% |
| Kindergarten | 0 | 0.0% |
| Elementary School | 0 | 0.0% |
| Middle School | 2 | 100.0% |
| High School | 0 | 0.0% |
| College / Undergraduate | 0 | 0.0% |
| Graduate / Professional | 0 | 0.0% |
| Total | 2 | 100.0% |
School Enrollment by Age by Funding Source in Pawleys Island
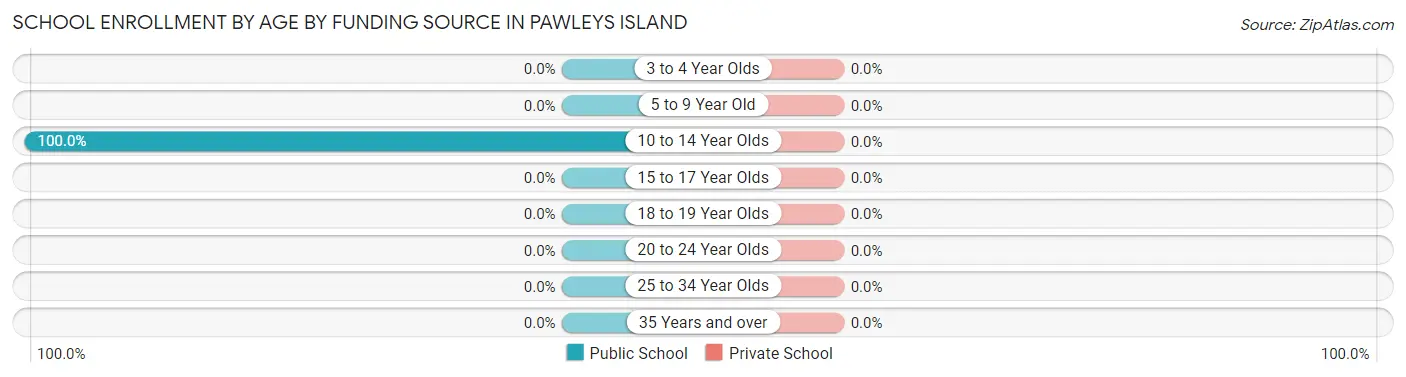
| Age Bracket | Public School | Private School |
| 3 to 4 Year Olds | 0 (0.0%) | 0 (0.0%) |
| 5 to 9 Year Old | 0 (0.0%) | 0 (0.0%) |
| 10 to 14 Year Olds | 2 (100.0%) | 0 (0.0%) |
| 15 to 17 Year Olds | 0 (0.0%) | 0 (0.0%) |
| 18 to 19 Year Olds | 0 (0.0%) | 0 (0.0%) |
| 20 to 24 Year Olds | 0 (0.0%) | 0 (0.0%) |
| 25 to 34 Year Olds | 0 (0.0%) | 0 (0.0%) |
| 35 Years and over | 0 (0.0%) | 0 (0.0%) |
| Total | 2 (100.0%) | 0 (0.0%) |
Educational Attainment by Field of Study in Pawleys Island
Science & technology (20 | 23.5%), education (13 | 15.3%), engineering (8 | 9.4%), business (8 | 9.4%), and social sciences (7 | 8.2%) are the most common fields of study among 85 individuals in Pawleys Island who have obtained a bachelor's degree or higher.
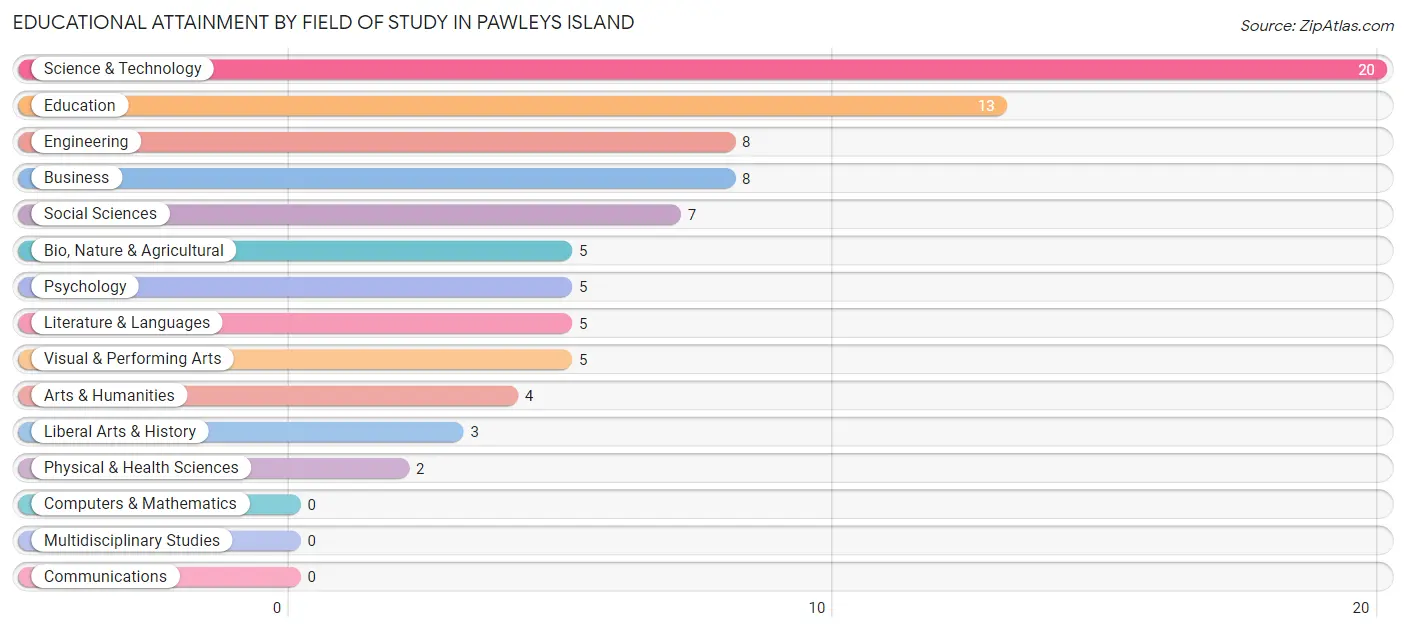
| Field of Study | # Graduates | % Graduates |
| Computers & Mathematics | 0 | 0.0% |
| Bio, Nature & Agricultural | 5 | 5.9% |
| Physical & Health Sciences | 2 | 2.4% |
| Psychology | 5 | 5.9% |
| Social Sciences | 7 | 8.2% |
| Engineering | 8 | 9.4% |
| Multidisciplinary Studies | 0 | 0.0% |
| Science & Technology | 20 | 23.5% |
| Business | 8 | 9.4% |
| Education | 13 | 15.3% |
| Literature & Languages | 5 | 5.9% |
| Liberal Arts & History | 3 | 3.5% |
| Visual & Performing Arts | 5 | 5.9% |
| Communications | 0 | 0.0% |
| Arts & Humanities | 4 | 4.7% |
| Total | 85 | 100.0% |
Transportation & Commute in Pawleys Island
Vehicle Availability by Sex in Pawleys Island
The most prevalent vehicle ownership categories in Pawleys Island are males with 2 vehicles (12, accounting for 70.6%) and females with 2 vehicles (5, making up 109.1%).
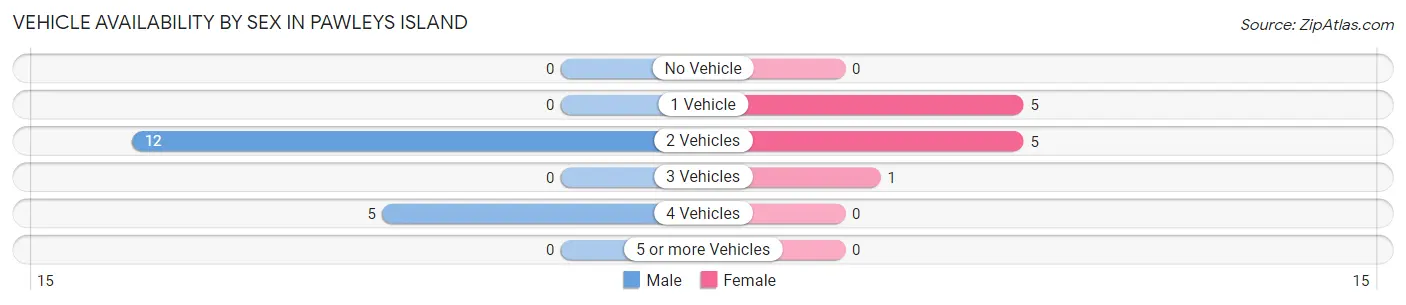
| Vehicles Available | Male | Female |
| No Vehicle | 0 (0.0%) | 0 (0.0%) |
| 1 Vehicle | 0 (0.0%) | 5 (45.5%) |
| 2 Vehicles | 12 (70.6%) | 5 (45.5%) |
| 3 Vehicles | 0 (0.0%) | 1 (9.1%) |
| 4 Vehicles | 5 (29.4%) | 0 (0.0%) |
| 5 or more Vehicles | 0 (0.0%) | 0 (0.0%) |
| Total | 17 (100.0%) | 11 (100.0%) |
Commute Time in Pawleys Island
The most frequently occuring commute durations in Pawleys Island are 5 to 9 minutes (6 commuters, 30.0%), 15 to 19 minutes (4 commuters, 20.0%), and 10 to 14 minutes (3 commuters, 15.0%).
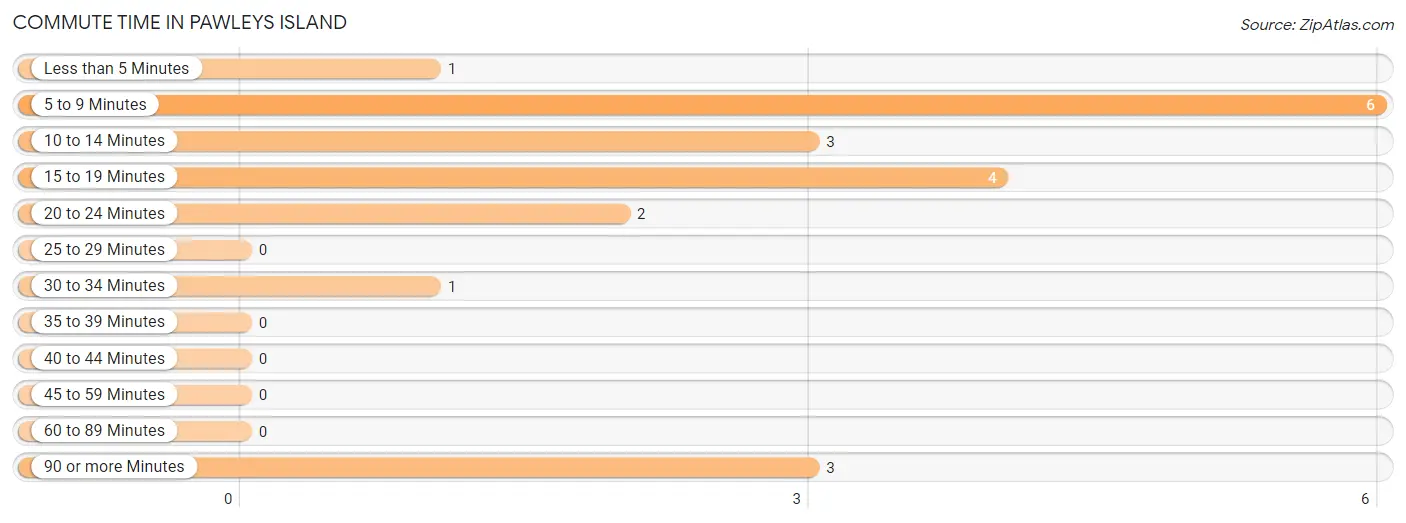
| Commute Time | # Commuters | % Commuters |
| Less than 5 Minutes | 1 | 5.0% |
| 5 to 9 Minutes | 6 | 30.0% |
| 10 to 14 Minutes | 3 | 15.0% |
| 15 to 19 Minutes | 4 | 20.0% |
| 20 to 24 Minutes | 2 | 10.0% |
| 25 to 29 Minutes | 0 | 0.0% |
| 30 to 34 Minutes | 1 | 5.0% |
| 35 to 39 Minutes | 0 | 0.0% |
| 40 to 44 Minutes | 0 | 0.0% |
| 45 to 59 Minutes | 0 | 0.0% |
| 60 to 89 Minutes | 0 | 0.0% |
| 90 or more Minutes | 3 | 15.0% |
Commute Time by Sex in Pawleys Island
The most common commute times in Pawleys Island are 5 to 9 minutes (3 commuters, 25.0%) for males and 5 to 9 minutes (3 commuters, 37.5%) for females.
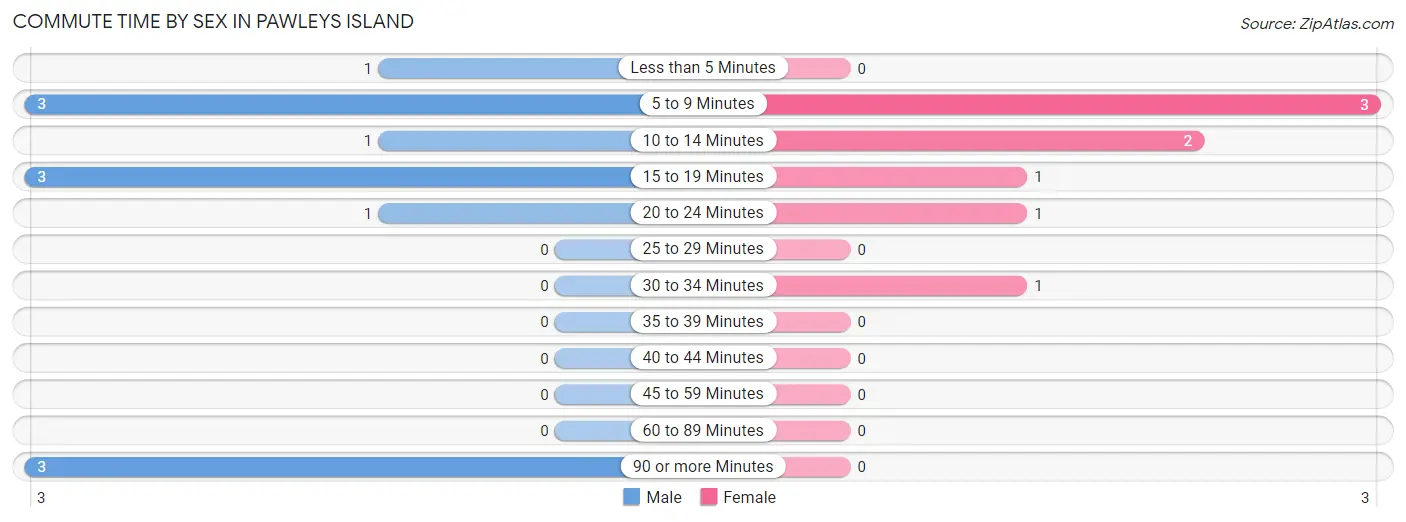
| Commute Time | Male | Female |
| Less than 5 Minutes | 1 (8.3%) | 0 (0.0%) |
| 5 to 9 Minutes | 3 (25.0%) | 3 (37.5%) |
| 10 to 14 Minutes | 1 (8.3%) | 2 (25.0%) |
| 15 to 19 Minutes | 3 (25.0%) | 1 (12.5%) |
| 20 to 24 Minutes | 1 (8.3%) | 1 (12.5%) |
| 25 to 29 Minutes | 0 (0.0%) | 0 (0.0%) |
| 30 to 34 Minutes | 0 (0.0%) | 1 (12.5%) |
| 35 to 39 Minutes | 0 (0.0%) | 0 (0.0%) |
| 40 to 44 Minutes | 0 (0.0%) | 0 (0.0%) |
| 45 to 59 Minutes | 0 (0.0%) | 0 (0.0%) |
| 60 to 89 Minutes | 0 (0.0%) | 0 (0.0%) |
| 90 or more Minutes | 3 (25.0%) | 0 (0.0%) |
Time of Departure to Work by Sex in Pawleys Island
The most frequent times of departure to work in Pawleys Island are 7:30 AM to 7:59 AM (6, 50.0%) for males and 9:00 AM to 9:59 AM (6, 75.0%) for females.
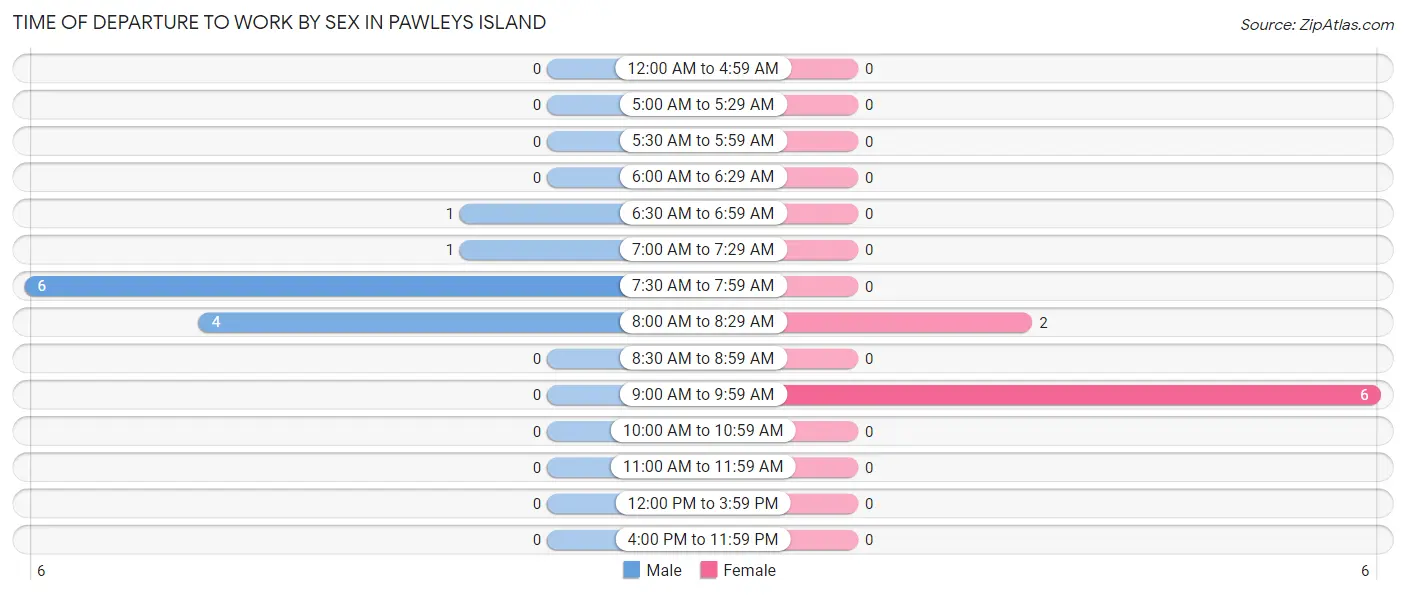
| Time of Departure | Male | Female |
| 12:00 AM to 4:59 AM | 0 (0.0%) | 0 (0.0%) |
| 5:00 AM to 5:29 AM | 0 (0.0%) | 0 (0.0%) |
| 5:30 AM to 5:59 AM | 0 (0.0%) | 0 (0.0%) |
| 6:00 AM to 6:29 AM | 0 (0.0%) | 0 (0.0%) |
| 6:30 AM to 6:59 AM | 1 (8.3%) | 0 (0.0%) |
| 7:00 AM to 7:29 AM | 1 (8.3%) | 0 (0.0%) |
| 7:30 AM to 7:59 AM | 6 (50.0%) | 0 (0.0%) |
| 8:00 AM to 8:29 AM | 4 (33.3%) | 2 (25.0%) |
| 8:30 AM to 8:59 AM | 0 (0.0%) | 0 (0.0%) |
| 9:00 AM to 9:59 AM | 0 (0.0%) | 6 (75.0%) |
| 10:00 AM to 10:59 AM | 0 (0.0%) | 0 (0.0%) |
| 11:00 AM to 11:59 AM | 0 (0.0%) | 0 (0.0%) |
| 12:00 PM to 3:59 PM | 0 (0.0%) | 0 (0.0%) |
| 4:00 PM to 11:59 PM | 0 (0.0%) | 0 (0.0%) |
| Total | 12 (100.0%) | 8 (100.0%) |
Housing Occupancy in Pawleys Island
Occupancy by Ownership in Pawleys Island
Of the total 64 dwellings in Pawleys Island, owner-occupied units account for 58 (90.6%), while renter-occupied units make up 6 (9.4%).
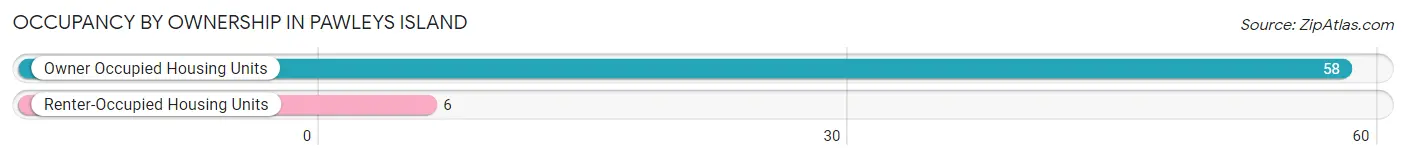
| Occupancy | # Housing Units | % Housing Units |
| Owner Occupied Housing Units | 58 | 90.6% |
| Renter-Occupied Housing Units | 6 | 9.4% |
| Total Occupied Housing Units | 64 | 100.0% |
Occupancy by Household Size in Pawleys Island
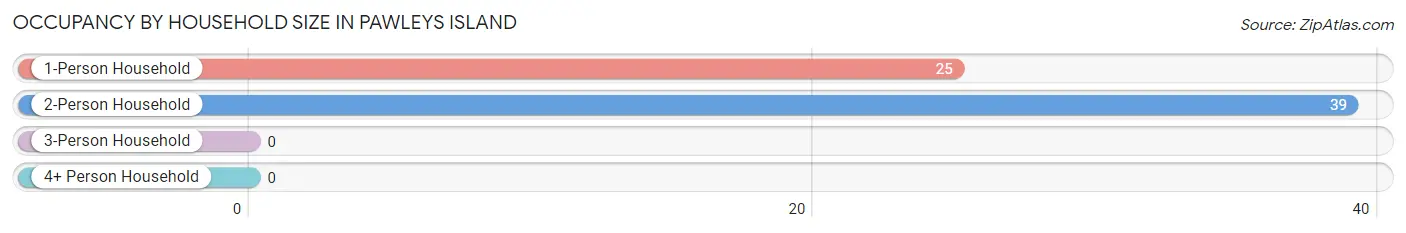
| Household Size | # Housing Units | % Housing Units |
| 1-Person Household | 25 | 39.1% |
| 2-Person Household | 39 | 60.9% |
| 3-Person Household | 0 | 0.0% |
| 4+ Person Household | 0 | 0.0% |
| Total Housing Units | 64 | 100.0% |
Occupancy by Ownership by Household Size in Pawleys Island
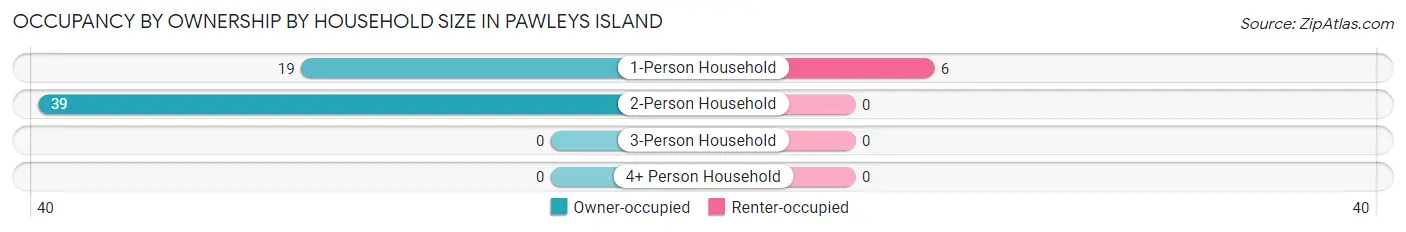
| Household Size | Owner-occupied | Renter-occupied |
| 1-Person Household | 19 (76.0%) | 6 (24.0%) |
| 2-Person Household | 39 (100.0%) | 0 (0.0%) |
| 3-Person Household | 0 (0.0%) | 0 (0.0%) |
| 4+ Person Household | 0 (0.0%) | 0 (0.0%) |
| Total Housing Units | 58 (90.6%) | 6 (9.4%) |
Occupancy by Educational Attainment in Pawleys Island
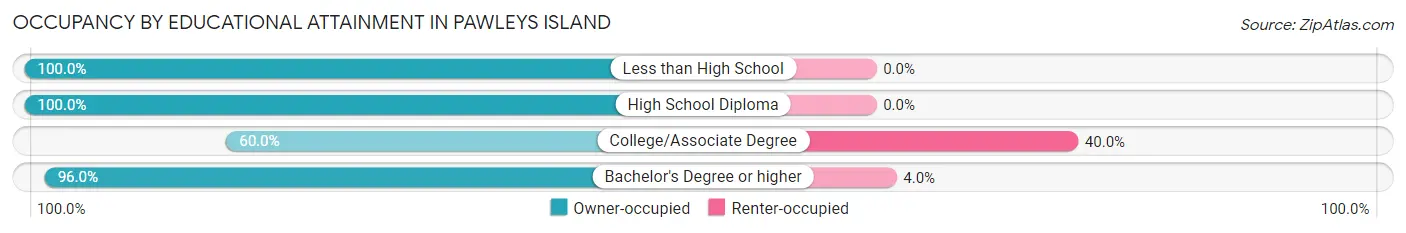
| Household Size | Owner-occupied | Renter-occupied |
| Less than High School | 2 (100.0%) | 0 (0.0%) |
| High School Diploma | 2 (100.0%) | 0 (0.0%) |
| College/Associate Degree | 6 (60.0%) | 4 (40.0%) |
| Bachelor's Degree or higher | 48 (96.0%) | 2 (4.0%) |
Occupancy by Age of Householder in Pawleys Island
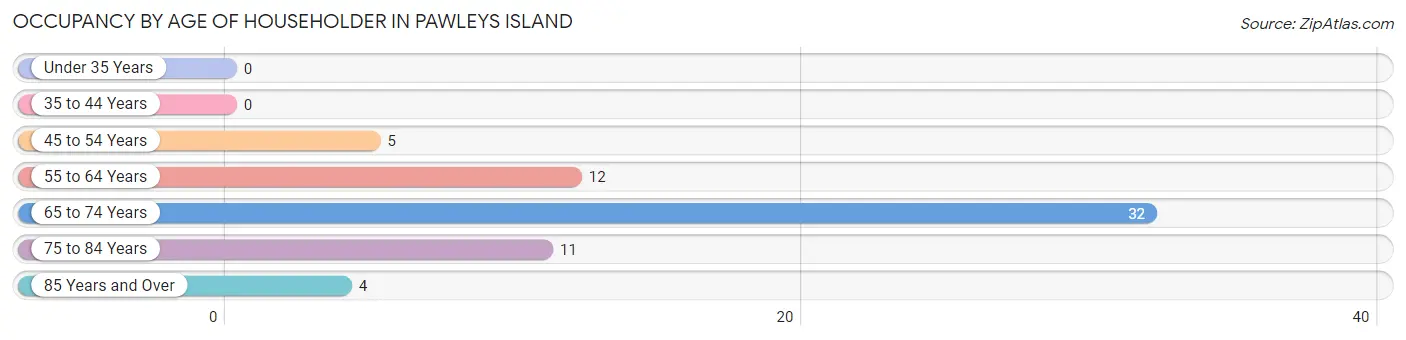
| Age Bracket | # Households | % Households |
| Under 35 Years | 0 | 0.0% |
| 35 to 44 Years | 0 | 0.0% |
| 45 to 54 Years | 5 | 7.8% |
| 55 to 64 Years | 12 | 18.8% |
| 65 to 74 Years | 32 | 50.0% |
| 75 to 84 Years | 11 | 17.2% |
| 85 Years and Over | 4 | 6.2% |
| Total | 64 | 100.0% |
Housing Finances in Pawleys Island
Median Income by Occupancy in Pawleys Island
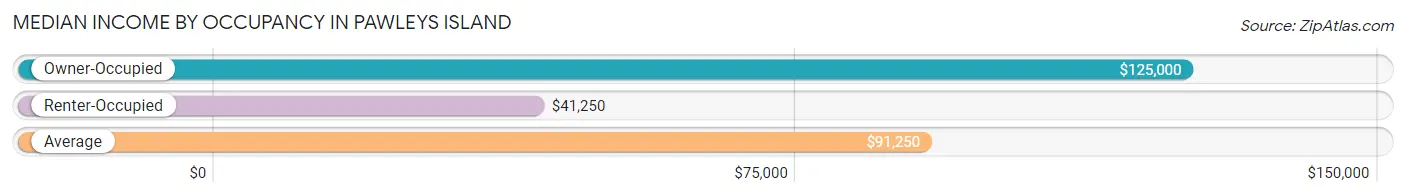
| Occupancy Type | # Households | Median Income |
| Owner-Occupied | 58 (90.6%) | $125,000 |
| Renter-Occupied | 6 (9.4%) | $41,250 |
| Average | 64 (100.0%) | $91,250 |
Occupancy by Householder Income Bracket in Pawleys Island
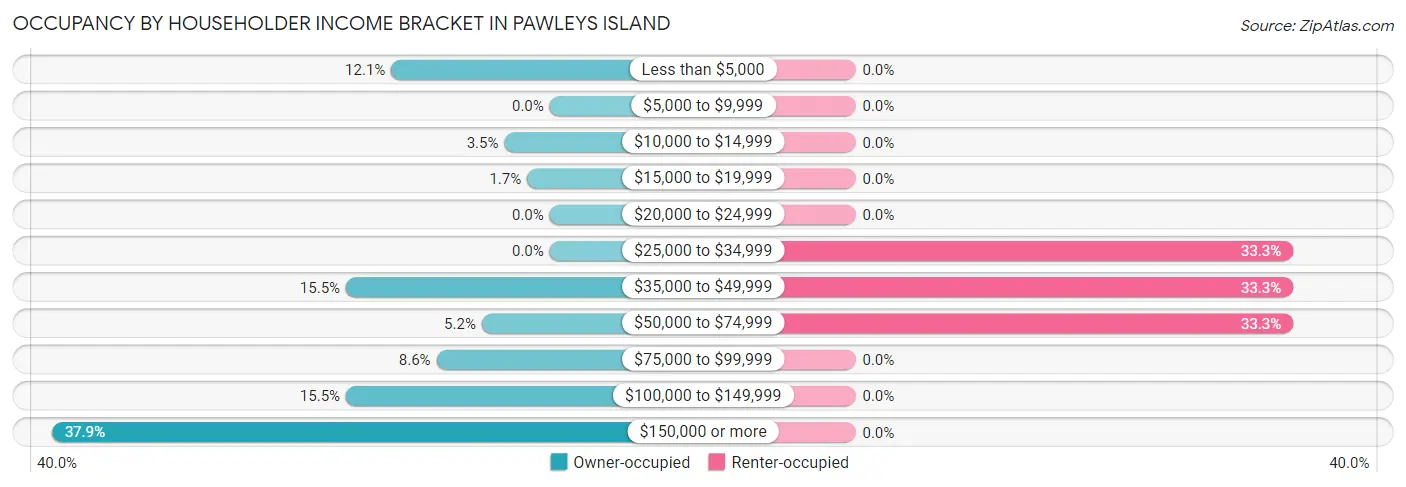
| Income Bracket | Owner-occupied | Renter-occupied |
| Less than $5,000 | 7 (12.1%) | 0 (0.0%) |
| $5,000 to $9,999 | 0 (0.0%) | 0 (0.0%) |
| $10,000 to $14,999 | 2 (3.5%) | 0 (0.0%) |
| $15,000 to $19,999 | 1 (1.7%) | 0 (0.0%) |
| $20,000 to $24,999 | 0 (0.0%) | 0 (0.0%) |
| $25,000 to $34,999 | 0 (0.0%) | 2 (33.3%) |
| $35,000 to $49,999 | 9 (15.5%) | 2 (33.3%) |
| $50,000 to $74,999 | 3 (5.2%) | 2 (33.3%) |
| $75,000 to $99,999 | 5 (8.6%) | 0 (0.0%) |
| $100,000 to $149,999 | 9 (15.5%) | 0 (0.0%) |
| $150,000 or more | 22 (37.9%) | 0 (0.0%) |
| Total | 58 (100.0%) | 6 (100.0%) |
Monthly Housing Cost Tiers in Pawleys Island
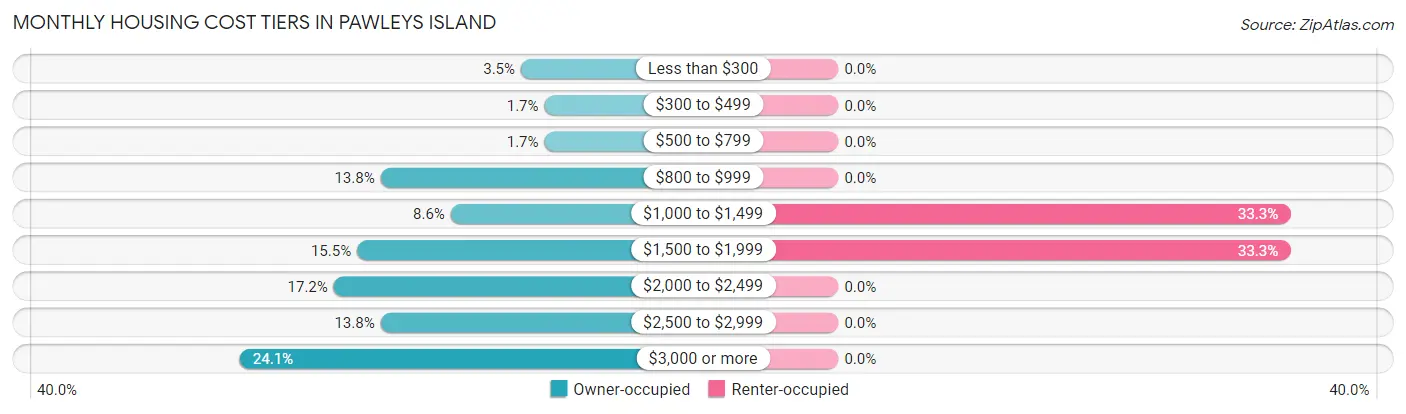
| Monthly Cost | Owner-occupied | Renter-occupied |
| Less than $300 | 2 (3.5%) | 0 (0.0%) |
| $300 to $499 | 1 (1.7%) | 0 (0.0%) |
| $500 to $799 | 1 (1.7%) | 0 (0.0%) |
| $800 to $999 | 8 (13.8%) | 0 (0.0%) |
| $1,000 to $1,499 | 5 (8.6%) | 2 (33.3%) |
| $1,500 to $1,999 | 9 (15.5%) | 2 (33.3%) |
| $2,000 to $2,499 | 10 (17.2%) | 0 (0.0%) |
| $2,500 to $2,999 | 8 (13.8%) | 0 (0.0%) |
| $3,000 or more | 14 (24.1%) | 0 (0.0%) |
| Total | 58 (100.0%) | 6 (100.0%) |
Physical Housing Characteristics in Pawleys Island
Housing Structures in Pawleys Island
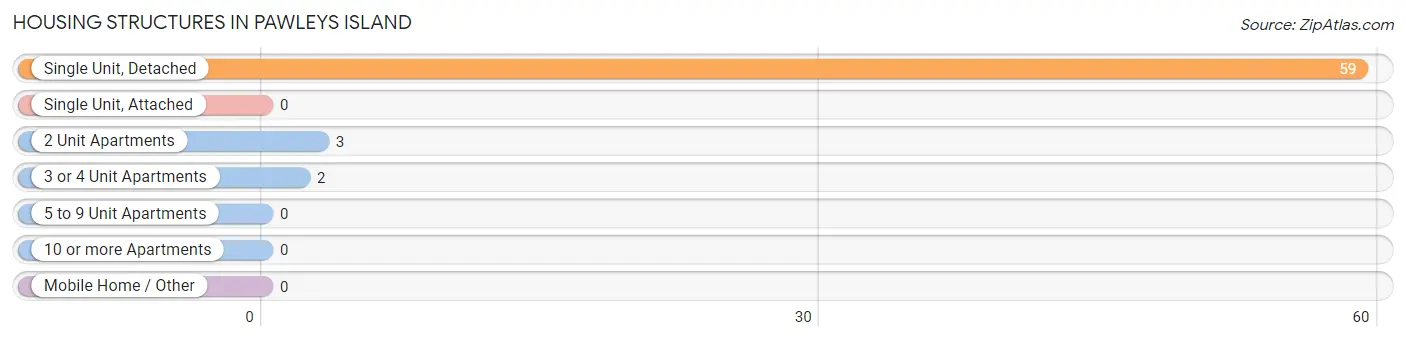
| Structure Type | # Housing Units | % Housing Units |
| Single Unit, Detached | 59 | 92.2% |
| Single Unit, Attached | 0 | 0.0% |
| 2 Unit Apartments | 3 | 4.7% |
| 3 or 4 Unit Apartments | 2 | 3.1% |
| 5 to 9 Unit Apartments | 0 | 0.0% |
| 10 or more Apartments | 0 | 0.0% |
| Mobile Home / Other | 0 | 0.0% |
| Total | 64 | 100.0% |
Housing Structures by Occupancy in Pawleys Island
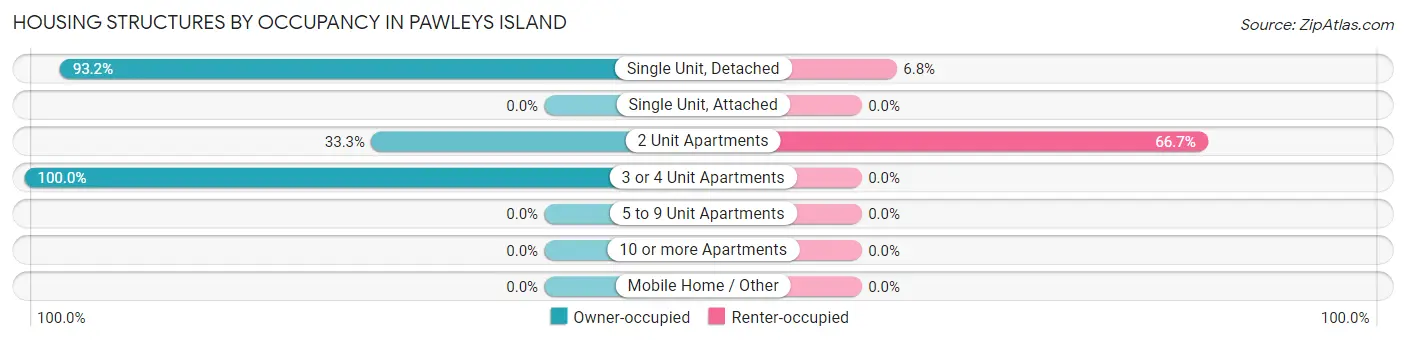
| Structure Type | Owner-occupied | Renter-occupied |
| Single Unit, Detached | 55 (93.2%) | 4 (6.8%) |
| Single Unit, Attached | 0 (0.0%) | 0 (0.0%) |
| 2 Unit Apartments | 1 (33.3%) | 2 (66.7%) |
| 3 or 4 Unit Apartments | 2 (100.0%) | 0 (0.0%) |
| 5 to 9 Unit Apartments | 0 (0.0%) | 0 (0.0%) |
| 10 or more Apartments | 0 (0.0%) | 0 (0.0%) |
| Mobile Home / Other | 0 (0.0%) | 0 (0.0%) |
| Total | 58 (90.6%) | 6 (9.4%) |
Housing Structures by Number of Rooms in Pawleys Island
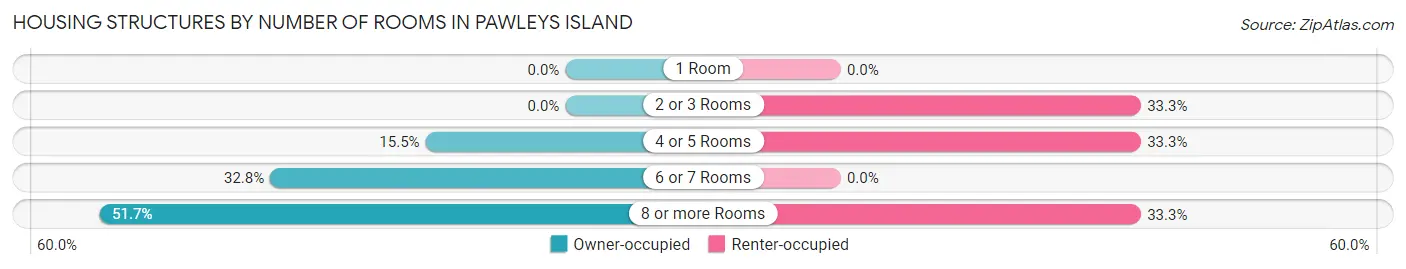
| Number of Rooms | Owner-occupied | Renter-occupied |
| 1 Room | 0 (0.0%) | 0 (0.0%) |
| 2 or 3 Rooms | 0 (0.0%) | 2 (33.3%) |
| 4 or 5 Rooms | 9 (15.5%) | 2 (33.3%) |
| 6 or 7 Rooms | 19 (32.8%) | 0 (0.0%) |
| 8 or more Rooms | 30 (51.7%) | 2 (33.3%) |
| Total | 58 (100.0%) | 6 (100.0%) |
Housing Structure by Heating Type in Pawleys Island
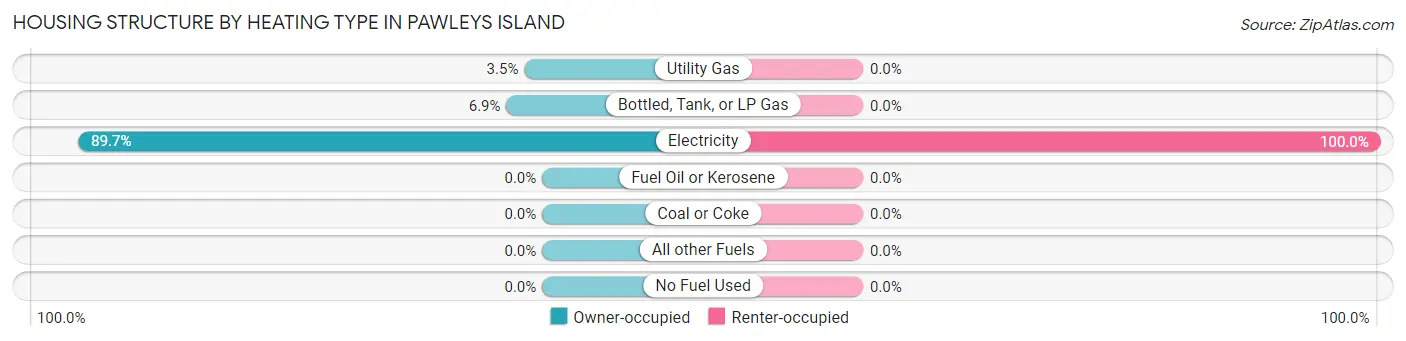
| Heating Type | Owner-occupied | Renter-occupied |
| Utility Gas | 2 (3.5%) | 0 (0.0%) |
| Bottled, Tank, or LP Gas | 4 (6.9%) | 0 (0.0%) |
| Electricity | 52 (89.7%) | 6 (100.0%) |
| Fuel Oil or Kerosene | 0 (0.0%) | 0 (0.0%) |
| Coal or Coke | 0 (0.0%) | 0 (0.0%) |
| All other Fuels | 0 (0.0%) | 0 (0.0%) |
| No Fuel Used | 0 (0.0%) | 0 (0.0%) |
| Total | 58 (100.0%) | 6 (100.0%) |
Household Vehicle Usage in Pawleys Island
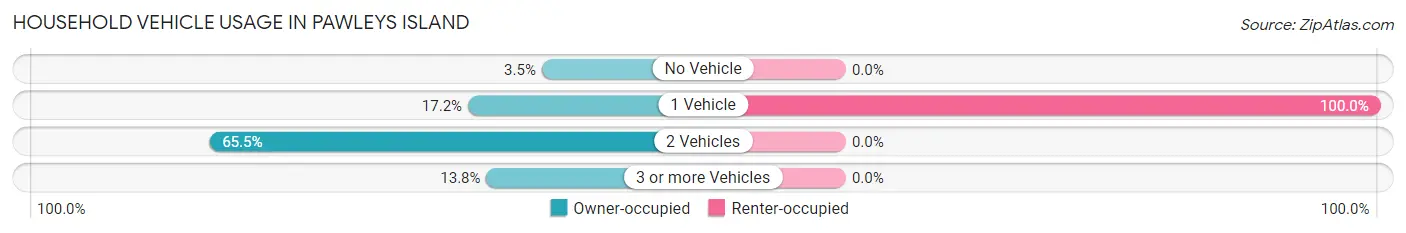
| Vehicles per Household | Owner-occupied | Renter-occupied |
| No Vehicle | 2 (3.5%) | 0 (0.0%) |
| 1 Vehicle | 10 (17.2%) | 6 (100.0%) |
| 2 Vehicles | 38 (65.5%) | 0 (0.0%) |
| 3 or more Vehicles | 8 (13.8%) | 0 (0.0%) |
| Total | 58 (100.0%) | 6 (100.0%) |
Real Estate & Mortgages in Pawleys Island
Real Estate and Mortgage Overview in Pawleys Island
| Characteristic | Without Mortgage | With Mortgage |
| Housing Units | 29 | 29 |
| Median Property Value | $1,578,100 | $1,175,000 |
| Median Household Income | $135,625 | $12 |
| Monthly Housing Costs | $1,501 | $14 |
| Real Estate Taxes | $6,406 | $0 |
Property Value by Mortgage Status in Pawleys Island
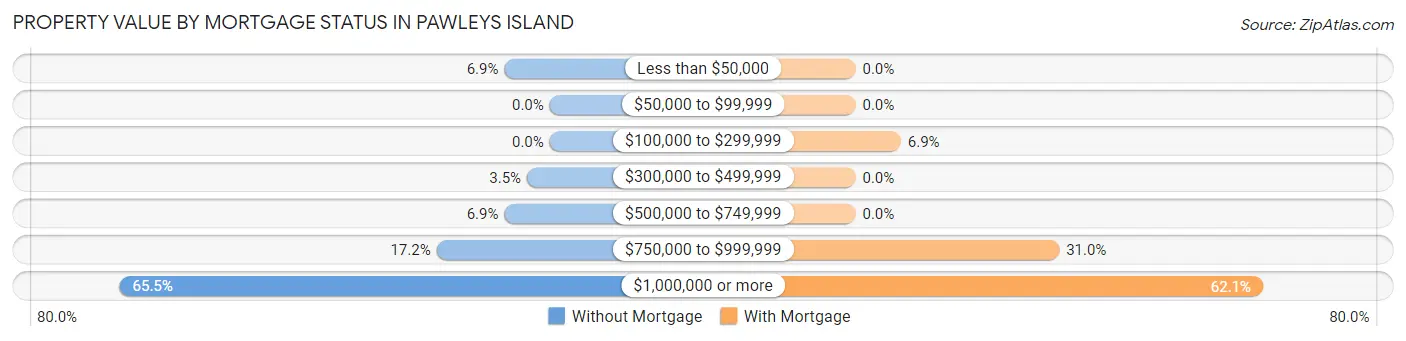
| Property Value | Without Mortgage | With Mortgage |
| Less than $50,000 | 2 (6.9%) | 0 (0.0%) |
| $50,000 to $99,999 | 0 (0.0%) | 0 (0.0%) |
| $100,000 to $299,999 | 0 (0.0%) | 2 (6.9%) |
| $300,000 to $499,999 | 1 (3.5%) | 0 (0.0%) |
| $500,000 to $749,999 | 2 (6.9%) | 0 (0.0%) |
| $750,000 to $999,999 | 5 (17.2%) | 9 (31.0%) |
| $1,000,000 or more | 19 (65.5%) | 18 (62.1%) |
| Total | 29 (100.0%) | 29 (100.0%) |
Household Income by Mortgage Status in Pawleys Island
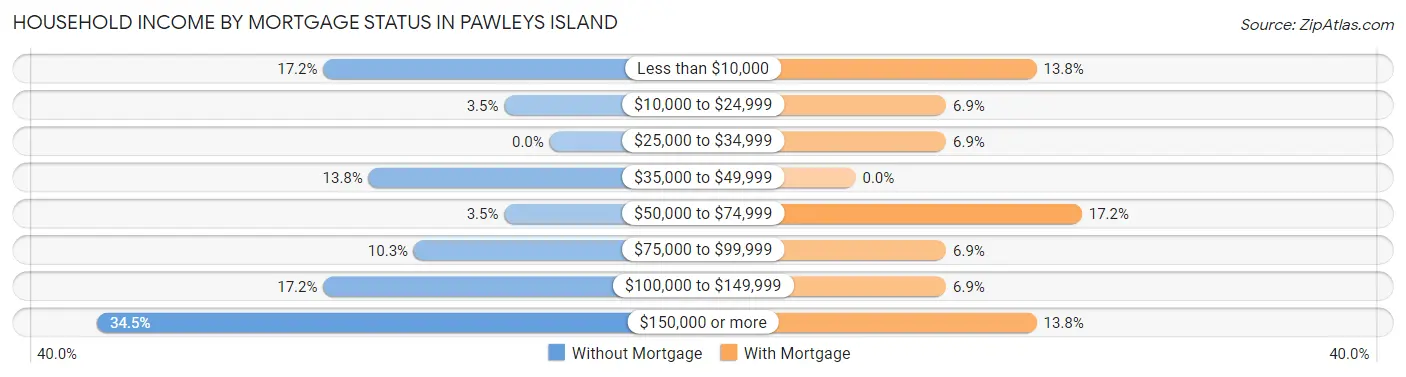
| Household Income | Without Mortgage | With Mortgage |
| Less than $10,000 | 5 (17.2%) | 4 (13.8%) |
| $10,000 to $24,999 | 1 (3.5%) | 2 (6.9%) |
| $25,000 to $34,999 | 0 (0.0%) | 2 (6.9%) |
| $35,000 to $49,999 | 4 (13.8%) | 0 (0.0%) |
| $50,000 to $74,999 | 1 (3.5%) | 5 (17.2%) |
| $75,000 to $99,999 | 3 (10.3%) | 2 (6.9%) |
| $100,000 to $149,999 | 5 (17.2%) | 2 (6.9%) |
| $150,000 or more | 10 (34.5%) | 4 (13.8%) |
| Total | 29 (100.0%) | 29 (100.0%) |
Property Value to Household Income Ratio in Pawleys Island
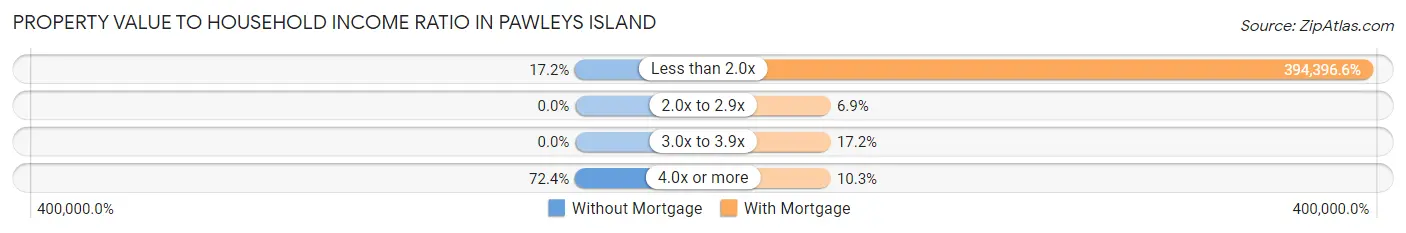
| Value-to-Income Ratio | Without Mortgage | With Mortgage |
| Less than 2.0x | 5 (17.2%) | 114,375 (394,396.5%) |
| 2.0x to 2.9x | 0 (0.0%) | 2 (6.9%) |
| 3.0x to 3.9x | 0 (0.0%) | 5 (17.2%) |
| 4.0x or more | 21 (72.4%) | 3 (10.3%) |
| Total | 29 (100.0%) | 29 (100.0%) |
Real Estate Taxes by Mortgage Status in Pawleys Island
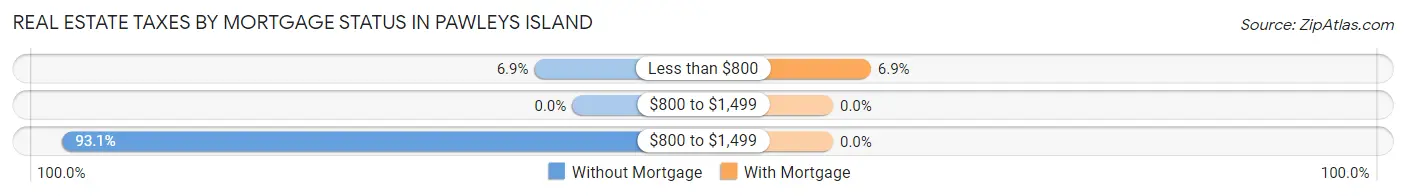
| Property Taxes | Without Mortgage | With Mortgage |
| Less than $800 | 2 (6.9%) | 2 (6.9%) |
| $800 to $1,499 | 0 (0.0%) | 0 (0.0%) |
| $800 to $1,499 | 27 (93.1%) | 0 (0.0%) |
| Total | 29 (100.0%) | 29 (100.0%) |
Health & Disability in Pawleys Island
Health Insurance Coverage by Age in Pawleys Island
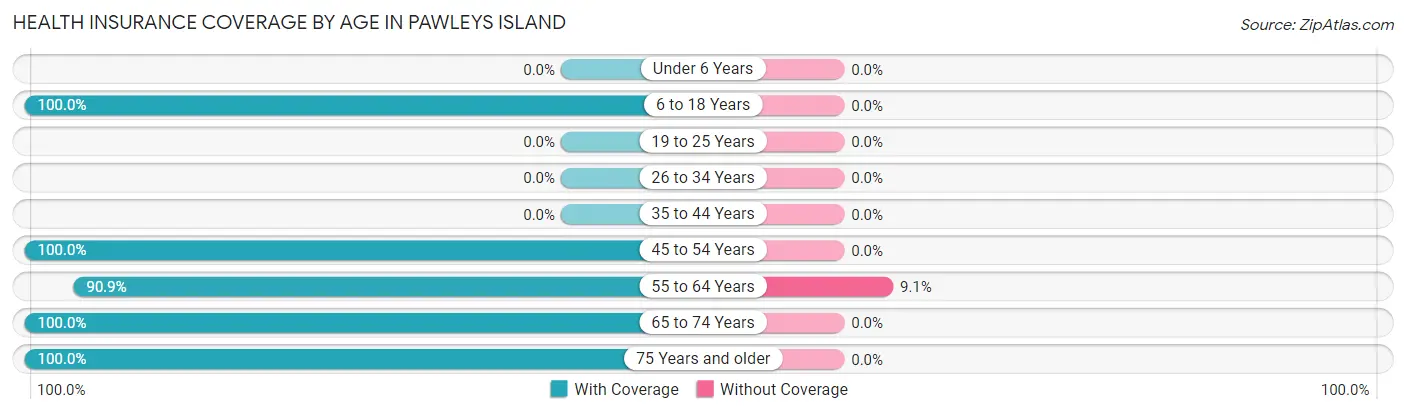
| Age Bracket | With Coverage | Without Coverage |
| Under 6 Years | 0 (0.0%) | 0 (0.0%) |
| 6 to 18 Years | 2 (100.0%) | 0 (0.0%) |
| 19 to 25 Years | 0 (0.0%) | 0 (0.0%) |
| 26 to 34 Years | 0 (0.0%) | 0 (0.0%) |
| 35 to 44 Years | 0 (0.0%) | 0 (0.0%) |
| 45 to 54 Years | 6 (100.0%) | 0 (0.0%) |
| 55 to 64 Years | 20 (90.9%) | 2 (9.1%) |
| 65 to 74 Years | 51 (100.0%) | 0 (0.0%) |
| 75 Years and older | 23 (100.0%) | 0 (0.0%) |
| Total | 102 (98.1%) | 2 (1.9%) |
Health Insurance Coverage by Citizenship Status in Pawleys Island
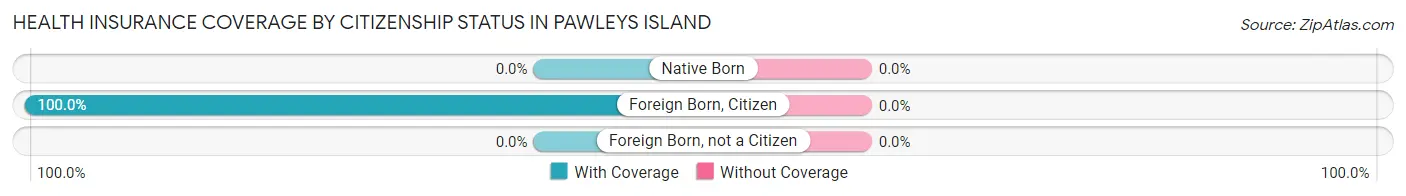
| Citizenship Status | With Coverage | Without Coverage |
| Native Born | 0 (0.0%) | 0 (0.0%) |
| Foreign Born, Citizen | 2 (100.0%) | 0 (0.0%) |
| Foreign Born, not a Citizen | 0 (0.0%) | 0 (0.0%) |
Health Insurance Coverage by Household Income in Pawleys Island
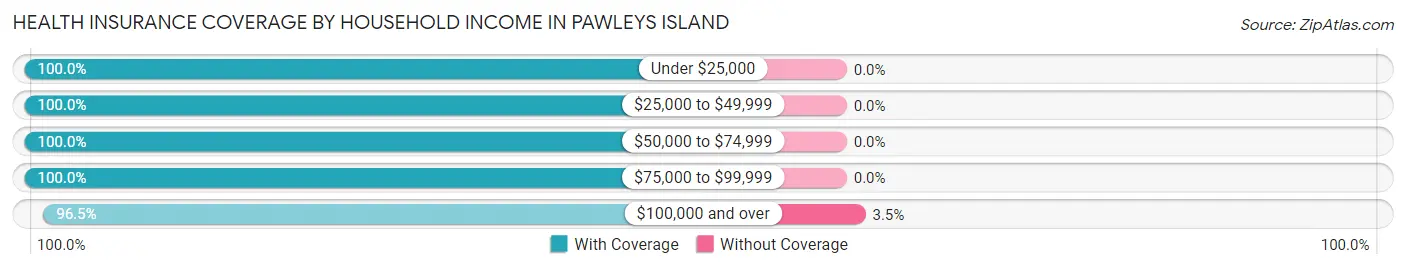
| Household Income | With Coverage | Without Coverage |
| Under $25,000 | 10 (100.0%) | 0 (0.0%) |
| $25,000 to $49,999 | 21 (100.0%) | 0 (0.0%) |
| $50,000 to $74,999 | 7 (100.0%) | 0 (0.0%) |
| $75,000 to $99,999 | 9 (100.0%) | 0 (0.0%) |
| $100,000 and over | 55 (96.5%) | 2 (3.5%) |
Public vs Private Health Insurance Coverage by Age in Pawleys Island
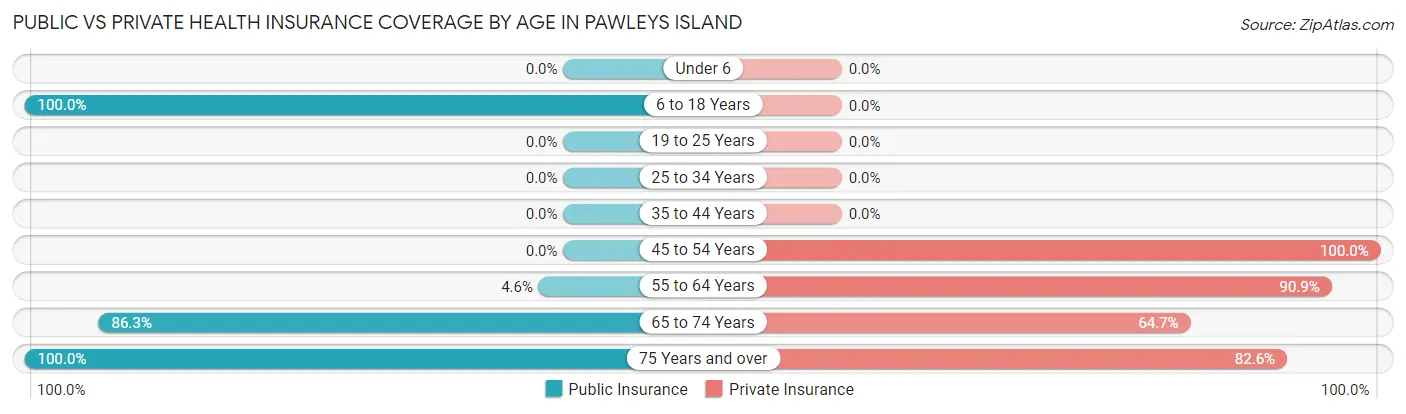
| Age Bracket | Public Insurance | Private Insurance |
| Under 6 | 0 (0.0%) | 0 (0.0%) |
| 6 to 18 Years | 2 (100.0%) | 0 (0.0%) |
| 19 to 25 Years | 0 (0.0%) | 0 (0.0%) |
| 25 to 34 Years | 0 (0.0%) | 0 (0.0%) |
| 35 to 44 Years | 0 (0.0%) | 0 (0.0%) |
| 45 to 54 Years | 0 (0.0%) | 6 (100.0%) |
| 55 to 64 Years | 1 (4.5%) | 20 (90.9%) |
| 65 to 74 Years | 44 (86.3%) | 33 (64.7%) |
| 75 Years and over | 23 (100.0%) | 19 (82.6%) |
| Total | 70 (67.3%) | 78 (75.0%) |
Disability Status by Sex by Age in Pawleys Island
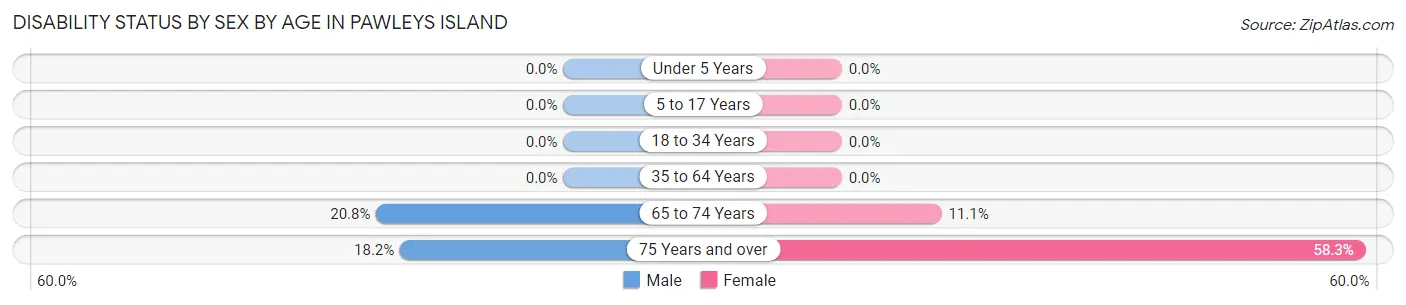
| Age Bracket | Male | Female |
| Under 5 Years | 0 (0.0%) | 0 (0.0%) |
| 5 to 17 Years | 0 (0.0%) | 0 (0.0%) |
| 18 to 34 Years | 0 (0.0%) | 0 (0.0%) |
| 35 to 64 Years | 0 (0.0%) | 0 (0.0%) |
| 65 to 74 Years | 5 (20.8%) | 3 (11.1%) |
| 75 Years and over | 2 (18.2%) | 7 (58.3%) |
Disability Class by Sex by Age in Pawleys Island
Disability Class: Hearing Difficulty
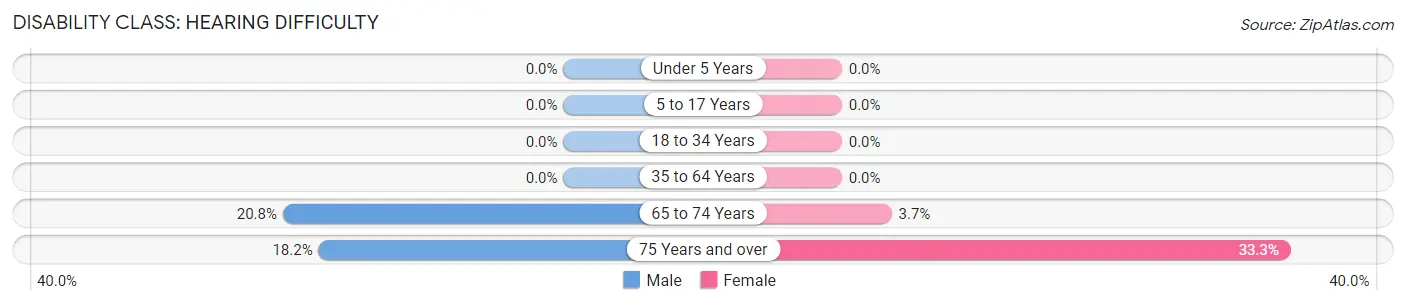
| Age Bracket | Male | Female |
| Under 5 Years | 0 (0.0%) | 0 (0.0%) |
| 5 to 17 Years | 0 (0.0%) | 0 (0.0%) |
| 18 to 34 Years | 0 (0.0%) | 0 (0.0%) |
| 35 to 64 Years | 0 (0.0%) | 0 (0.0%) |
| 65 to 74 Years | 5 (20.8%) | 1 (3.7%) |
| 75 Years and over | 2 (18.2%) | 4 (33.3%) |
Disability Class: Vision Difficulty
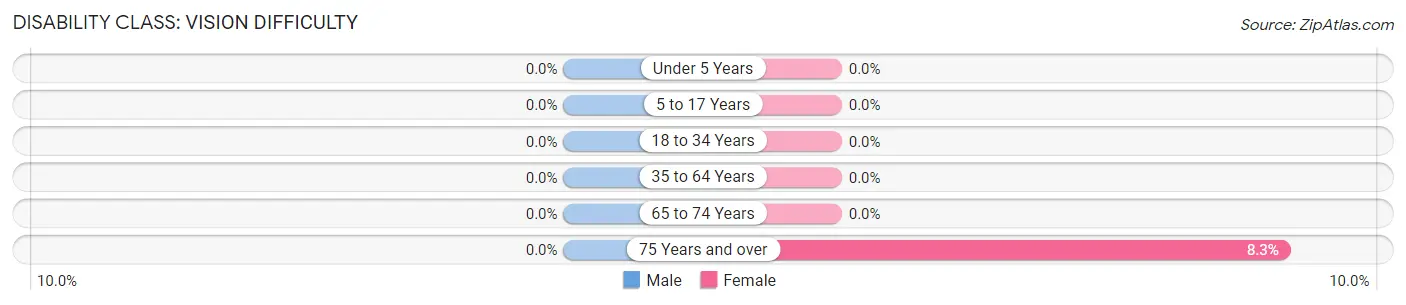
| Age Bracket | Male | Female |
| Under 5 Years | 0 (0.0%) | 0 (0.0%) |
| 5 to 17 Years | 0 (0.0%) | 0 (0.0%) |
| 18 to 34 Years | 0 (0.0%) | 0 (0.0%) |
| 35 to 64 Years | 0 (0.0%) | 0 (0.0%) |
| 65 to 74 Years | 0 (0.0%) | 0 (0.0%) |
| 75 Years and over | 0 (0.0%) | 1 (8.3%) |
Disability Class: Cognitive Difficulty
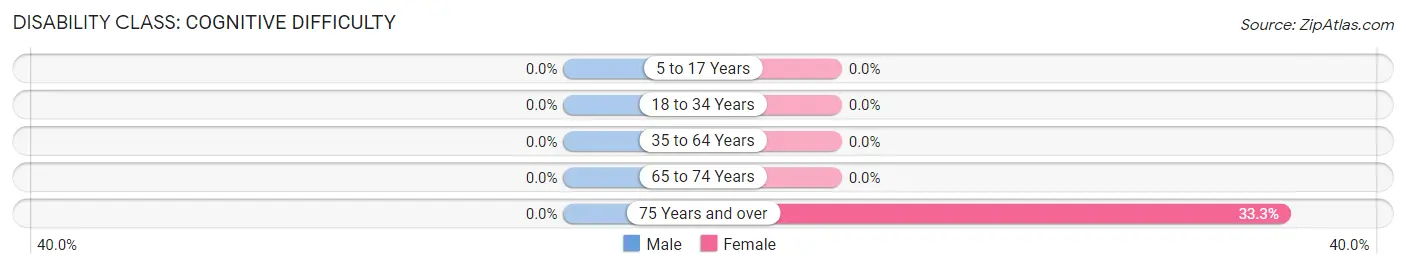
| Age Bracket | Male | Female |
| 5 to 17 Years | 0 (0.0%) | 0 (0.0%) |
| 18 to 34 Years | 0 (0.0%) | 0 (0.0%) |
| 35 to 64 Years | 0 (0.0%) | 0 (0.0%) |
| 65 to 74 Years | 0 (0.0%) | 0 (0.0%) |
| 75 Years and over | 0 (0.0%) | 4 (33.3%) |
Disability Class: Ambulatory Difficulty
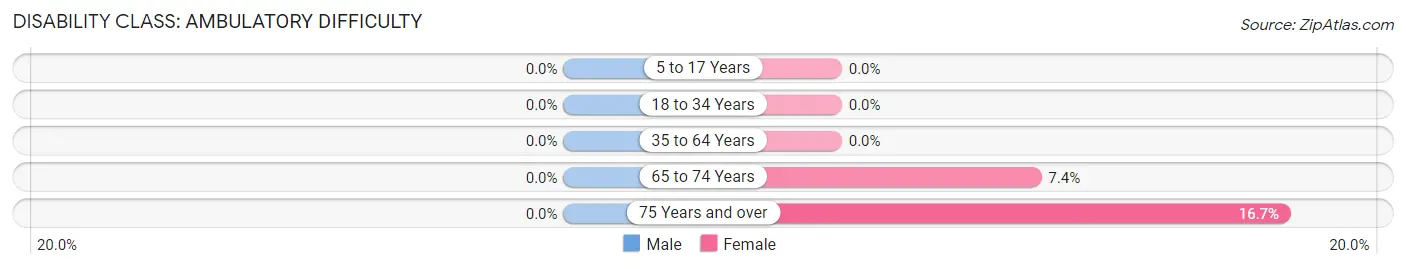
| Age Bracket | Male | Female |
| 5 to 17 Years | 0 (0.0%) | 0 (0.0%) |
| 18 to 34 Years | 0 (0.0%) | 0 (0.0%) |
| 35 to 64 Years | 0 (0.0%) | 0 (0.0%) |
| 65 to 74 Years | 0 (0.0%) | 2 (7.4%) |
| 75 Years and over | 0 (0.0%) | 2 (16.7%) |
Disability Class: Self-Care Difficulty
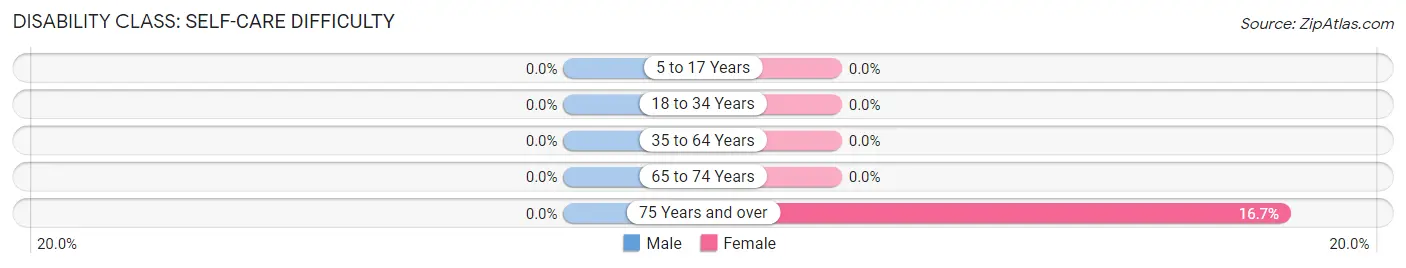
| Age Bracket | Male | Female |
| 5 to 17 Years | 0 (0.0%) | 0 (0.0%) |
| 18 to 34 Years | 0 (0.0%) | 0 (0.0%) |
| 35 to 64 Years | 0 (0.0%) | 0 (0.0%) |
| 65 to 74 Years | 0 (0.0%) | 0 (0.0%) |
| 75 Years and over | 0 (0.0%) | 2 (16.7%) |
Technology Access in Pawleys Island
Computing Device Access in Pawleys Island
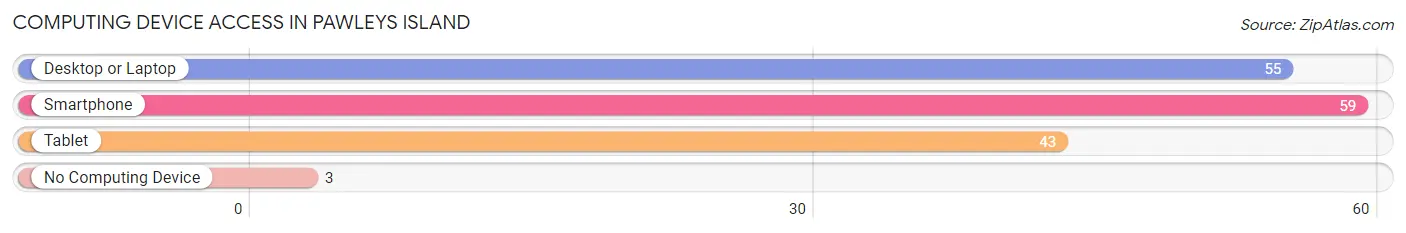
| Device Type | # Households | % Households |
| Desktop or Laptop | 55 | 85.9% |
| Smartphone | 59 | 92.2% |
| Tablet | 43 | 67.2% |
| No Computing Device | 3 | 4.7% |
| Total | 64 | 100.0% |
Internet Access in Pawleys Island
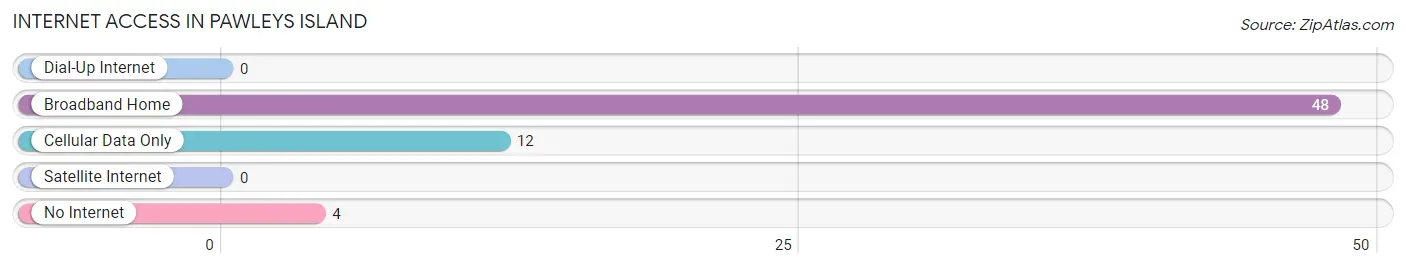
| Internet Type | # Households | % Households |
| Dial-Up Internet | 0 | 0.0% |
| Broadband Home | 48 | 75.0% |
| Cellular Data Only | 12 | 18.8% |
| Satellite Internet | 0 | 0.0% |
| No Internet | 4 | 6.2% |
| Total | 64 | 100.0% |
Pawleys Island Summary
Pawleys Island is a small barrier island located in Georgetown County, South Carolina. It is situated between the Waccamaw River and the Atlantic Ocean, and is part of the Grand Strand, a 60-mile stretch of beaches along the South Carolina coast. The island is known for its laid-back atmosphere, beautiful beaches, and historic charm.
Geography
Pawleys Island is a 4.5-mile long barrier island located in Georgetown County, South Carolina. It is situated between the Waccamaw River and the Atlantic Ocean, and is part of the Grand Strand, a 60-mile stretch of beaches along the South Carolina coast. The island is bordered by the Waccamaw River to the west, the Atlantic Ocean to the east, and the North Inlet to the south. The island is connected to the mainland by two bridges, the North Causeway and the South Causeway.
The island is composed of a variety of habitats, including maritime forests, salt marshes, and beaches. The maritime forests are composed of live oaks, magnolias, and other hardwood trees, while the salt marshes are composed of cordgrass and other marsh grasses. The beaches are composed of white sand and are popular for swimming, sunbathing, and fishing.
History
Pawleys Island has a long and storied history. The island was first inhabited by the Waccamaw Indians, who lived on the island for centuries before the arrival of European settlers. The island was named after the Waccamaw chief, Pawley, who lived on the island in the late 1600s.
In the 1700s, the island was settled by English planters, who established rice plantations on the island. The island was also home to a number of wealthy families, including the Allstons, the Middletons, and the Pawleys. The island was a popular vacation destination for wealthy families from Charleston and other cities in the South.
In the late 1800s, the island became a popular destination for wealthy Northerners, who built large summer homes on the island. The island was also home to a number of resorts, including the Pawleys Island Hotel, which opened in 1872.
In the early 1900s, the island was hit hard by the Great Depression and World War II. Many of the island’s resorts and summer homes were abandoned, and the island’s population dwindled.
In the 1950s, the island began to experience a resurgence in popularity, as tourists from around the country began to flock to the island’s beaches. The island’s population began to grow, and the island’s economy began to recover.
Today, Pawleys Island is a popular vacation destination, known for its laid-back atmosphere, beautiful beaches, and historic charm.
Economy
Pawleys Island’s economy is largely driven by tourism. The island is home to a number of resorts, hotels, restaurants, and shops, which cater to tourists from around the country. The island is also home to a number of marinas, which offer boat rentals and fishing charters.
The island is also home to a number of businesses that provide services to the local community, including grocery stores, banks, and medical facilities.
Demographics
As of the 2010 census, the population of Pawleys Island was 2,374. The population is composed of a variety of ethnic and racial backgrounds, including White (77.2%), African American (14.2%), Hispanic (3.2%), and Asian (2.2%).
The median household income in Pawleys Island is $50,945, and the median home value is $323,400. The island has a low unemployment rate of 3.2%.
Conclusion
Pawleys Island is a small barrier island located in Georgetown County, South Carolina. It is situated between the Waccamaw River and the Atlantic Ocean, and is part of the Grand Strand, a 60-mile stretch of beaches along the South Carolina coast. The island is known for its laid-back atmosphere, beautiful beaches, and historic charm. The island’s economy is largely driven by tourism, and the island is home to a variety of businesses that cater to tourists and locals alike. The population of Pawleys Island is composed of a variety of ethnic and racial backgrounds, and the median household income is $50,945.
Common Questions
What is Per Capita Income in Pawleys Island?
Per Capita income in Pawleys Island is $146,647.
What is the Median Family Income in Pawleys Island?
Median Family Income in Pawleys Island is $162,500.
What is the Median Household income in Pawleys Island?
Median Household Income in Pawleys Island is $91,250.
What is Inequality or Gini Index in Pawleys Island?
Inequality or Gini Index in Pawleys Island is 0.65.
What is the Total Population of Pawleys Island?
Total Population of Pawleys Island is 104.
What is the Total Male Population of Pawleys Island?
Total Male Population of Pawleys Island is 45.
What is the Total Female Population of Pawleys Island?
Total Female Population of Pawleys Island is 59.
What is the Ratio of Males per 100 Females in Pawleys Island?
There are 76.27 Males per 100 Females in Pawleys Island.
What is the Ratio of Females per 100 Males in Pawleys Island?
There are 131.11 Females per 100 Males in Pawleys Island.
What is the Median Population Age in Pawleys Island?
Median Population Age in Pawleys Island is 70.4 Years.
What is the Average Family Size in Pawleys Island
Average Family Size in Pawleys Island is 2.0 People.
What is the Average Household Size in Pawleys Island
Average Household Size in Pawleys Island is 1.6 People.
How Large is the Labor Force in Pawleys Island?
There are 28 People in the Labor Forcein in Pawleys Island.
What is the Percentage of People in the Labor Force in Pawleys Island?
27.5% of People are in the Labor Force in Pawleys Island.