Zip Codes with the Highest Percentage of Households Without a Vehicle in North Augusta, SC
RELATED REPORTS & OPTIONS
Households without a Cars
North Augusta
Compare Zip Codes
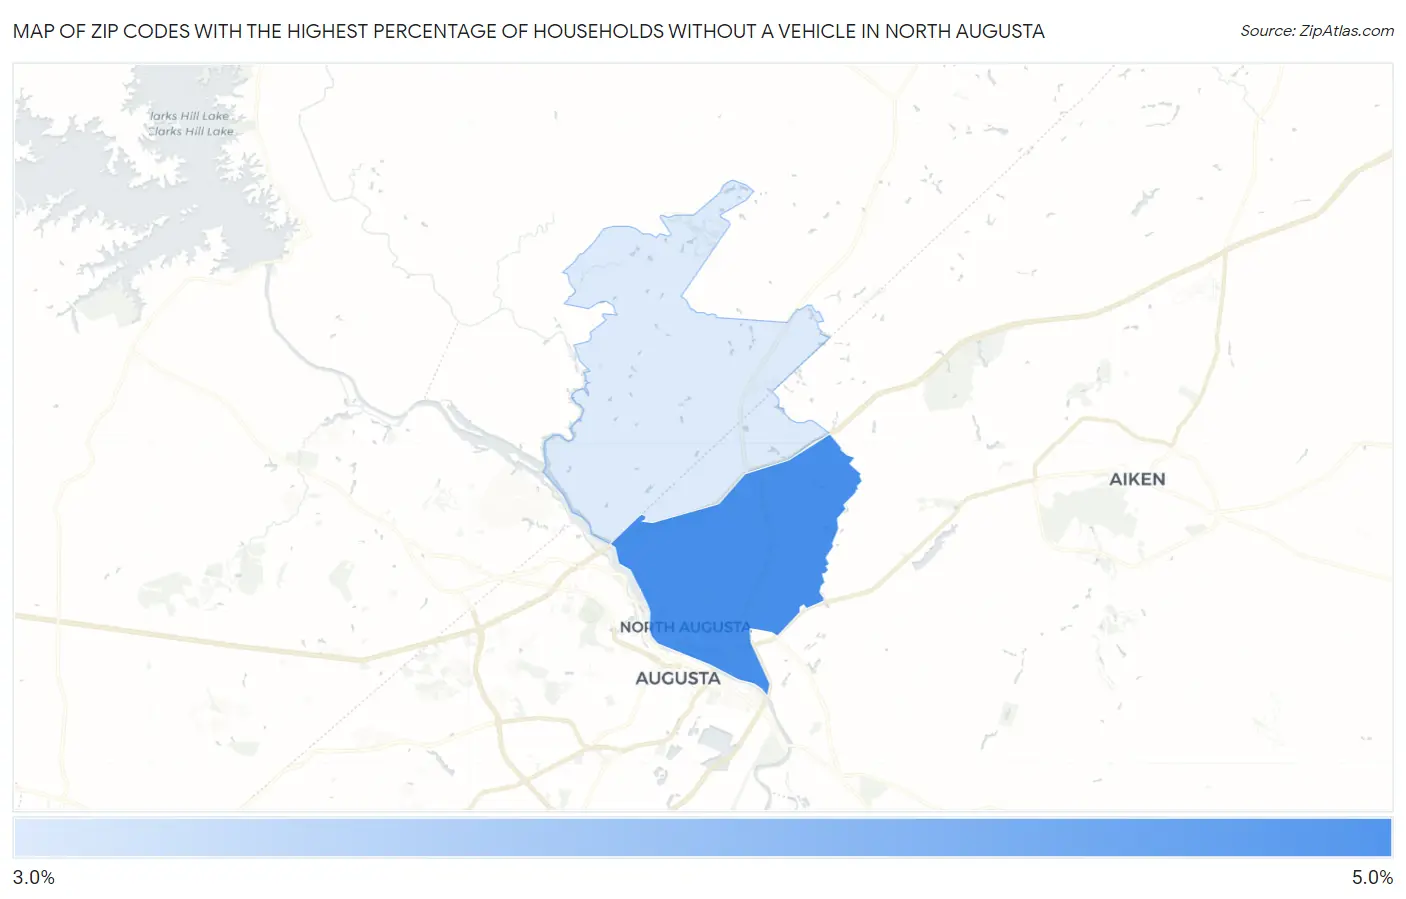
Map of Zip Codes with the Highest Percentage of Households Without a Vehicle in North Augusta
3.3%
4.1%
Zip Codes with the Highest Percentage of Households Without a Vehicle in North Augusta, SC
| Zip Code | Housholds Without a Car | vs State | vs National | |
| 1. | 29841 | 4.1% | 5.7%(-1.60)#244 | 8.3%(-4.20)#15,389 |
| 2. | 29860 | 3.3% | 5.7%(-2.40)#277 | 8.3%(-5.00)#18,042 |
1
Common Questions
What are the Top Zip Codes with the Highest Percentage of Households Without a Vehicle in North Augusta, SC?
Top Zip Codes with the Highest Percentage of Households Without a Vehicle in North Augusta, SC are:
What zip code has the Highest Percentage of Households Without a Vehicle in North Augusta, SC?
29841 has the Highest Percentage of Households Without a Vehicle in North Augusta, SC with 4.1%.
What is the Percentage of Households Without a Vehicle in North Augusta, SC?
Percentage of Households Without a Vehicle in North Augusta is 3.5%.
What is the Percentage of Households Without a Vehicle in South Carolina?
Percentage of Households Without a Vehicle in South Carolina is 5.7%.
What is the Percentage of Households Without a Vehicle in the United States?
Percentage of Households Without a Vehicle in the United States is 8.3%.