Monarch Mill, SC Map & Demographics
Monarch Mill Map
Monarch Mill Overview
$33,404
PER CAPITA INCOME
$45,750
AVG FAMILY INCOME
$37,500
AVG HOUSEHOLD INCOME
6.4%
WAGE / INCOME GAP [ % ]
93.6¢/ $1
WAGE / INCOME GAP [ $ ]
0.58
INEQUALITY / GINI INDEX
1,766
TOTAL POPULATION
901
MALE POPULATION
865
FEMALE POPULATION
104.16
MALES / 100 FEMALES
96.00
FEMALES / 100 MALES
42.8
MEDIAN AGE
2.8
AVG FAMILY SIZE
2.2
AVG HOUSEHOLD SIZE
682
LABOR FORCE [ PEOPLE ]
48.3%
PERCENT IN LABOR FORCE
7.2%
UNEMPLOYMENT RATE
Income in Monarch Mill
Income Overview in Monarch Mill
Per Capita Income in Monarch Mill is $33,404, while median incomes of families and households are $45,750 and $37,500 respectively.
| Characteristic | Number | Measure |
| Per Capita Income | 1,766 | $33,404 |
| Median Family Income | 515 | $45,750 |
| Mean Family Income | 515 | $77,714 |
| Median Household Income | 796 | $37,500 |
| Mean Household Income | 796 | $77,155 |
| Income Deficit | 515 | $0 |
| Wage / Income Gap (%) | 1,766 | 6.41% |
| Wage / Income Gap ($) | 1,766 | 93.59¢ per $1 |
| Gini / Inequality Index | 1,766 | 0.58 |
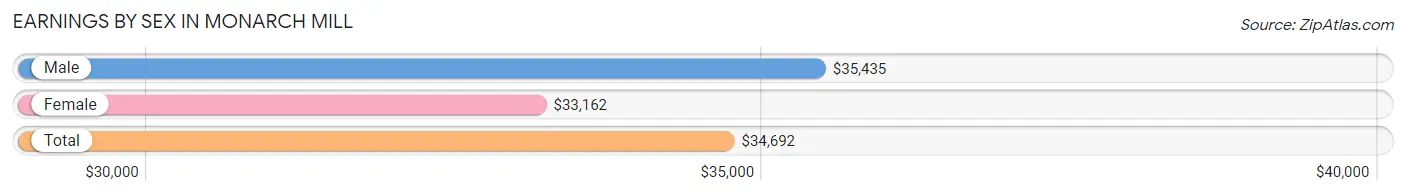
Earnings by Sex in Monarch Mill
Average Earnings in Monarch Mill are $34,692, $35,435 for men and $33,162 for women, a difference of 6.4%.
| Sex | Number | Average Earnings |
| Male | 416 (59.4%) | $35,435 |
| Female | 284 (40.6%) | $33,162 |
| Total | 700 (100.0%) | $34,692 |
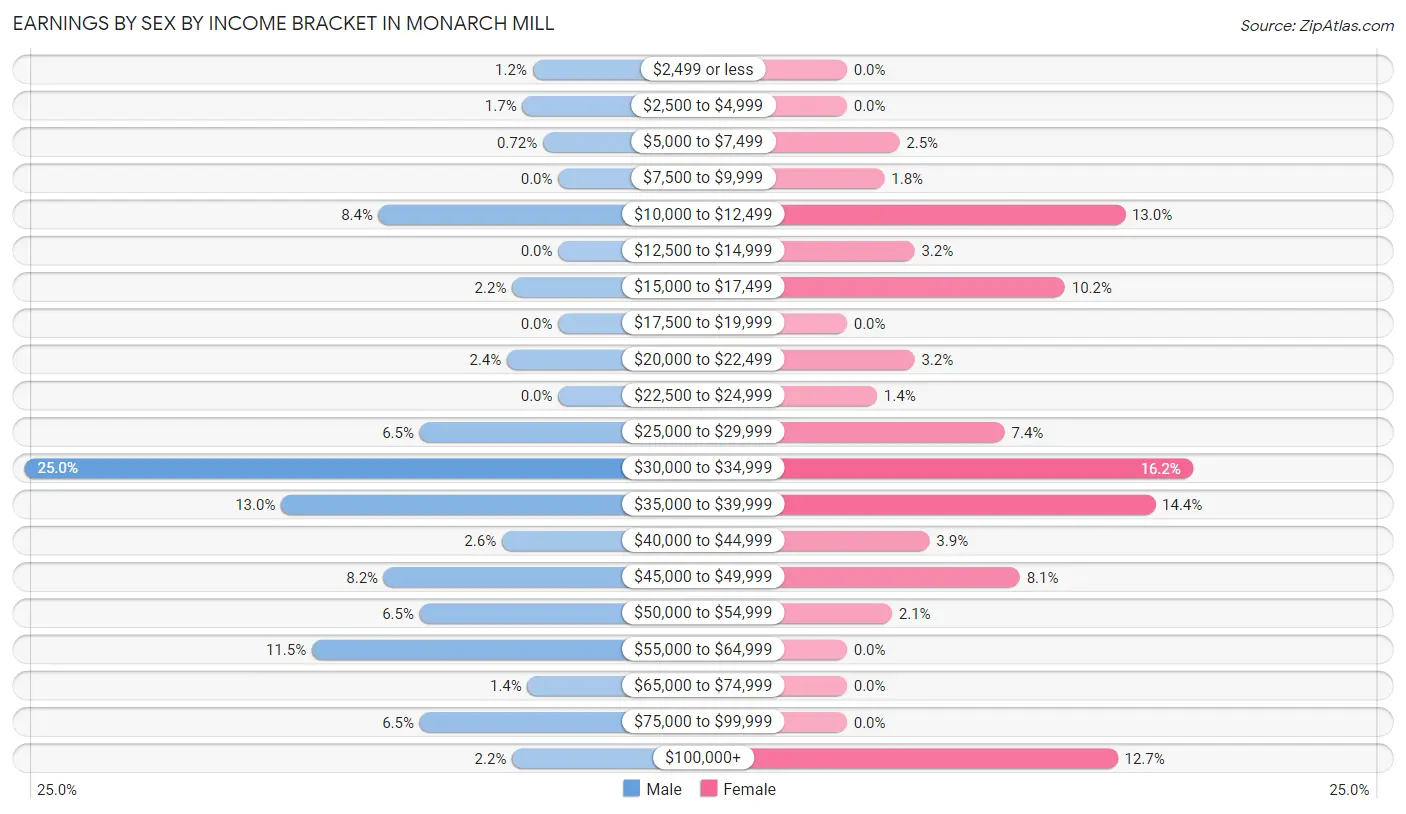
Earnings by Sex by Income Bracket in Monarch Mill
The most common earnings brackets in Monarch Mill are $30,000 to $34,999 for men (104 | 25.0%) and $30,000 to $34,999 for women (46 | 16.2%).
| Income | Male | Female |
| $2,499 or less | 5 (1.2%) | 0 (0.0%) |
| $2,500 to $4,999 | 7 (1.7%) | 0 (0.0%) |
| $5,000 to $7,499 | 3 (0.7%) | 7 (2.5%) |
| $7,500 to $9,999 | 0 (0.0%) | 5 (1.8%) |
| $10,000 to $12,499 | 35 (8.4%) | 37 (13.0%) |
| $12,500 to $14,999 | 0 (0.0%) | 9 (3.2%) |
| $15,000 to $17,499 | 9 (2.2%) | 29 (10.2%) |
| $17,500 to $19,999 | 0 (0.0%) | 0 (0.0%) |
| $20,000 to $22,499 | 10 (2.4%) | 9 (3.2%) |
| $22,500 to $24,999 | 0 (0.0%) | 4 (1.4%) |
| $25,000 to $29,999 | 27 (6.5%) | 21 (7.4%) |
| $30,000 to $34,999 | 104 (25.0%) | 46 (16.2%) |
| $35,000 to $39,999 | 54 (13.0%) | 41 (14.4%) |
| $40,000 to $44,999 | 11 (2.6%) | 11 (3.9%) |
| $45,000 to $49,999 | 34 (8.2%) | 23 (8.1%) |
| $50,000 to $54,999 | 27 (6.5%) | 6 (2.1%) |
| $55,000 to $64,999 | 48 (11.5%) | 0 (0.0%) |
| $65,000 to $74,999 | 6 (1.4%) | 0 (0.0%) |
| $75,000 to $99,999 | 27 (6.5%) | 0 (0.0%) |
| $100,000+ | 9 (2.2%) | 36 (12.7%) |
| Total | 416 (100.0%) | 284 (100.0%) |
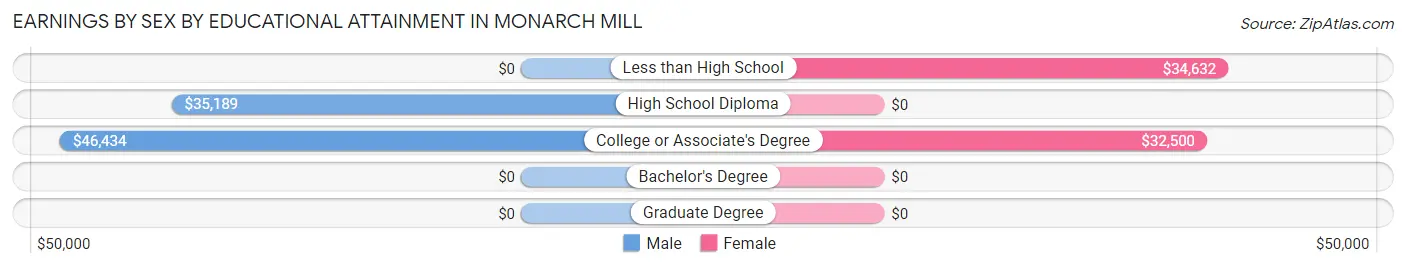
Earnings by Sex by Educational Attainment in Monarch Mill
Average earnings in Monarch Mill are $37,201 for men and $33,419 for women, a difference of 10.2%. Men with an educational attainment of college or associate's degree enjoy the highest average annual earnings of $46,434, while those with high school diploma education earn the least with $35,189. Women with an educational attainment of less than high school earn the most with the average annual earnings of $34,632, while those with college or associate's degree education have the smallest earnings of $32,500.
| Educational Attainment | Male Income | Female Income |
| Less than High School | - | - |
| High School Diploma | $35,189 | $0 |
| College or Associate's Degree | $46,434 | $32,500 |
| Bachelor's Degree | - | - |
| Graduate Degree | - | - |
| Total | $37,201 | $33,419 |
Family Income in Monarch Mill
Family Income Brackets in Monarch Mill
According to the Monarch Mill family income data, there are 133 families falling into the $25,000 to $34,999 income range, which is the most common income bracket and makes up 25.8% of all families.
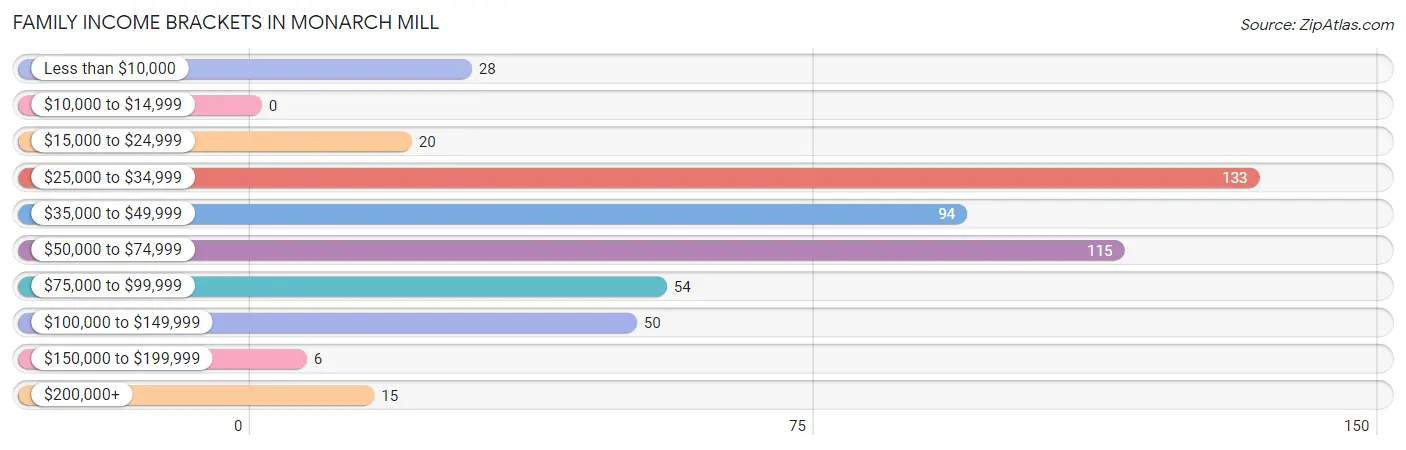
| Income Bracket | # Families | % Families |
| Less than $10,000 | 28 | 5.4% |
| $10,000 to $14,999 | 0 | 0.0% |
| $15,000 to $24,999 | 20 | 3.9% |
| $25,000 to $34,999 | 133 | 25.8% |
| $35,000 to $49,999 | 94 | 18.3% |
| $50,000 to $74,999 | 115 | 22.3% |
| $75,000 to $99,999 | 54 | 10.5% |
| $100,000 to $149,999 | 50 | 9.7% |
| $150,000 to $199,999 | 6 | 1.2% |
| $200,000+ | 15 | 2.9% |
Family Income by Famaliy Size in Monarch Mill
3-person families (114 | 22.1%) account for the highest median family income in Monarch Mill with $84,500 per family, while 3-person families (114 | 22.1%) have the highest median income of $28,167 per family member.
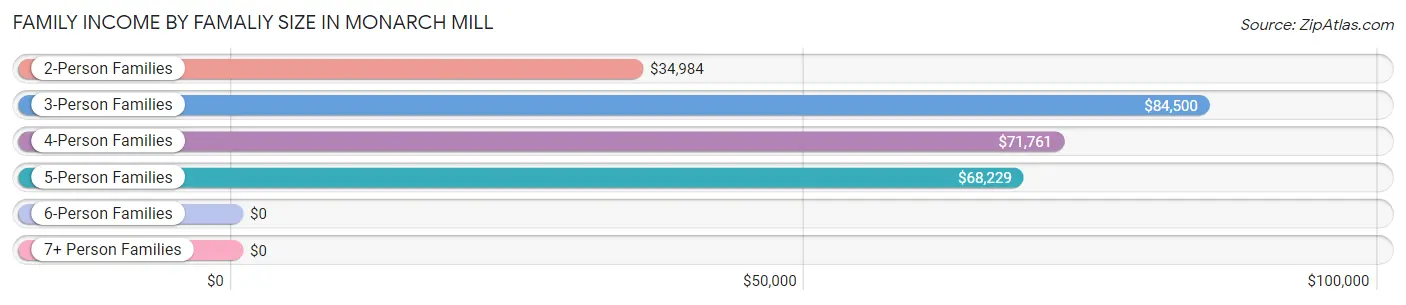
| Income Bracket | # Families | Median Income |
| 2-Person Families | 297 (57.7%) | $34,984 |
| 3-Person Families | 114 (22.1%) | $84,500 |
| 4-Person Families | 59 (11.5%) | $71,761 |
| 5-Person Families | 29 (5.6%) | $68,229 |
| 6-Person Families | 16 (3.1%) | $0 |
| 7+ Person Families | 0 (0.0%) | $0 |
| Total | 515 (100.0%) | $45,750 |
Family Income by Number of Earners in Monarch Mill
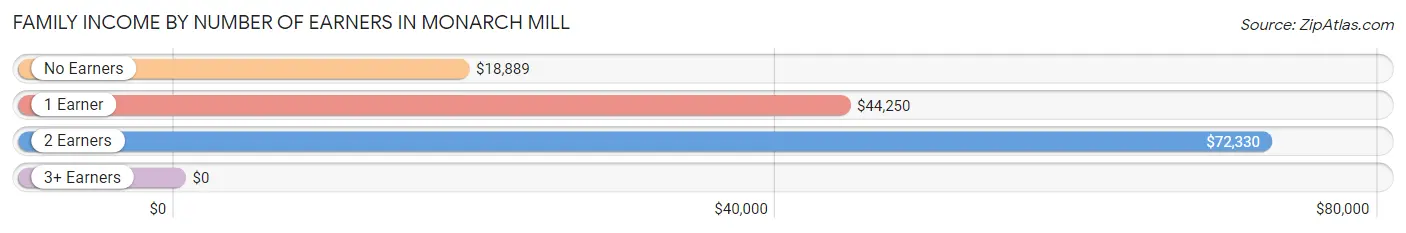
| Number of Earners | # Families | Median Income |
| No Earners | 88 (17.1%) | $18,889 |
| 1 Earner | 345 (67.0%) | $44,250 |
| 2 Earners | 79 (15.3%) | $72,330 |
| 3+ Earners | 3 (0.6%) | $0 |
| Total | 515 (100.0%) | $45,750 |
Household Income in Monarch Mill
Household Income Brackets in Monarch Mill
With 188 households falling in the category, the $25,000 to $34,999 income range is the most frequent in Monarch Mill, accounting for 23.6% of all households. In contrast, only 6 households (0.7%) fall into the $150,000 to $199,999 income bracket, making it the least populous group.
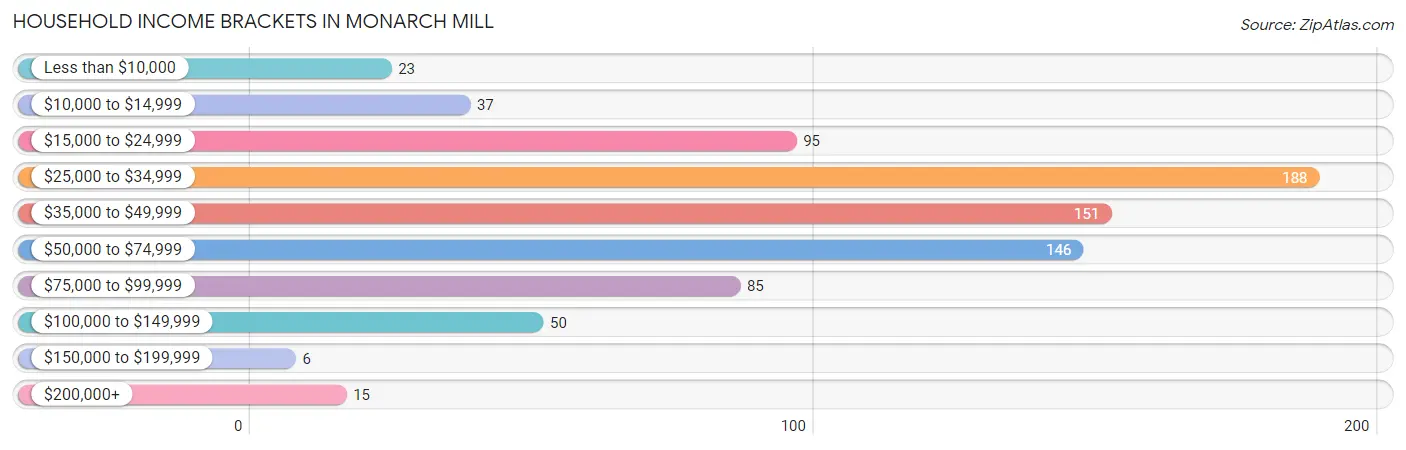
| Income Bracket | # Households | % Households |
| Less than $10,000 | 23 | 2.9% |
| $10,000 to $14,999 | 37 | 4.6% |
| $15,000 to $24,999 | 95 | 11.9% |
| $25,000 to $34,999 | 188 | 23.6% |
| $35,000 to $49,999 | 151 | 19.0% |
| $50,000 to $74,999 | 146 | 18.3% |
| $75,000 to $99,999 | 85 | 10.7% |
| $100,000 to $149,999 | 50 | 6.3% |
| $150,000 to $199,999 | 6 | 0.8% |
| $200,000+ | 15 | 1.9% |
Household Income by Householder Age in Monarch Mill
The median household income in Monarch Mill is $37,500, with the highest median household income of $55,500 found in the 25 to 44 years age bracket for the primary householder. A total of 198 households (24.9%) fall into this category. Meanwhile, the 45 to 64 years age bracket for the primary householder has the lowest median household income of $26,458, with 229 households (28.8%) in this group.
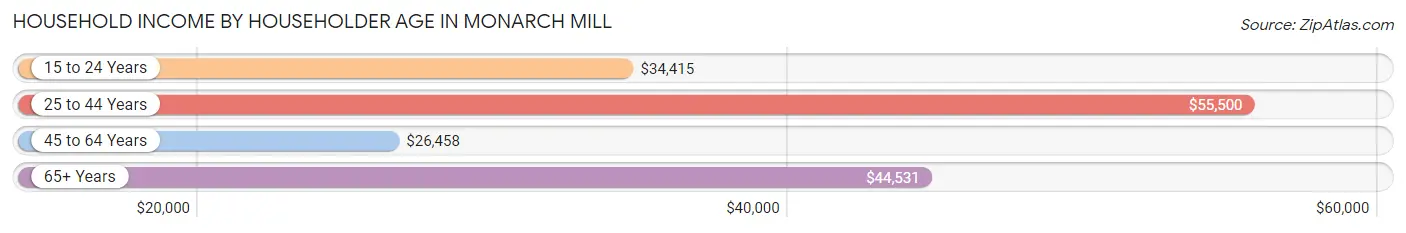
| Income Bracket | # Households | Median Income |
| 15 to 24 Years | 121 (15.2%) | $34,415 |
| 25 to 44 Years | 198 (24.9%) | $55,500 |
| 45 to 64 Years | 229 (28.8%) | $26,458 |
| 65+ Years | 248 (31.2%) | $44,531 |
| Total | 796 (100.0%) | $37,500 |
Poverty in Monarch Mill
Income Below Poverty by Sex and Age in Monarch Mill
With 11.9% poverty level for males and 21.4% for females among the residents of Monarch Mill, 16 and 17 year old males and under 5 year old females are the most vulnerable to poverty, with 22 males (100.0%) and 80 females (54.4%) in their respective age groups living below the poverty level.
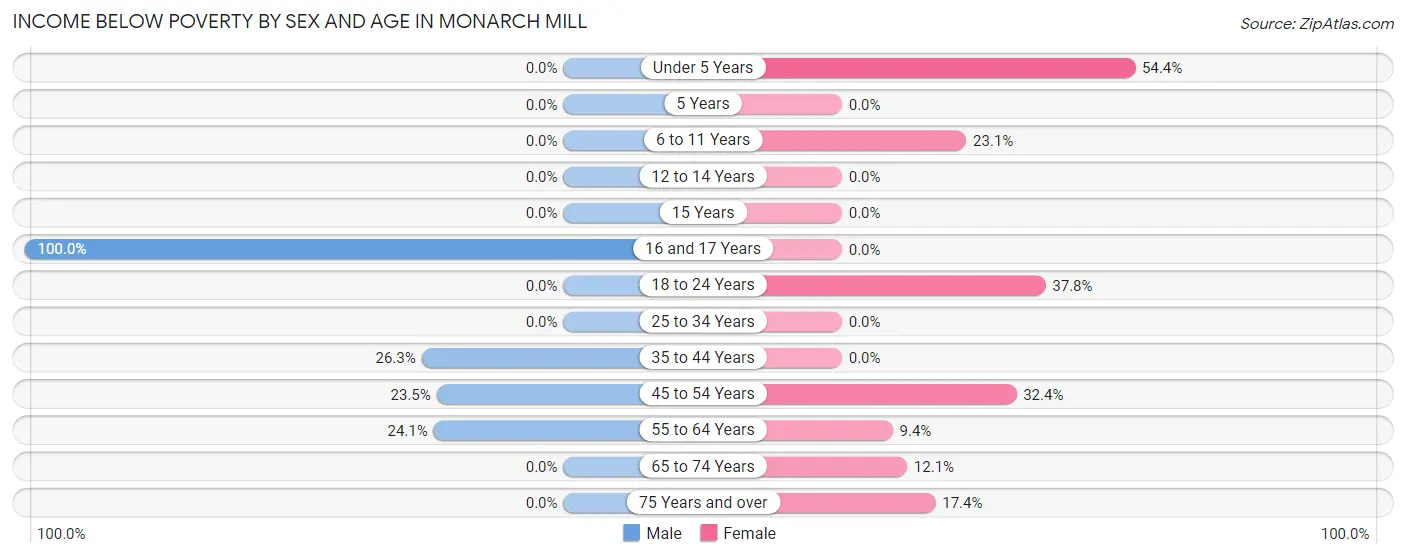
| Age Bracket | Male | Female |
| Under 5 Years | 0 (0.0%) | 80 (54.4%) |
| 5 Years | 0 (0.0%) | 0 (0.0%) |
| 6 to 11 Years | 0 (0.0%) | 12 (23.1%) |
| 12 to 14 Years | 0 (0.0%) | 0 (0.0%) |
| 15 Years | 0 (0.0%) | 0 (0.0%) |
| 16 and 17 Years | 22 (100.0%) | 0 (0.0%) |
| 18 to 24 Years | 0 (0.0%) | 17 (37.8%) |
| 25 to 34 Years | 0 (0.0%) | 0 (0.0%) |
| 35 to 44 Years | 20 (26.3%) | 0 (0.0%) |
| 45 to 54 Years | 32 (23.5%) | 34 (32.4%) |
| 55 to 64 Years | 33 (24.1%) | 10 (9.4%) |
| 65 to 74 Years | 0 (0.0%) | 11 (12.1%) |
| 75 Years and over | 0 (0.0%) | 21 (17.4%) |
| Total | 107 (11.9%) | 185 (21.4%) |
Income Above Poverty by Sex and Age in Monarch Mill
According to the poverty statistics in Monarch Mill, males aged under 5 years and females aged 12 to 14 years are the age groups that are most secure financially, with 100.0% of males and 100.0% of females in these age groups living above the poverty line.
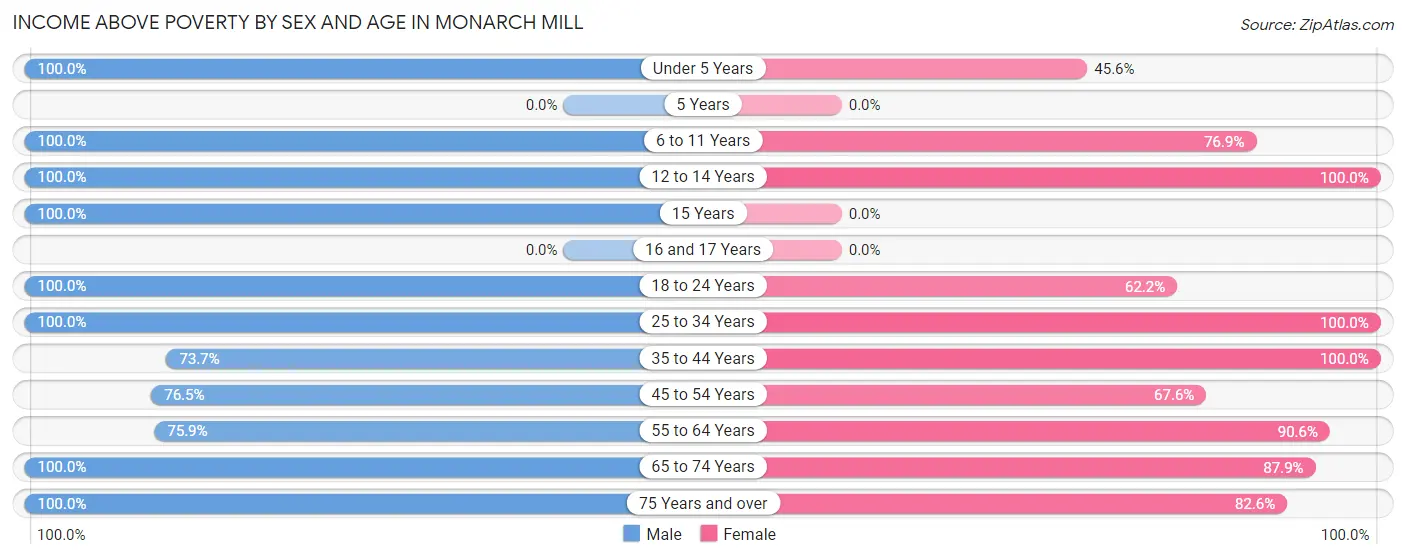
| Age Bracket | Male | Female |
| Under 5 Years | 32 (100.0%) | 67 (45.6%) |
| 5 Years | 0 (0.0%) | 0 (0.0%) |
| 6 to 11 Years | 46 (100.0%) | 40 (76.9%) |
| 12 to 14 Years | 27 (100.0%) | 29 (100.0%) |
| 15 Years | 20 (100.0%) | 0 (0.0%) |
| 16 and 17 Years | 0 (0.0%) | 0 (0.0%) |
| 18 to 24 Years | 137 (100.0%) | 28 (62.2%) |
| 25 to 34 Years | 136 (100.0%) | 84 (100.0%) |
| 35 to 44 Years | 56 (73.7%) | 85 (100.0%) |
| 45 to 54 Years | 104 (76.5%) | 71 (67.6%) |
| 55 to 64 Years | 104 (75.9%) | 96 (90.6%) |
| 65 to 74 Years | 87 (100.0%) | 80 (87.9%) |
| 75 Years and over | 45 (100.0%) | 100 (82.6%) |
| Total | 794 (88.1%) | 680 (78.6%) |
Income Below Poverty Among Married-Couple Families in Monarch Mill
The poverty statistics for married-couple families in Monarch Mill show that 7.0% or 20 of the total 286 families live below the poverty line. Families with 1 or 2 children have the highest poverty rate of 14.5%, comprising of 11 families. On the other hand, families with 3 or 4 children have the lowest poverty rate of 0.0%, which includes 0 families.
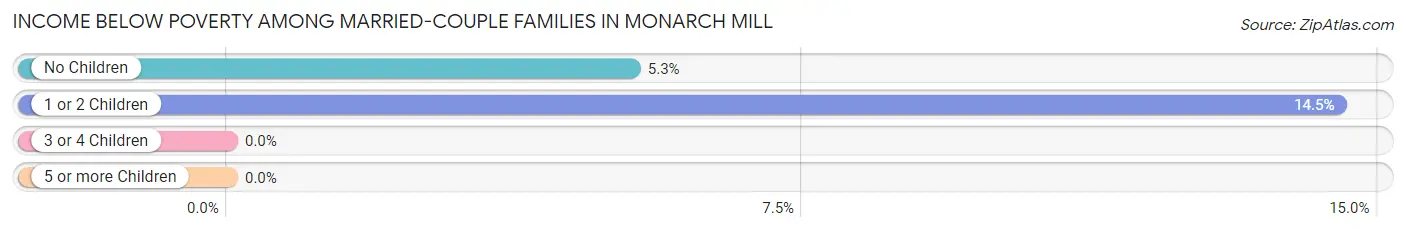
| Children | Above Poverty | Below Poverty |
| No Children | 162 (94.7%) | 9 (5.3%) |
| 1 or 2 Children | 65 (85.5%) | 11 (14.5%) |
| 3 or 4 Children | 39 (100.0%) | 0 (0.0%) |
| 5 or more Children | 0 (0.0%) | 0 (0.0%) |
| Total | 266 (93.0%) | 20 (7.0%) |
Income Below Poverty Among Single-Parent Households in Monarch Mill
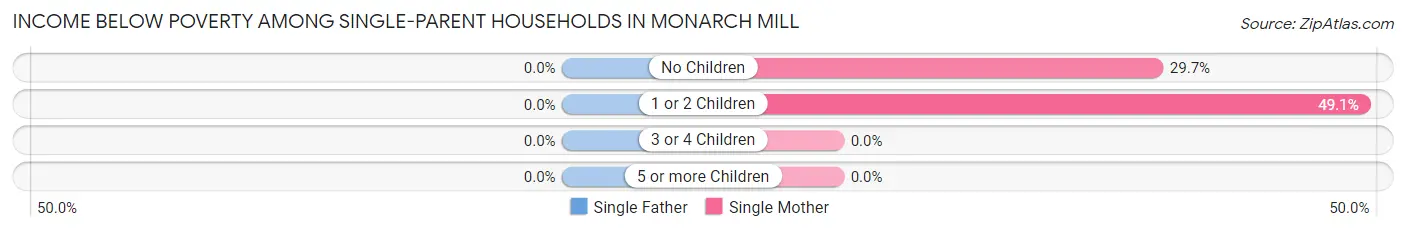
| Children | Single Father | Single Mother |
| No Children | 0 (0.0%) | 11 (29.7%) |
| 1 or 2 Children | 0 (0.0%) | 26 (49.1%) |
| 3 or 4 Children | 0 (0.0%) | 0 (0.0%) |
| 5 or more Children | 0 (0.0%) | 0 (0.0%) |
| Total | 0 (0.0%) | 37 (41.1%) |
Income Below Poverty Among Married-Couple vs Single-Parent Households in Monarch Mill
The poverty data for Monarch Mill shows that 20 of the married-couple family households (7.0%) and 37 of the single-parent households (16.2%) are living below the poverty level. Within the married-couple family households, those with 1 or 2 children have the highest poverty rate, with 11 households (14.5%) falling below the poverty line. Among the single-parent households, those with no children have the highest poverty rate, with 11 household (17.2%) living below poverty.
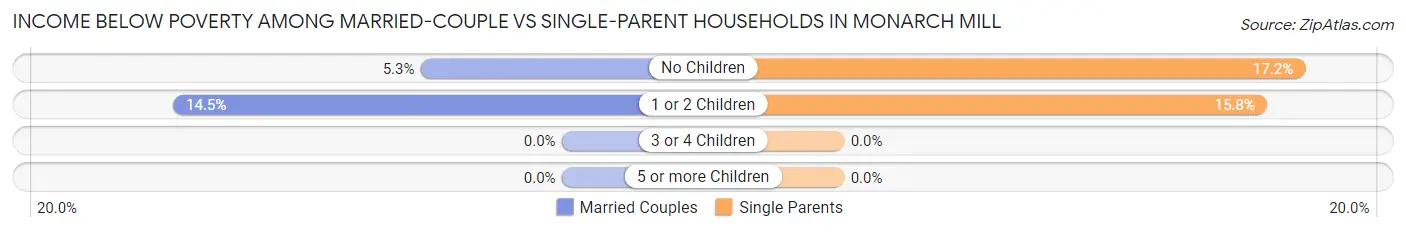
| Children | Married-Couple Families | Single-Parent Households |
| No Children | 9 (5.3%) | 11 (17.2%) |
| 1 or 2 Children | 11 (14.5%) | 26 (15.8%) |
| 3 or 4 Children | 0 (0.0%) | 0 (0.0%) |
| 5 or more Children | 0 (0.0%) | 0 (0.0%) |
| Total | 20 (7.0%) | 37 (16.2%) |
Race in Monarch Mill
The most populous races in Monarch Mill are White / Caucasian (1,103 | 62.5%), Black / African American (404 | 22.9%), and Two or more Races (241 | 13.7%).
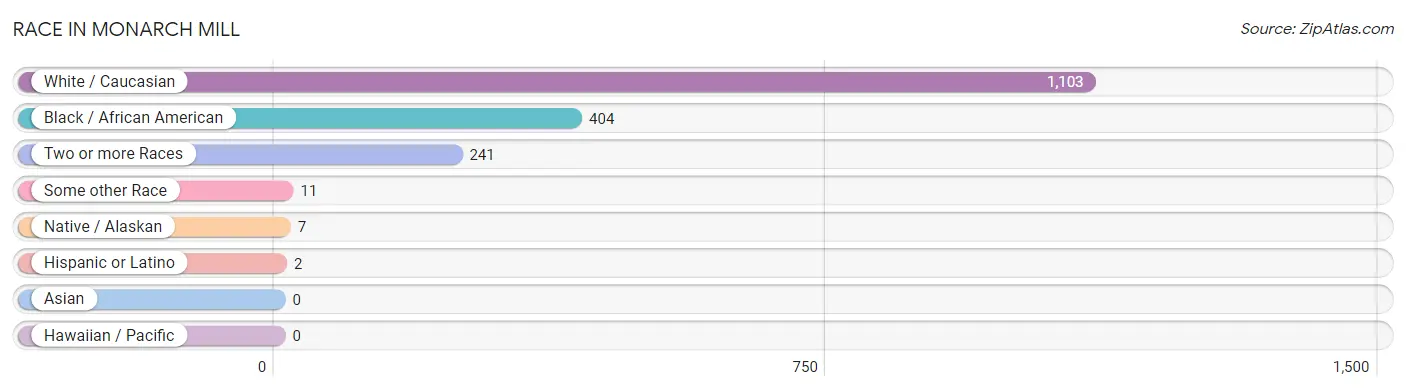
| Race | # Population | % Population |
| Asian | 0 | 0.0% |
| Black / African American | 404 | 22.9% |
| Hawaiian / Pacific | 0 | 0.0% |
| Hispanic or Latino | 2 | 0.1% |
| Native / Alaskan | 7 | 0.4% |
| White / Caucasian | 1,103 | 62.5% |
| Two or more Races | 241 | 13.7% |
| Some other Race | 11 | 0.6% |
| Total | 1,766 | 100.0% |
Ancestry in Monarch Mill
The most populous ancestries reported in Monarch Mill are German (187 | 10.6%), Irish (144 | 8.2%), English (140 | 7.9%), Barbadian (127 | 7.2%), and Cherokee (125 | 7.1%), together accounting for 40.9% of all Monarch Mill residents.
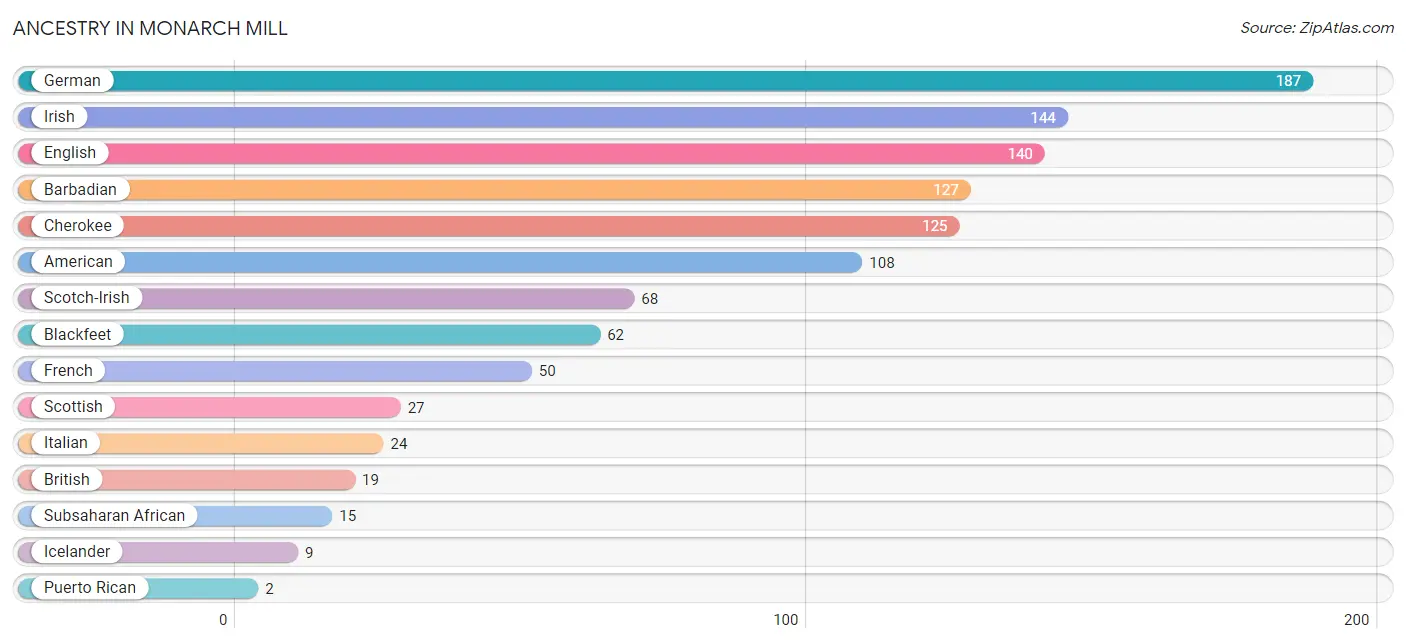
| Ancestry | # Population | % Population |
| American | 108 | 6.1% |
| Barbadian | 127 | 7.2% |
| Blackfeet | 62 | 3.5% |
| British | 19 | 1.1% |
| Cherokee | 125 | 7.1% |
| English | 140 | 7.9% |
| French | 50 | 2.8% |
| German | 187 | 10.6% |
| Icelander | 9 | 0.5% |
| Irish | 144 | 8.2% |
| Italian | 24 | 1.4% |
| Northern European | 1 | 0.1% |
| Puerto Rican | 2 | 0.1% |
| Scotch-Irish | 68 | 3.8% |
| Scottish | 27 | 1.5% |
| Subsaharan African | 15 | 0.9% | View All 16 Rows |
Immigrants in Monarch Mill
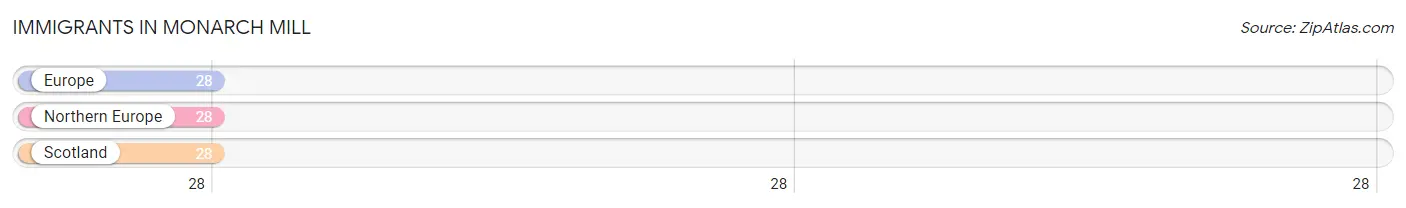
The most numerous immigrant groups reported in Monarch Mill came from Europe (28 | 1.6%), Northern Europe (28 | 1.6%), and Scotland (28 | 1.6%), together accounting for 4.8% of all Monarch Mill residents.
| Immigration Origin | # Population | % Population |
| Europe | 28 | 1.6% |
| Northern Europe | 28 | 1.6% |
| Scotland | 28 | 1.6% | View All 3 Rows |
Sex and Age in Monarch Mill
Sex and Age in Monarch Mill
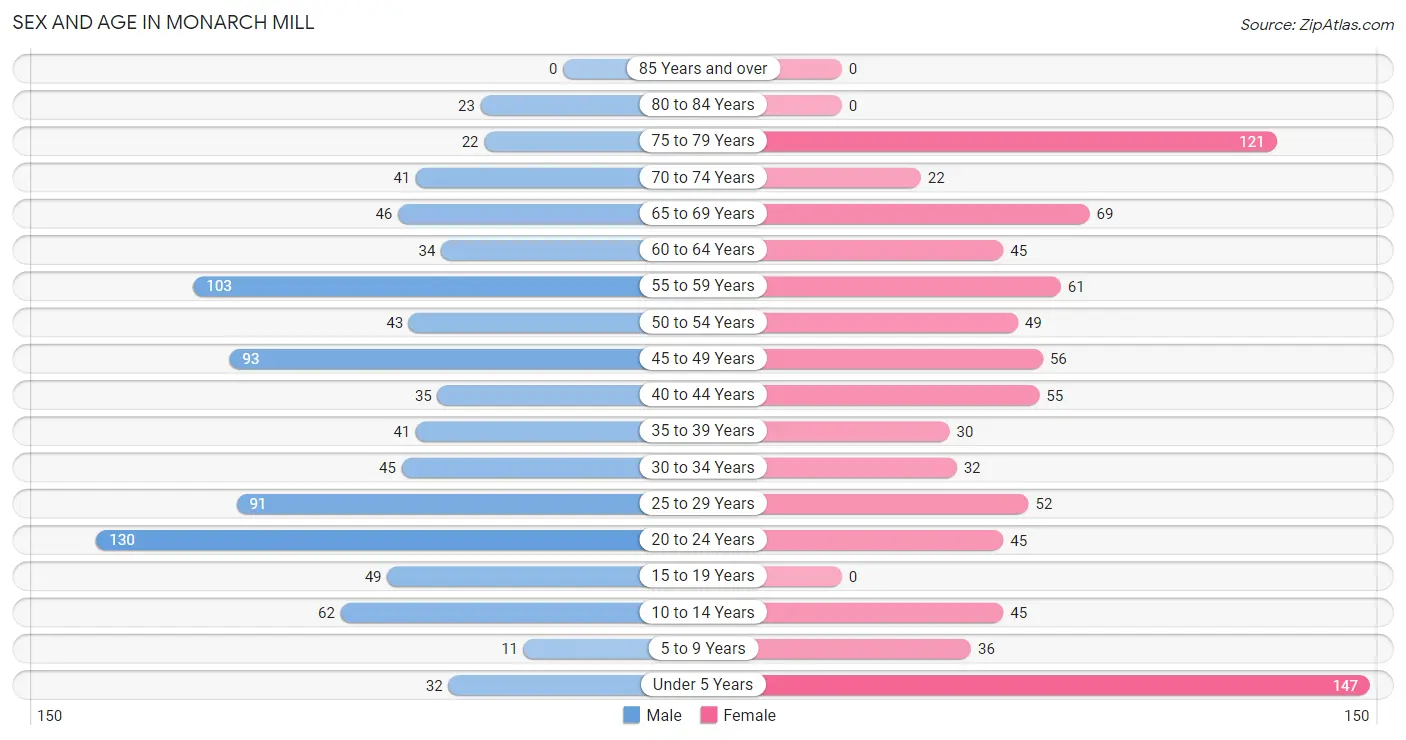
The most populous age groups in Monarch Mill are 20 to 24 Years (130 | 14.4%) for men and Under 5 Years (147 | 17.0%) for women.
| Age Bracket | Male | Female |
| Under 5 Years | 32 (3.5%) | 147 (17.0%) |
| 5 to 9 Years | 11 (1.2%) | 36 (4.2%) |
| 10 to 14 Years | 62 (6.9%) | 45 (5.2%) |
| 15 to 19 Years | 49 (5.4%) | 0 (0.0%) |
| 20 to 24 Years | 130 (14.4%) | 45 (5.2%) |
| 25 to 29 Years | 91 (10.1%) | 52 (6.0%) |
| 30 to 34 Years | 45 (5.0%) | 32 (3.7%) |
| 35 to 39 Years | 41 (4.5%) | 30 (3.5%) |
| 40 to 44 Years | 35 (3.9%) | 55 (6.4%) |
| 45 to 49 Years | 93 (10.3%) | 56 (6.5%) |
| 50 to 54 Years | 43 (4.8%) | 49 (5.7%) |
| 55 to 59 Years | 103 (11.4%) | 61 (7.0%) |
| 60 to 64 Years | 34 (3.8%) | 45 (5.2%) |
| 65 to 69 Years | 46 (5.1%) | 69 (8.0%) |
| 70 to 74 Years | 41 (4.5%) | 22 (2.5%) |
| 75 to 79 Years | 22 (2.4%) | 121 (14.0%) |
| 80 to 84 Years | 23 (2.5%) | 0 (0.0%) |
| 85 Years and over | 0 (0.0%) | 0 (0.0%) |
| Total | 901 (100.0%) | 865 (100.0%) |
Families and Households in Monarch Mill
Median Family Size in Monarch Mill
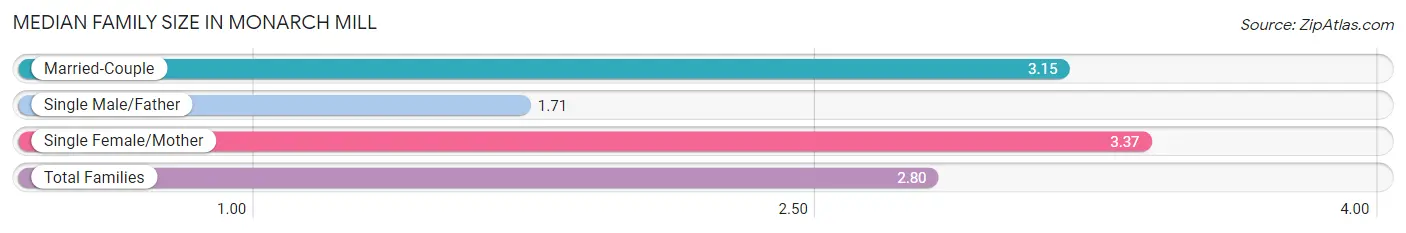
The median family size in Monarch Mill is 2.80 persons per family, with single female/mother families (90 | 17.5%) accounting for the largest median family size of 3.37 persons per family. On the other hand, single male/father families (139 | 27.0%) represent the smallest median family size with 1.71 persons per family.
| Family Type | # Families | Family Size |
| Married-Couple | 286 (55.5%) | 3.15 |
| Single Male/Father | 139 (27.0%) | 1.71 |
| Single Female/Mother | 90 (17.5%) | 3.37 |
| Total Families | 515 (100.0%) | 2.80 |
Median Household Size in Monarch Mill
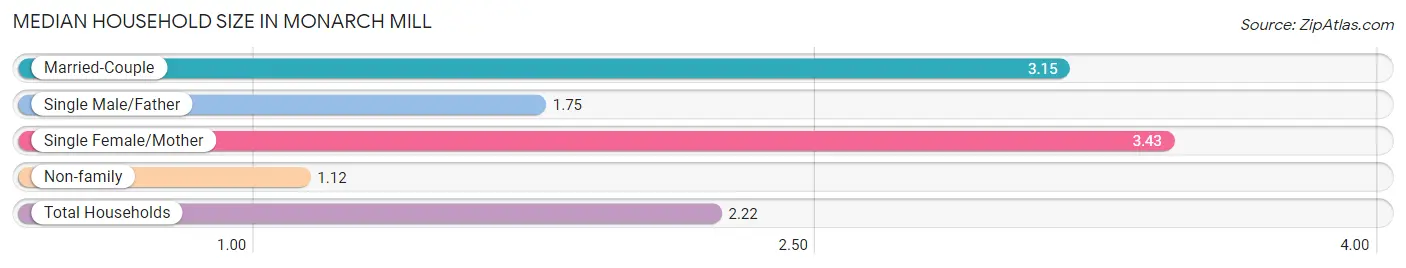
The median household size in Monarch Mill is 2.22 persons per household, with single female/mother households (90 | 11.3%) accounting for the largest median household size of 3.43 persons per household. non-family households (281 | 35.3%) represent the smallest median household size with 1.12 persons per household.
| Household Type | # Households | Household Size |
| Married-Couple | 286 (35.9%) | 3.15 |
| Single Male/Father | 139 (17.5%) | 1.75 |
| Single Female/Mother | 90 (11.3%) | 3.43 |
| Non-family | 281 (35.3%) | 1.12 |
| Total Households | 796 (100.0%) | 2.22 |
Household Size by Marriage Status in Monarch Mill
Out of a total of 796 households in Monarch Mill, 515 (64.7%) are family households, while 281 (35.3%) are nonfamily households. The most numerous type of family households are 2-person households, comprising 271, and the most common type of nonfamily households are 1-person households, comprising 242.
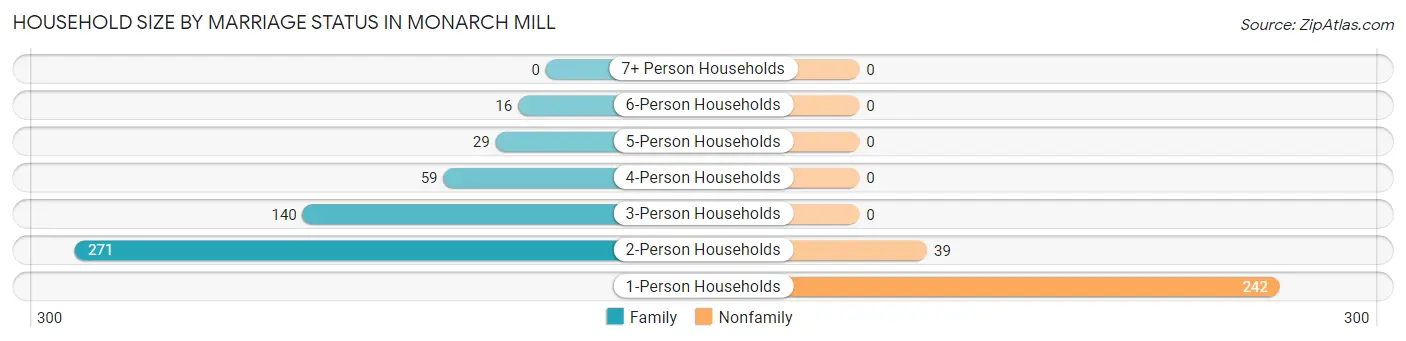
| Household Size | Family Households | Nonfamily Households |
| 1-Person Households | - | 242 (30.4%) |
| 2-Person Households | 271 (34.1%) | 39 (4.9%) |
| 3-Person Households | 140 (17.6%) | 0 (0.0%) |
| 4-Person Households | 59 (7.4%) | 0 (0.0%) |
| 5-Person Households | 29 (3.6%) | 0 (0.0%) |
| 6-Person Households | 16 (2.0%) | 0 (0.0%) |
| 7+ Person Households | 0 (0.0%) | 0 (0.0%) |
| Total | 515 (64.7%) | 281 (35.3%) |
Female Fertility in Monarch Mill
Fertility by Age in Monarch Mill
Average fertility rate in Monarch Mill is 141.0 births per 1,000 women. Women in the age bracket of 20 to 34 years have the highest fertility rate with 295.0 births per 1,000 women. Women in the age bracket of 20 to 34 years acount for 100.0% of all women with births.
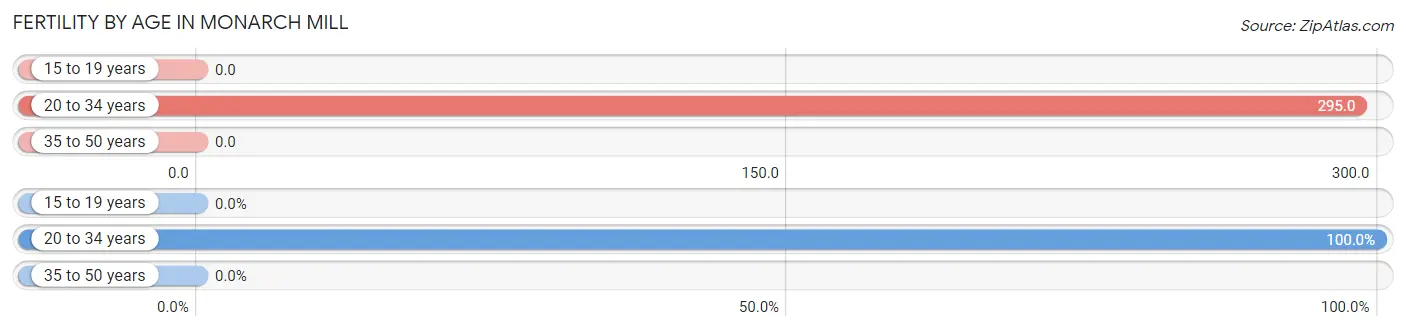
| Age Bracket | Women with Births | Births / 1,000 Women |
| 15 to 19 years | 0 (0.0%) | 0.0 |
| 20 to 34 years | 38 (100.0%) | 295.0 |
| 35 to 50 years | 0 (0.0%) | 0.0 |
| Total | 38 (100.0%) | 141.0 |
Fertility by Age by Marriage Status in Monarch Mill
55.3% of women with births (38) in Monarch Mill are married. The highest percentage of unmarried women with births falls into 20 to 34 years age bracket with 44.7% of them unmarried at the time of birth, while the lowest percentage of unmarried women with births belong to 20 to 34 years age bracket with 44.7% of them unmarried.
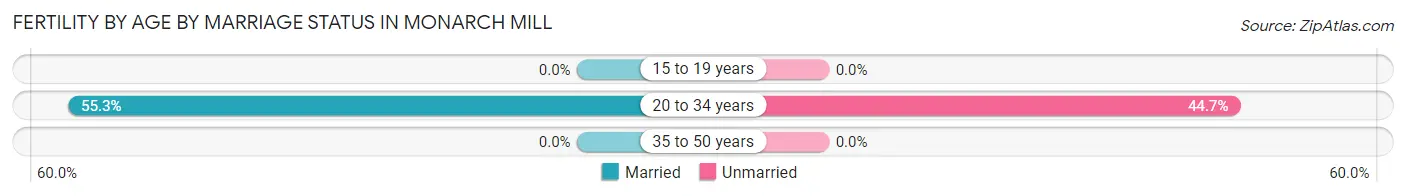
| Age Bracket | Married | Unmarried |
| 15 to 19 years | 0 (0.0%) | 0 (0.0%) |
| 20 to 34 years | 21 (55.3%) | 17 (44.7%) |
| 35 to 50 years | 0 (0.0%) | 0 (0.0%) |
| Total | 21 (55.3%) | 17 (44.7%) |
Fertility by Education in Monarch Mill
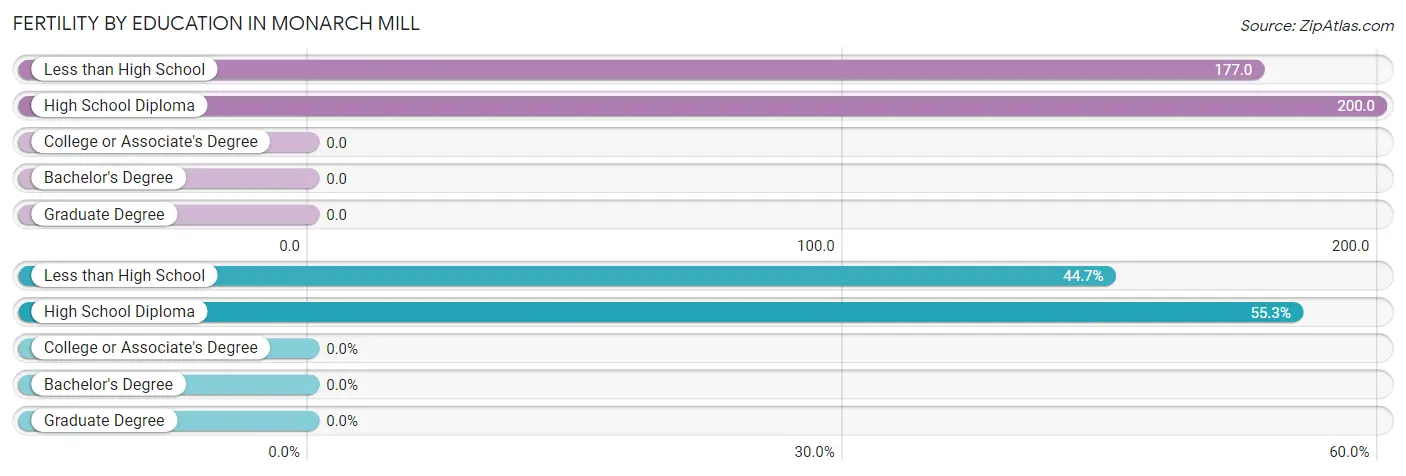
| Educational Attainment | Women with Births | Births / 1,000 Women |
| Less than High School | 17 (44.7%) | 177.0 |
| High School Diploma | 21 (55.3%) | 200.0 |
| College or Associate's Degree | 0 (0.0%) | 0.0 |
| Bachelor's Degree | 0 (0.0%) | 0.0 |
| Graduate Degree | 0 (0.0%) | 0.0 |
| Total | 38 (100.0%) | 141.0 |
Fertility by Education by Marriage Status in Monarch Mill
44.7% of women with births in Monarch Mill are unmarried. Women with the educational attainment of high school diploma are most likely to be married with 100.0% of them married at childbirth, while women with the educational attainment of less than high school are least likely to be married with 100.0% of them unmarried at childbirth.
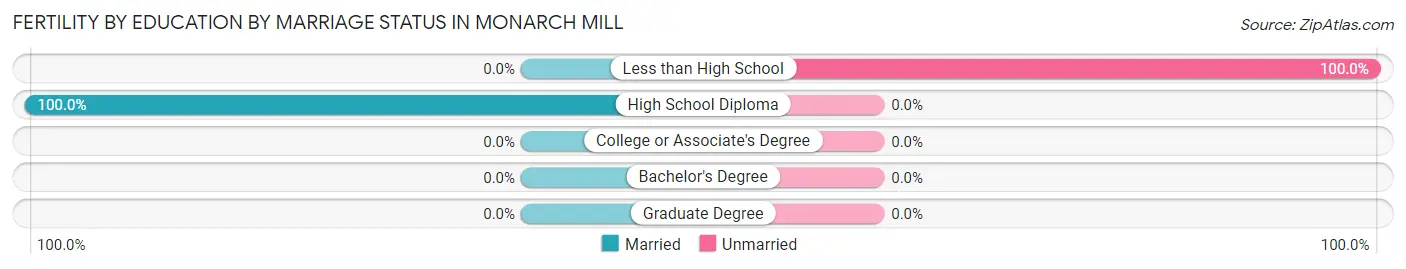
| Educational Attainment | Married | Unmarried |
| Less than High School | 0 (0.0%) | 17 (100.0%) |
| High School Diploma | 21 (100.0%) | 0 (0.0%) |
| College or Associate's Degree | 0 (0.0%) | 0 (0.0%) |
| Bachelor's Degree | 0 (0.0%) | 0 (0.0%) |
| Graduate Degree | 0 (0.0%) | 0 (0.0%) |
| Total | 21 (55.3%) | 17 (44.7%) |
Employment Characteristics in Monarch Mill
Employment by Class of Employer in Monarch Mill
Among the 630 employed individuals in Monarch Mill, private company employees (458 | 72.7%), federal government employees (46 | 7.3%), and self-employed (not incorporated) (43 | 6.8%) make up the most common classes of employment.
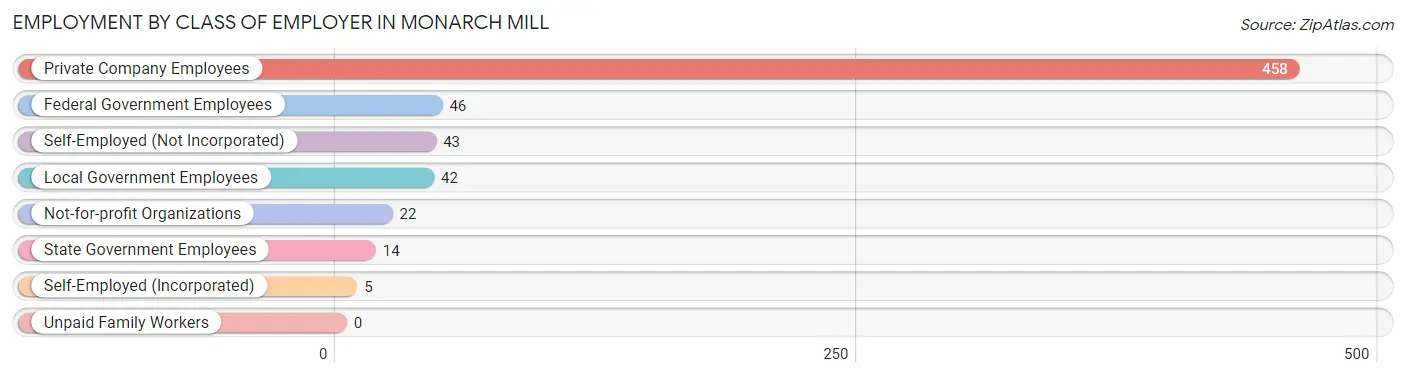
| Employer Class | # Employees | % Employees |
| Private Company Employees | 458 | 72.7% |
| Self-Employed (Incorporated) | 5 | 0.8% |
| Self-Employed (Not Incorporated) | 43 | 6.8% |
| Not-for-profit Organizations | 22 | 3.5% |
| Local Government Employees | 42 | 6.7% |
| State Government Employees | 14 | 2.2% |
| Federal Government Employees | 46 | 7.3% |
| Unpaid Family Workers | 0 | 0.0% |
| Total | 630 | 100.0% |
Employment Status by Age in Monarch Mill
According to the labor force statistics for Monarch Mill, out of the total population over 16 years of age (1,413), 48.3% or 682 individuals are in the labor force, with 7.2% or 49 of them unemployed. The age group with the highest labor force participation rate is 25 to 29 years, with 95.8% or 137 individuals in the labor force. Within the labor force, the 35 to 44 years age range has the highest percentage of unemployed individuals, with 28.7% or 25 of them being unemployed.
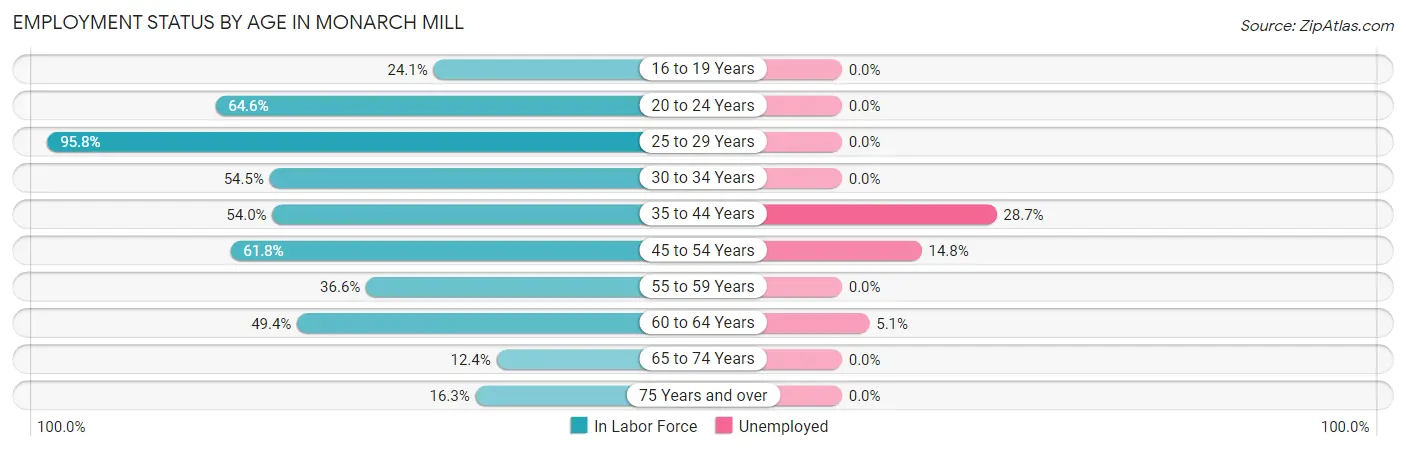
| Age Bracket | In Labor Force | Unemployed |
| 16 to 19 Years | 7 (24.1%) | 0 (0.0%) |
| 20 to 24 Years | 113 (64.6%) | 0 (0.0%) |
| 25 to 29 Years | 137 (95.8%) | 0 (0.0%) |
| 30 to 34 Years | 42 (54.5%) | 0 (0.0%) |
| 35 to 44 Years | 87 (54.0%) | 25 (28.7%) |
| 45 to 54 Years | 149 (61.8%) | 22 (14.8%) |
| 55 to 59 Years | 60 (36.6%) | 0 (0.0%) |
| 60 to 64 Years | 39 (49.4%) | 2 (5.1%) |
| 65 to 74 Years | 22 (12.4%) | 0 (0.0%) |
| 75 Years and over | 27 (16.3%) | 0 (0.0%) |
| Total | 682 (48.3%) | 49 (7.2%) |
Employment Status by Educational Attainment in Monarch Mill
According to labor force statistics for Monarch Mill, 59.4% of individuals (514) out of the total population between 25 and 64 years of age (865) are in the labor force, with 9.5% or 49 of them being unemployed. The group with the highest labor force participation rate are those with the educational attainment of college / associate degree, with 76.0% or 171 individuals in the labor force. Within the labor force, individuals with less than high school education have the highest percentage of unemployment, with 31.4% or 22 of them being unemployed.
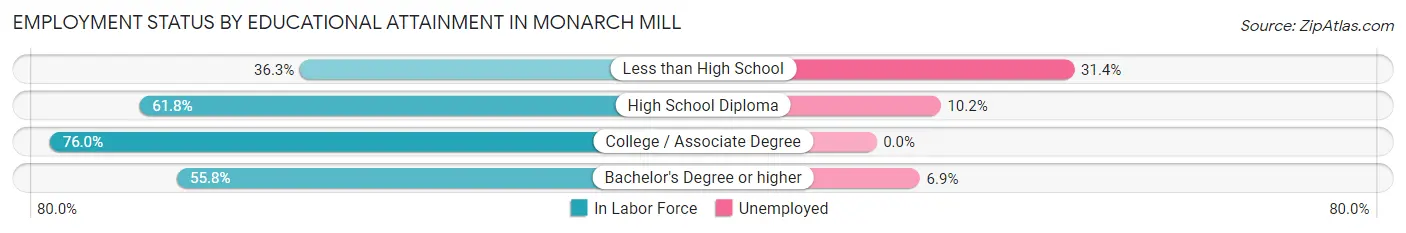
| Educational Attainment | In Labor Force | Unemployed |
| Less than High School | 70 (36.3%) | 61 (31.4%) |
| High School Diploma | 244 (61.8%) | 40 (10.2%) |
| College / Associate Degree | 171 (76.0%) | 0 (0.0%) |
| Bachelor's Degree or higher | 29 (55.8%) | 4 (6.9%) |
| Total | 514 (59.4%) | 82 (9.5%) |
Employment Occupations by Sex in Monarch Mill
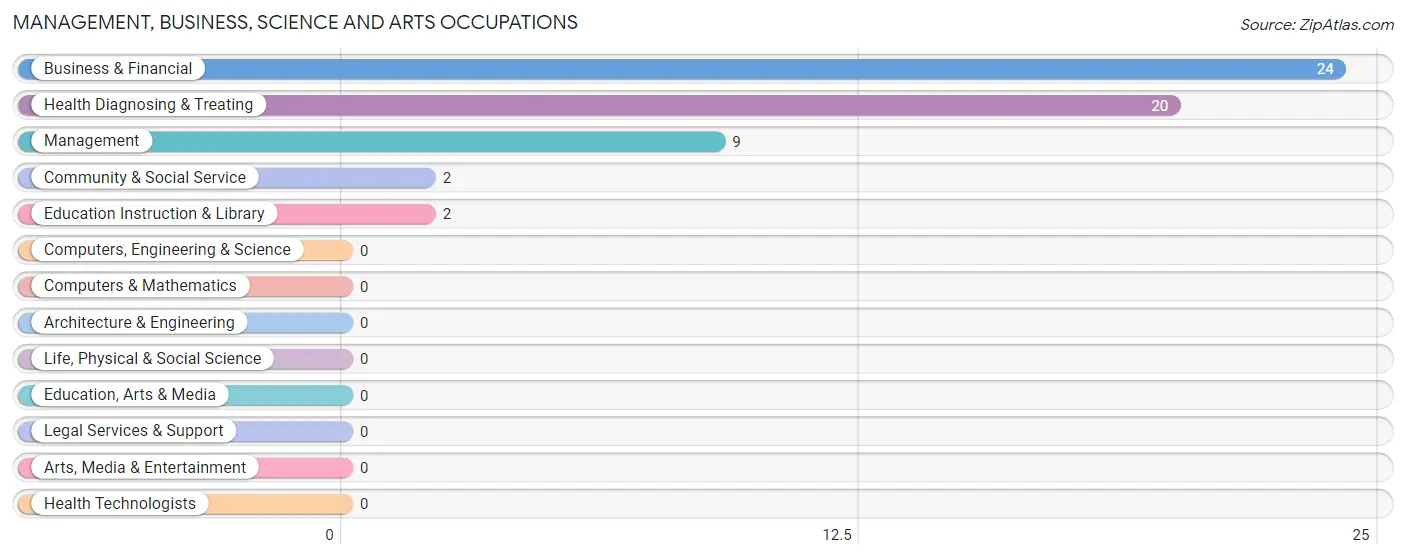
Management, Business, Science and Arts Occupations
The most common Management, Business, Science and Arts occupations in Monarch Mill are Business & Financial (24 | 3.8%), Health Diagnosing & Treating (20 | 3.2%), Management (9 | 1.4%), Community & Social Service (2 | 0.3%), and Education Instruction & Library (2 | 0.3%).
Management, Business, Science and Arts Occupations by Sex
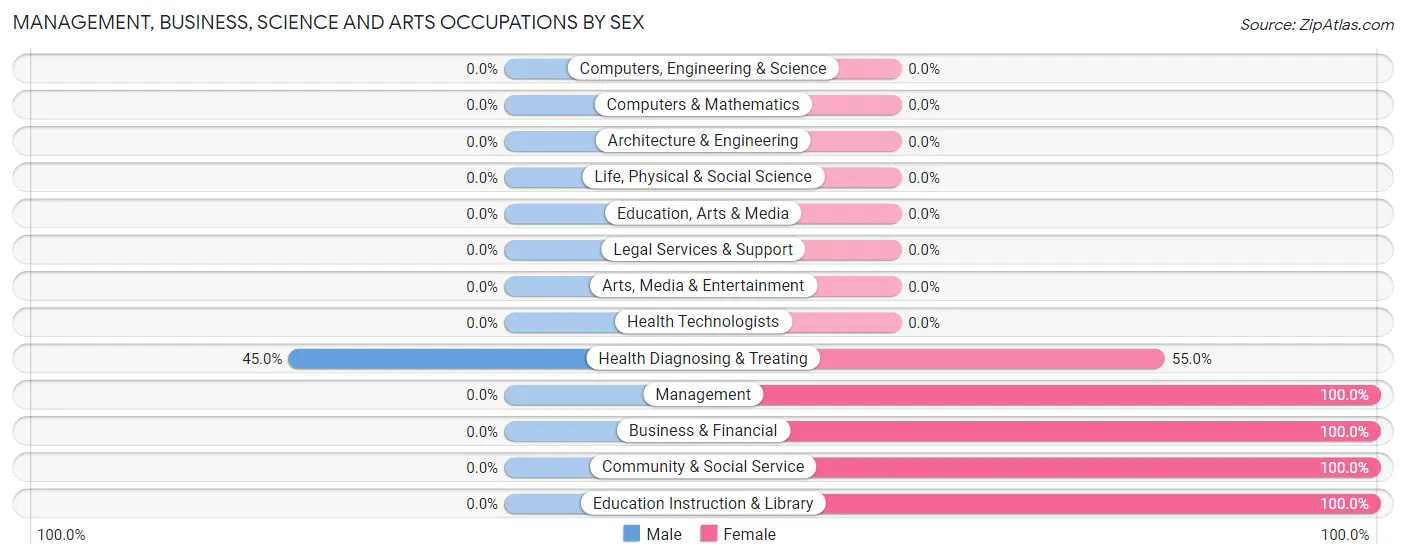
| Occupation | Male | Female |
| Management | 0 (0.0%) | 9 (100.0%) |
| Business & Financial | 0 (0.0%) | 24 (100.0%) |
| Computers, Engineering & Science | 0 (0.0%) | 0 (0.0%) |
| Computers & Mathematics | 0 (0.0%) | 0 (0.0%) |
| Architecture & Engineering | 0 (0.0%) | 0 (0.0%) |
| Life, Physical & Social Science | 0 (0.0%) | 0 (0.0%) |
| Community & Social Service | 0 (0.0%) | 2 (100.0%) |
| Education, Arts & Media | 0 (0.0%) | 0 (0.0%) |
| Legal Services & Support | 0 (0.0%) | 0 (0.0%) |
| Education Instruction & Library | 0 (0.0%) | 2 (100.0%) |
| Arts, Media & Entertainment | 0 (0.0%) | 0 (0.0%) |
| Health Diagnosing & Treating | 9 (45.0%) | 11 (55.0%) |
| Health Technologists | 0 (0.0%) | 0 (0.0%) |
| Total (Category) | 9 (16.4%) | 46 (83.6%) |
| Total (Overall) | 387 (61.0%) | 247 (39.0%) |
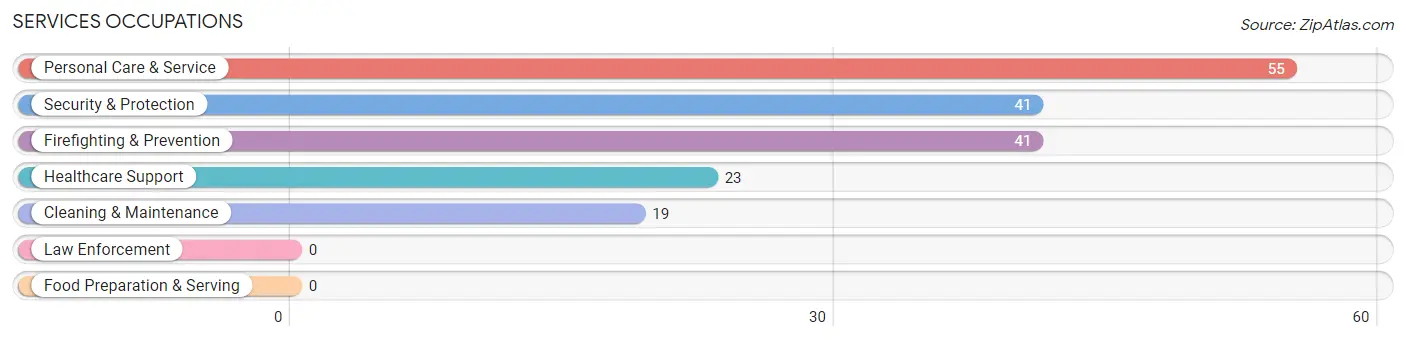
Services Occupations
The most common Services occupations in Monarch Mill are Personal Care & Service (55 | 8.7%), Security & Protection (41 | 6.5%), Firefighting & Prevention (41 | 6.5%), Healthcare Support (23 | 3.6%), and Cleaning & Maintenance (19 | 3.0%).
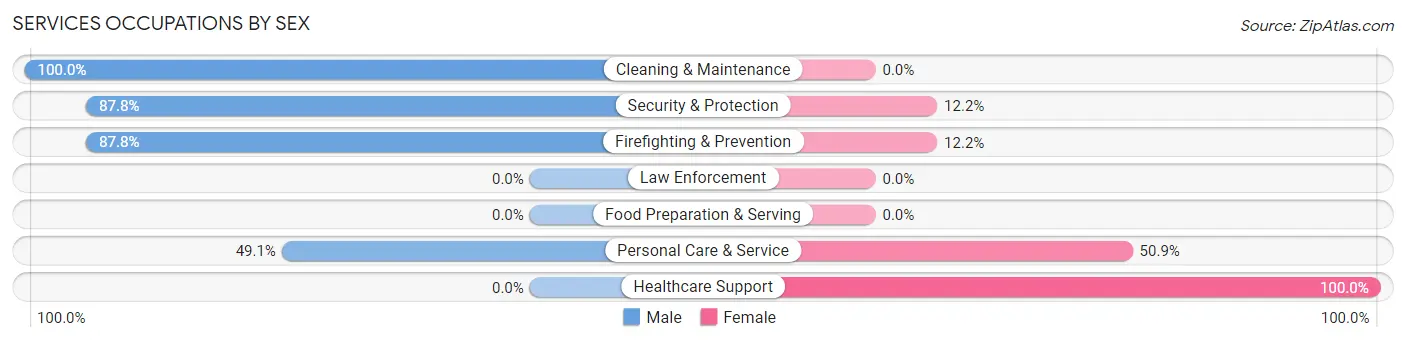
Services Occupations by Sex
Within the Services occupations in Monarch Mill, the most male-oriented occupations are Cleaning & Maintenance (100.0%), Security & Protection (87.8%), and Firefighting & Prevention (87.8%), while the most female-oriented occupations are Healthcare Support (100.0%), Personal Care & Service (50.9%), and Security & Protection (12.2%).
| Occupation | Male | Female |
| Healthcare Support | 0 (0.0%) | 23 (100.0%) |
| Security & Protection | 36 (87.8%) | 5 (12.2%) |
| Firefighting & Prevention | 36 (87.8%) | 5 (12.2%) |
| Law Enforcement | 0 (0.0%) | 0 (0.0%) |
| Food Preparation & Serving | 0 (0.0%) | 0 (0.0%) |
| Cleaning & Maintenance | 19 (100.0%) | 0 (0.0%) |
| Personal Care & Service | 27 (49.1%) | 28 (50.9%) |
| Total (Category) | 82 (59.4%) | 56 (40.6%) |
| Total (Overall) | 387 (61.0%) | 247 (39.0%) |
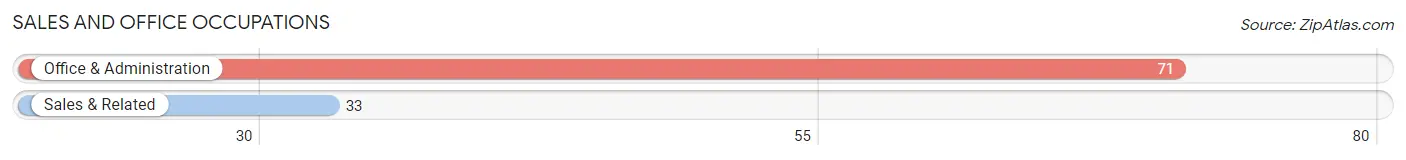
Sales and Office Occupations
The most common Sales and Office occupations in Monarch Mill are Office & Administration (71 | 11.2%), and Sales & Related (33 | 5.2%).
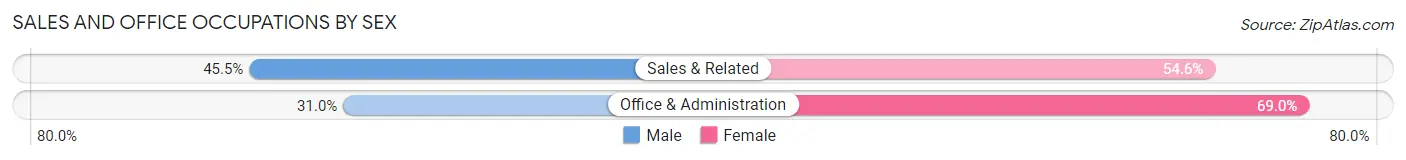
Sales and Office Occupations by Sex
| Occupation | Male | Female |
| Sales & Related | 15 (45.5%) | 18 (54.5%) |
| Office & Administration | 22 (31.0%) | 49 (69.0%) |
| Total (Category) | 37 (35.6%) | 67 (64.4%) |
| Total (Overall) | 387 (61.0%) | 247 (39.0%) |
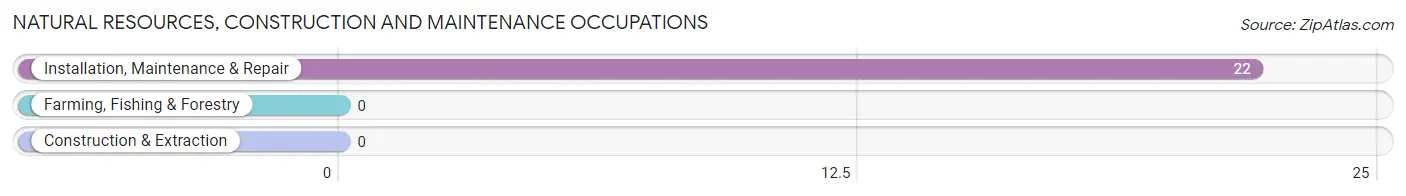
Natural Resources, Construction and Maintenance Occupations
The most common Natural Resources, Construction and Maintenance occupations in Monarch Mill are , and Installation, Maintenance & Repair (22 | 3.5%).
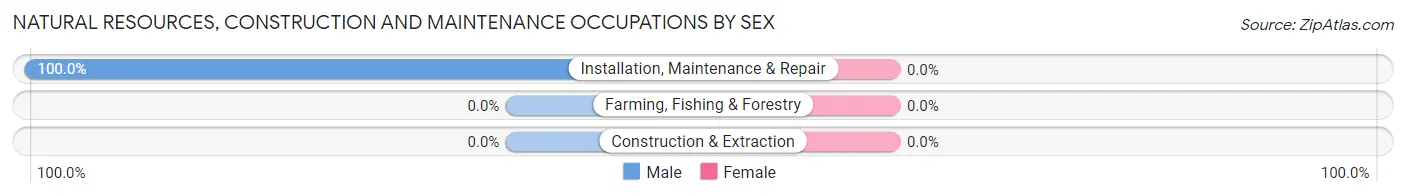
Natural Resources, Construction and Maintenance Occupations by Sex
| Occupation | Male | Female |
| Farming, Fishing & Forestry | 0 (0.0%) | 0 (0.0%) |
| Construction & Extraction | 0 (0.0%) | 0 (0.0%) |
| Installation, Maintenance & Repair | 22 (100.0%) | 0 (0.0%) |
| Total (Category) | 22 (100.0%) | 0 (0.0%) |
| Total (Overall) | 387 (61.0%) | 247 (39.0%) |
Production, Transportation and Moving Occupations
The most common Production, Transportation and Moving occupations in Monarch Mill are Production (210 | 33.1%), Transportation (65 | 10.2%), and Material Moving (40 | 6.3%).
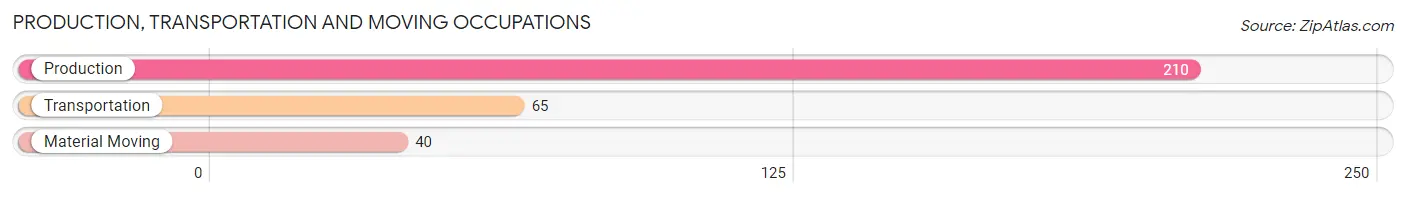
Production, Transportation and Moving Occupations by Sex
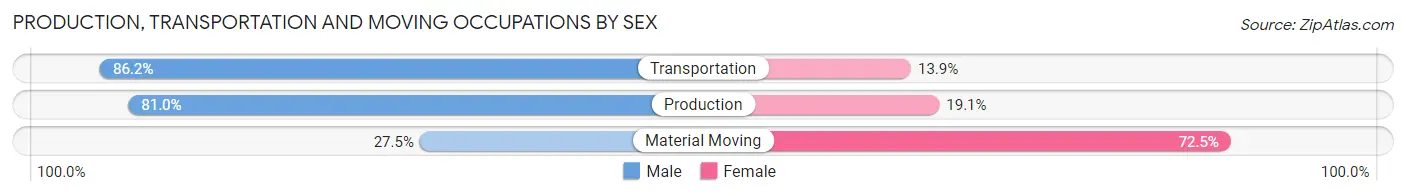
| Occupation | Male | Female |
| Production | 170 (80.9%) | 40 (19.1%) |
| Transportation | 56 (86.2%) | 9 (13.9%) |
| Material Moving | 11 (27.5%) | 29 (72.5%) |
| Total (Category) | 237 (75.2%) | 78 (24.8%) |
| Total (Overall) | 387 (61.0%) | 247 (39.0%) |
Employment Industries by Sex in Monarch Mill
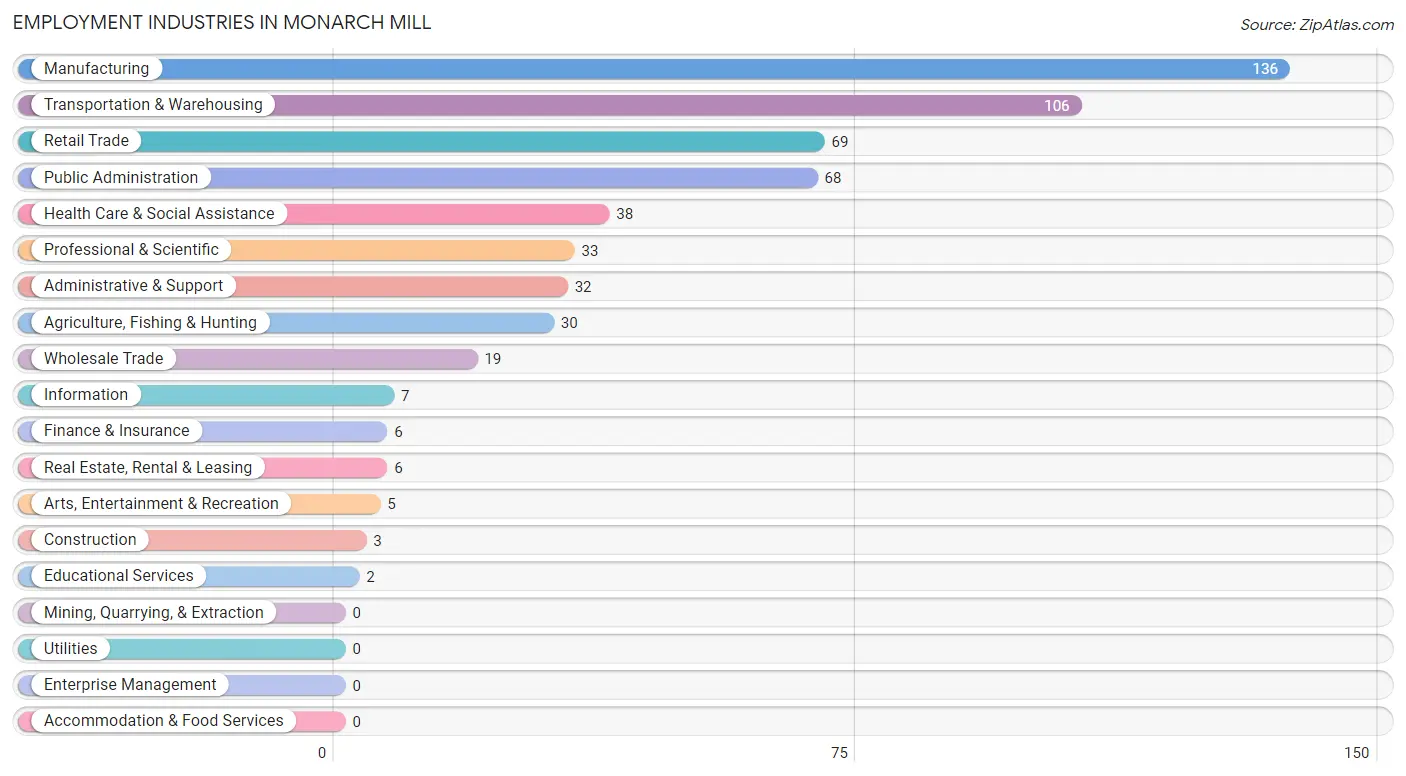
Employment Industries in Monarch Mill
The major employment industries in Monarch Mill include Manufacturing (136 | 21.4%), Transportation & Warehousing (106 | 16.7%), Retail Trade (69 | 10.9%), Public Administration (68 | 10.7%), and Health Care & Social Assistance (38 | 6.0%).
Employment Industries by Sex in Monarch Mill
The Monarch Mill industries that see more men than women are Agriculture, Fishing & Hunting (100.0%), Construction (100.0%), and Wholesale Trade (100.0%), whereas the industries that tend to have a higher number of women are Information (100.0%), Finance & Insurance (100.0%), and Educational Services (100.0%).
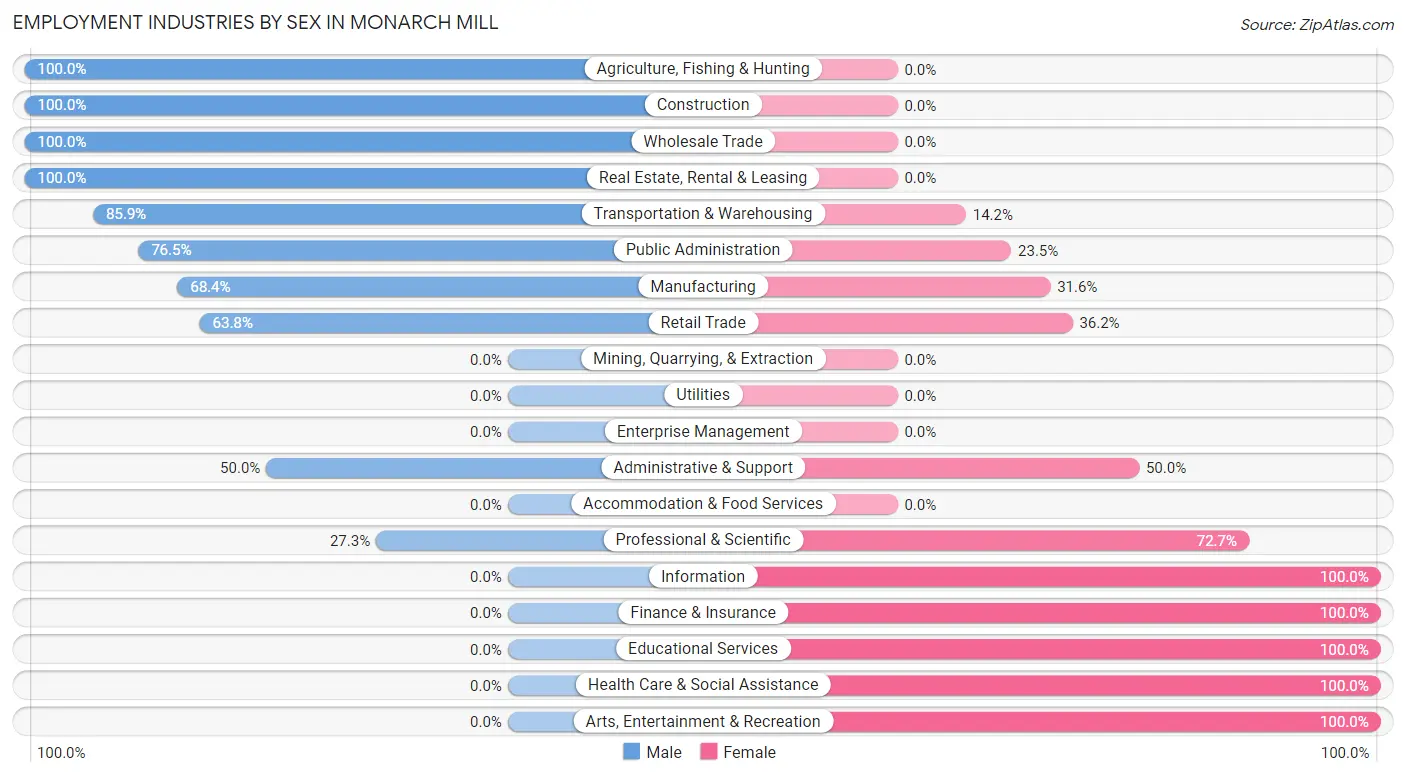
| Industry | Male | Female |
| Agriculture, Fishing & Hunting | 30 (100.0%) | 0 (0.0%) |
| Mining, Quarrying, & Extraction | 0 (0.0%) | 0 (0.0%) |
| Construction | 3 (100.0%) | 0 (0.0%) |
| Manufacturing | 93 (68.4%) | 43 (31.6%) |
| Wholesale Trade | 19 (100.0%) | 0 (0.0%) |
| Retail Trade | 44 (63.8%) | 25 (36.2%) |
| Transportation & Warehousing | 91 (85.9%) | 15 (14.1%) |
| Utilities | 0 (0.0%) | 0 (0.0%) |
| Information | 0 (0.0%) | 7 (100.0%) |
| Finance & Insurance | 0 (0.0%) | 6 (100.0%) |
| Real Estate, Rental & Leasing | 6 (100.0%) | 0 (0.0%) |
| Professional & Scientific | 9 (27.3%) | 24 (72.7%) |
| Enterprise Management | 0 (0.0%) | 0 (0.0%) |
| Administrative & Support | 16 (50.0%) | 16 (50.0%) |
| Educational Services | 0 (0.0%) | 2 (100.0%) |
| Health Care & Social Assistance | 0 (0.0%) | 38 (100.0%) |
| Arts, Entertainment & Recreation | 0 (0.0%) | 5 (100.0%) |
| Accommodation & Food Services | 0 (0.0%) | 0 (0.0%) |
| Public Administration | 52 (76.5%) | 16 (23.5%) |
| Total | 387 (61.0%) | 247 (39.0%) |
Education in Monarch Mill
School Enrollment in Monarch Mill
The most common levels of schooling among the 232 students in Monarch Mill are middle school (116 | 50.0%), elementary school (47 | 20.3%), and high school (33 | 14.2%).
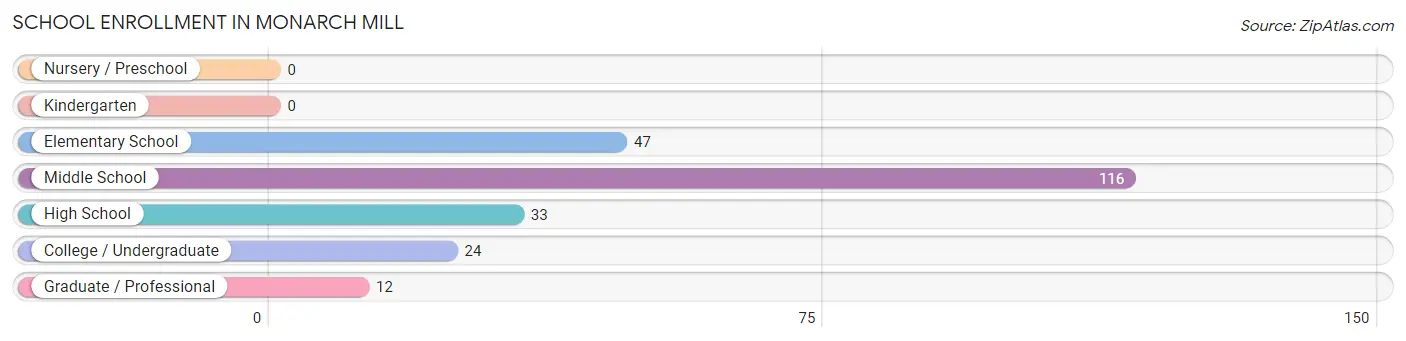
| School Level | # Students | % Students |
| Nursery / Preschool | 0 | 0.0% |
| Kindergarten | 0 | 0.0% |
| Elementary School | 47 | 20.3% |
| Middle School | 116 | 50.0% |
| High School | 33 | 14.2% |
| College / Undergraduate | 24 | 10.3% |
| Graduate / Professional | 12 | 5.2% |
| Total | 232 | 100.0% |
School Enrollment by Age by Funding Source in Monarch Mill
Out of a total of 232 students who are enrolled in schools in Monarch Mill, 61 (26.3%) attend a private institution, while the remaining 171 (73.7%) are enrolled in public schools. The age group of 35 years and over has the highest likelihood of being enrolled in private schools, with 29 (100.0% in the age bracket) enrolled. Conversely, the age group of 15 to 17 year olds has the lowest likelihood of being enrolled in a private school, with 42 (100.0% in the age bracket) attending a public institution.
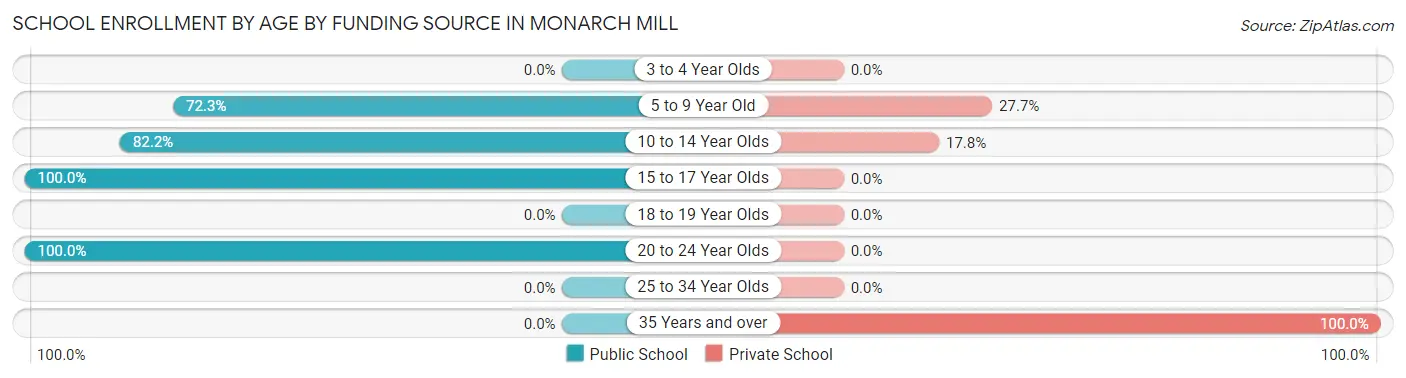
| Age Bracket | Public School | Private School |
| 3 to 4 Year Olds | 0 (0.0%) | 0 (0.0%) |
| 5 to 9 Year Old | 34 (72.3%) | 13 (27.7%) |
| 10 to 14 Year Olds | 88 (82.2%) | 19 (17.8%) |
| 15 to 17 Year Olds | 42 (100.0%) | 0 (0.0%) |
| 18 to 19 Year Olds | 0 (0.0%) | 0 (0.0%) |
| 20 to 24 Year Olds | 7 (100.0%) | 0 (0.0%) |
| 25 to 34 Year Olds | 0 (0.0%) | 0 (0.0%) |
| 35 Years and over | 0 (0.0%) | 29 (100.0%) |
| Total | 171 (73.7%) | 61 (26.3%) |
Educational Attainment by Field of Study in Monarch Mill
Arts & humanities (27 | 36.5%), education (21 | 28.4%), social sciences (12 | 16.2%), liberal arts & history (12 | 16.2%), and bio, nature & agricultural (2 | 2.7%) are the most common fields of study among 74 individuals in Monarch Mill who have obtained a bachelor's degree or higher.
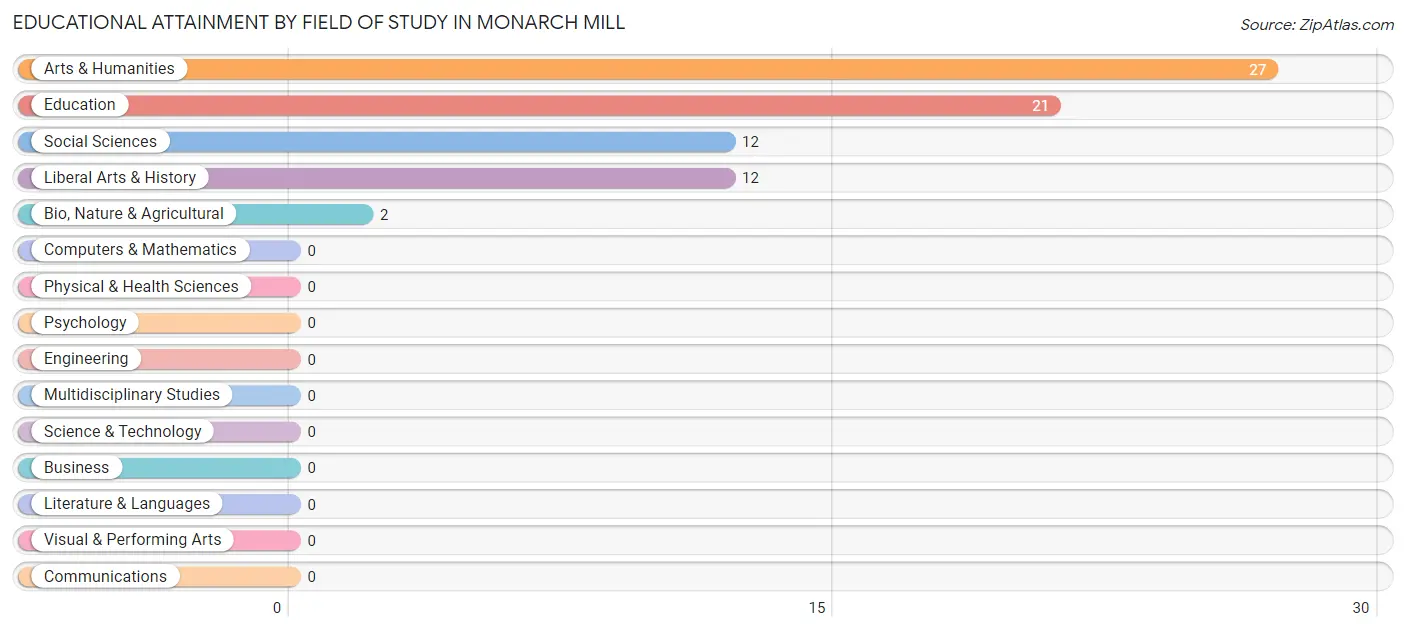
| Field of Study | # Graduates | % Graduates |
| Computers & Mathematics | 0 | 0.0% |
| Bio, Nature & Agricultural | 2 | 2.7% |
| Physical & Health Sciences | 0 | 0.0% |
| Psychology | 0 | 0.0% |
| Social Sciences | 12 | 16.2% |
| Engineering | 0 | 0.0% |
| Multidisciplinary Studies | 0 | 0.0% |
| Science & Technology | 0 | 0.0% |
| Business | 0 | 0.0% |
| Education | 21 | 28.4% |
| Literature & Languages | 0 | 0.0% |
| Liberal Arts & History | 12 | 16.2% |
| Visual & Performing Arts | 0 | 0.0% |
| Communications | 0 | 0.0% |
| Arts & Humanities | 27 | 36.5% |
| Total | 74 | 100.0% |
Transportation & Commute in Monarch Mill
Vehicle Availability by Sex in Monarch Mill
The most prevalent vehicle ownership categories in Monarch Mill are males with 2 vehicles (175, accounting for 45.2%) and females with 2 vehicles (56, making up 72.0%).
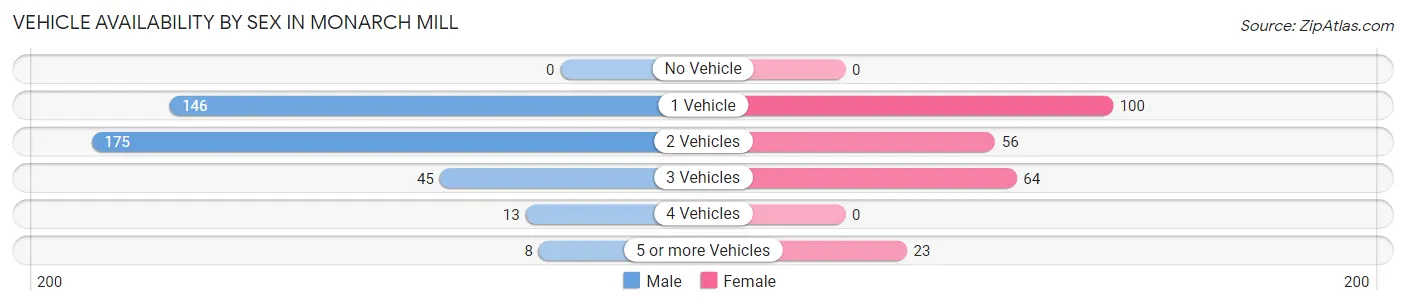
| Vehicles Available | Male | Female |
| No Vehicle | 0 (0.0%) | 0 (0.0%) |
| 1 Vehicle | 146 (37.7%) | 100 (41.1%) |
| 2 Vehicles | 175 (45.2%) | 56 (23.1%) |
| 3 Vehicles | 45 (11.6%) | 64 (26.3%) |
| 4 Vehicles | 13 (3.4%) | 0 (0.0%) |
| 5 or more Vehicles | 8 (2.1%) | 23 (9.5%) |
| Total | 387 (100.0%) | 243 (100.0%) |
Commute Time in Monarch Mill
The most frequently occuring commute durations in Monarch Mill are 20 to 24 minutes (141 commuters, 22.9%), 10 to 14 minutes (104 commuters, 16.9%), and 15 to 19 minutes (100 commuters, 16.3%).
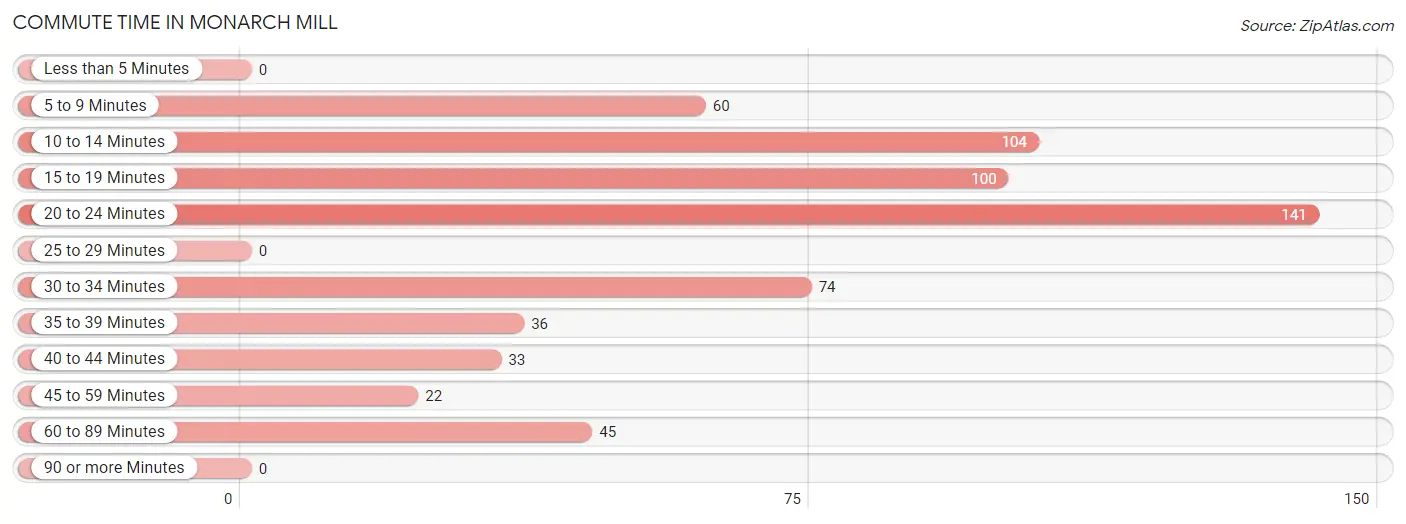
| Commute Time | # Commuters | % Commuters |
| Less than 5 Minutes | 0 | 0.0% |
| 5 to 9 Minutes | 60 | 9.8% |
| 10 to 14 Minutes | 104 | 16.9% |
| 15 to 19 Minutes | 100 | 16.3% |
| 20 to 24 Minutes | 141 | 22.9% |
| 25 to 29 Minutes | 0 | 0.0% |
| 30 to 34 Minutes | 74 | 12.0% |
| 35 to 39 Minutes | 36 | 5.9% |
| 40 to 44 Minutes | 33 | 5.4% |
| 45 to 59 Minutes | 22 | 3.6% |
| 60 to 89 Minutes | 45 | 7.3% |
| 90 or more Minutes | 0 | 0.0% |
Commute Time by Sex in Monarch Mill
The most common commute times in Monarch Mill are 20 to 24 minutes (134 commuters, 36.0%) for males and 10 to 14 minutes (61 commuters, 25.1%) for females.
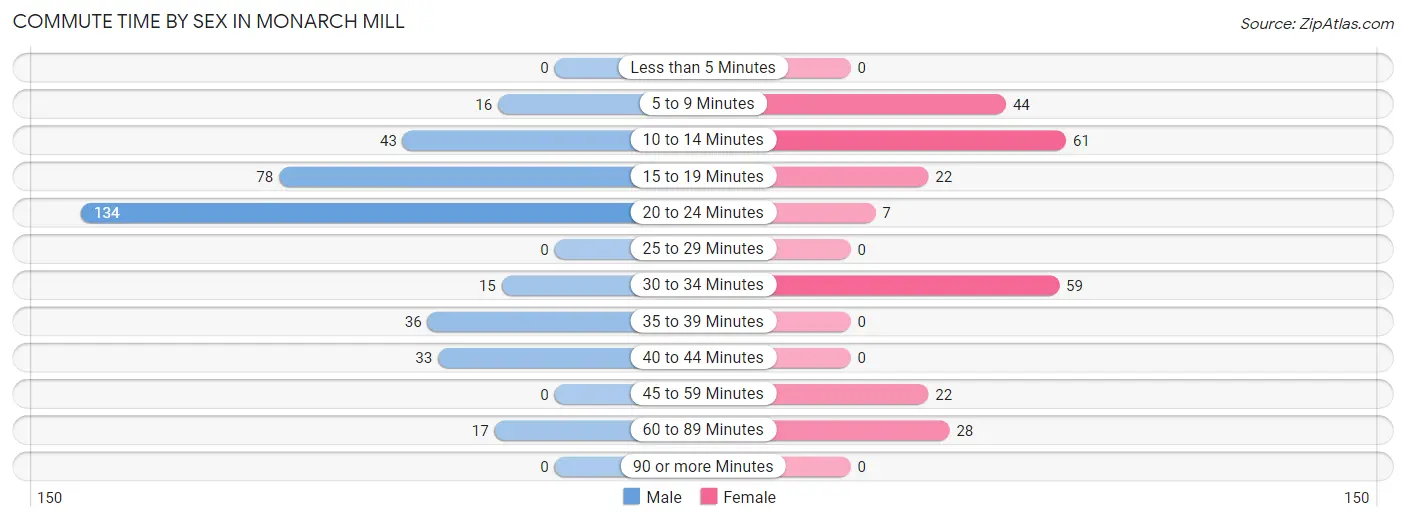
| Commute Time | Male | Female |
| Less than 5 Minutes | 0 (0.0%) | 0 (0.0%) |
| 5 to 9 Minutes | 16 (4.3%) | 44 (18.1%) |
| 10 to 14 Minutes | 43 (11.6%) | 61 (25.1%) |
| 15 to 19 Minutes | 78 (21.0%) | 22 (9.0%) |
| 20 to 24 Minutes | 134 (36.0%) | 7 (2.9%) |
| 25 to 29 Minutes | 0 (0.0%) | 0 (0.0%) |
| 30 to 34 Minutes | 15 (4.0%) | 59 (24.3%) |
| 35 to 39 Minutes | 36 (9.7%) | 0 (0.0%) |
| 40 to 44 Minutes | 33 (8.9%) | 0 (0.0%) |
| 45 to 59 Minutes | 0 (0.0%) | 22 (9.0%) |
| 60 to 89 Minutes | 17 (4.6%) | 28 (11.5%) |
| 90 or more Minutes | 0 (0.0%) | 0 (0.0%) |
Time of Departure to Work by Sex in Monarch Mill
The most frequent times of departure to work in Monarch Mill are 4:00 PM to 11:59 PM (175, 47.0%) for males and 7:30 AM to 7:59 AM (60, 24.7%) for females.
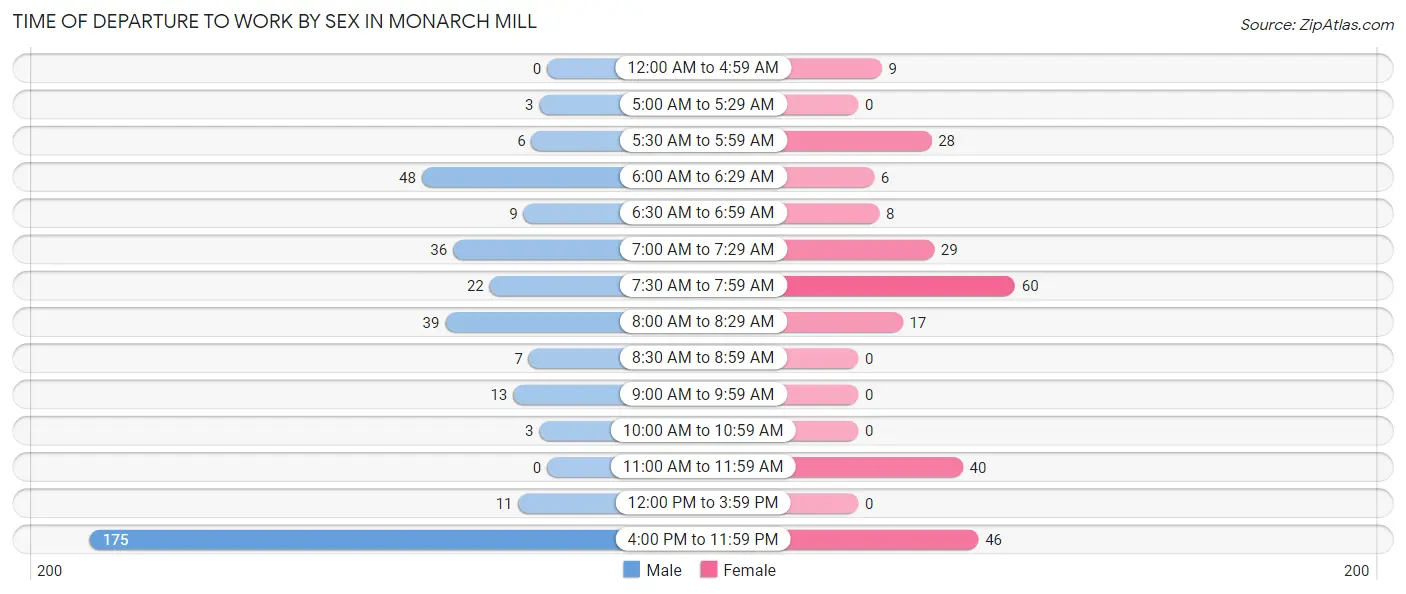
| Time of Departure | Male | Female |
| 12:00 AM to 4:59 AM | 0 (0.0%) | 9 (3.7%) |
| 5:00 AM to 5:29 AM | 3 (0.8%) | 0 (0.0%) |
| 5:30 AM to 5:59 AM | 6 (1.6%) | 28 (11.5%) |
| 6:00 AM to 6:29 AM | 48 (12.9%) | 6 (2.5%) |
| 6:30 AM to 6:59 AM | 9 (2.4%) | 8 (3.3%) |
| 7:00 AM to 7:29 AM | 36 (9.7%) | 29 (11.9%) |
| 7:30 AM to 7:59 AM | 22 (5.9%) | 60 (24.7%) |
| 8:00 AM to 8:29 AM | 39 (10.5%) | 17 (7.0%) |
| 8:30 AM to 8:59 AM | 7 (1.9%) | 0 (0.0%) |
| 9:00 AM to 9:59 AM | 13 (3.5%) | 0 (0.0%) |
| 10:00 AM to 10:59 AM | 3 (0.8%) | 0 (0.0%) |
| 11:00 AM to 11:59 AM | 0 (0.0%) | 40 (16.5%) |
| 12:00 PM to 3:59 PM | 11 (3.0%) | 0 (0.0%) |
| 4:00 PM to 11:59 PM | 175 (47.0%) | 46 (18.9%) |
| Total | 372 (100.0%) | 243 (100.0%) |
Housing Occupancy in Monarch Mill
Occupancy by Ownership in Monarch Mill
Of the total 796 dwellings in Monarch Mill, owner-occupied units account for 548 (68.8%), while renter-occupied units make up 248 (31.2%).
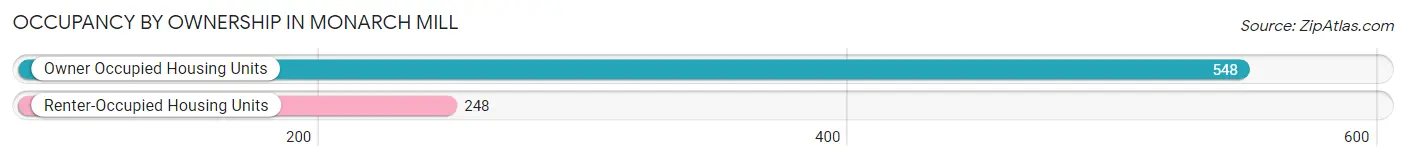
| Occupancy | # Housing Units | % Housing Units |
| Owner Occupied Housing Units | 548 | 68.8% |
| Renter-Occupied Housing Units | 248 | 31.2% |
| Total Occupied Housing Units | 796 | 100.0% |
Occupancy by Household Size in Monarch Mill
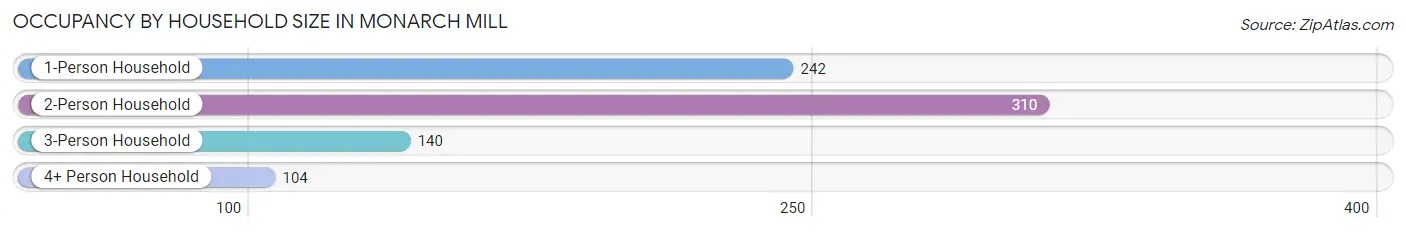
| Household Size | # Housing Units | % Housing Units |
| 1-Person Household | 242 | 30.4% |
| 2-Person Household | 310 | 38.9% |
| 3-Person Household | 140 | 17.6% |
| 4+ Person Household | 104 | 13.1% |
| Total Housing Units | 796 | 100.0% |
Occupancy by Ownership by Household Size in Monarch Mill
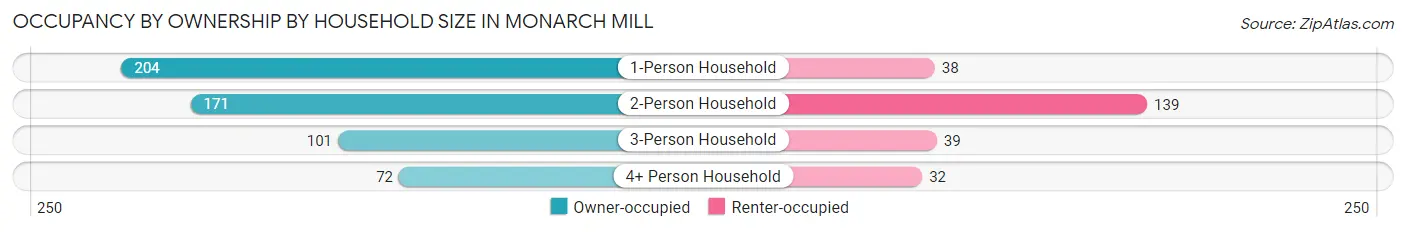
| Household Size | Owner-occupied | Renter-occupied |
| 1-Person Household | 204 (84.3%) | 38 (15.7%) |
| 2-Person Household | 171 (55.2%) | 139 (44.8%) |
| 3-Person Household | 101 (72.1%) | 39 (27.9%) |
| 4+ Person Household | 72 (69.2%) | 32 (30.8%) |
| Total Housing Units | 548 (68.8%) | 248 (31.2%) |
Occupancy by Educational Attainment in Monarch Mill
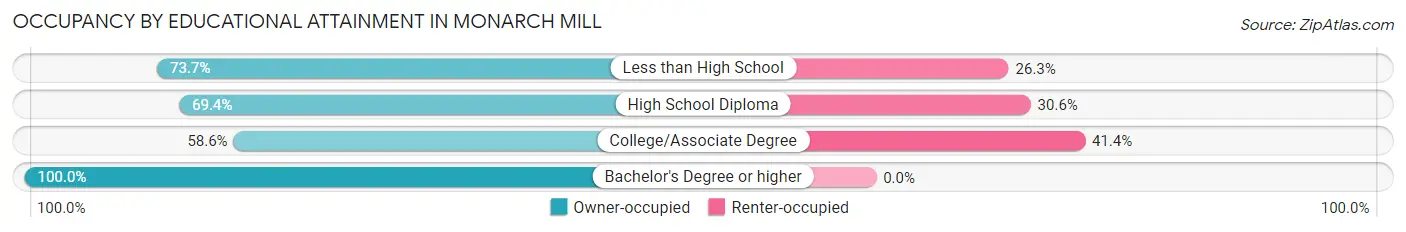
| Household Size | Owner-occupied | Renter-occupied |
| Less than High School | 146 (73.7%) | 52 (26.3%) |
| High School Diploma | 231 (69.4%) | 102 (30.6%) |
| College/Associate Degree | 133 (58.6%) | 94 (41.4%) |
| Bachelor's Degree or higher | 38 (100.0%) | 0 (0.0%) |
Occupancy by Age of Householder in Monarch Mill
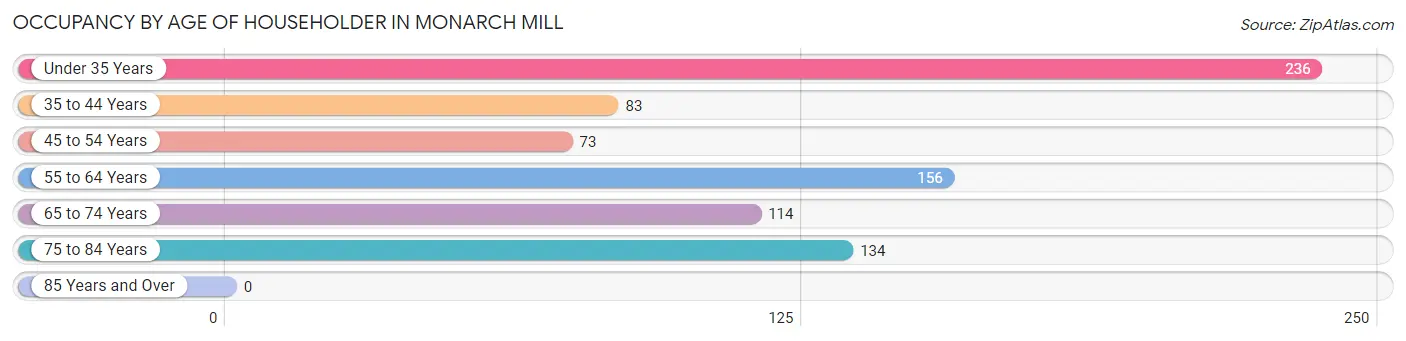
| Age Bracket | # Households | % Households |
| Under 35 Years | 236 | 29.6% |
| 35 to 44 Years | 83 | 10.4% |
| 45 to 54 Years | 73 | 9.2% |
| 55 to 64 Years | 156 | 19.6% |
| 65 to 74 Years | 114 | 14.3% |
| 75 to 84 Years | 134 | 16.8% |
| 85 Years and Over | 0 | 0.0% |
| Total | 796 | 100.0% |
Housing Finances in Monarch Mill
Median Income by Occupancy in Monarch Mill
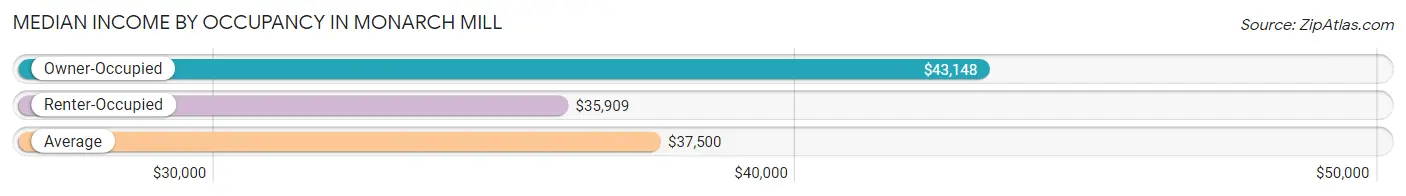
| Occupancy Type | # Households | Median Income |
| Owner-Occupied | 548 (68.8%) | $43,148 |
| Renter-Occupied | 248 (31.2%) | $35,909 |
| Average | 796 (100.0%) | $37,500 |
Occupancy by Householder Income Bracket in Monarch Mill
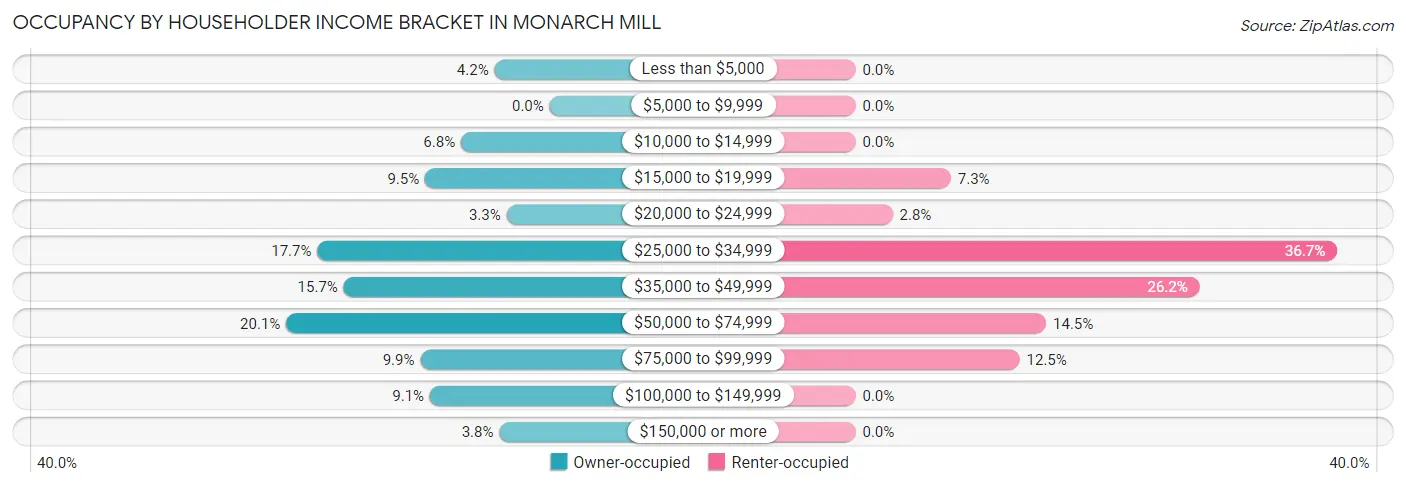
| Income Bracket | Owner-occupied | Renter-occupied |
| Less than $5,000 | 23 (4.2%) | 0 (0.0%) |
| $5,000 to $9,999 | 0 (0.0%) | 0 (0.0%) |
| $10,000 to $14,999 | 37 (6.8%) | 0 (0.0%) |
| $15,000 to $19,999 | 52 (9.5%) | 18 (7.3%) |
| $20,000 to $24,999 | 18 (3.3%) | 7 (2.8%) |
| $25,000 to $34,999 | 97 (17.7%) | 91 (36.7%) |
| $35,000 to $49,999 | 86 (15.7%) | 65 (26.2%) |
| $50,000 to $74,999 | 110 (20.1%) | 36 (14.5%) |
| $75,000 to $99,999 | 54 (9.9%) | 31 (12.5%) |
| $100,000 to $149,999 | 50 (9.1%) | 0 (0.0%) |
| $150,000 or more | 21 (3.8%) | 0 (0.0%) |
| Total | 548 (100.0%) | 248 (100.0%) |
Monthly Housing Cost Tiers in Monarch Mill
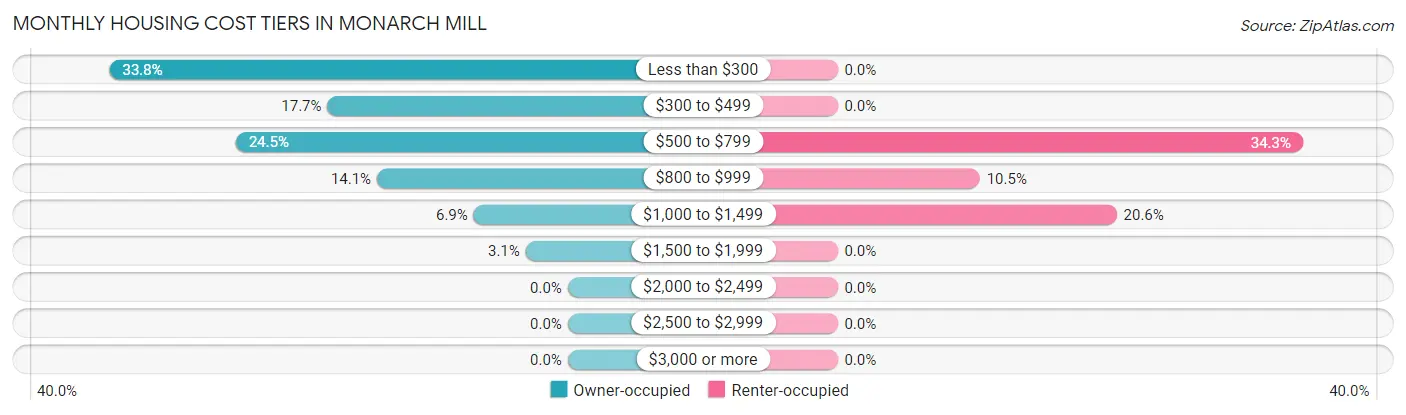
| Monthly Cost | Owner-occupied | Renter-occupied |
| Less than $300 | 185 (33.8%) | 0 (0.0%) |
| $300 to $499 | 97 (17.7%) | 0 (0.0%) |
| $500 to $799 | 134 (24.4%) | 85 (34.3%) |
| $800 to $999 | 77 (14.1%) | 26 (10.5%) |
| $1,000 to $1,499 | 38 (6.9%) | 51 (20.6%) |
| $1,500 to $1,999 | 17 (3.1%) | 0 (0.0%) |
| $2,000 to $2,499 | 0 (0.0%) | 0 (0.0%) |
| $2,500 to $2,999 | 0 (0.0%) | 0 (0.0%) |
| $3,000 or more | 0 (0.0%) | 0 (0.0%) |
| Total | 548 (100.0%) | 248 (100.0%) |
Physical Housing Characteristics in Monarch Mill
Housing Structures in Monarch Mill
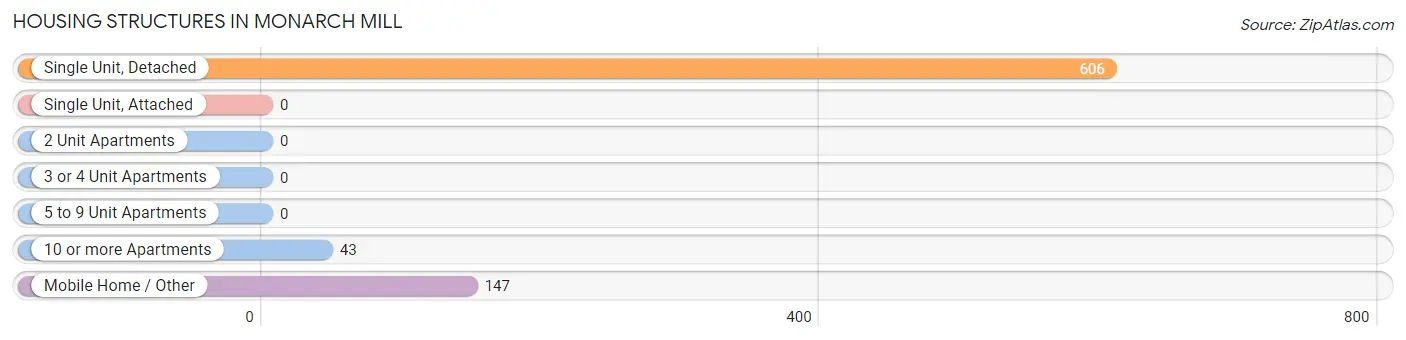
| Structure Type | # Housing Units | % Housing Units |
| Single Unit, Detached | 606 | 76.1% |
| Single Unit, Attached | 0 | 0.0% |
| 2 Unit Apartments | 0 | 0.0% |
| 3 or 4 Unit Apartments | 0 | 0.0% |
| 5 to 9 Unit Apartments | 0 | 0.0% |
| 10 or more Apartments | 43 | 5.4% |
| Mobile Home / Other | 147 | 18.5% |
| Total | 796 | 100.0% |
Housing Structures by Occupancy in Monarch Mill
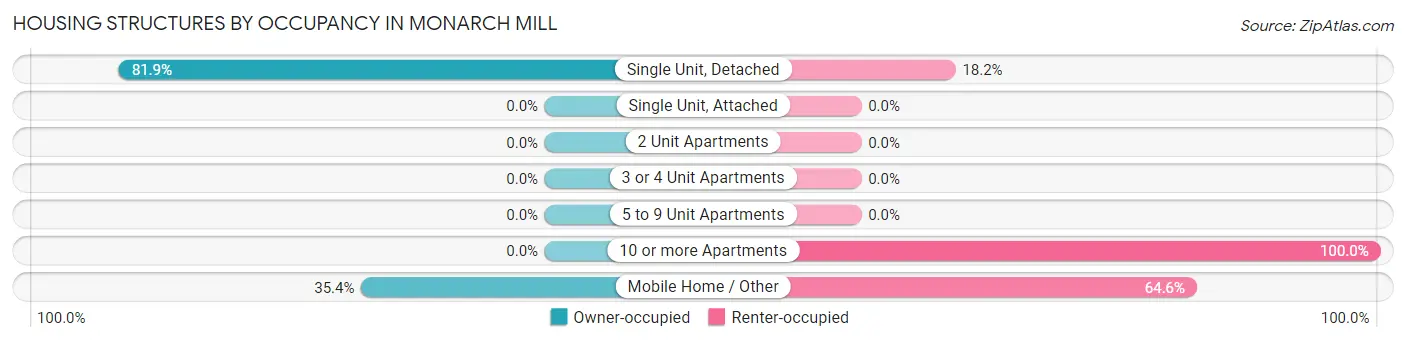
| Structure Type | Owner-occupied | Renter-occupied |
| Single Unit, Detached | 496 (81.9%) | 110 (18.1%) |
| Single Unit, Attached | 0 (0.0%) | 0 (0.0%) |
| 2 Unit Apartments | 0 (0.0%) | 0 (0.0%) |
| 3 or 4 Unit Apartments | 0 (0.0%) | 0 (0.0%) |
| 5 to 9 Unit Apartments | 0 (0.0%) | 0 (0.0%) |
| 10 or more Apartments | 0 (0.0%) | 43 (100.0%) |
| Mobile Home / Other | 52 (35.4%) | 95 (64.6%) |
| Total | 548 (68.8%) | 248 (31.2%) |
Housing Structures by Number of Rooms in Monarch Mill
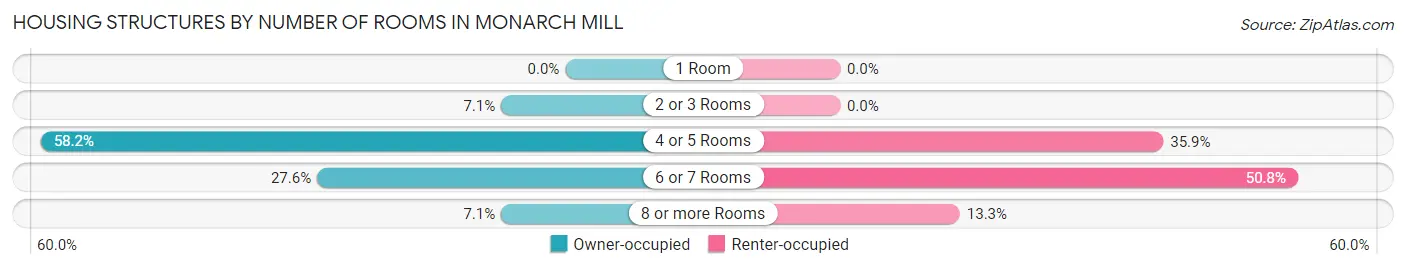
| Number of Rooms | Owner-occupied | Renter-occupied |
| 1 Room | 0 (0.0%) | 0 (0.0%) |
| 2 or 3 Rooms | 39 (7.1%) | 0 (0.0%) |
| 4 or 5 Rooms | 319 (58.2%) | 89 (35.9%) |
| 6 or 7 Rooms | 151 (27.6%) | 126 (50.8%) |
| 8 or more Rooms | 39 (7.1%) | 33 (13.3%) |
| Total | 548 (100.0%) | 248 (100.0%) |
Housing Structure by Heating Type in Monarch Mill
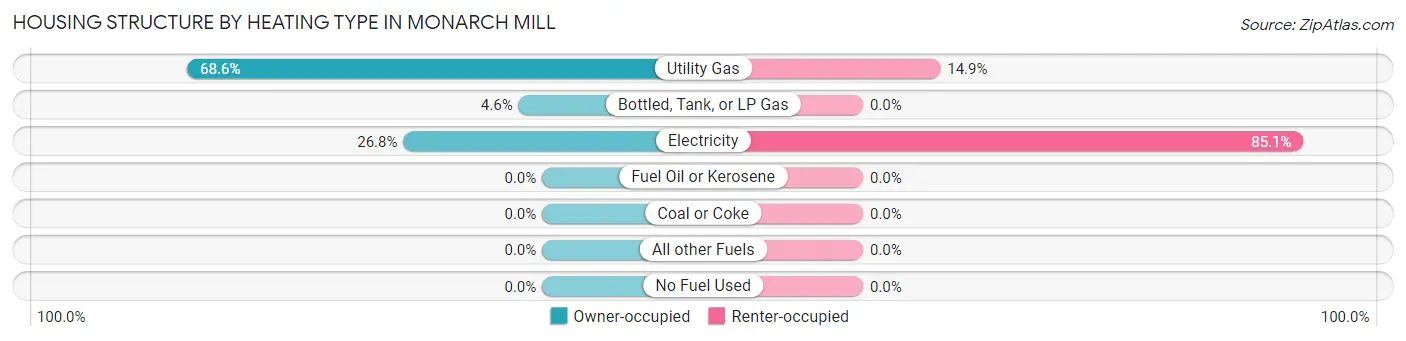
| Heating Type | Owner-occupied | Renter-occupied |
| Utility Gas | 376 (68.6%) | 37 (14.9%) |
| Bottled, Tank, or LP Gas | 25 (4.6%) | 0 (0.0%) |
| Electricity | 147 (26.8%) | 211 (85.1%) |
| Fuel Oil or Kerosene | 0 (0.0%) | 0 (0.0%) |
| Coal or Coke | 0 (0.0%) | 0 (0.0%) |
| All other Fuels | 0 (0.0%) | 0 (0.0%) |
| No Fuel Used | 0 (0.0%) | 0 (0.0%) |
| Total | 548 (100.0%) | 248 (100.0%) |
Household Vehicle Usage in Monarch Mill
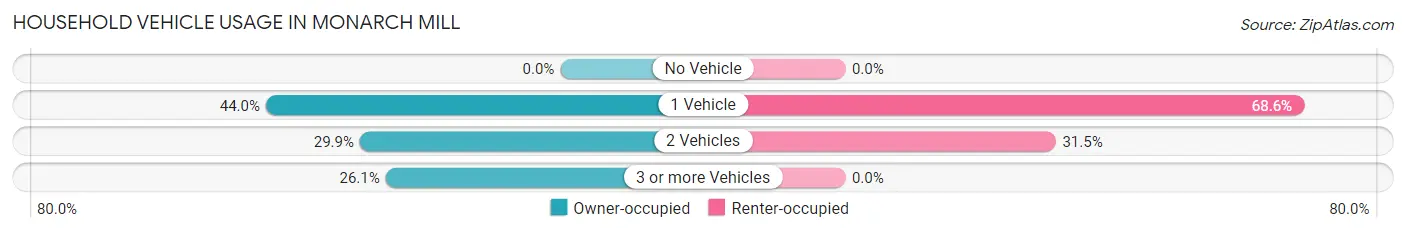
| Vehicles per Household | Owner-occupied | Renter-occupied |
| No Vehicle | 0 (0.0%) | 0 (0.0%) |
| 1 Vehicle | 241 (44.0%) | 170 (68.5%) |
| 2 Vehicles | 164 (29.9%) | 78 (31.5%) |
| 3 or more Vehicles | 143 (26.1%) | 0 (0.0%) |
| Total | 548 (100.0%) | 248 (100.0%) |
Real Estate & Mortgages in Monarch Mill
Real Estate and Mortgage Overview in Monarch Mill
| Characteristic | Without Mortgage | With Mortgage |
| Housing Units | 365 | 183 |
| Median Property Value | $57,800 | $103,000 |
| Median Household Income | $29,669 | $9 |
| Monthly Housing Costs | $298 | $0 |
| Real Estate Taxes | $231 | $9 |
Property Value by Mortgage Status in Monarch Mill
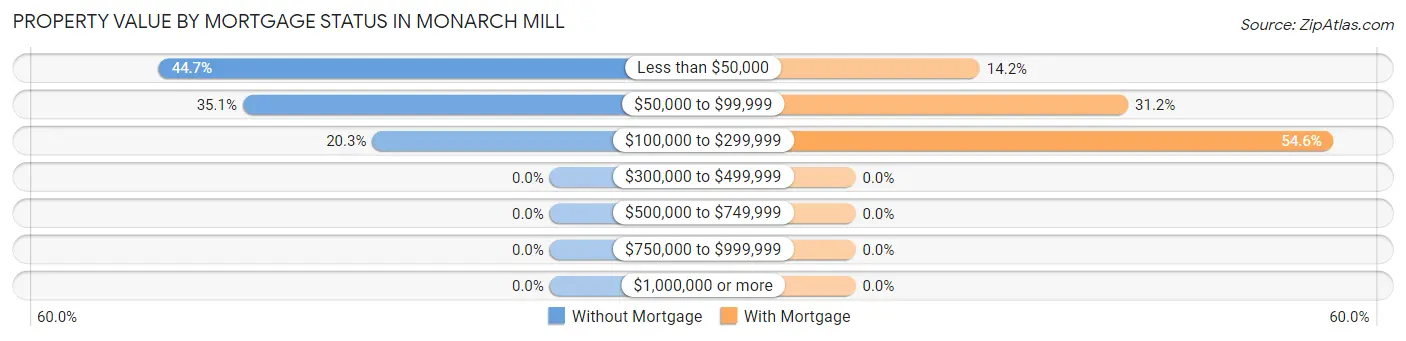
| Property Value | Without Mortgage | With Mortgage |
| Less than $50,000 | 163 (44.7%) | 26 (14.2%) |
| $50,000 to $99,999 | 128 (35.1%) | 57 (31.1%) |
| $100,000 to $299,999 | 74 (20.3%) | 100 (54.6%) |
| $300,000 to $499,999 | 0 (0.0%) | 0 (0.0%) |
| $500,000 to $749,999 | 0 (0.0%) | 0 (0.0%) |
| $750,000 to $999,999 | 0 (0.0%) | 0 (0.0%) |
| $1,000,000 or more | 0 (0.0%) | 0 (0.0%) |
| Total | 365 (100.0%) | 183 (100.0%) |
Household Income by Mortgage Status in Monarch Mill
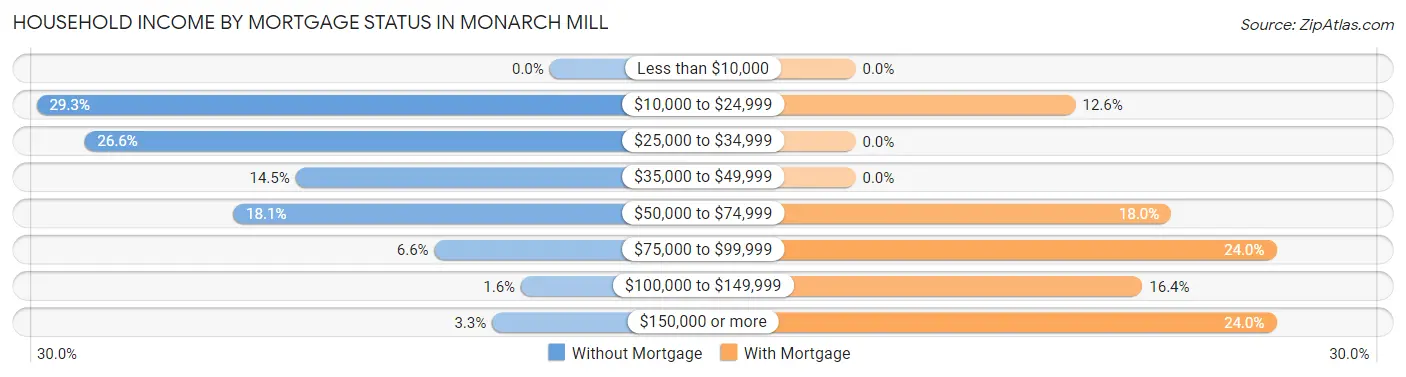
| Household Income | Without Mortgage | With Mortgage |
| Less than $10,000 | 0 (0.0%) | 0 (0.0%) |
| $10,000 to $24,999 | 107 (29.3%) | 23 (12.6%) |
| $25,000 to $34,999 | 97 (26.6%) | 0 (0.0%) |
| $35,000 to $49,999 | 53 (14.5%) | 0 (0.0%) |
| $50,000 to $74,999 | 66 (18.1%) | 33 (18.0%) |
| $75,000 to $99,999 | 24 (6.6%) | 44 (24.0%) |
| $100,000 to $149,999 | 6 (1.6%) | 30 (16.4%) |
| $150,000 or more | 12 (3.3%) | 44 (24.0%) |
| Total | 365 (100.0%) | 183 (100.0%) |
Property Value to Household Income Ratio in Monarch Mill
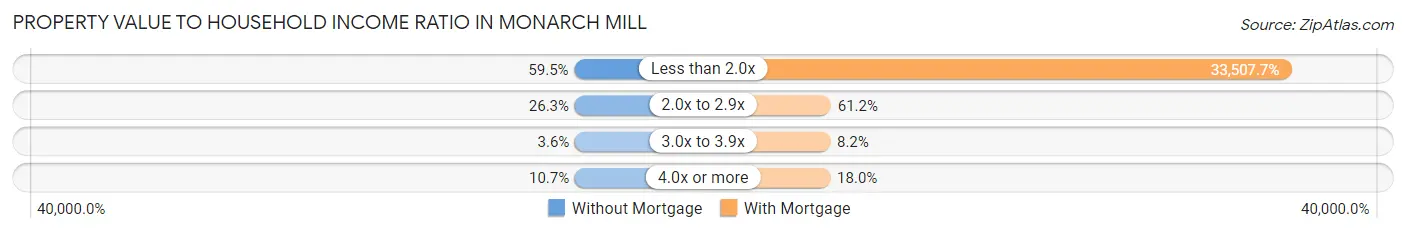
| Value-to-Income Ratio | Without Mortgage | With Mortgage |
| Less than 2.0x | 217 (59.5%) | 61,319 (33,507.7%) |
| 2.0x to 2.9x | 96 (26.3%) | 112 (61.2%) |
| 3.0x to 3.9x | 13 (3.6%) | 15 (8.2%) |
| 4.0x or more | 39 (10.7%) | 33 (18.0%) |
| Total | 365 (100.0%) | 183 (100.0%) |
Real Estate Taxes by Mortgage Status in Monarch Mill
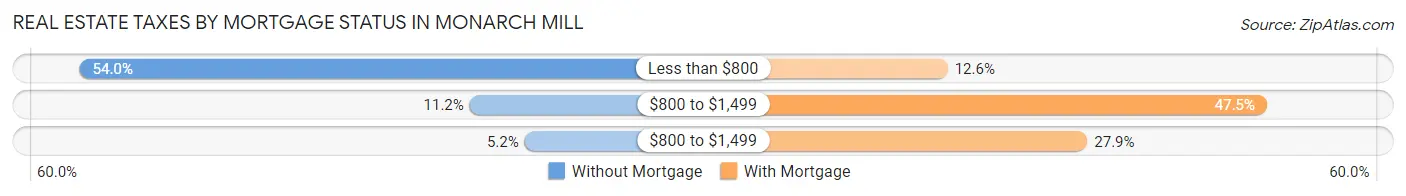
| Property Taxes | Without Mortgage | With Mortgage |
| Less than $800 | 197 (54.0%) | 23 (12.6%) |
| $800 to $1,499 | 41 (11.2%) | 87 (47.5%) |
| $800 to $1,499 | 19 (5.2%) | 51 (27.9%) |
| Total | 365 (100.0%) | 183 (100.0%) |
Health & Disability in Monarch Mill
Health Insurance Coverage by Age in Monarch Mill
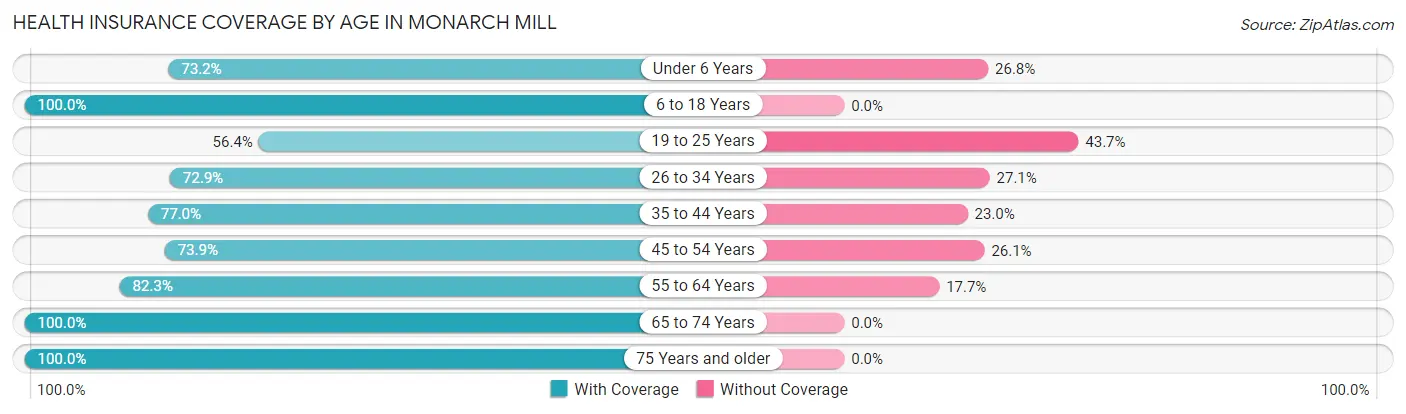
| Age Bracket | With Coverage | Without Coverage |
| Under 6 Years | 131 (73.2%) | 48 (26.8%) |
| 6 to 18 Years | 203 (100.0%) | 0 (0.0%) |
| 19 to 25 Years | 102 (56.4%) | 79 (43.6%) |
| 26 to 34 Years | 156 (72.9%) | 58 (27.1%) |
| 35 to 44 Years | 124 (77.0%) | 37 (23.0%) |
| 45 to 54 Years | 178 (73.9%) | 63 (26.1%) |
| 55 to 64 Years | 200 (82.3%) | 43 (17.7%) |
| 65 to 74 Years | 178 (100.0%) | 0 (0.0%) |
| 75 Years and older | 166 (100.0%) | 0 (0.0%) |
| Total | 1,438 (81.4%) | 328 (18.6%) |
Health Insurance Coverage by Citizenship Status in Monarch Mill
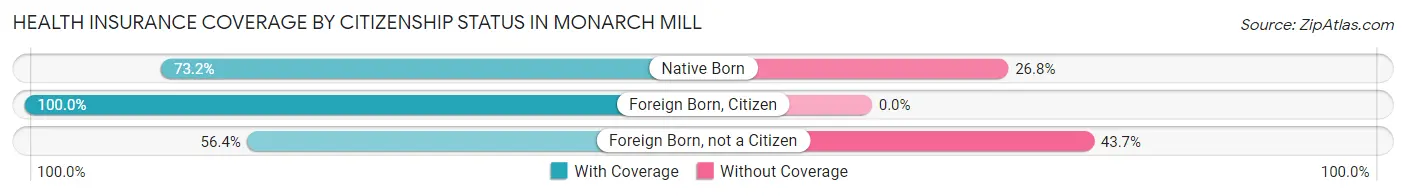
| Citizenship Status | With Coverage | Without Coverage |
| Native Born | 131 (73.2%) | 48 (26.8%) |
| Foreign Born, Citizen | 203 (100.0%) | 0 (0.0%) |
| Foreign Born, not a Citizen | 102 (56.4%) | 79 (43.6%) |
Health Insurance Coverage by Household Income in Monarch Mill
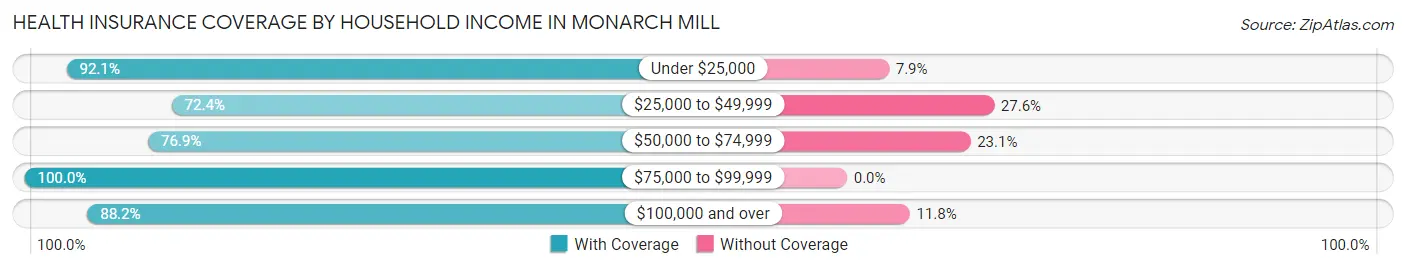
| Household Income | With Coverage | Without Coverage |
| Under $25,000 | 199 (92.1%) | 17 (7.9%) |
| $25,000 to $49,999 | 510 (72.4%) | 194 (27.6%) |
| $50,000 to $74,999 | 309 (76.9%) | 93 (23.1%) |
| $75,000 to $99,999 | 240 (100.0%) | 0 (0.0%) |
| $100,000 and over | 180 (88.2%) | 24 (11.8%) |
Public vs Private Health Insurance Coverage by Age in Monarch Mill
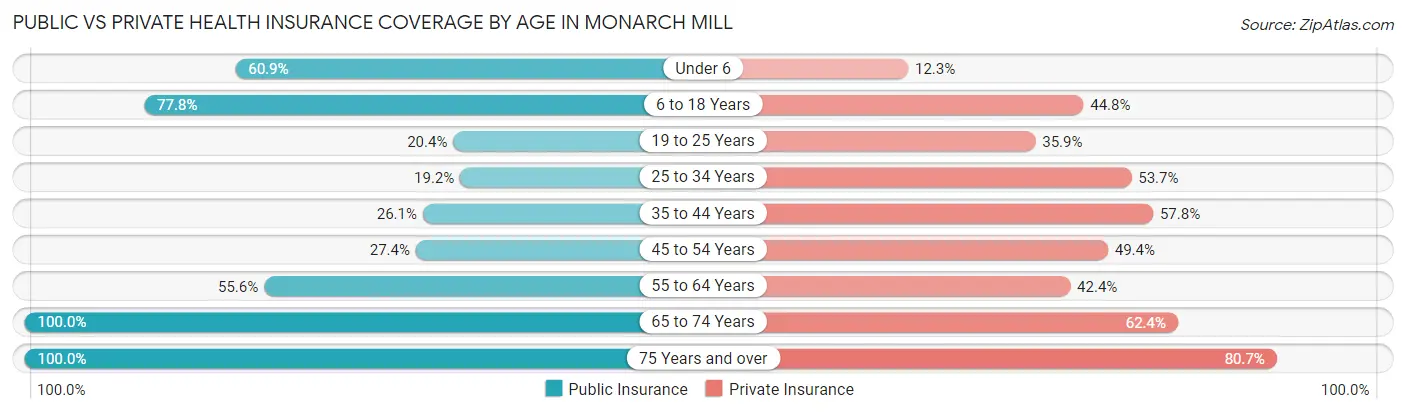
| Age Bracket | Public Insurance | Private Insurance |
| Under 6 | 109 (60.9%) | 22 (12.3%) |
| 6 to 18 Years | 158 (77.8%) | 91 (44.8%) |
| 19 to 25 Years | 37 (20.4%) | 65 (35.9%) |
| 25 to 34 Years | 41 (19.2%) | 115 (53.7%) |
| 35 to 44 Years | 42 (26.1%) | 93 (57.8%) |
| 45 to 54 Years | 66 (27.4%) | 119 (49.4%) |
| 55 to 64 Years | 135 (55.6%) | 103 (42.4%) |
| 65 to 74 Years | 178 (100.0%) | 111 (62.4%) |
| 75 Years and over | 166 (100.0%) | 134 (80.7%) |
| Total | 932 (52.8%) | 853 (48.3%) |
Disability Status by Sex by Age in Monarch Mill
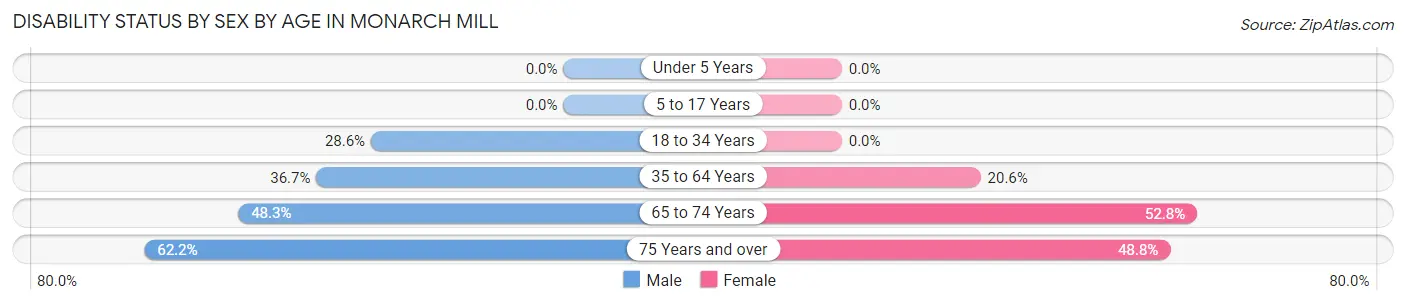
| Age Bracket | Male | Female |
| Under 5 Years | 0 (0.0%) | 0 (0.0%) |
| 5 to 17 Years | 0 (0.0%) | 0 (0.0%) |
| 18 to 34 Years | 78 (28.6%) | 0 (0.0%) |
| 35 to 64 Years | 128 (36.7%) | 61 (20.6%) |
| 65 to 74 Years | 42 (48.3%) | 48 (52.7%) |
| 75 Years and over | 28 (62.2%) | 59 (48.8%) |
Disability Class by Sex by Age in Monarch Mill
Disability Class: Hearing Difficulty
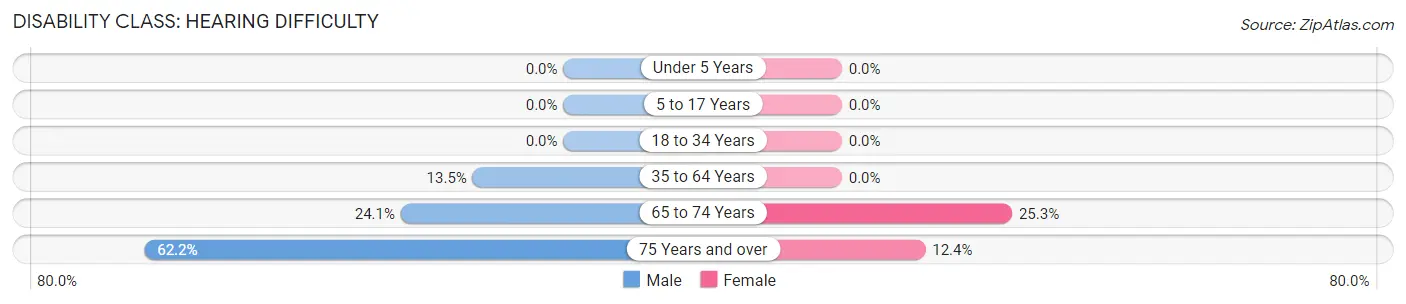
| Age Bracket | Male | Female |
| Under 5 Years | 0 (0.0%) | 0 (0.0%) |
| 5 to 17 Years | 0 (0.0%) | 0 (0.0%) |
| 18 to 34 Years | 0 (0.0%) | 0 (0.0%) |
| 35 to 64 Years | 47 (13.5%) | 0 (0.0%) |
| 65 to 74 Years | 21 (24.1%) | 23 (25.3%) |
| 75 Years and over | 28 (62.2%) | 15 (12.4%) |
Disability Class: Vision Difficulty
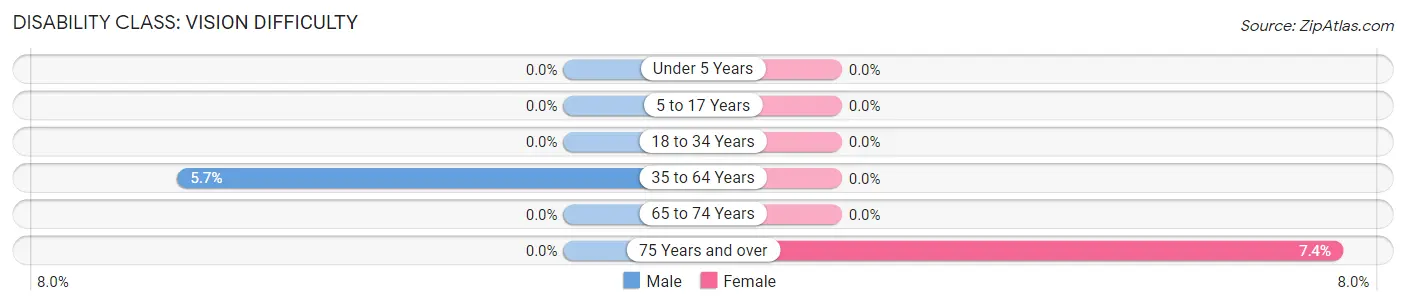
| Age Bracket | Male | Female |
| Under 5 Years | 0 (0.0%) | 0 (0.0%) |
| 5 to 17 Years | 0 (0.0%) | 0 (0.0%) |
| 18 to 34 Years | 0 (0.0%) | 0 (0.0%) |
| 35 to 64 Years | 20 (5.7%) | 0 (0.0%) |
| 65 to 74 Years | 0 (0.0%) | 0 (0.0%) |
| 75 Years and over | 0 (0.0%) | 9 (7.4%) |
Disability Class: Cognitive Difficulty
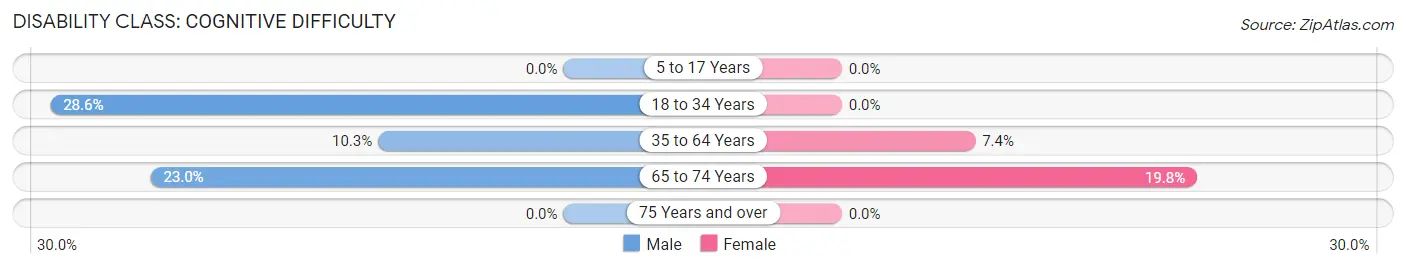
| Age Bracket | Male | Female |
| 5 to 17 Years | 0 (0.0%) | 0 (0.0%) |
| 18 to 34 Years | 78 (28.6%) | 0 (0.0%) |
| 35 to 64 Years | 36 (10.3%) | 22 (7.4%) |
| 65 to 74 Years | 20 (23.0%) | 18 (19.8%) |
| 75 Years and over | 0 (0.0%) | 0 (0.0%) |
Disability Class: Ambulatory Difficulty
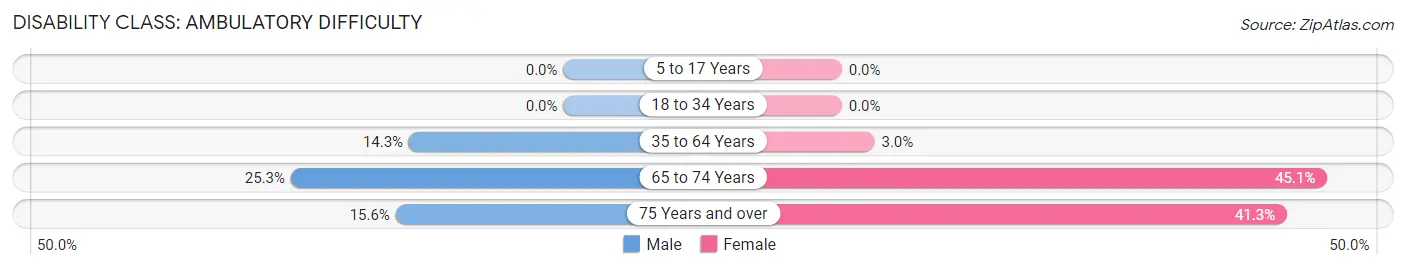
| Age Bracket | Male | Female |
| 5 to 17 Years | 0 (0.0%) | 0 (0.0%) |
| 18 to 34 Years | 0 (0.0%) | 0 (0.0%) |
| 35 to 64 Years | 50 (14.3%) | 9 (3.0%) |
| 65 to 74 Years | 22 (25.3%) | 41 (45.1%) |
| 75 Years and over | 7 (15.6%) | 50 (41.3%) |
Disability Class: Self-Care Difficulty
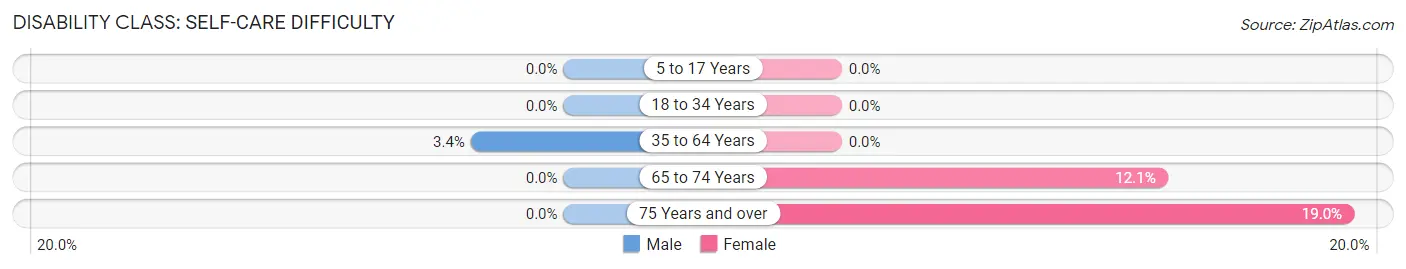
| Age Bracket | Male | Female |
| 5 to 17 Years | 0 (0.0%) | 0 (0.0%) |
| 18 to 34 Years | 0 (0.0%) | 0 (0.0%) |
| 35 to 64 Years | 12 (3.4%) | 0 (0.0%) |
| 65 to 74 Years | 0 (0.0%) | 11 (12.1%) |
| 75 Years and over | 0 (0.0%) | 23 (19.0%) |
Technology Access in Monarch Mill
Computing Device Access in Monarch Mill
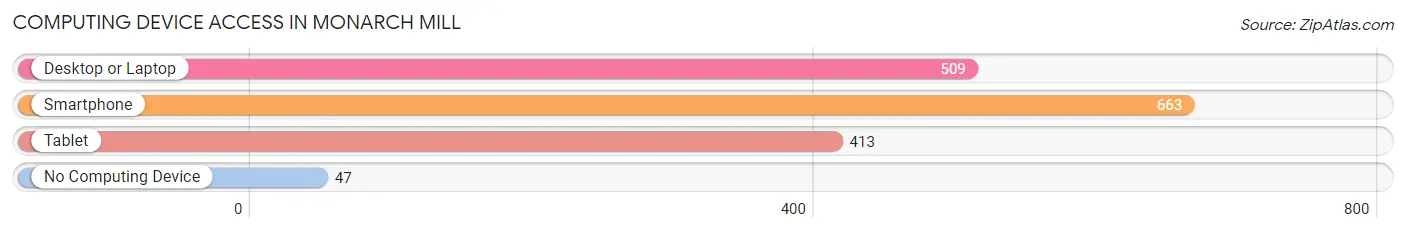
| Device Type | # Households | % Households |
| Desktop or Laptop | 509 | 63.9% |
| Smartphone | 663 | 83.3% |
| Tablet | 413 | 51.9% |
| No Computing Device | 47 | 5.9% |
| Total | 796 | 100.0% |
Internet Access in Monarch Mill
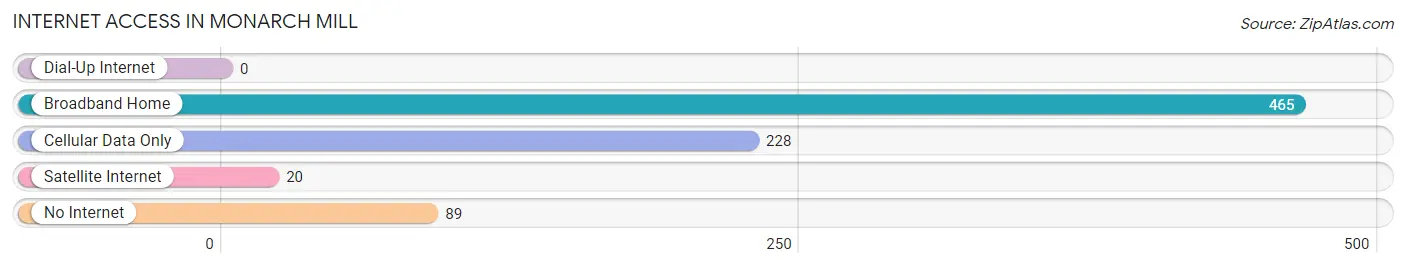
| Internet Type | # Households | % Households |
| Dial-Up Internet | 0 | 0.0% |
| Broadband Home | 465 | 58.4% |
| Cellular Data Only | 228 | 28.6% |
| Satellite Internet | 20 | 2.5% |
| No Internet | 89 | 11.2% |
| Total | 796 | 100.0% |
Monarch Mill Summary
Monarch Mill is a small unincorporated community located in the northwestern corner of South Carolina, in the foothills of the Blue Ridge Mountains. It is situated in the Upstate region of the state, and is part of Oconee County. The community is located along the banks of the Chauga River, and is home to a population of approximately 500 people.
History
Monarch Mill was first settled in the early 1800s by a group of settlers from North Carolina. The settlers were attracted to the area due to its abundance of natural resources, including timber, water, and fertile soil. The settlers quickly established a small mill on the banks of the Chauga River, which was used to grind grain and produce lumber. The mill was named Monarch Mill, after the monarch butterfly, which was a common sight in the area.
The mill quickly became a hub of activity in the area, and the community grew rapidly. By the mid-1800s, Monarch Mill had become a thriving community, with a population of over 500 people. The community was home to a variety of businesses, including a general store, a blacksmith, a post office, and a school.
Geography
Monarch Mill is located in the northwestern corner of South Carolina, in the foothills of the Blue Ridge Mountains. The community is situated in the Upstate region of the state, and is part of Oconee County. The Chauga River runs through the community, and is a popular spot for fishing and swimming. The area is also home to a variety of wildlife, including deer, turkey, and bear.
Economy
The economy of Monarch Mill is largely based on agriculture and forestry. The area is home to a variety of farms, which produce a variety of crops, including corn, soybeans, and wheat. The area is also home to a number of timber companies, which harvest the area’s abundant forests. In addition, the community is home to a number of small businesses, including a general store, a post office, and a school.
Demographics
As of the 2010 census, the population of Monarch Mill was approximately 500 people. The population is largely white, with a small minority of African Americans. The median household income in the community is approximately $35,000, and the median home value is approximately $150,000. The community is served by a variety of public services, including a post office, a library, and a fire department.
Monarch Mill is a small, rural community with a rich history and a strong sense of community. The area is home to a variety of businesses and industries, and is a popular destination for outdoor recreation. The community is a great place to live, work, and raise a family.
Common Questions
What is Per Capita Income in Monarch Mill?
Per Capita income in Monarch Mill is $33,404.
What is the Median Family Income in Monarch Mill?
Median Family Income in Monarch Mill is $45,750.
What is the Median Household income in Monarch Mill?
Median Household Income in Monarch Mill is $37,500.
What is Income or Wage Gap in Monarch Mill?
Income or Wage Gap in Monarch Mill is 6.4%.
Women in Monarch Mill earn 93.6 cents for every dollar earned by a man.
What is Inequality or Gini Index in Monarch Mill?
Inequality or Gini Index in Monarch Mill is 0.58.
What is the Total Population of Monarch Mill?
Total Population of Monarch Mill is 1,766.
What is the Total Male Population of Monarch Mill?
Total Male Population of Monarch Mill is 901.
What is the Total Female Population of Monarch Mill?
Total Female Population of Monarch Mill is 865.
What is the Ratio of Males per 100 Females in Monarch Mill?
There are 104.16 Males per 100 Females in Monarch Mill.
What is the Ratio of Females per 100 Males in Monarch Mill?
There are 96.00 Females per 100 Males in Monarch Mill.
What is the Median Population Age in Monarch Mill?
Median Population Age in Monarch Mill is 42.8 Years.
What is the Average Family Size in Monarch Mill
Average Family Size in Monarch Mill is 2.8 People.
What is the Average Household Size in Monarch Mill
Average Household Size in Monarch Mill is 2.2 People.
How Large is the Labor Force in Monarch Mill?
There are 682 People in the Labor Forcein in Monarch Mill.
What is the Percentage of People in the Labor Force in Monarch Mill?
48.3% of People are in the Labor Force in Monarch Mill.
What is the Unemployment Rate in Monarch Mill?
Unemployment Rate in Monarch Mill is 7.2%.