Liberty, SC Map & Demographics
Liberty Map
Liberty Overview
$27,634
PER CAPITA INCOME
$52,756
AVG FAMILY INCOME
$41,898
AVG HOUSEHOLD INCOME
58.3%
WAGE / INCOME GAP [ % ]
41.7¢/ $1
WAGE / INCOME GAP [ $ ]
0.49
INEQUALITY / GINI INDEX
3,329
TOTAL POPULATION
1,696
MALE POPULATION
1,633
FEMALE POPULATION
103.86
MALES / 100 FEMALES
96.29
FEMALES / 100 MALES
36.4
MEDIAN AGE
3.2
AVG FAMILY SIZE
2.6
AVG HOUSEHOLD SIZE
1,552
LABOR FORCE [ PEOPLE ]
65.1%
PERCENT IN LABOR FORCE
10.2%
UNEMPLOYMENT RATE
Liberty Zip Codes
Liberty Area Codes
Income in Liberty
Income Overview in Liberty
Per Capita Income in Liberty is $27,634, while median incomes of families and households are $52,756 and $41,898 respectively.
| Characteristic | Number | Measure |
| Per Capita Income | 3,329 | $27,634 |
| Median Family Income | 883 | $52,756 |
| Mean Family Income | 883 | $65,599 |
| Median Household Income | 1,254 | $41,898 |
| Mean Household Income | 1,254 | $70,484 |
| Income Deficit | 883 | $0 |
| Wage / Income Gap (%) | 3,329 | 58.33% |
| Wage / Income Gap ($) | 3,329 | 41.67¢ per $1 |
| Gini / Inequality Index | 3,329 | 0.49 |
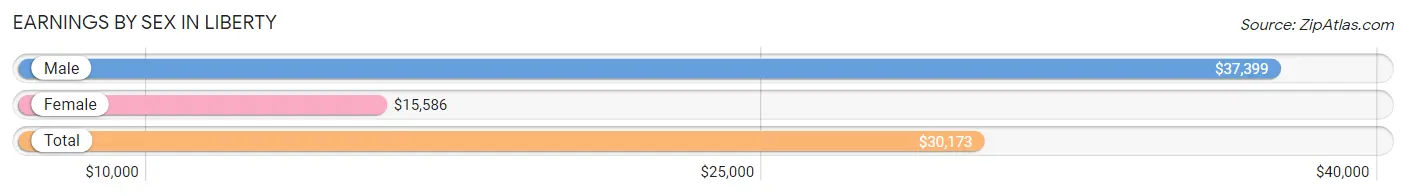
Earnings by Sex in Liberty
Average Earnings in Liberty are $30,173, $37,399 for men and $15,586 for women, a difference of 58.3%.
| Sex | Number | Average Earnings |
| Male | 762 (47.8%) | $37,399 |
| Female | 833 (52.2%) | $15,586 |
| Total | 1,595 (100.0%) | $30,173 |
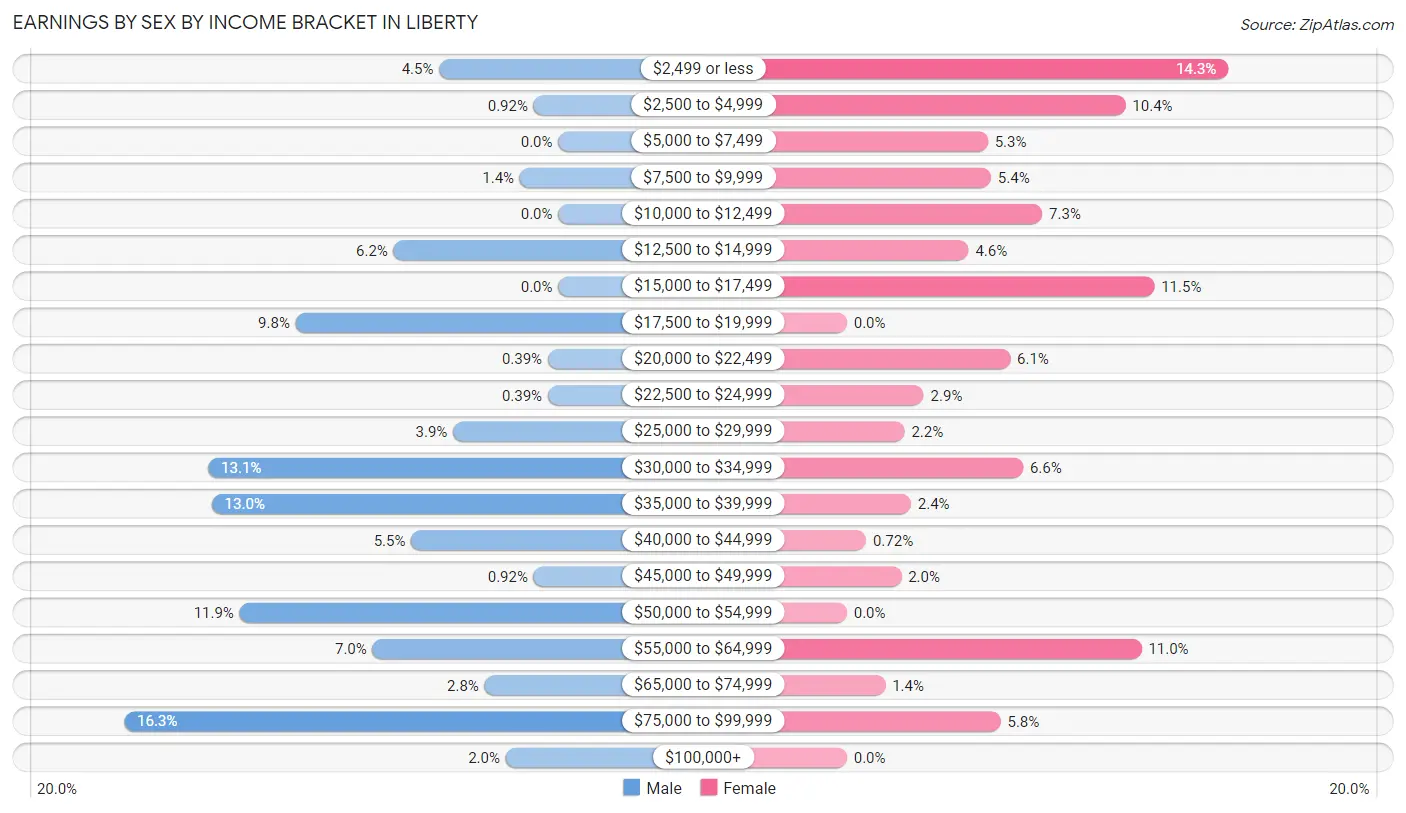
Earnings by Sex by Income Bracket in Liberty
The most common earnings brackets in Liberty are $75,000 to $99,999 for men (124 | 16.3%) and $2,499 or less for women (119 | 14.3%).
| Income | Male | Female |
| $2,499 or less | 34 (4.5%) | 119 (14.3%) |
| $2,500 to $4,999 | 7 (0.9%) | 87 (10.4%) |
| $5,000 to $7,499 | 0 (0.0%) | 44 (5.3%) |
| $7,500 to $9,999 | 11 (1.4%) | 45 (5.4%) |
| $10,000 to $12,499 | 0 (0.0%) | 61 (7.3%) |
| $12,500 to $14,999 | 47 (6.2%) | 38 (4.6%) |
| $15,000 to $17,499 | 0 (0.0%) | 96 (11.5%) |
| $17,500 to $19,999 | 75 (9.8%) | 0 (0.0%) |
| $20,000 to $22,499 | 3 (0.4%) | 51 (6.1%) |
| $22,500 to $24,999 | 3 (0.4%) | 24 (2.9%) |
| $25,000 to $29,999 | 30 (3.9%) | 18 (2.2%) |
| $30,000 to $34,999 | 100 (13.1%) | 55 (6.6%) |
| $35,000 to $39,999 | 99 (13.0%) | 20 (2.4%) |
| $40,000 to $44,999 | 42 (5.5%) | 6 (0.7%) |
| $45,000 to $49,999 | 7 (0.9%) | 17 (2.0%) |
| $50,000 to $54,999 | 91 (11.9%) | 0 (0.0%) |
| $55,000 to $64,999 | 53 (7.0%) | 92 (11.0%) |
| $65,000 to $74,999 | 21 (2.8%) | 12 (1.4%) |
| $75,000 to $99,999 | 124 (16.3%) | 48 (5.8%) |
| $100,000+ | 15 (2.0%) | 0 (0.0%) |
| Total | 762 (100.0%) | 833 (100.0%) |
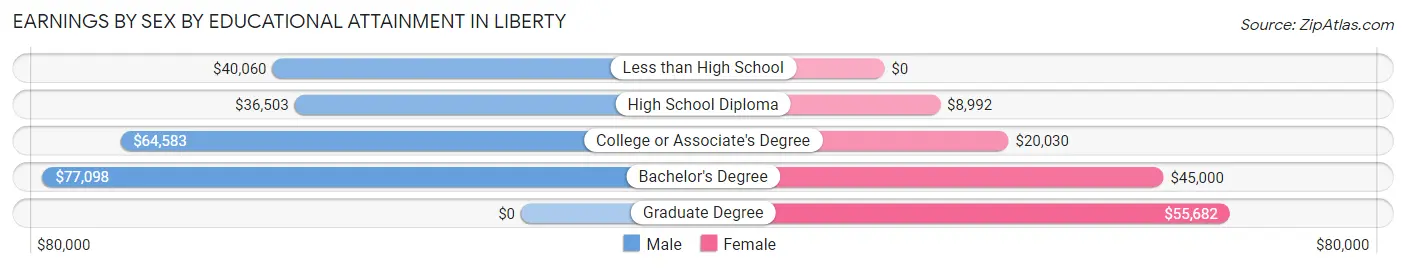
Earnings by Sex by Educational Attainment in Liberty
Average earnings in Liberty are $41,101 for men and $16,680 for women, a difference of 59.4%. Men with an educational attainment of bachelor's degree enjoy the highest average annual earnings of $77,098, while those with high school diploma education earn the least with $36,503. Women with an educational attainment of graduate degree earn the most with the average annual earnings of $55,682, while those with high school diploma education have the smallest earnings of $8,992.
| Educational Attainment | Male Income | Female Income |
| Less than High School | $40,060 | $0 |
| High School Diploma | $36,503 | $8,992 |
| College or Associate's Degree | $64,583 | $20,030 |
| Bachelor's Degree | $77,098 | $45,000 |
| Graduate Degree | - | - |
| Total | $41,101 | $16,680 |
Family Income in Liberty
Family Income Brackets in Liberty
According to the Liberty family income data, there are 184 families falling into the $25,000 to $34,999 income range, which is the most common income bracket and makes up 20.8% of all families.
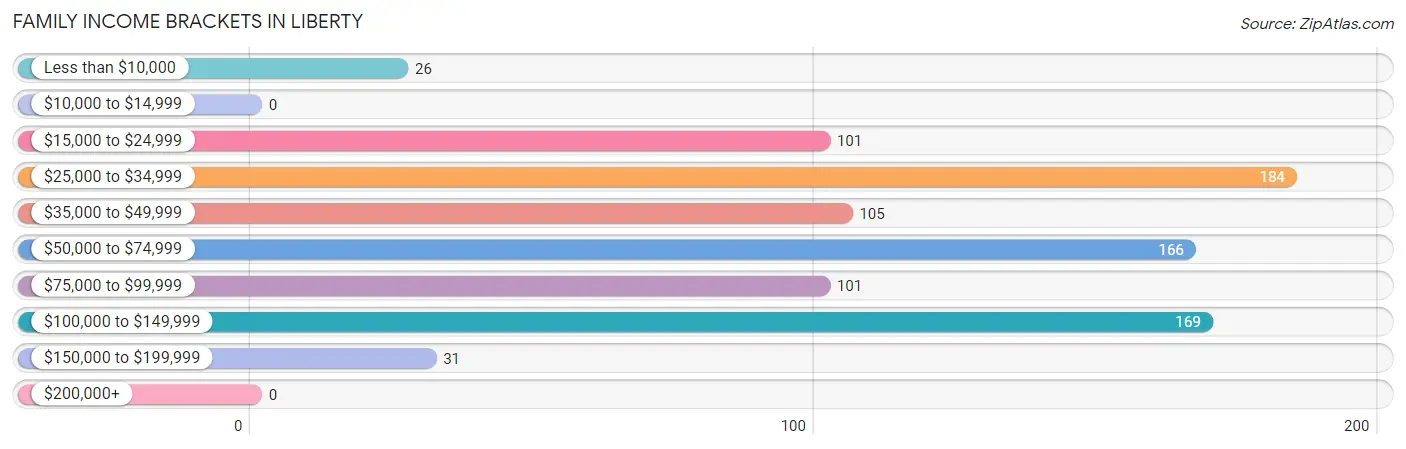
| Income Bracket | # Families | % Families |
| Less than $10,000 | 26 | 2.9% |
| $10,000 to $14,999 | 0 | 0.0% |
| $15,000 to $24,999 | 101 | 11.4% |
| $25,000 to $34,999 | 184 | 20.8% |
| $35,000 to $49,999 | 105 | 11.9% |
| $50,000 to $74,999 | 166 | 18.8% |
| $75,000 to $99,999 | 101 | 11.4% |
| $100,000 to $149,999 | 169 | 19.1% |
| $150,000 to $199,999 | 31 | 3.5% |
| $200,000+ | 0 | 0.0% |
Family Income by Famaliy Size in Liberty
4-person families (152 | 17.2%) account for the highest median family income in Liberty with $70,833 per family, while 2-person families (374 | 42.4%) have the highest median income of $18,948 per family member.
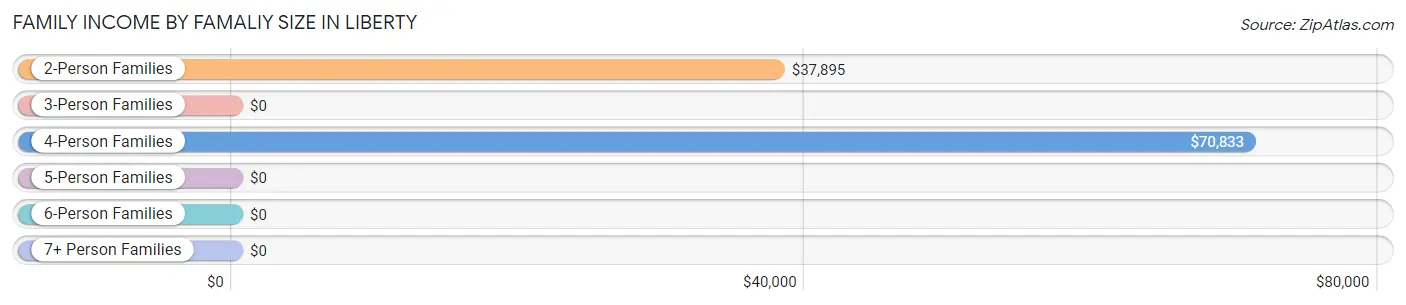
| Income Bracket | # Families | Median Income |
| 2-Person Families | 374 (42.4%) | $37,895 |
| 3-Person Families | 211 (23.9%) | $0 |
| 4-Person Families | 152 (17.2%) | $70,833 |
| 5-Person Families | 112 (12.7%) | $0 |
| 6-Person Families | 31 (3.5%) | $0 |
| 7+ Person Families | 3 (0.3%) | $0 |
| Total | 883 (100.0%) | $52,756 |
Family Income by Number of Earners in Liberty
The median family income in Liberty is $52,756, with families comprising 3+ earners (83) having the highest median family income of $139,250, while families with 1 earner (344) have the lowest median family income of $34,029, accounting for 9.4% and 39.0% of families, respectively.
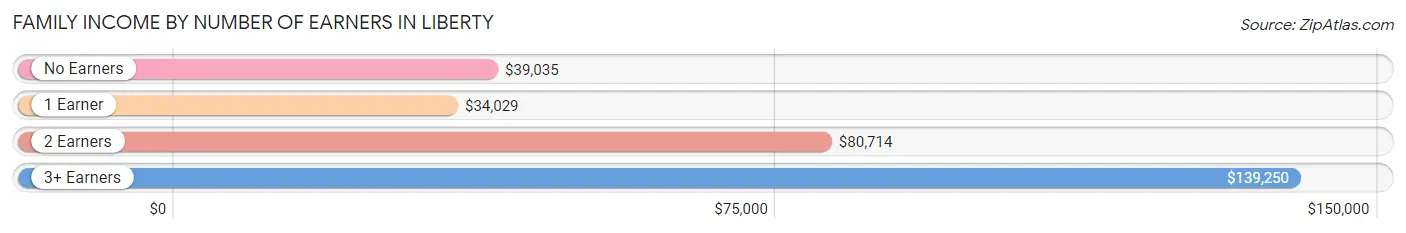
| Number of Earners | # Families | Median Income |
| No Earners | 130 (14.7%) | $39,035 |
| 1 Earner | 344 (39.0%) | $34,029 |
| 2 Earners | 326 (36.9%) | $80,714 |
| 3+ Earners | 83 (9.4%) | $139,250 |
| Total | 883 (100.0%) | $52,756 |
Household Income in Liberty
Household Income Brackets in Liberty
With 233 households falling in the category, the $35,000 to $49,999 income range is the most frequent in Liberty, accounting for 18.6% of all households. In contrast, only 14 households (1.1%) fall into the $200,000+ income bracket, making it the least populous group.
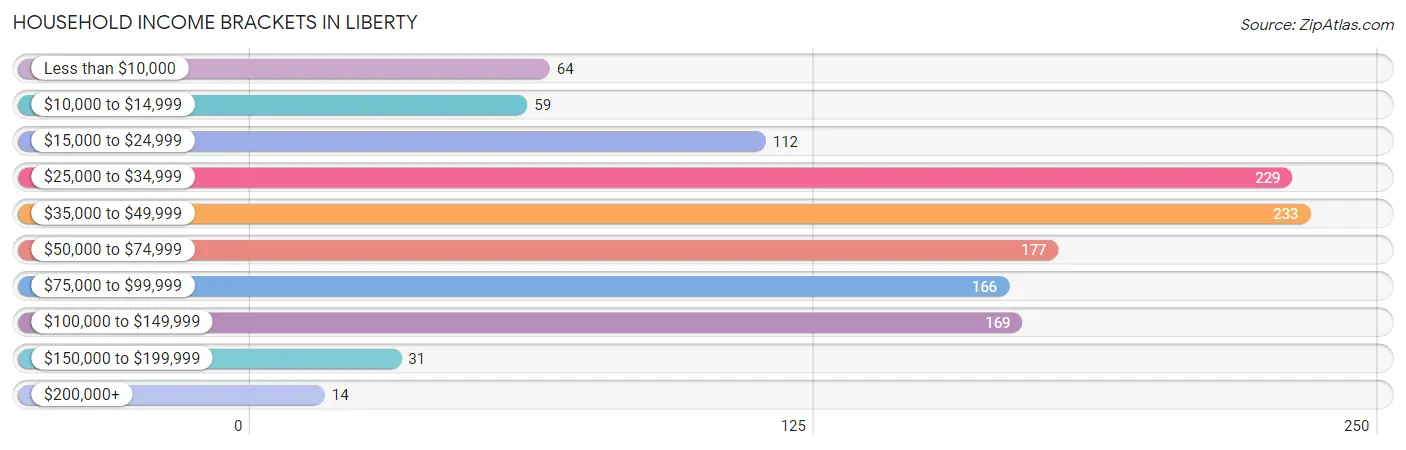
| Income Bracket | # Households | % Households |
| Less than $10,000 | 64 | 5.1% |
| $10,000 to $14,999 | 59 | 4.7% |
| $15,000 to $24,999 | 112 | 8.9% |
| $25,000 to $34,999 | 229 | 18.3% |
| $35,000 to $49,999 | 233 | 18.6% |
| $50,000 to $74,999 | 177 | 14.1% |
| $75,000 to $99,999 | 166 | 13.2% |
| $100,000 to $149,999 | 169 | 13.5% |
| $150,000 to $199,999 | 31 | 2.5% |
| $200,000+ | 14 | 1.1% |
Household Income by Householder Age in Liberty
The median household income in Liberty is $41,898, with the highest median household income of $70,833 found in the 25 to 44 years age bracket for the primary householder. A total of 458 households (36.5%) fall into this category.
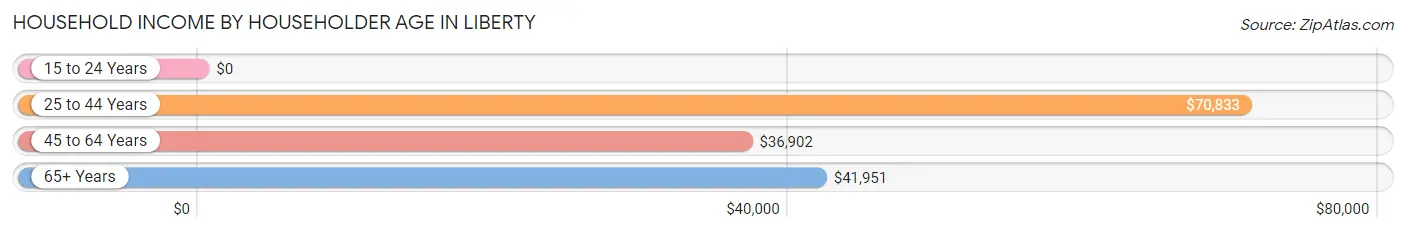
| Income Bracket | # Households | Median Income |
| 15 to 24 Years | 0 (0.0%) | $0 |
| 25 to 44 Years | 458 (36.5%) | $70,833 |
| 45 to 64 Years | 383 (30.5%) | $36,902 |
| 65+ Years | 413 (32.9%) | $41,951 |
| Total | 1,254 (100.0%) | $41,898 |
Poverty in Liberty
Income Below Poverty by Sex and Age in Liberty
With 21.2% poverty level for males and 26.0% for females among the residents of Liberty, 15 year old males and 15 year old females are the most vulnerable to poverty, with 13 males (100.0%) and 46 females (59.0%) in their respective age groups living below the poverty level.
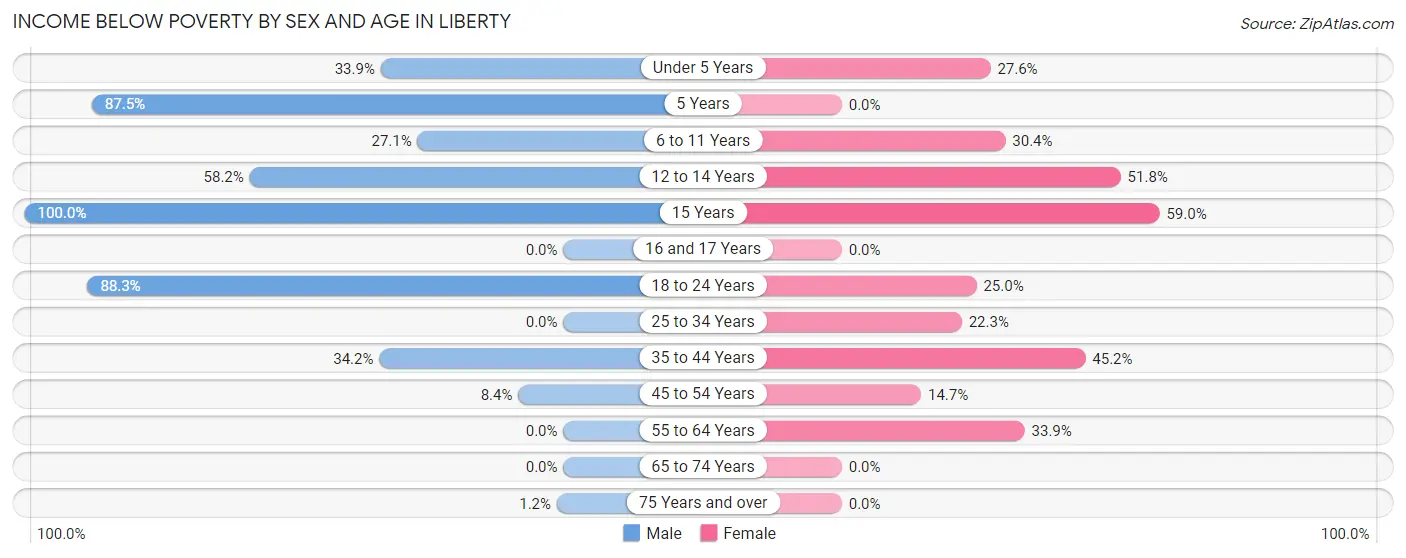
| Age Bracket | Male | Female |
| Under 5 Years | 20 (33.9%) | 32 (27.6%) |
| 5 Years | 35 (87.5%) | 0 (0.0%) |
| 6 to 11 Years | 95 (27.1%) | 17 (30.4%) |
| 12 to 14 Years | 46 (58.2%) | 44 (51.8%) |
| 15 Years | 13 (100.0%) | 46 (59.0%) |
| 16 and 17 Years | 0 (0.0%) | 0 (0.0%) |
| 18 to 24 Years | 53 (88.3%) | 26 (25.0%) |
| 25 to 34 Years | 0 (0.0%) | 65 (22.3%) |
| 35 to 44 Years | 68 (34.2%) | 118 (45.2%) |
| 45 to 54 Years | 20 (8.4%) | 20 (14.7%) |
| 55 to 64 Years | 0 (0.0%) | 57 (33.9%) |
| 65 to 74 Years | 0 (0.0%) | 0 (0.0%) |
| 75 Years and over | 1 (1.2%) | 0 (0.0%) |
| Total | 351 (21.2%) | 425 (26.0%) |
Income Above Poverty by Sex and Age in Liberty
According to the poverty statistics in Liberty, males aged 16 and 17 years and females aged 5 years are the age groups that are most secure financially, with 100.0% of males and 100.0% of females in these age groups living above the poverty line.
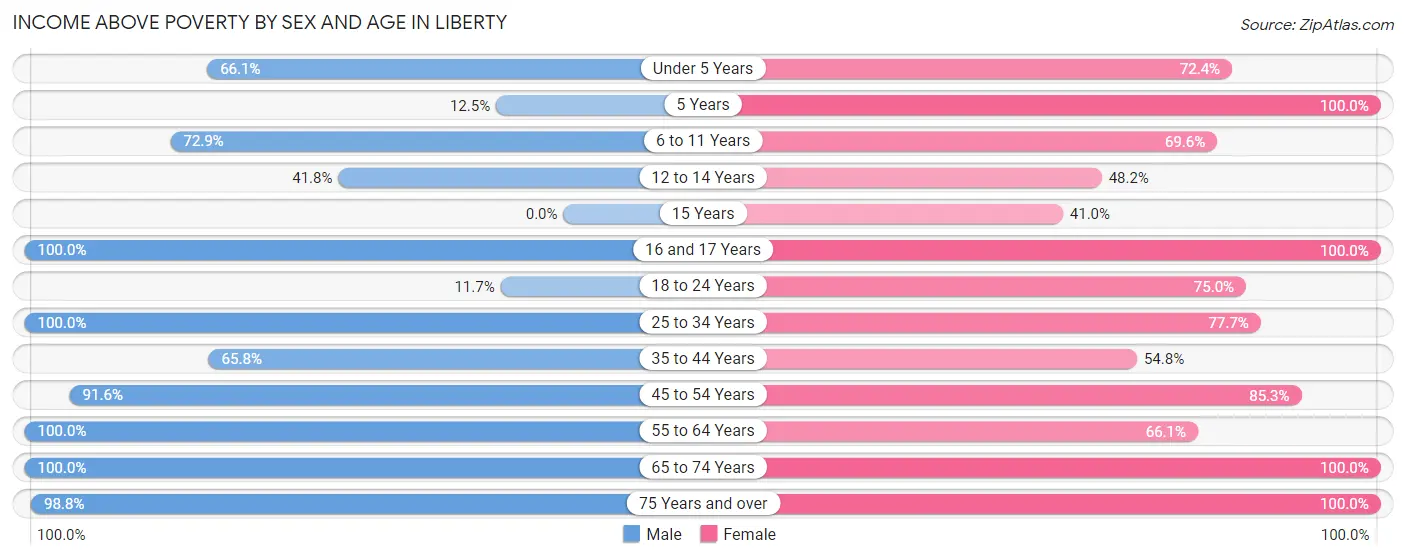
| Age Bracket | Male | Female |
| Under 5 Years | 39 (66.1%) | 84 (72.4%) |
| 5 Years | 5 (12.5%) | 24 (100.0%) |
| 6 to 11 Years | 256 (72.9%) | 39 (69.6%) |
| 12 to 14 Years | 33 (41.8%) | 41 (48.2%) |
| 15 Years | 0 (0.0%) | 32 (41.0%) |
| 16 and 17 Years | 50 (100.0%) | 29 (100.0%) |
| 18 to 24 Years | 7 (11.7%) | 78 (75.0%) |
| 25 to 34 Years | 122 (100.0%) | 227 (77.7%) |
| 35 to 44 Years | 131 (65.8%) | 143 (54.8%) |
| 45 to 54 Years | 219 (91.6%) | 116 (85.3%) |
| 55 to 64 Years | 81 (100.0%) | 111 (66.1%) |
| 65 to 74 Years | 276 (100.0%) | 160 (100.0%) |
| 75 Years and over | 82 (98.8%) | 124 (100.0%) |
| Total | 1,301 (78.7%) | 1,208 (74.0%) |
Income Below Poverty Among Married-Couple Families in Liberty
The poverty statistics for married-couple families in Liberty show that 11.0% or 75 of the total 685 families live below the poverty line. Families with 3 or 4 children have the highest poverty rate of 27.7%, comprising of 13 families. On the other hand, families with 1 or 2 children have the lowest poverty rate of 0.0%, which includes 0 families.
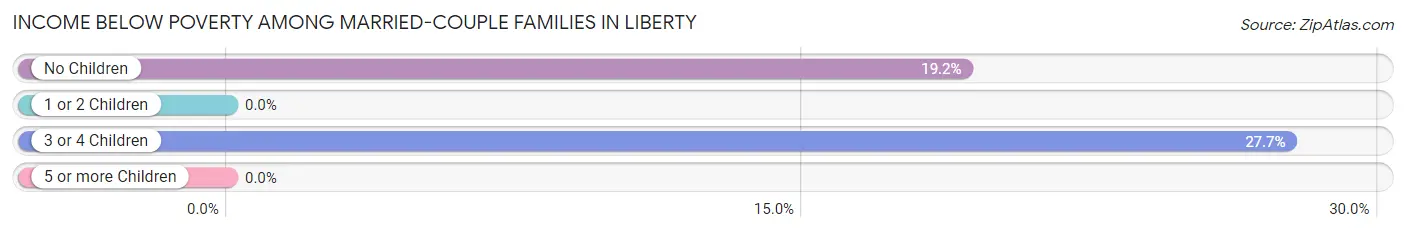
| Children | Above Poverty | Below Poverty |
| No Children | 261 (80.8%) | 62 (19.2%) |
| 1 or 2 Children | 315 (100.0%) | 0 (0.0%) |
| 3 or 4 Children | 34 (72.3%) | 13 (27.7%) |
| 5 or more Children | 0 (0.0%) | 0 (0.0%) |
| Total | 610 (89.0%) | 75 (11.0%) |
Income Below Poverty Among Single-Parent Households in Liberty
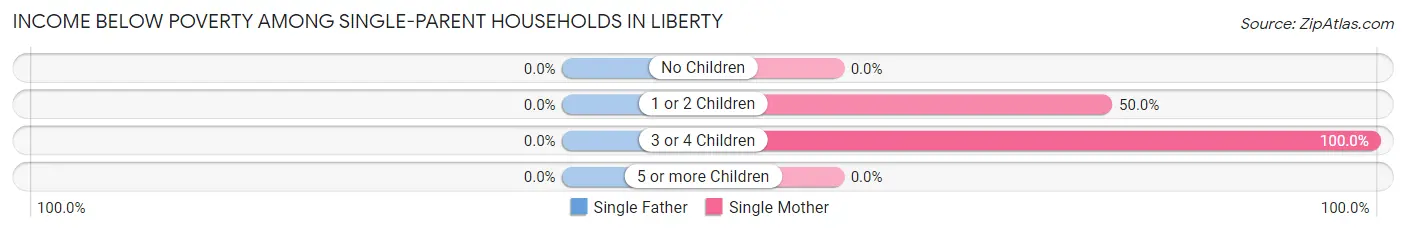
| Children | Single Father | Single Mother |
| No Children | 0 (0.0%) | 0 (0.0%) |
| 1 or 2 Children | 0 (0.0%) | 44 (50.0%) |
| 3 or 4 Children | 0 (0.0%) | 64 (100.0%) |
| 5 or more Children | 0 (0.0%) | 0 (0.0%) |
| Total | 0 (0.0%) | 108 (65.4%) |
Income Below Poverty Among Married-Couple vs Single-Parent Households in Liberty
The poverty data for Liberty shows that 75 of the married-couple family households (11.0%) and 108 of the single-parent households (54.5%) are living below the poverty level. Within the married-couple family households, those with 3 or 4 children have the highest poverty rate, with 13 households (27.7%) falling below the poverty line. Among the single-parent households, those with 3 or 4 children have the highest poverty rate, with 64 household (100.0%) living below poverty.
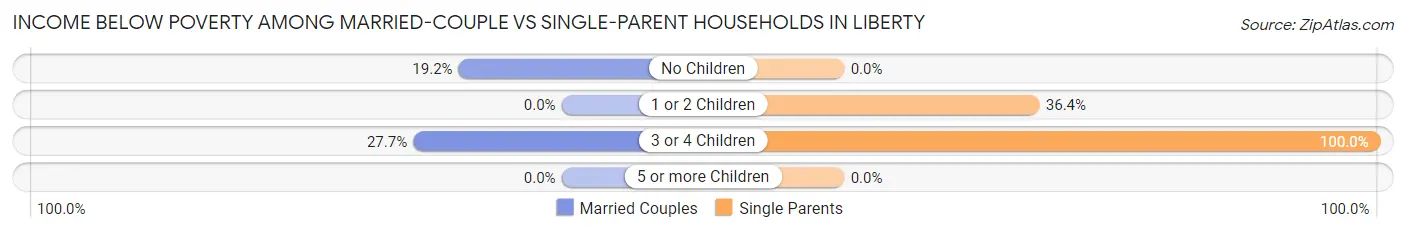
| Children | Married-Couple Families | Single-Parent Households |
| No Children | 62 (19.2%) | 0 (0.0%) |
| 1 or 2 Children | 0 (0.0%) | 44 (36.4%) |
| 3 or 4 Children | 13 (27.7%) | 64 (100.0%) |
| 5 or more Children | 0 (0.0%) | 0 (0.0%) |
| Total | 75 (11.0%) | 108 (54.5%) |
Race in Liberty
The most populous races in Liberty are White / Caucasian (2,393 | 71.9%), Black / African American (664 | 20.0%), and Hispanic or Latino (278 | 8.4%).
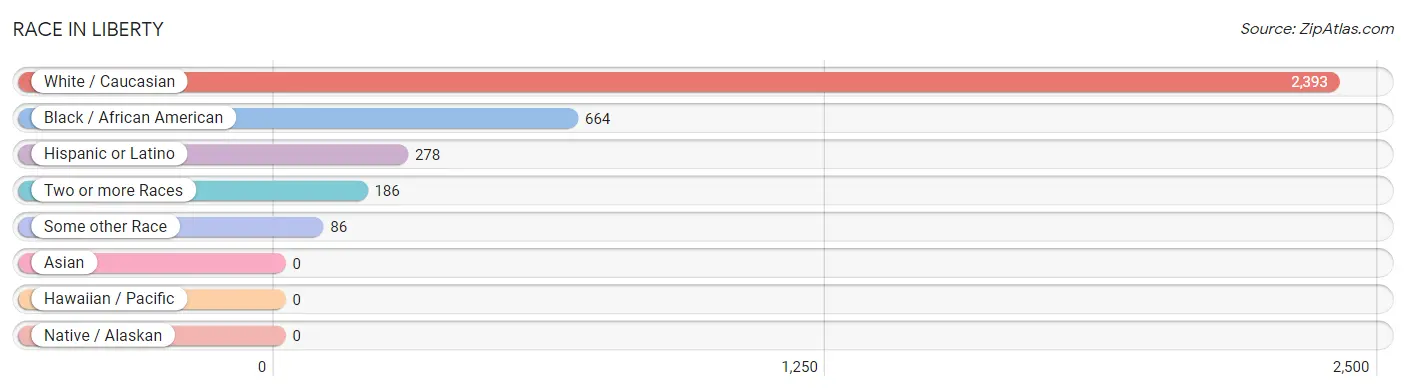
| Race | # Population | % Population |
| Asian | 0 | 0.0% |
| Black / African American | 664 | 20.0% |
| Hawaiian / Pacific | 0 | 0.0% |
| Hispanic or Latino | 278 | 8.4% |
| Native / Alaskan | 0 | 0.0% |
| White / Caucasian | 2,393 | 71.9% |
| Two or more Races | 186 | 5.6% |
| Some other Race | 86 | 2.6% |
| Total | 3,329 | 100.0% |
Ancestry in Liberty
The most populous ancestries reported in Liberty are English (483 | 14.5%), Irish (344 | 10.3%), German (224 | 6.7%), Mexican (223 | 6.7%), and European (153 | 4.6%), together accounting for 42.9% of all Liberty residents.
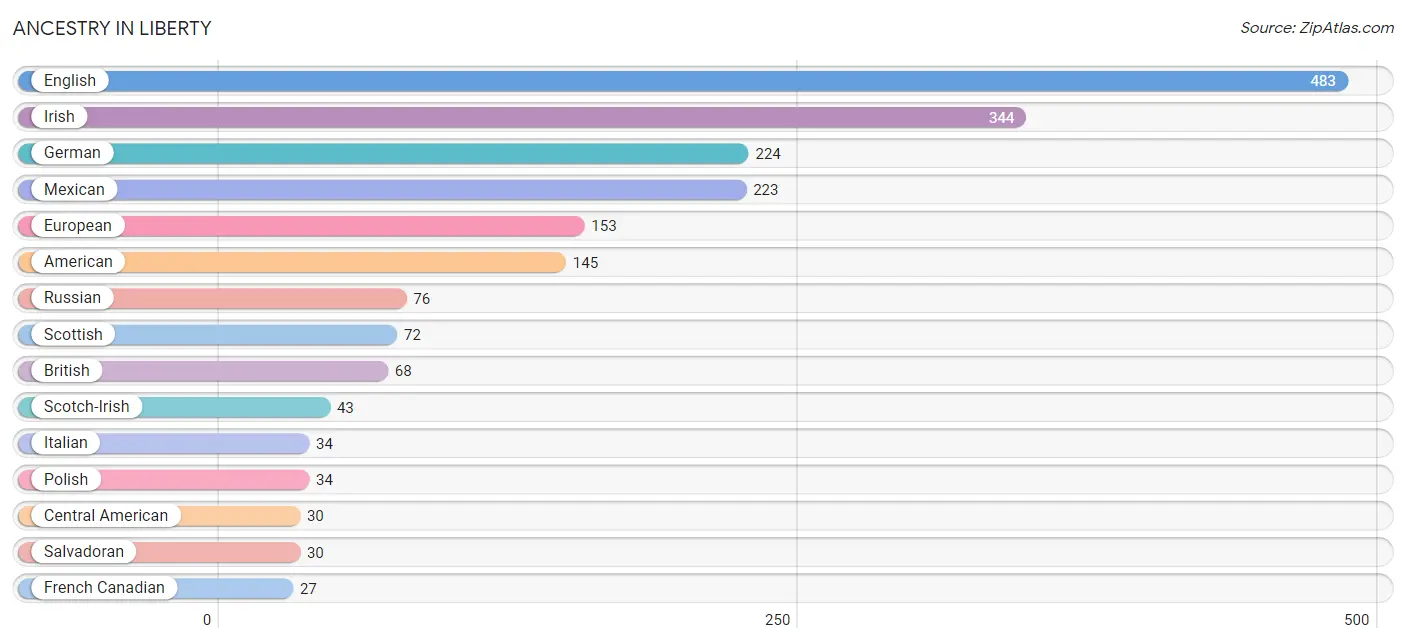
| Ancestry | # Population | % Population |
| American | 145 | 4.4% |
| British | 68 | 2.0% |
| Central American | 30 | 0.9% |
| Cuban | 25 | 0.7% |
| Dutch | 6 | 0.2% |
| English | 483 | 14.5% |
| European | 153 | 4.6% |
| French | 23 | 0.7% |
| French Canadian | 27 | 0.8% |
| German | 224 | 6.7% |
| Irish | 344 | 10.3% |
| Italian | 34 | 1.0% |
| Mexican | 223 | 6.7% |
| Norwegian | 9 | 0.3% |
| Polish | 34 | 1.0% |
| Portuguese | 10 | 0.3% |
| Russian | 76 | 2.3% |
| Salvadoran | 30 | 0.9% |
| Scotch-Irish | 43 | 1.3% |
| Scottish | 72 | 2.2% |
| Sri Lankan | 27 | 0.8% | View All 21 Rows |
Immigrants in Liberty
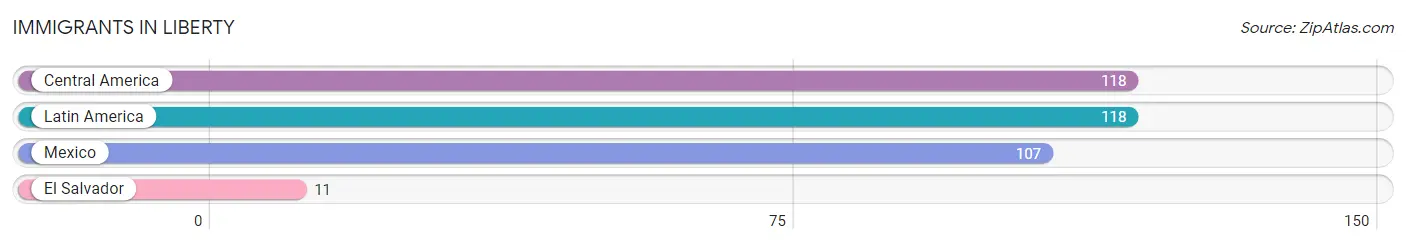
The most numerous immigrant groups reported in Liberty came from Central America (118 | 3.5%), Latin America (118 | 3.5%), Mexico (107 | 3.2%), and El Salvador (11 | 0.3%), together accounting for 10.6% of all Liberty residents.
| Immigration Origin | # Population | % Population |
| Central America | 118 | 3.5% |
| El Salvador | 11 | 0.3% |
| Latin America | 118 | 3.5% |
| Mexico | 107 | 3.2% | View All 4 Rows |
Sex and Age in Liberty
Sex and Age in Liberty
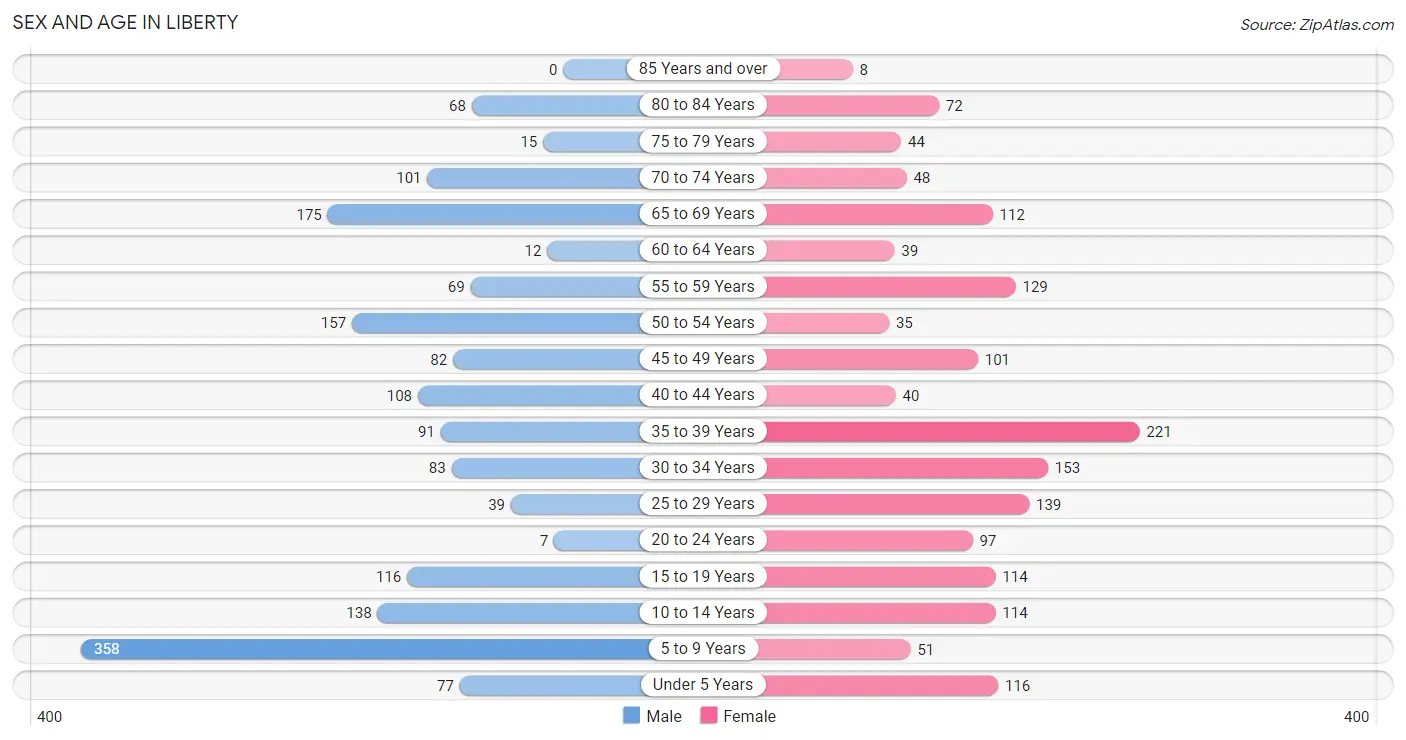
The most populous age groups in Liberty are 5 to 9 Years (358 | 21.1%) for men and 35 to 39 Years (221 | 13.5%) for women.
| Age Bracket | Male | Female |
| Under 5 Years | 77 (4.5%) | 116 (7.1%) |
| 5 to 9 Years | 358 (21.1%) | 51 (3.1%) |
| 10 to 14 Years | 138 (8.1%) | 114 (7.0%) |
| 15 to 19 Years | 116 (6.8%) | 114 (7.0%) |
| 20 to 24 Years | 7 (0.4%) | 97 (5.9%) |
| 25 to 29 Years | 39 (2.3%) | 139 (8.5%) |
| 30 to 34 Years | 83 (4.9%) | 153 (9.4%) |
| 35 to 39 Years | 91 (5.4%) | 221 (13.5%) |
| 40 to 44 Years | 108 (6.4%) | 40 (2.5%) |
| 45 to 49 Years | 82 (4.8%) | 101 (6.2%) |
| 50 to 54 Years | 157 (9.3%) | 35 (2.1%) |
| 55 to 59 Years | 69 (4.1%) | 129 (7.9%) |
| 60 to 64 Years | 12 (0.7%) | 39 (2.4%) |
| 65 to 69 Years | 175 (10.3%) | 112 (6.9%) |
| 70 to 74 Years | 101 (6.0%) | 48 (2.9%) |
| 75 to 79 Years | 15 (0.9%) | 44 (2.7%) |
| 80 to 84 Years | 68 (4.0%) | 72 (4.4%) |
| 85 Years and over | 0 (0.0%) | 8 (0.5%) |
| Total | 1,696 (100.0%) | 1,633 (100.0%) |
Families and Households in Liberty
Median Family Size in Liberty
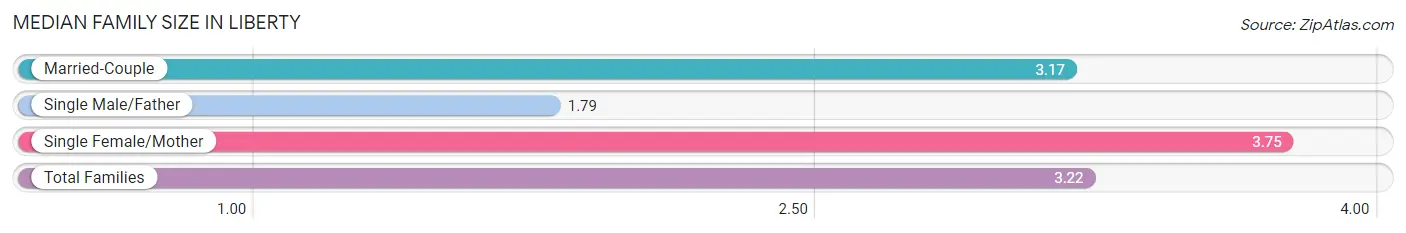
The median family size in Liberty is 3.22 persons per family, with single female/mother families (165 | 18.7%) accounting for the largest median family size of 3.75 persons per family. On the other hand, single male/father families (33 | 3.7%) represent the smallest median family size with 1.79 persons per family.
| Family Type | # Families | Family Size |
| Married-Couple | 685 (77.6%) | 3.17 |
| Single Male/Father | 33 (3.7%) | 1.79 |
| Single Female/Mother | 165 (18.7%) | 3.75 |
| Total Families | 883 (100.0%) | 3.22 |
Median Household Size in Liberty
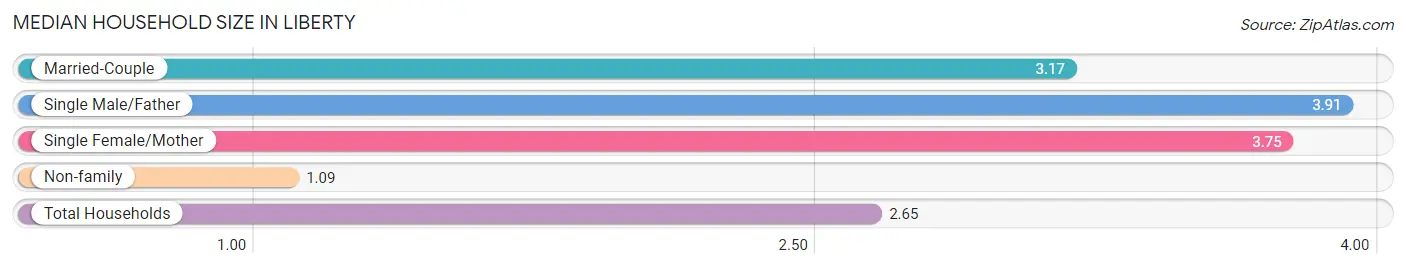
The median household size in Liberty is 2.65 persons per household, with single male/father households (33 | 2.6%) accounting for the largest median household size of 3.91 persons per household. non-family households (371 | 29.6%) represent the smallest median household size with 1.09 persons per household.
| Household Type | # Households | Household Size |
| Married-Couple | 685 (54.6%) | 3.17 |
| Single Male/Father | 33 (2.6%) | 3.91 |
| Single Female/Mother | 165 (13.2%) | 3.75 |
| Non-family | 371 (29.6%) | 1.09 |
| Total Households | 1,254 (100.0%) | 2.65 |
Household Size by Marriage Status in Liberty
Out of a total of 1,254 households in Liberty, 883 (70.4%) are family households, while 371 (29.6%) are nonfamily households. The most numerous type of family households are 2-person households, comprising 341, and the most common type of nonfamily households are 1-person households, comprising 332.
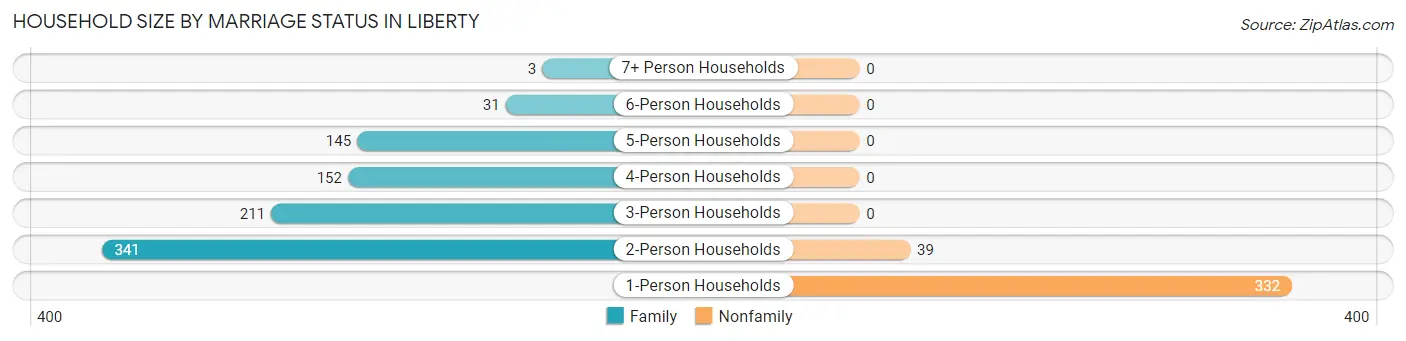
| Household Size | Family Households | Nonfamily Households |
| 1-Person Households | - | 332 (26.5%) |
| 2-Person Households | 341 (27.2%) | 39 (3.1%) |
| 3-Person Households | 211 (16.8%) | 0 (0.0%) |
| 4-Person Households | 152 (12.1%) | 0 (0.0%) |
| 5-Person Households | 145 (11.6%) | 0 (0.0%) |
| 6-Person Households | 31 (2.5%) | 0 (0.0%) |
| 7+ Person Households | 3 (0.2%) | 0 (0.0%) |
| Total | 883 (70.4%) | 371 (29.6%) |
Female Fertility in Liberty
Fertility by Age in Liberty
Average fertility rate in Liberty is 39.0 births per 1,000 women. Women in the age bracket of 20 to 34 years have the highest fertility rate with 54.0 births per 1,000 women. Women in the age bracket of 20 to 34 years acount for 61.8% of all women with births.
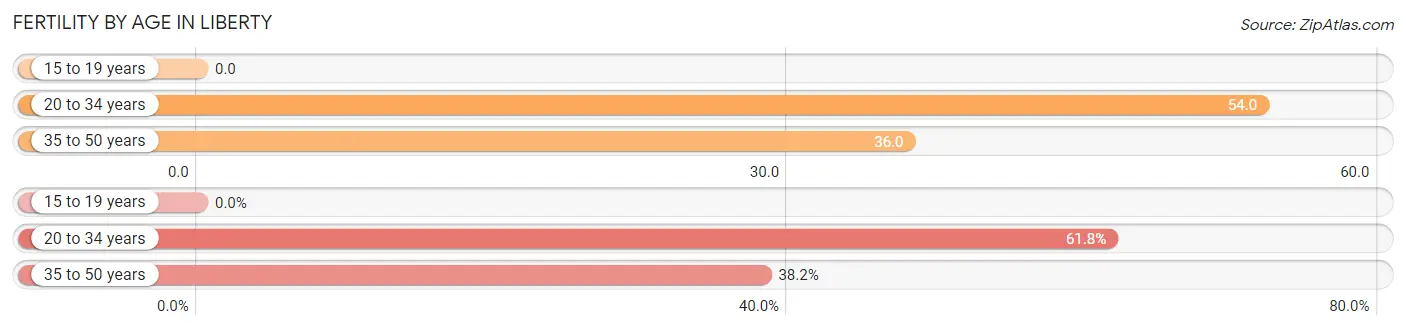
| Age Bracket | Women with Births | Births / 1,000 Women |
| 15 to 19 years | 0 (0.0%) | 0.0 |
| 20 to 34 years | 21 (61.8%) | 54.0 |
| 35 to 50 years | 13 (38.2%) | 36.0 |
| Total | 34 (100.0%) | 39.0 |
Fertility by Age by Marriage Status in Liberty
38.2% of women with births (34) in Liberty are married. The highest percentage of unmarried women with births falls into 20 to 34 years age bracket with 100.0% of them unmarried at the time of birth, while the lowest percentage of unmarried women with births belong to 35 to 50 years age bracket with 0.0% of them unmarried.
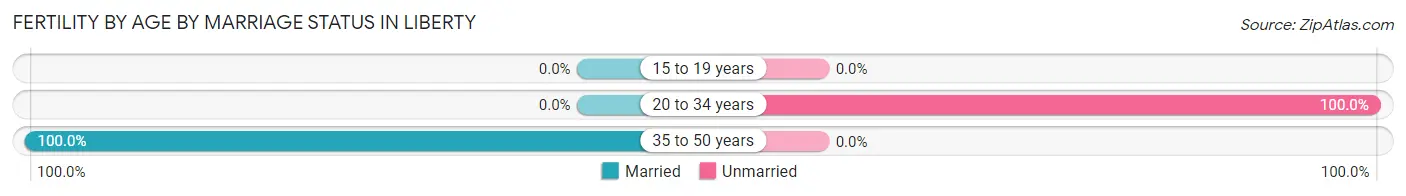
| Age Bracket | Married | Unmarried |
| 15 to 19 years | 0 (0.0%) | 0 (0.0%) |
| 20 to 34 years | 0 (0.0%) | 21 (100.0%) |
| 35 to 50 years | 13 (100.0%) | 0 (0.0%) |
| Total | 13 (38.2%) | 21 (61.8%) |
Fertility by Education in Liberty
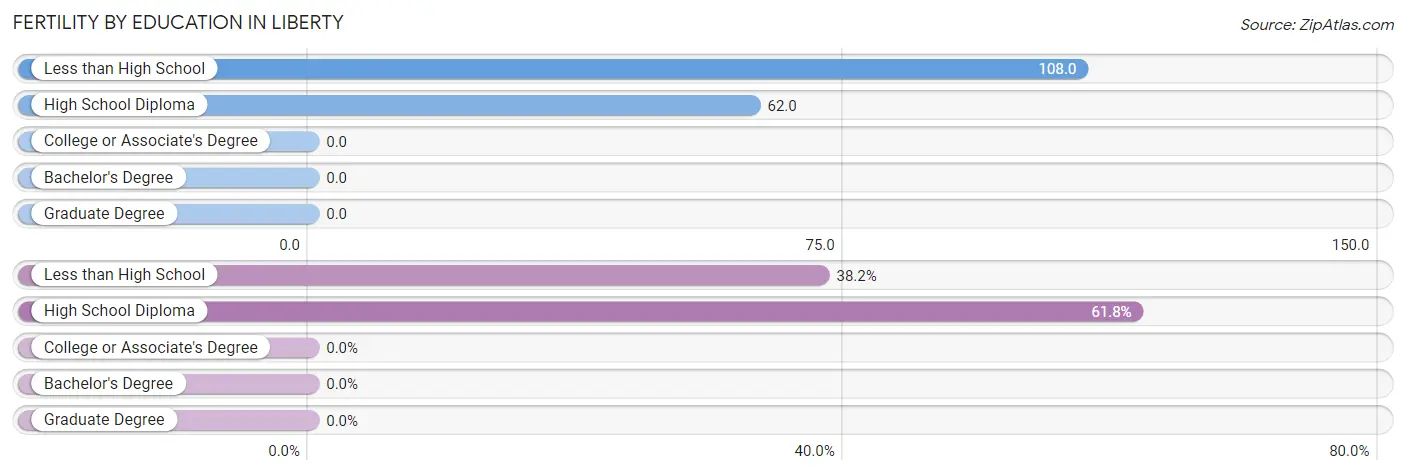
| Educational Attainment | Women with Births | Births / 1,000 Women |
| Less than High School | 13 (38.2%) | 108.0 |
| High School Diploma | 21 (61.8%) | 62.0 |
| College or Associate's Degree | 0 (0.0%) | 0.0 |
| Bachelor's Degree | 0 (0.0%) | 0.0 |
| Graduate Degree | 0 (0.0%) | 0.0 |
| Total | 34 (100.0%) | 39.0 |
Fertility by Education by Marriage Status in Liberty
61.8% of women with births in Liberty are unmarried. Women with the educational attainment of less than high school are most likely to be married with 100.0% of them married at childbirth, while women with the educational attainment of high school diploma are least likely to be married with 100.0% of them unmarried at childbirth.
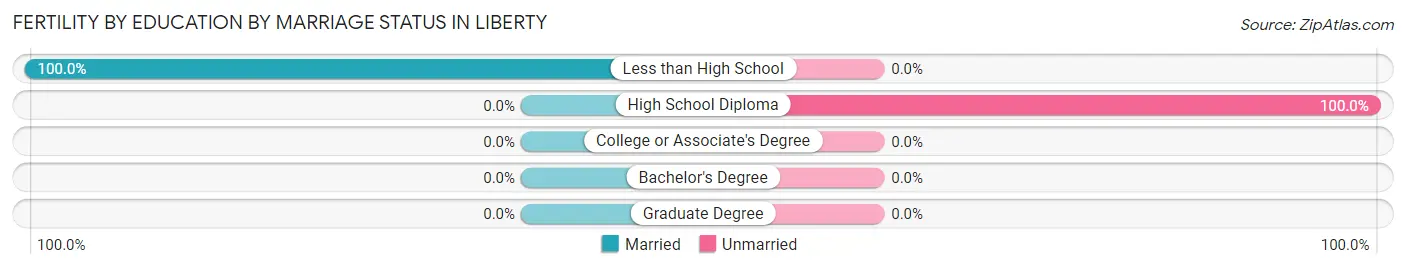
| Educational Attainment | Married | Unmarried |
| Less than High School | 13 (100.0%) | 0 (0.0%) |
| High School Diploma | 0 (0.0%) | 21 (100.0%) |
| College or Associate's Degree | 0 (0.0%) | 0 (0.0%) |
| Bachelor's Degree | 0 (0.0%) | 0 (0.0%) |
| Graduate Degree | 0 (0.0%) | 0 (0.0%) |
| Total | 13 (38.2%) | 21 (61.8%) |
Employment Characteristics in Liberty
Employment by Class of Employer in Liberty
Among the 1,396 employed individuals in Liberty, private company employees (1,144 | 82.0%), not-for-profit organizations (66 | 4.7%), and self-employed (not incorporated) (63 | 4.5%) make up the most common classes of employment.
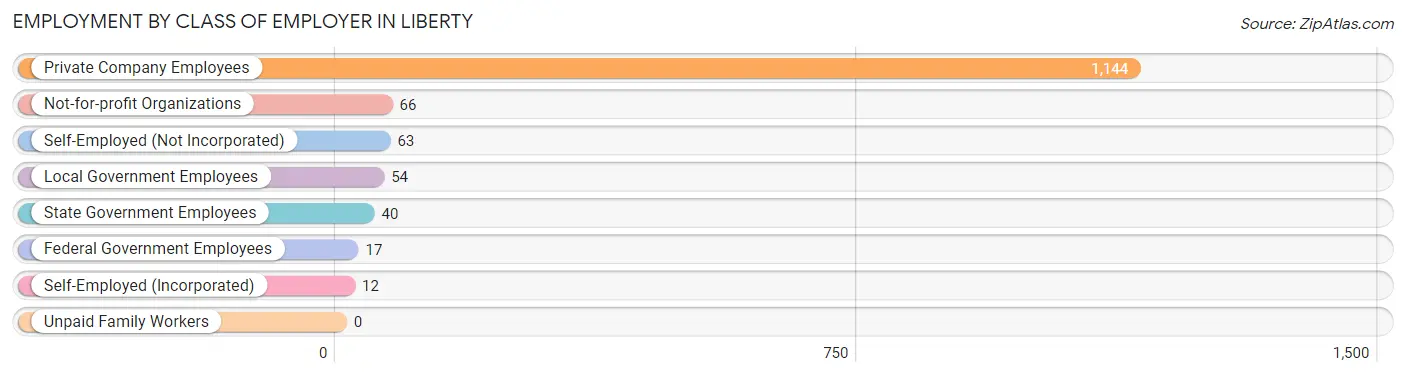
| Employer Class | # Employees | % Employees |
| Private Company Employees | 1,144 | 82.0% |
| Self-Employed (Incorporated) | 12 | 0.9% |
| Self-Employed (Not Incorporated) | 63 | 4.5% |
| Not-for-profit Organizations | 66 | 4.7% |
| Local Government Employees | 54 | 3.9% |
| State Government Employees | 40 | 2.9% |
| Federal Government Employees | 17 | 1.2% |
| Unpaid Family Workers | 0 | 0.0% |
| Total | 1,396 | 100.0% |
Employment Status by Age in Liberty
According to the labor force statistics for Liberty, out of the total population over 16 years of age (2,384), 65.1% or 1,552 individuals are in the labor force, with 10.2% or 158 of them unemployed. The age group with the highest labor force participation rate is 20 to 24 years, with 100.0% or 104 individuals in the labor force. Within the labor force, the 35 to 44 years age range has the highest percentage of unemployed individuals, with 30.2% or 113 of them being unemployed.
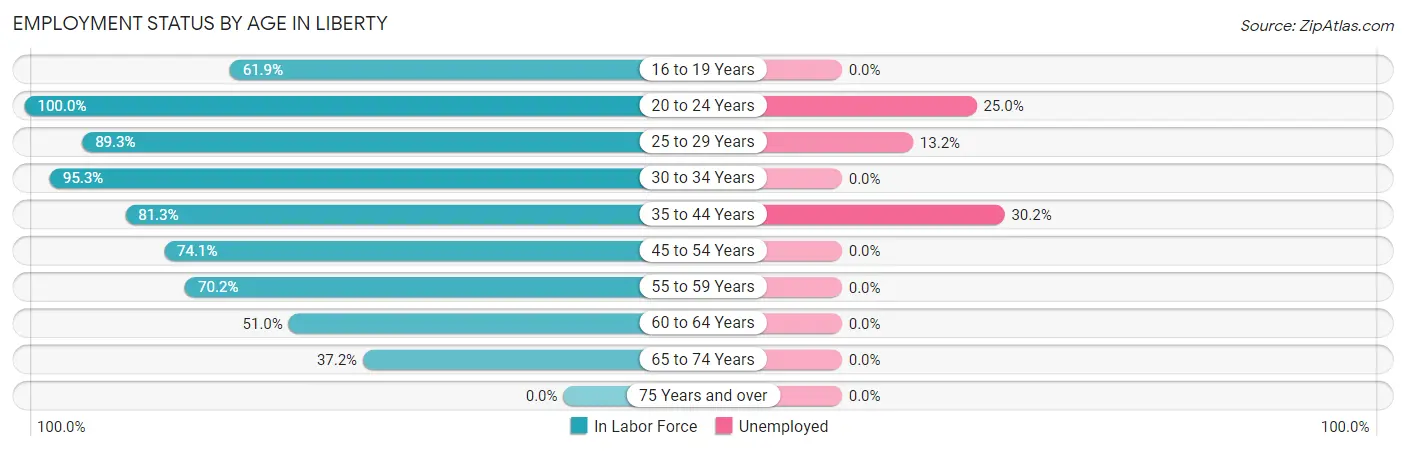
| Age Bracket | In Labor Force | Unemployed |
| 16 to 19 Years | 86 (61.9%) | 0 (0.0%) |
| 20 to 24 Years | 104 (100.0%) | 26 (25.0%) |
| 25 to 29 Years | 159 (89.3%) | 21 (13.2%) |
| 30 to 34 Years | 225 (95.3%) | 0 (0.0%) |
| 35 to 44 Years | 374 (81.3%) | 113 (30.2%) |
| 45 to 54 Years | 278 (74.1%) | 0 (0.0%) |
| 55 to 59 Years | 139 (70.2%) | 0 (0.0%) |
| 60 to 64 Years | 26 (51.0%) | 0 (0.0%) |
| 65 to 74 Years | 162 (37.2%) | 0 (0.0%) |
| 75 Years and over | 0 (0.0%) | 0 (0.0%) |
| Total | 1,552 (65.1%) | 158 (10.2%) |
Employment Status by Educational Attainment in Liberty
According to labor force statistics for Liberty, 80.2% of individuals (1,201) out of the total population between 25 and 64 years of age (1,498) are in the labor force, with 11.0% or 132 of them being unemployed. The group with the highest labor force participation rate are those with the educational attainment of bachelor's degree or higher, with 99.6% or 260 individuals in the labor force. Within the labor force, individuals with high school diploma education have the highest percentage of unemployment, with 18.6% or 101 of them being unemployed.
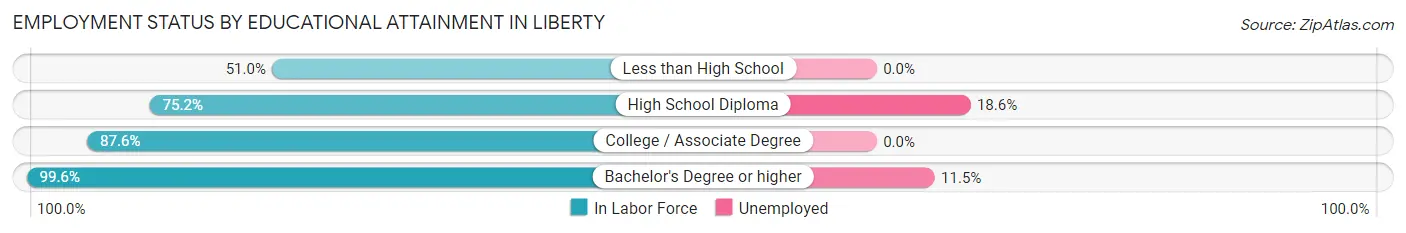
| Educational Attainment | In Labor Force | Unemployed |
| Less than High School | 74 (51.0%) | 0 (0.0%) |
| High School Diploma | 543 (75.2%) | 134 (18.6%) |
| College / Associate Degree | 324 (87.6%) | 0 (0.0%) |
| Bachelor's Degree or higher | 260 (99.6%) | 30 (11.5%) |
| Total | 1,201 (80.2%) | 165 (11.0%) |
Employment Occupations by Sex in Liberty
Management, Business, Science and Arts Occupations
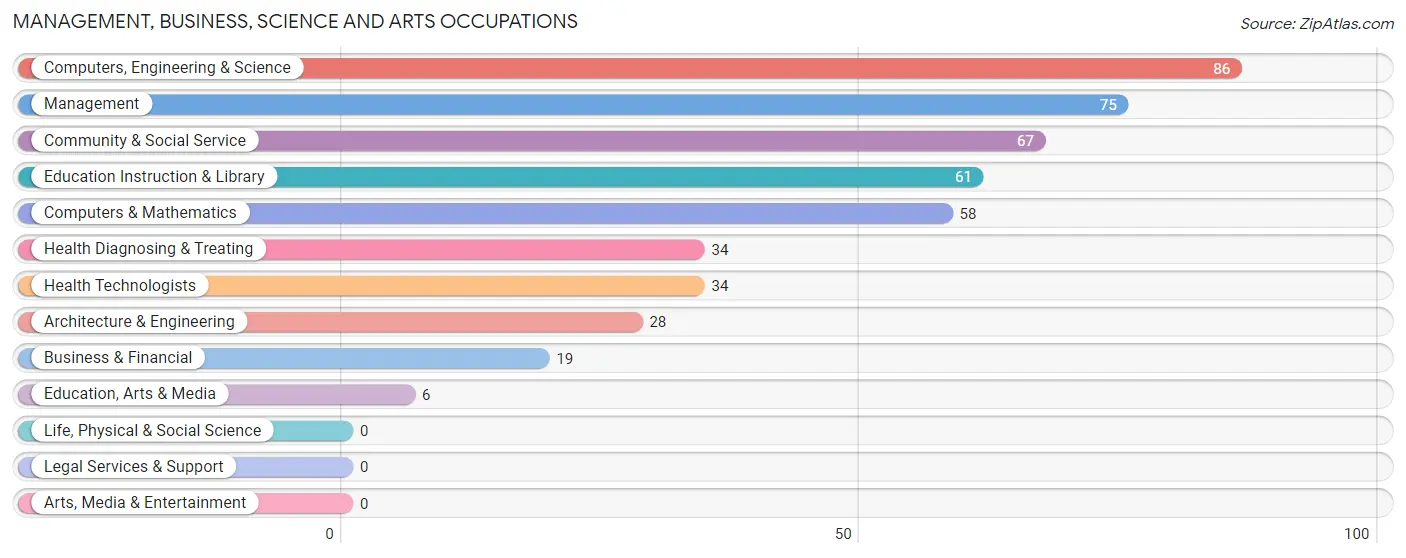
The most common Management, Business, Science and Arts occupations in Liberty are Computers, Engineering & Science (86 | 6.2%), Management (75 | 5.4%), Community & Social Service (67 | 4.8%), Education Instruction & Library (61 | 4.4%), and Computers & Mathematics (58 | 4.2%).
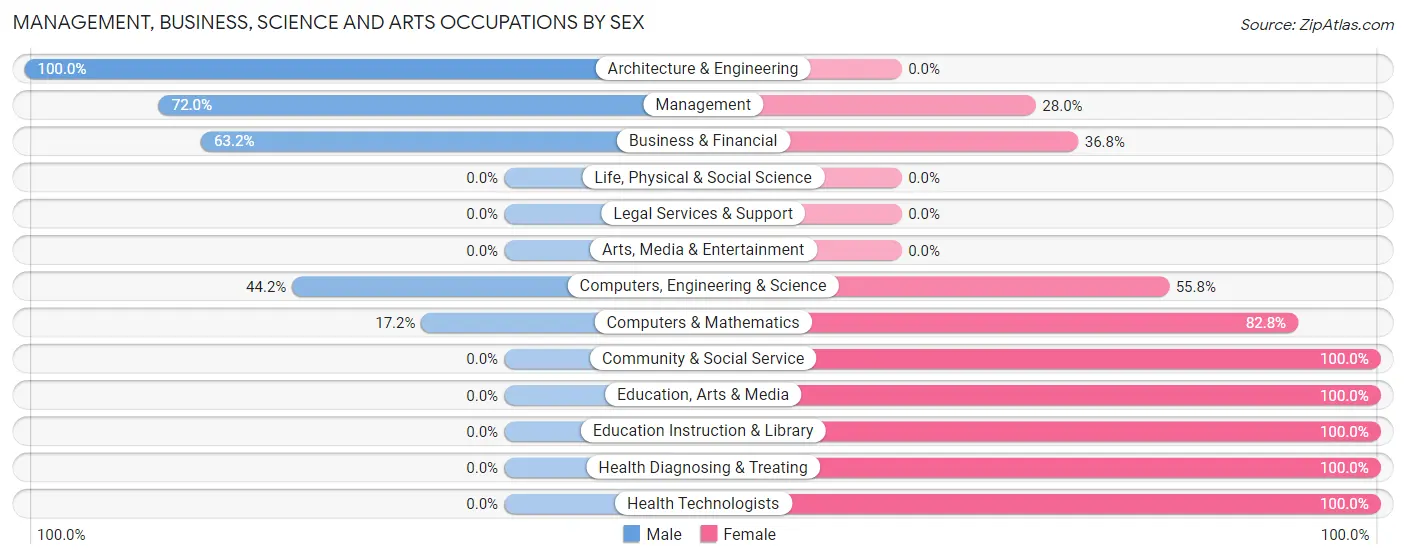
Management, Business, Science and Arts Occupations by Sex
Within the Management, Business, Science and Arts occupations in Liberty, the most male-oriented occupations are Architecture & Engineering (100.0%), Management (72.0%), and Business & Financial (63.2%), while the most female-oriented occupations are Community & Social Service (100.0%), Education, Arts & Media (100.0%), and Education Instruction & Library (100.0%).
| Occupation | Male | Female |
| Management | 54 (72.0%) | 21 (28.0%) |
| Business & Financial | 12 (63.2%) | 7 (36.8%) |
| Computers, Engineering & Science | 38 (44.2%) | 48 (55.8%) |
| Computers & Mathematics | 10 (17.2%) | 48 (82.8%) |
| Architecture & Engineering | 28 (100.0%) | 0 (0.0%) |
| Life, Physical & Social Science | 0 (0.0%) | 0 (0.0%) |
| Community & Social Service | 0 (0.0%) | 67 (100.0%) |
| Education, Arts & Media | 0 (0.0%) | 6 (100.0%) |
| Legal Services & Support | 0 (0.0%) | 0 (0.0%) |
| Education Instruction & Library | 0 (0.0%) | 61 (100.0%) |
| Arts, Media & Entertainment | 0 (0.0%) | 0 (0.0%) |
| Health Diagnosing & Treating | 0 (0.0%) | 34 (100.0%) |
| Health Technologists | 0 (0.0%) | 34 (100.0%) |
| Total (Category) | 104 (37.0%) | 177 (63.0%) |
| Total (Overall) | 732 (52.8%) | 654 (47.2%) |
Services Occupations
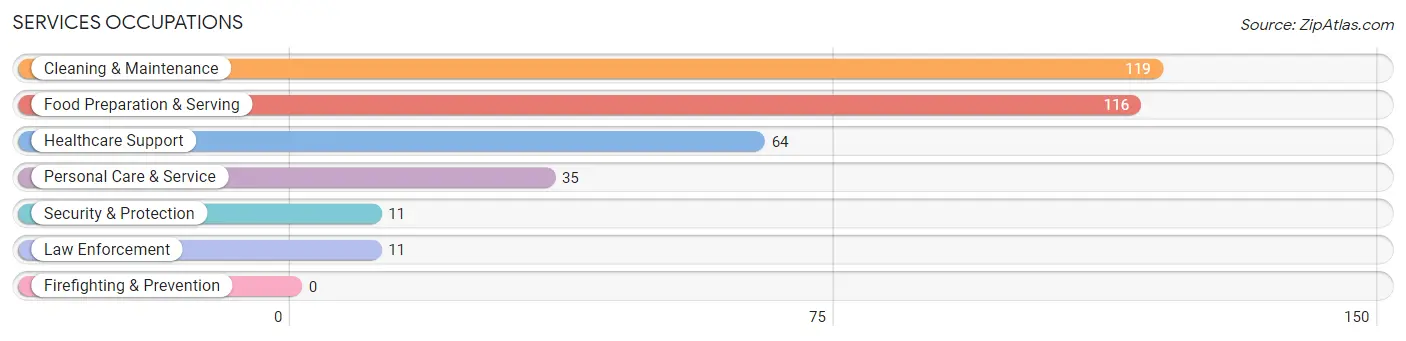
The most common Services occupations in Liberty are Cleaning & Maintenance (119 | 8.6%), Food Preparation & Serving (116 | 8.4%), Healthcare Support (64 | 4.6%), Personal Care & Service (35 | 2.5%), and Security & Protection (11 | 0.8%).
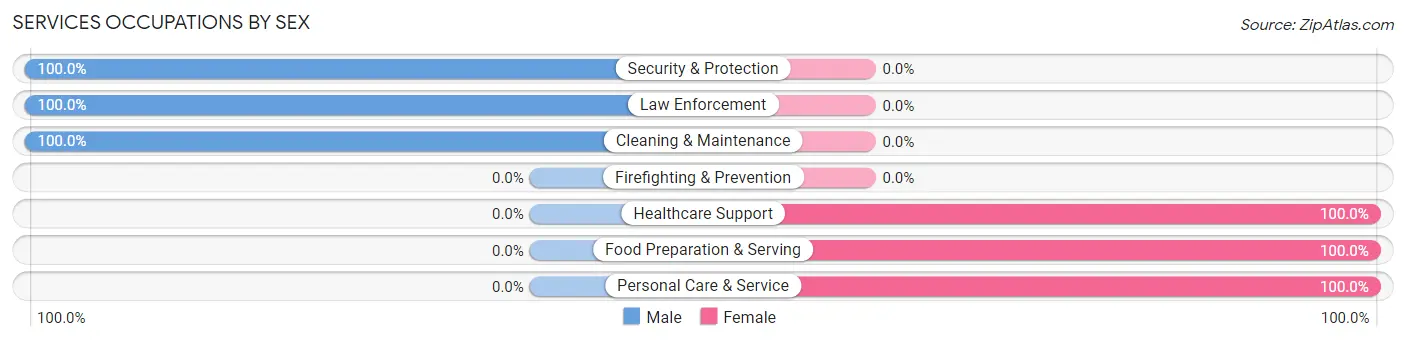
Services Occupations by Sex
Within the Services occupations in Liberty, the most male-oriented occupations are Security & Protection (100.0%), Law Enforcement (100.0%), and Cleaning & Maintenance (100.0%), while the most female-oriented occupations are Healthcare Support (100.0%), Food Preparation & Serving (100.0%), and Personal Care & Service (100.0%).
| Occupation | Male | Female |
| Healthcare Support | 0 (0.0%) | 64 (100.0%) |
| Security & Protection | 11 (100.0%) | 0 (0.0%) |
| Firefighting & Prevention | 0 (0.0%) | 0 (0.0%) |
| Law Enforcement | 11 (100.0%) | 0 (0.0%) |
| Food Preparation & Serving | 0 (0.0%) | 116 (100.0%) |
| Cleaning & Maintenance | 119 (100.0%) | 0 (0.0%) |
| Personal Care & Service | 0 (0.0%) | 35 (100.0%) |
| Total (Category) | 130 (37.7%) | 215 (62.3%) |
| Total (Overall) | 732 (52.8%) | 654 (47.2%) |
Sales and Office Occupations
The most common Sales and Office occupations in Liberty are Sales & Related (166 | 12.0%), and Office & Administration (131 | 9.5%).
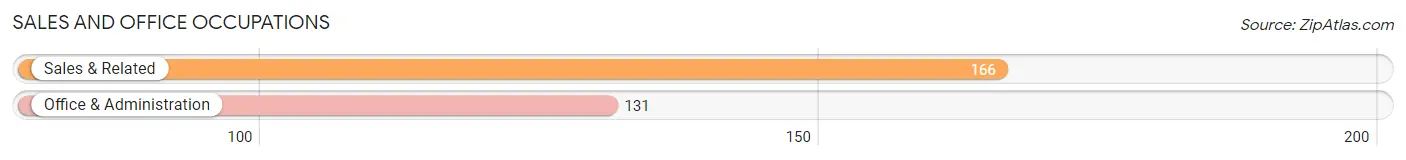
Sales and Office Occupations by Sex
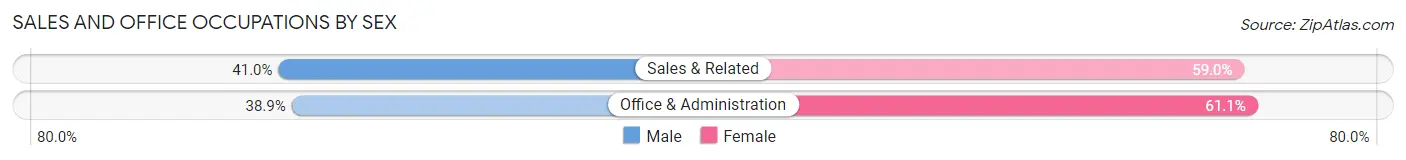
| Occupation | Male | Female |
| Sales & Related | 68 (41.0%) | 98 (59.0%) |
| Office & Administration | 51 (38.9%) | 80 (61.1%) |
| Total (Category) | 119 (40.1%) | 178 (59.9%) |
| Total (Overall) | 732 (52.8%) | 654 (47.2%) |
Natural Resources, Construction and Maintenance Occupations
The most common Natural Resources, Construction and Maintenance occupations in Liberty are Construction & Extraction (102 | 7.4%), and Installation, Maintenance & Repair (38 | 2.7%).
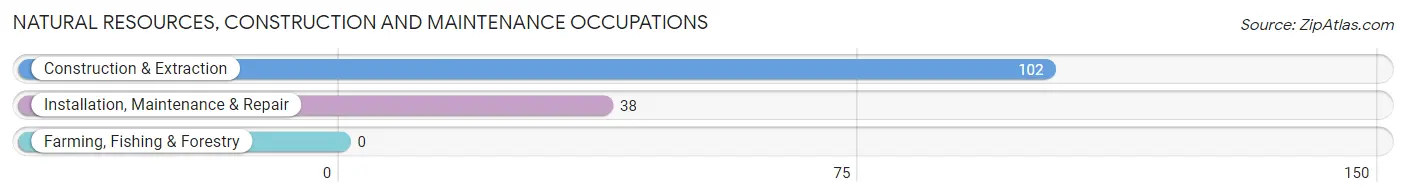
Natural Resources, Construction and Maintenance Occupations by Sex
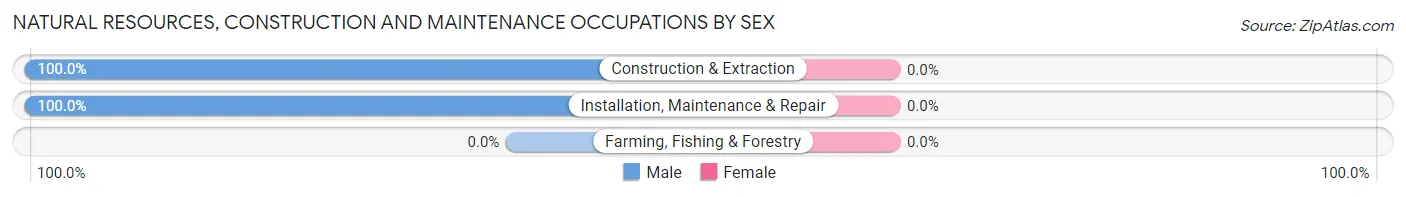
| Occupation | Male | Female |
| Farming, Fishing & Forestry | 0 (0.0%) | 0 (0.0%) |
| Construction & Extraction | 102 (100.0%) | 0 (0.0%) |
| Installation, Maintenance & Repair | 38 (100.0%) | 0 (0.0%) |
| Total (Category) | 140 (100.0%) | 0 (0.0%) |
| Total (Overall) | 732 (52.8%) | 654 (47.2%) |
Production, Transportation and Moving Occupations
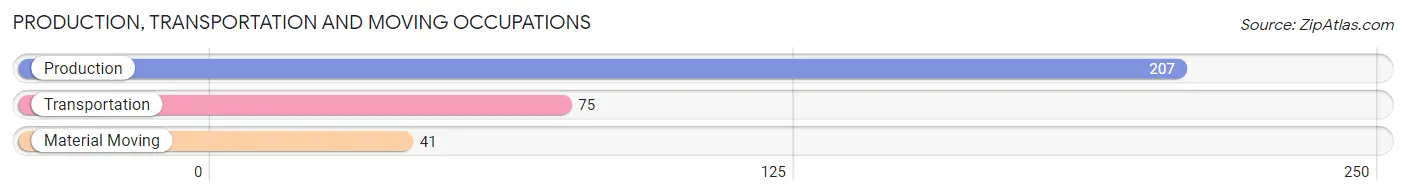
The most common Production, Transportation and Moving occupations in Liberty are Production (207 | 14.9%), Transportation (75 | 5.4%), and Material Moving (41 | 3.0%).
Production, Transportation and Moving Occupations by Sex
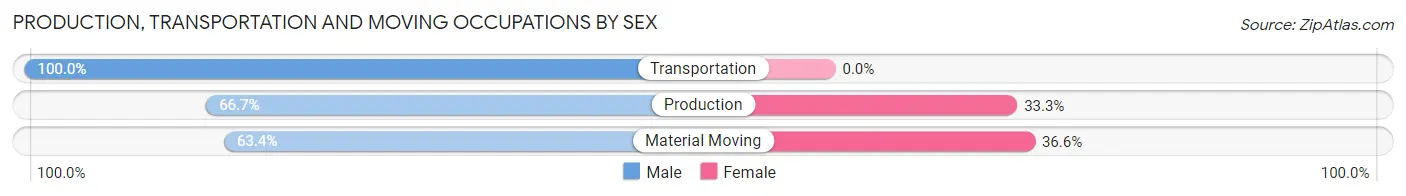
| Occupation | Male | Female |
| Production | 138 (66.7%) | 69 (33.3%) |
| Transportation | 75 (100.0%) | 0 (0.0%) |
| Material Moving | 26 (63.4%) | 15 (36.6%) |
| Total (Category) | 239 (74.0%) | 84 (26.0%) |
| Total (Overall) | 732 (52.8%) | 654 (47.2%) |
Employment Industries by Sex in Liberty
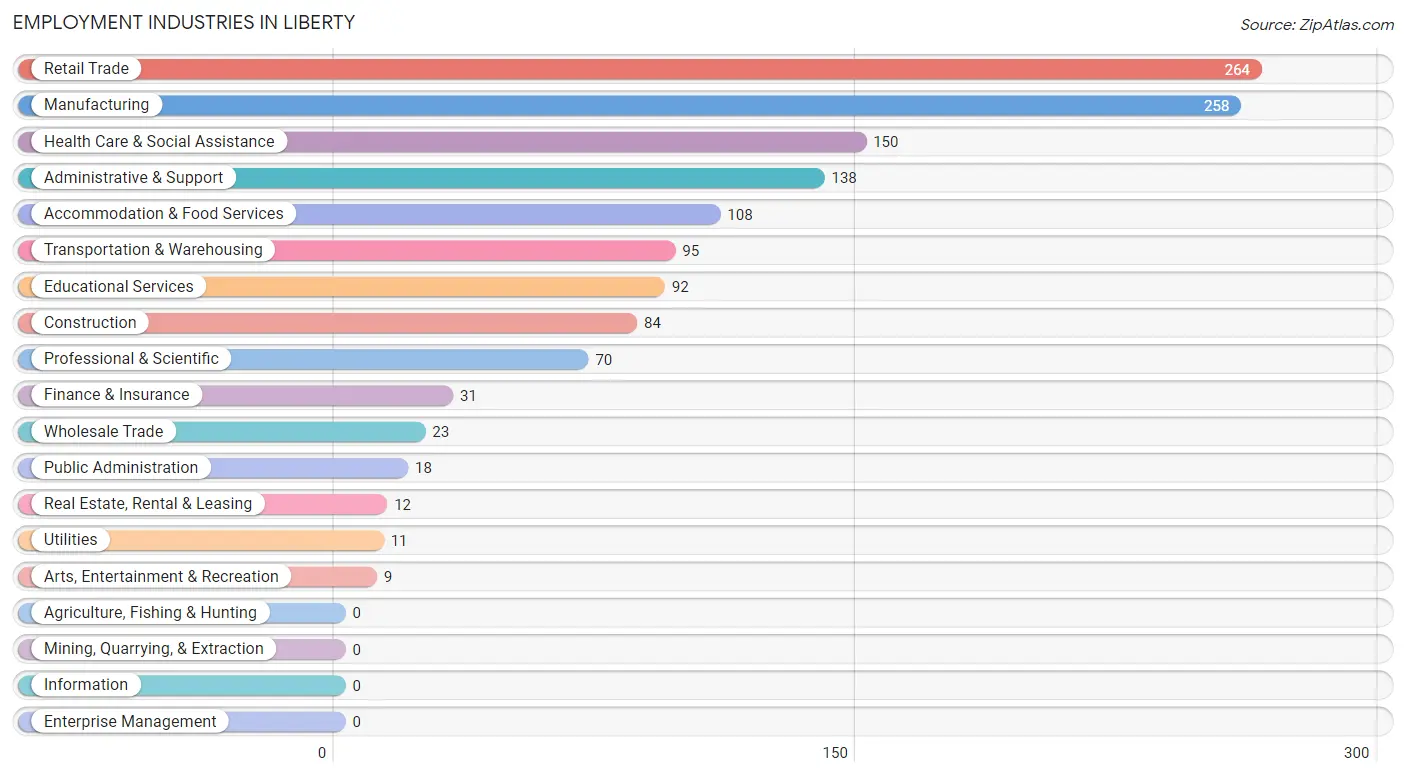
Employment Industries in Liberty
The major employment industries in Liberty include Retail Trade (264 | 19.1%), Manufacturing (258 | 18.6%), Health Care & Social Assistance (150 | 10.8%), Administrative & Support (138 | 10.0%), and Accommodation & Food Services (108 | 7.8%).
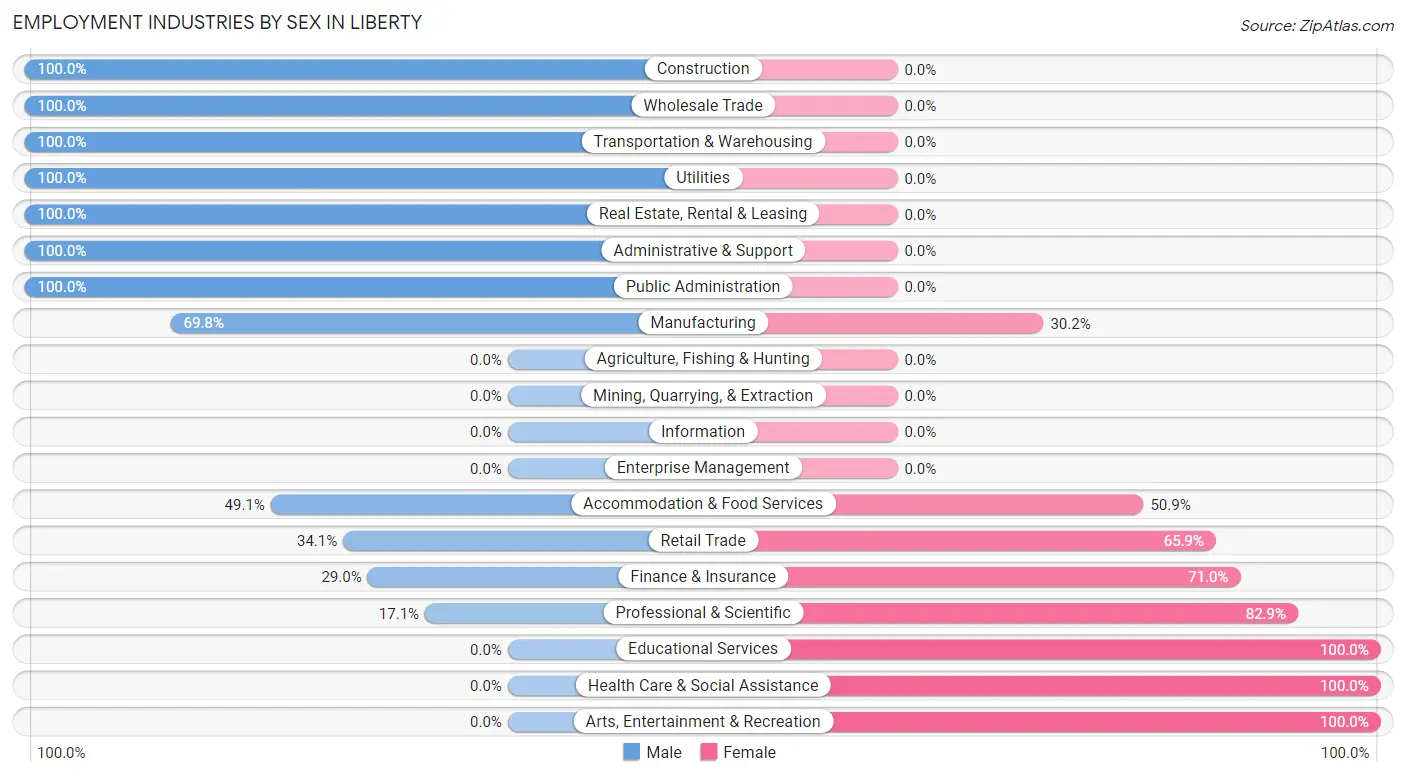
Employment Industries by Sex in Liberty
The Liberty industries that see more men than women are Construction (100.0%), Wholesale Trade (100.0%), and Transportation & Warehousing (100.0%), whereas the industries that tend to have a higher number of women are Educational Services (100.0%), Health Care & Social Assistance (100.0%), and Arts, Entertainment & Recreation (100.0%).
| Industry | Male | Female |
| Agriculture, Fishing & Hunting | 0 (0.0%) | 0 (0.0%) |
| Mining, Quarrying, & Extraction | 0 (0.0%) | 0 (0.0%) |
| Construction | 84 (100.0%) | 0 (0.0%) |
| Manufacturing | 180 (69.8%) | 78 (30.2%) |
| Wholesale Trade | 23 (100.0%) | 0 (0.0%) |
| Retail Trade | 90 (34.1%) | 174 (65.9%) |
| Transportation & Warehousing | 95 (100.0%) | 0 (0.0%) |
| Utilities | 11 (100.0%) | 0 (0.0%) |
| Information | 0 (0.0%) | 0 (0.0%) |
| Finance & Insurance | 9 (29.0%) | 22 (71.0%) |
| Real Estate, Rental & Leasing | 12 (100.0%) | 0 (0.0%) |
| Professional & Scientific | 12 (17.1%) | 58 (82.9%) |
| Enterprise Management | 0 (0.0%) | 0 (0.0%) |
| Administrative & Support | 138 (100.0%) | 0 (0.0%) |
| Educational Services | 0 (0.0%) | 92 (100.0%) |
| Health Care & Social Assistance | 0 (0.0%) | 150 (100.0%) |
| Arts, Entertainment & Recreation | 0 (0.0%) | 9 (100.0%) |
| Accommodation & Food Services | 53 (49.1%) | 55 (50.9%) |
| Public Administration | 18 (100.0%) | 0 (0.0%) |
| Total | 732 (52.8%) | 654 (47.2%) |
Education in Liberty
School Enrollment in Liberty
The most common levels of schooling among the 963 students in Liberty are elementary school (372 | 38.6%), middle school (225 | 23.4%), and high school (158 | 16.4%).
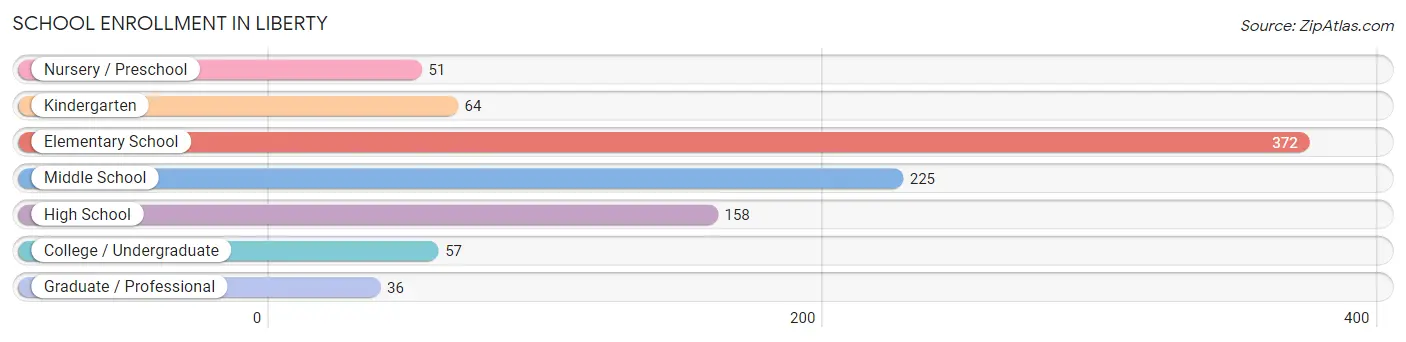
| School Level | # Students | % Students |
| Nursery / Preschool | 51 | 5.3% |
| Kindergarten | 64 | 6.7% |
| Elementary School | 372 | 38.6% |
| Middle School | 225 | 23.4% |
| High School | 158 | 16.4% |
| College / Undergraduate | 57 | 5.9% |
| Graduate / Professional | 36 | 3.7% |
| Total | 963 | 100.0% |
School Enrollment by Age by Funding Source in Liberty
Out of a total of 963 students who are enrolled in schools in Liberty, 33 (3.4%) attend a private institution, while the remaining 930 (96.6%) are enrolled in public schools. The age group of 35 years and over has the highest likelihood of being enrolled in private schools, with 10 (13.7% in the age bracket) enrolled. Conversely, the age group of 3 to 4 year olds has the lowest likelihood of being enrolled in a private school, with 51 (100.0% in the age bracket) attending a public institution.
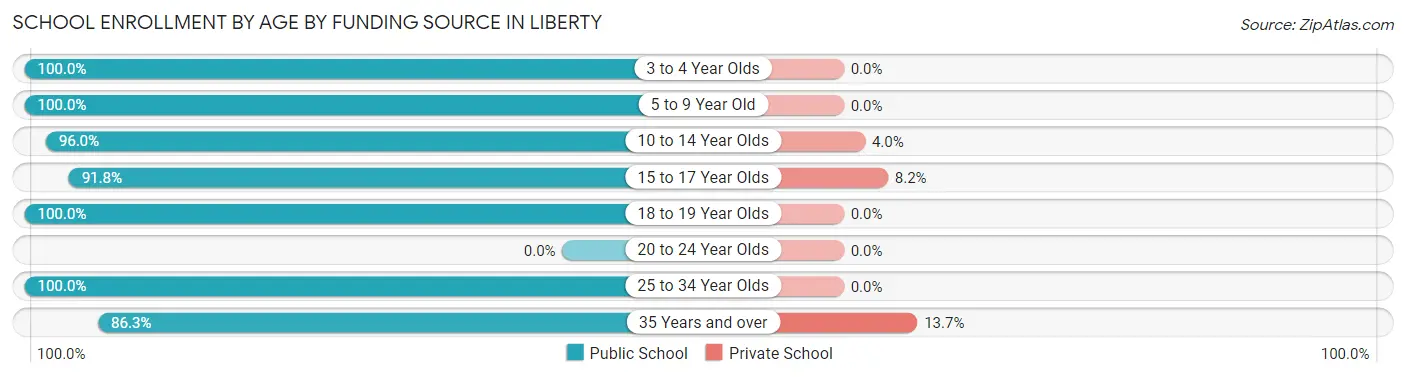
| Age Bracket | Public School | Private School |
| 3 to 4 Year Olds | 51 (100.0%) | 0 (0.0%) |
| 5 to 9 Year Old | 409 (100.0%) | 0 (0.0%) |
| 10 to 14 Year Olds | 242 (96.0%) | 10 (4.0%) |
| 15 to 17 Year Olds | 145 (91.8%) | 13 (8.2%) |
| 18 to 19 Year Olds | 7 (100.0%) | 0 (0.0%) |
| 20 to 24 Year Olds | 0 (0.0%) | 0 (0.0%) |
| 25 to 34 Year Olds | 13 (100.0%) | 0 (0.0%) |
| 35 Years and over | 63 (86.3%) | 10 (13.7%) |
| Total | 930 (96.6%) | 33 (3.4%) |
Educational Attainment by Field of Study in Liberty
Business (86 | 22.3%), education (78 | 20.2%), visual & performing arts (59 | 15.3%), engineering (50 | 13.0%), and social sciences (35 | 9.1%) are the most common fields of study among 386 individuals in Liberty who have obtained a bachelor's degree or higher.
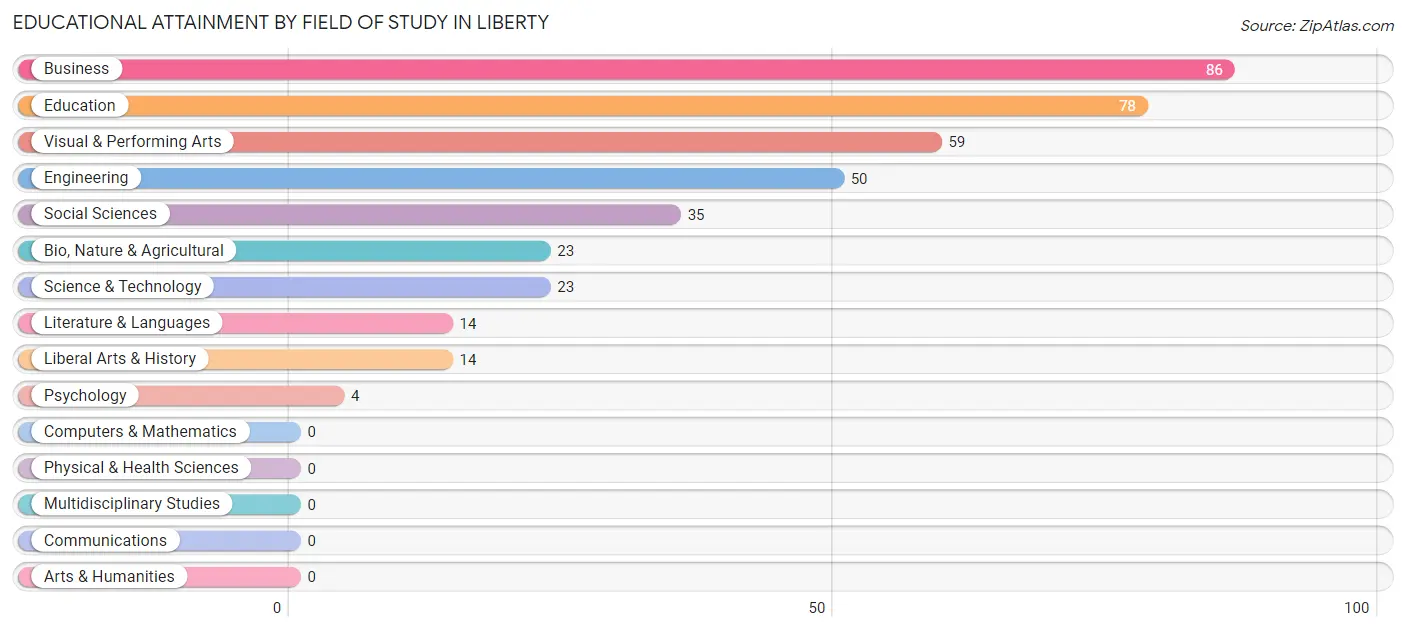
| Field of Study | # Graduates | % Graduates |
| Computers & Mathematics | 0 | 0.0% |
| Bio, Nature & Agricultural | 23 | 6.0% |
| Physical & Health Sciences | 0 | 0.0% |
| Psychology | 4 | 1.0% |
| Social Sciences | 35 | 9.1% |
| Engineering | 50 | 13.0% |
| Multidisciplinary Studies | 0 | 0.0% |
| Science & Technology | 23 | 6.0% |
| Business | 86 | 22.3% |
| Education | 78 | 20.2% |
| Literature & Languages | 14 | 3.6% |
| Liberal Arts & History | 14 | 3.6% |
| Visual & Performing Arts | 59 | 15.3% |
| Communications | 0 | 0.0% |
| Arts & Humanities | 0 | 0.0% |
| Total | 386 | 100.0% |
Transportation & Commute in Liberty
Vehicle Availability by Sex in Liberty
The most prevalent vehicle ownership categories in Liberty are males with 2 vehicles (322, accounting for 43.4%) and females with 2 vehicles (262, making up 49.2%).
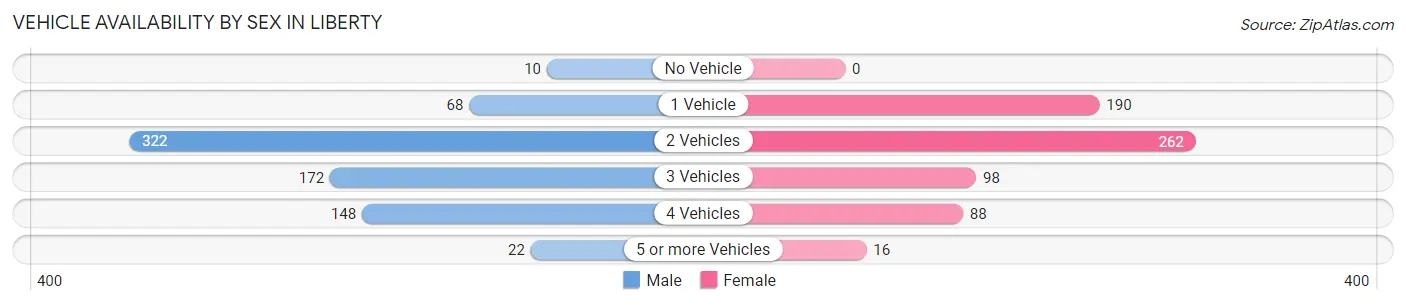
| Vehicles Available | Male | Female |
| No Vehicle | 10 (1.3%) | 0 (0.0%) |
| 1 Vehicle | 68 (9.2%) | 190 (29.0%) |
| 2 Vehicles | 322 (43.4%) | 262 (40.1%) |
| 3 Vehicles | 172 (23.2%) | 98 (15.0%) |
| 4 Vehicles | 148 (20.0%) | 88 (13.5%) |
| 5 or more Vehicles | 22 (3.0%) | 16 (2.5%) |
| Total | 742 (100.0%) | 654 (100.0%) |
Commute Time in Liberty
The most frequently occuring commute durations in Liberty are 30 to 34 minutes (226 commuters, 16.8%), 25 to 29 minutes (183 commuters, 13.6%), and 45 to 59 minutes (183 commuters, 13.6%).
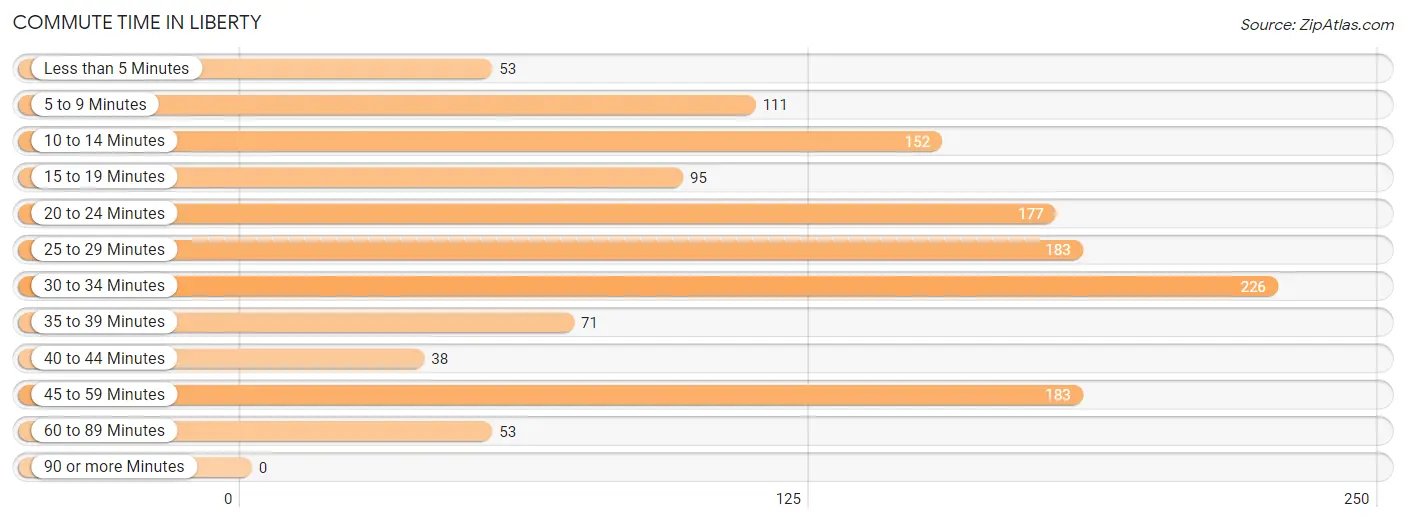
| Commute Time | # Commuters | % Commuters |
| Less than 5 Minutes | 53 | 4.0% |
| 5 to 9 Minutes | 111 | 8.3% |
| 10 to 14 Minutes | 152 | 11.3% |
| 15 to 19 Minutes | 95 | 7.1% |
| 20 to 24 Minutes | 177 | 13.2% |
| 25 to 29 Minutes | 183 | 13.6% |
| 30 to 34 Minutes | 226 | 16.8% |
| 35 to 39 Minutes | 71 | 5.3% |
| 40 to 44 Minutes | 38 | 2.8% |
| 45 to 59 Minutes | 183 | 13.6% |
| 60 to 89 Minutes | 53 | 4.0% |
| 90 or more Minutes | 0 | 0.0% |
Commute Time by Sex in Liberty
The most common commute times in Liberty are 30 to 34 minutes (181 commuters, 25.5%) for males and 10 to 14 minutes (134 commuters, 21.2%) for females.
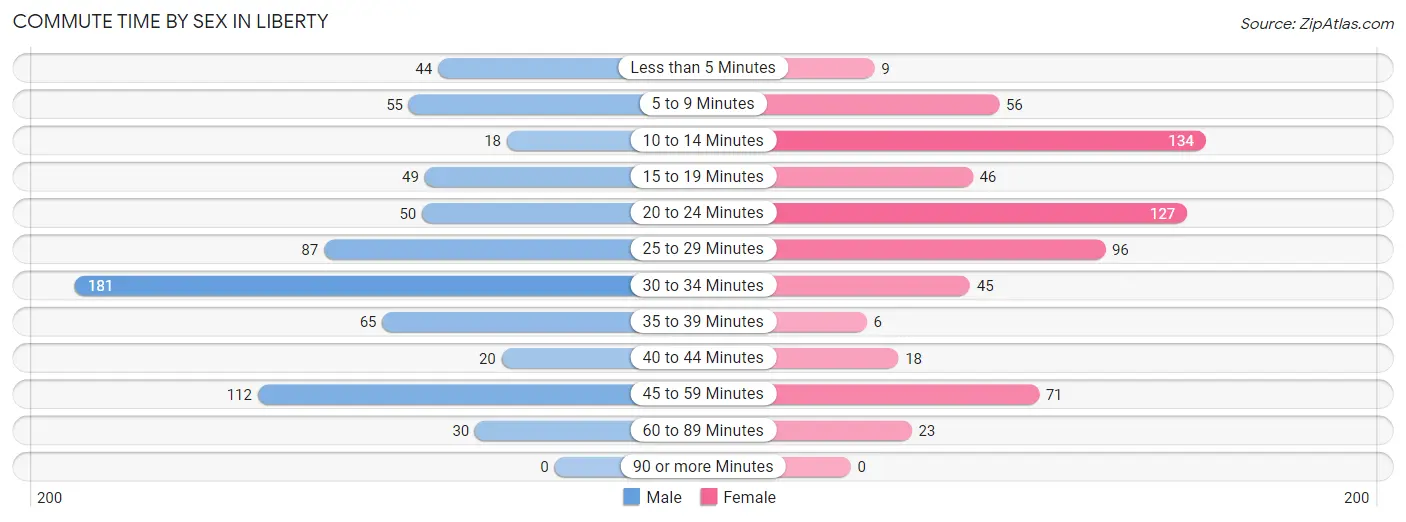
| Commute Time | Male | Female |
| Less than 5 Minutes | 44 (6.2%) | 9 (1.4%) |
| 5 to 9 Minutes | 55 (7.7%) | 56 (8.9%) |
| 10 to 14 Minutes | 18 (2.5%) | 134 (21.2%) |
| 15 to 19 Minutes | 49 (6.9%) | 46 (7.3%) |
| 20 to 24 Minutes | 50 (7.0%) | 127 (20.1%) |
| 25 to 29 Minutes | 87 (12.2%) | 96 (15.2%) |
| 30 to 34 Minutes | 181 (25.5%) | 45 (7.1%) |
| 35 to 39 Minutes | 65 (9.1%) | 6 (0.9%) |
| 40 to 44 Minutes | 20 (2.8%) | 18 (2.9%) |
| 45 to 59 Minutes | 112 (15.8%) | 71 (11.3%) |
| 60 to 89 Minutes | 30 (4.2%) | 23 (3.6%) |
| 90 or more Minutes | 0 (0.0%) | 0 (0.0%) |
Time of Departure to Work by Sex in Liberty
The most frequent times of departure to work in Liberty are 12:00 AM to 4:59 AM (137, 19.3%) for males and 7:00 AM to 7:29 AM (204, 32.3%) for females.
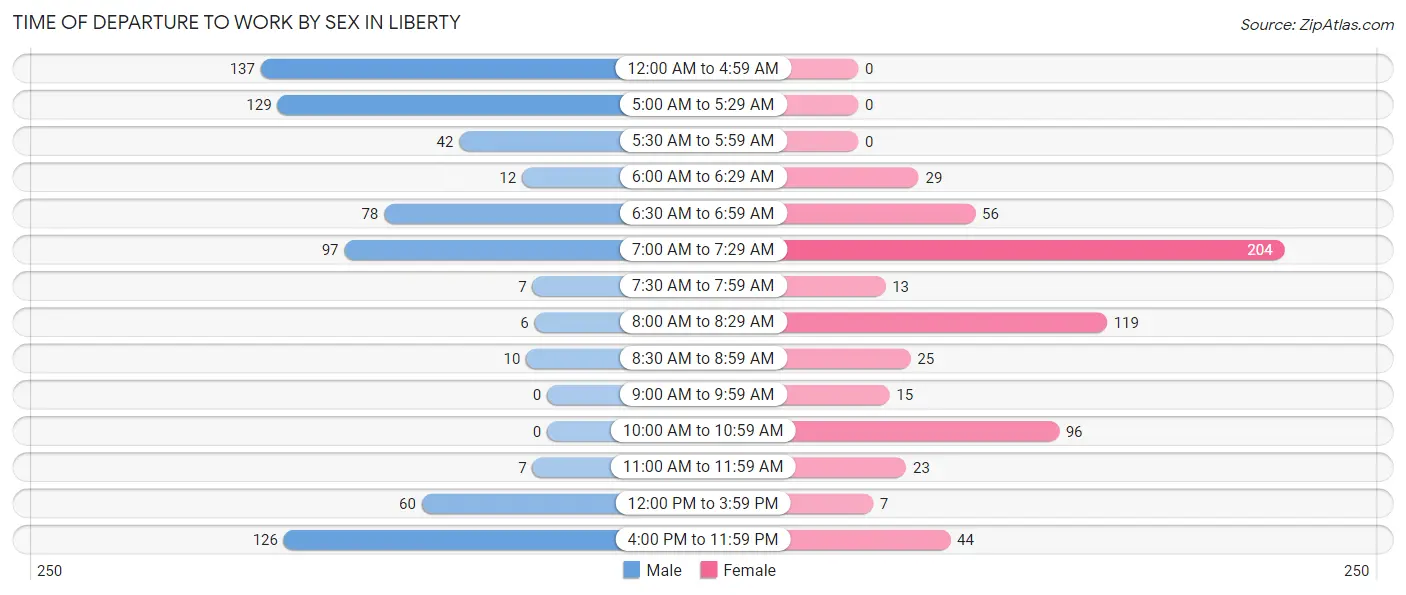
| Time of Departure | Male | Female |
| 12:00 AM to 4:59 AM | 137 (19.3%) | 0 (0.0%) |
| 5:00 AM to 5:29 AM | 129 (18.1%) | 0 (0.0%) |
| 5:30 AM to 5:59 AM | 42 (5.9%) | 0 (0.0%) |
| 6:00 AM to 6:29 AM | 12 (1.7%) | 29 (4.6%) |
| 6:30 AM to 6:59 AM | 78 (11.0%) | 56 (8.9%) |
| 7:00 AM to 7:29 AM | 97 (13.6%) | 204 (32.3%) |
| 7:30 AM to 7:59 AM | 7 (1.0%) | 13 (2.1%) |
| 8:00 AM to 8:29 AM | 6 (0.8%) | 119 (18.9%) |
| 8:30 AM to 8:59 AM | 10 (1.4%) | 25 (4.0%) |
| 9:00 AM to 9:59 AM | 0 (0.0%) | 15 (2.4%) |
| 10:00 AM to 10:59 AM | 0 (0.0%) | 96 (15.2%) |
| 11:00 AM to 11:59 AM | 7 (1.0%) | 23 (3.6%) |
| 12:00 PM to 3:59 PM | 60 (8.4%) | 7 (1.1%) |
| 4:00 PM to 11:59 PM | 126 (17.7%) | 44 (7.0%) |
| Total | 711 (100.0%) | 631 (100.0%) |
Housing Occupancy in Liberty
Occupancy by Ownership in Liberty
Of the total 1,254 dwellings in Liberty, owner-occupied units account for 910 (72.6%), while renter-occupied units make up 344 (27.4%).
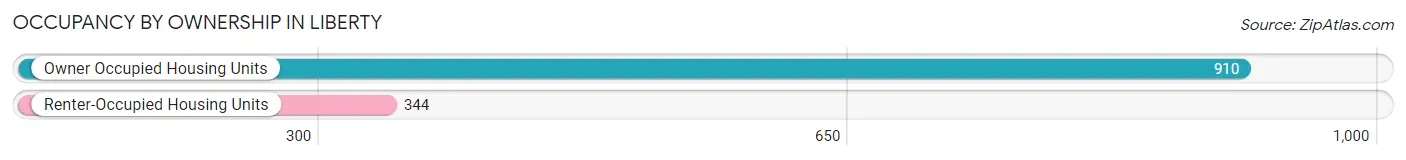
| Occupancy | # Housing Units | % Housing Units |
| Owner Occupied Housing Units | 910 | 72.6% |
| Renter-Occupied Housing Units | 344 | 27.4% |
| Total Occupied Housing Units | 1,254 | 100.0% |
Occupancy by Household Size in Liberty
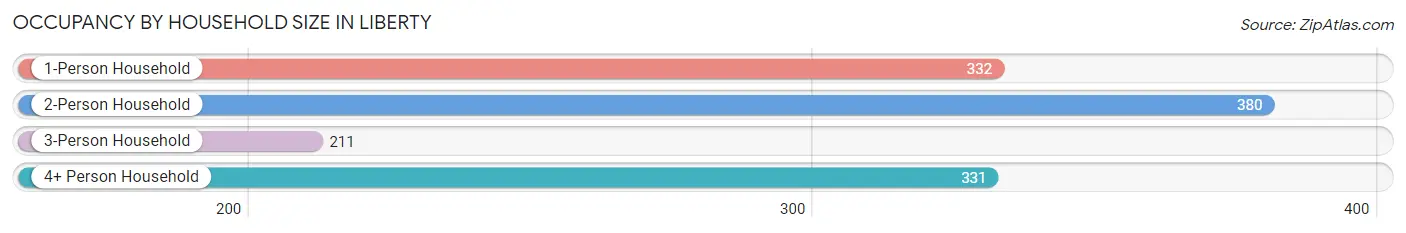
| Household Size | # Housing Units | % Housing Units |
| 1-Person Household | 332 | 26.5% |
| 2-Person Household | 380 | 30.3% |
| 3-Person Household | 211 | 16.8% |
| 4+ Person Household | 331 | 26.4% |
| Total Housing Units | 1,254 | 100.0% |
Occupancy by Ownership by Household Size in Liberty
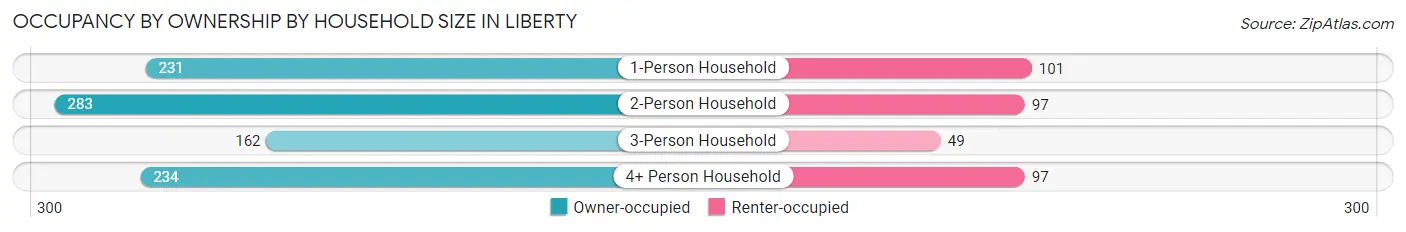
| Household Size | Owner-occupied | Renter-occupied |
| 1-Person Household | 231 (69.6%) | 101 (30.4%) |
| 2-Person Household | 283 (74.5%) | 97 (25.5%) |
| 3-Person Household | 162 (76.8%) | 49 (23.2%) |
| 4+ Person Household | 234 (70.7%) | 97 (29.3%) |
| Total Housing Units | 910 (72.6%) | 344 (27.4%) |
Occupancy by Educational Attainment in Liberty
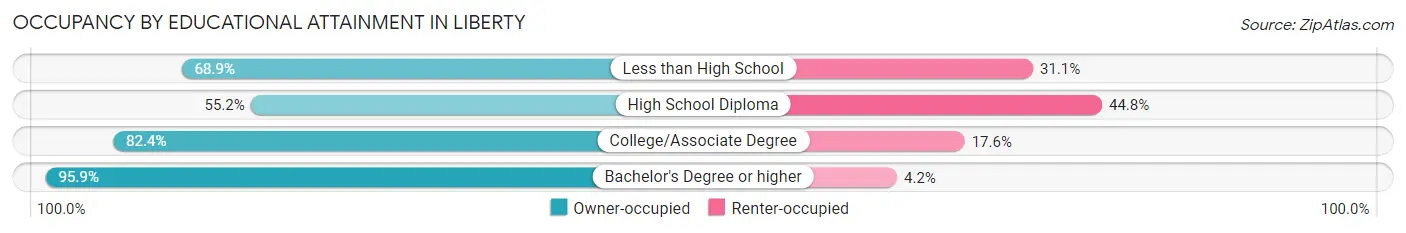
| Household Size | Owner-occupied | Renter-occupied |
| Less than High School | 93 (68.9%) | 42 (31.1%) |
| High School Diploma | 286 (55.2%) | 232 (44.8%) |
| College/Associate Degree | 277 (82.4%) | 59 (17.6%) |
| Bachelor's Degree or higher | 254 (95.9%) | 11 (4.2%) |
Occupancy by Age of Householder in Liberty
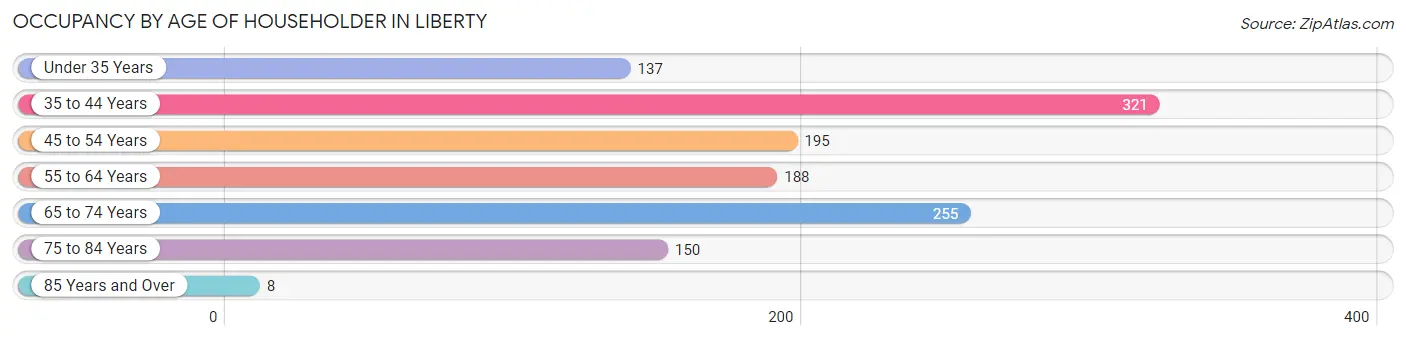
| Age Bracket | # Households | % Households |
| Under 35 Years | 137 | 10.9% |
| 35 to 44 Years | 321 | 25.6% |
| 45 to 54 Years | 195 | 15.5% |
| 55 to 64 Years | 188 | 15.0% |
| 65 to 74 Years | 255 | 20.3% |
| 75 to 84 Years | 150 | 12.0% |
| 85 Years and Over | 8 | 0.6% |
| Total | 1,254 | 100.0% |
Housing Finances in Liberty
Median Income by Occupancy in Liberty
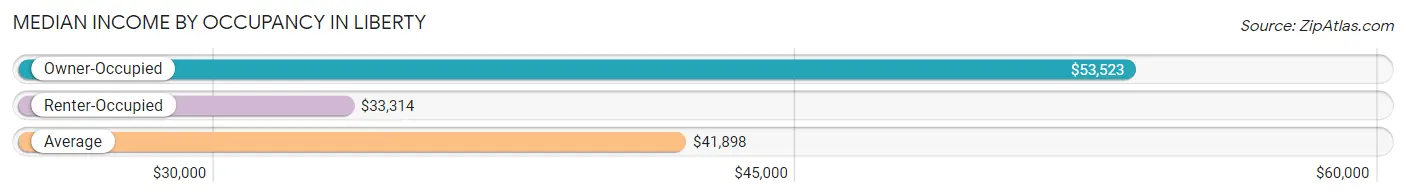
| Occupancy Type | # Households | Median Income |
| Owner-Occupied | 910 (72.6%) | $53,523 |
| Renter-Occupied | 344 (27.4%) | $33,314 |
| Average | 1,254 (100.0%) | $41,898 |
Occupancy by Householder Income Bracket in Liberty
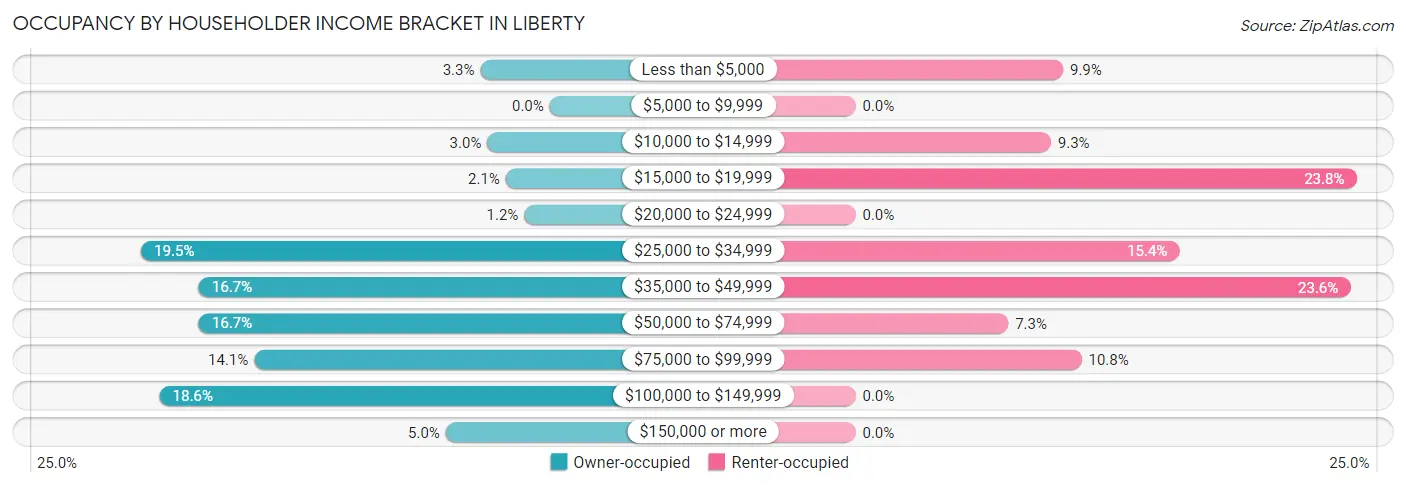
| Income Bracket | Owner-occupied | Renter-occupied |
| Less than $5,000 | 30 (3.3%) | 34 (9.9%) |
| $5,000 to $9,999 | 0 (0.0%) | 0 (0.0%) |
| $10,000 to $14,999 | 27 (3.0%) | 32 (9.3%) |
| $15,000 to $19,999 | 19 (2.1%) | 82 (23.8%) |
| $20,000 to $24,999 | 11 (1.2%) | 0 (0.0%) |
| $25,000 to $34,999 | 177 (19.5%) | 53 (15.4%) |
| $35,000 to $49,999 | 152 (16.7%) | 81 (23.5%) |
| $50,000 to $74,999 | 152 (16.7%) | 25 (7.3%) |
| $75,000 to $99,999 | 128 (14.1%) | 37 (10.8%) |
| $100,000 to $149,999 | 169 (18.6%) | 0 (0.0%) |
| $150,000 or more | 45 (5.0%) | 0 (0.0%) |
| Total | 910 (100.0%) | 344 (100.0%) |
Monthly Housing Cost Tiers in Liberty
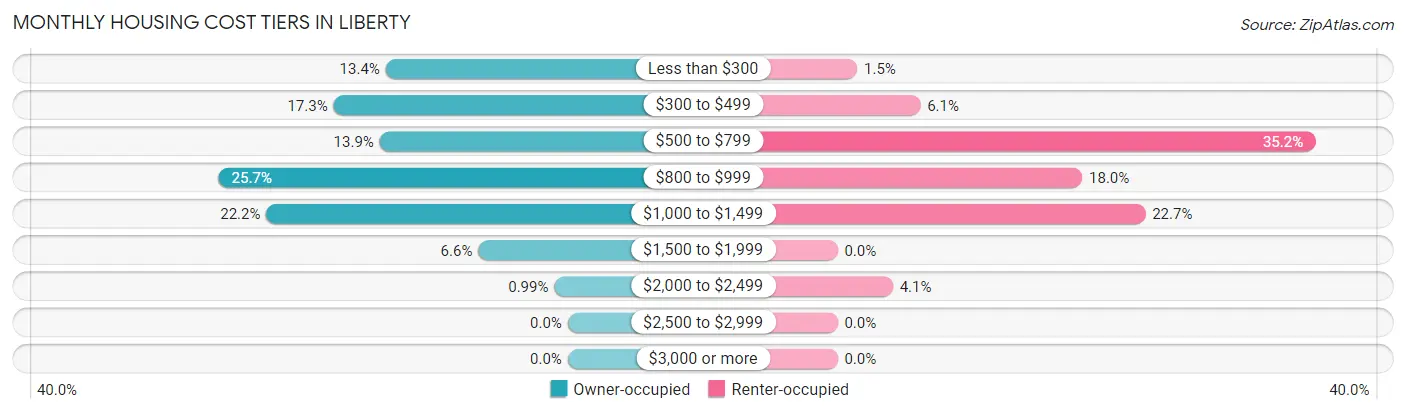
| Monthly Cost | Owner-occupied | Renter-occupied |
| Less than $300 | 122 (13.4%) | 5 (1.5%) |
| $300 to $499 | 157 (17.2%) | 21 (6.1%) |
| $500 to $799 | 126 (13.9%) | 121 (35.2%) |
| $800 to $999 | 234 (25.7%) | 62 (18.0%) |
| $1,000 to $1,499 | 202 (22.2%) | 78 (22.7%) |
| $1,500 to $1,999 | 60 (6.6%) | 0 (0.0%) |
| $2,000 to $2,499 | 9 (1.0%) | 14 (4.1%) |
| $2,500 to $2,999 | 0 (0.0%) | 0 (0.0%) |
| $3,000 or more | 0 (0.0%) | 0 (0.0%) |
| Total | 910 (100.0%) | 344 (100.0%) |
Physical Housing Characteristics in Liberty
Housing Structures in Liberty
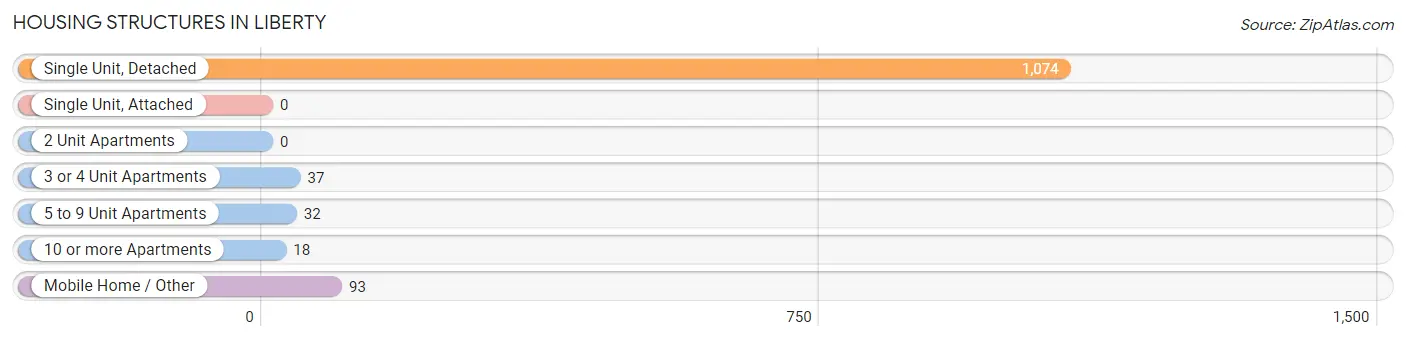
| Structure Type | # Housing Units | % Housing Units |
| Single Unit, Detached | 1,074 | 85.7% |
| Single Unit, Attached | 0 | 0.0% |
| 2 Unit Apartments | 0 | 0.0% |
| 3 or 4 Unit Apartments | 37 | 2.9% |
| 5 to 9 Unit Apartments | 32 | 2.5% |
| 10 or more Apartments | 18 | 1.4% |
| Mobile Home / Other | 93 | 7.4% |
| Total | 1,254 | 100.0% |
Housing Structures by Occupancy in Liberty
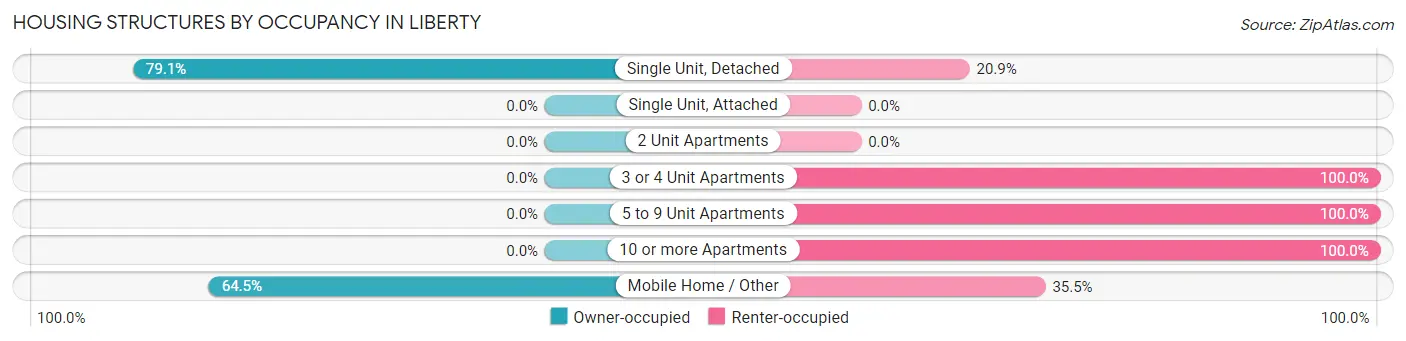
| Structure Type | Owner-occupied | Renter-occupied |
| Single Unit, Detached | 850 (79.1%) | 224 (20.9%) |
| Single Unit, Attached | 0 (0.0%) | 0 (0.0%) |
| 2 Unit Apartments | 0 (0.0%) | 0 (0.0%) |
| 3 or 4 Unit Apartments | 0 (0.0%) | 37 (100.0%) |
| 5 to 9 Unit Apartments | 0 (0.0%) | 32 (100.0%) |
| 10 or more Apartments | 0 (0.0%) | 18 (100.0%) |
| Mobile Home / Other | 60 (64.5%) | 33 (35.5%) |
| Total | 910 (72.6%) | 344 (27.4%) |
Housing Structures by Number of Rooms in Liberty
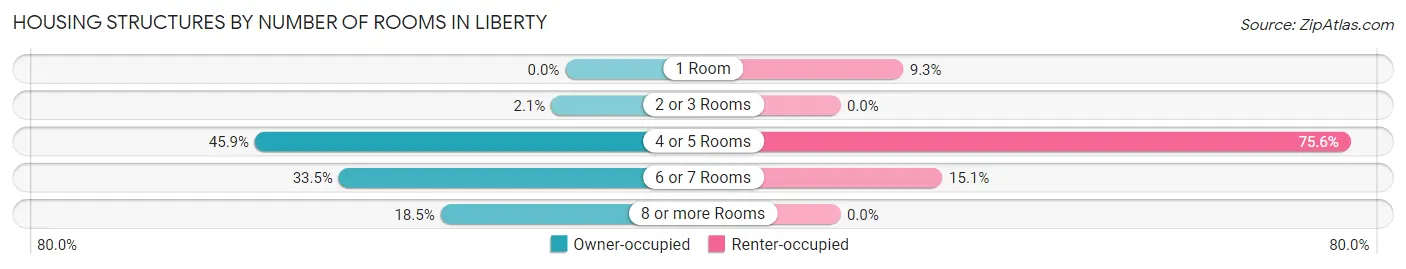
| Number of Rooms | Owner-occupied | Renter-occupied |
| 1 Room | 0 (0.0%) | 32 (9.3%) |
| 2 or 3 Rooms | 19 (2.1%) | 0 (0.0%) |
| 4 or 5 Rooms | 418 (45.9%) | 260 (75.6%) |
| 6 or 7 Rooms | 305 (33.5%) | 52 (15.1%) |
| 8 or more Rooms | 168 (18.5%) | 0 (0.0%) |
| Total | 910 (100.0%) | 344 (100.0%) |
Housing Structure by Heating Type in Liberty
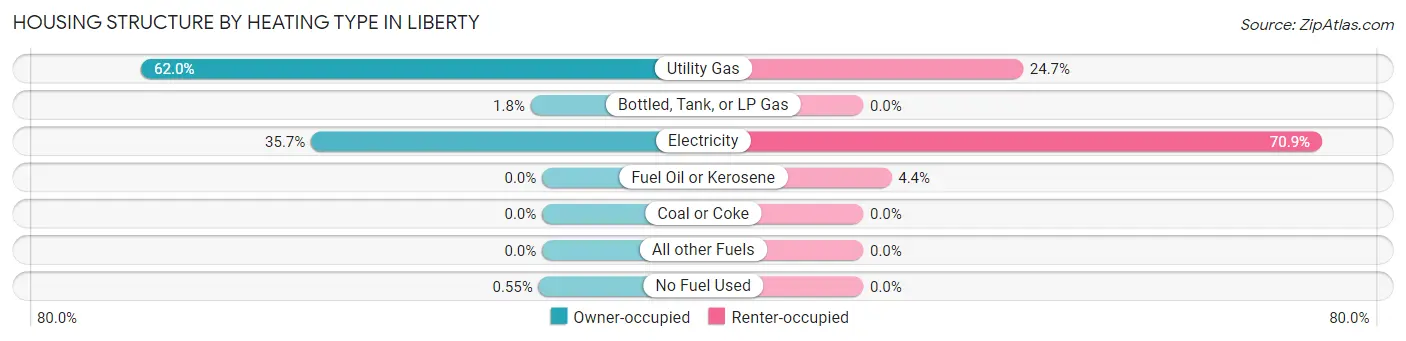
| Heating Type | Owner-occupied | Renter-occupied |
| Utility Gas | 564 (62.0%) | 85 (24.7%) |
| Bottled, Tank, or LP Gas | 16 (1.8%) | 0 (0.0%) |
| Electricity | 325 (35.7%) | 244 (70.9%) |
| Fuel Oil or Kerosene | 0 (0.0%) | 15 (4.4%) |
| Coal or Coke | 0 (0.0%) | 0 (0.0%) |
| All other Fuels | 0 (0.0%) | 0 (0.0%) |
| No Fuel Used | 5 (0.5%) | 0 (0.0%) |
| Total | 910 (100.0%) | 344 (100.0%) |
Household Vehicle Usage in Liberty
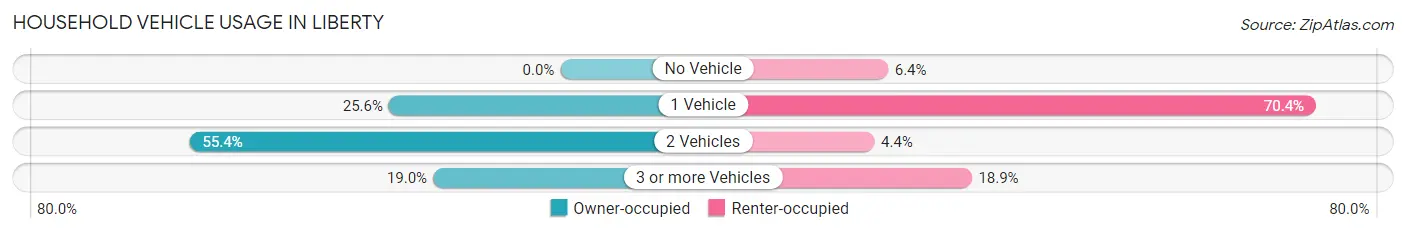
| Vehicles per Household | Owner-occupied | Renter-occupied |
| No Vehicle | 0 (0.0%) | 22 (6.4%) |
| 1 Vehicle | 233 (25.6%) | 242 (70.4%) |
| 2 Vehicles | 504 (55.4%) | 15 (4.4%) |
| 3 or more Vehicles | 173 (19.0%) | 65 (18.9%) |
| Total | 910 (100.0%) | 344 (100.0%) |
Real Estate & Mortgages in Liberty
Real Estate and Mortgage Overview in Liberty
| Characteristic | Without Mortgage | With Mortgage |
| Housing Units | 356 | 554 |
| Median Property Value | $134,000 | $172,100 |
| Median Household Income | $40,926 | $23 |
| Monthly Housing Costs | $384 | $0 |
| Real Estate Taxes | $586 | $0 |
Property Value by Mortgage Status in Liberty
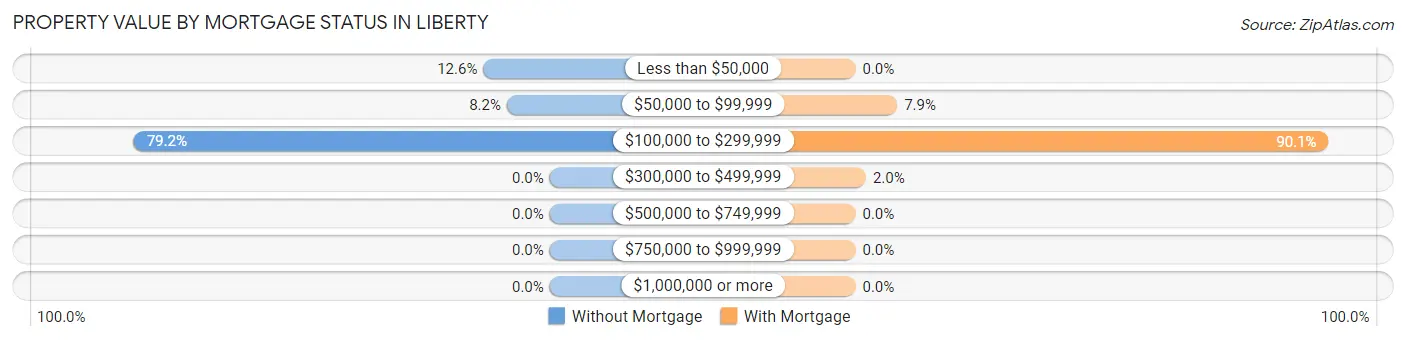
| Property Value | Without Mortgage | With Mortgage |
| Less than $50,000 | 45 (12.6%) | 0 (0.0%) |
| $50,000 to $99,999 | 29 (8.2%) | 44 (7.9%) |
| $100,000 to $299,999 | 282 (79.2%) | 499 (90.1%) |
| $300,000 to $499,999 | 0 (0.0%) | 11 (2.0%) |
| $500,000 to $749,999 | 0 (0.0%) | 0 (0.0%) |
| $750,000 to $999,999 | 0 (0.0%) | 0 (0.0%) |
| $1,000,000 or more | 0 (0.0%) | 0 (0.0%) |
| Total | 356 (100.0%) | 554 (100.0%) |
Household Income by Mortgage Status in Liberty
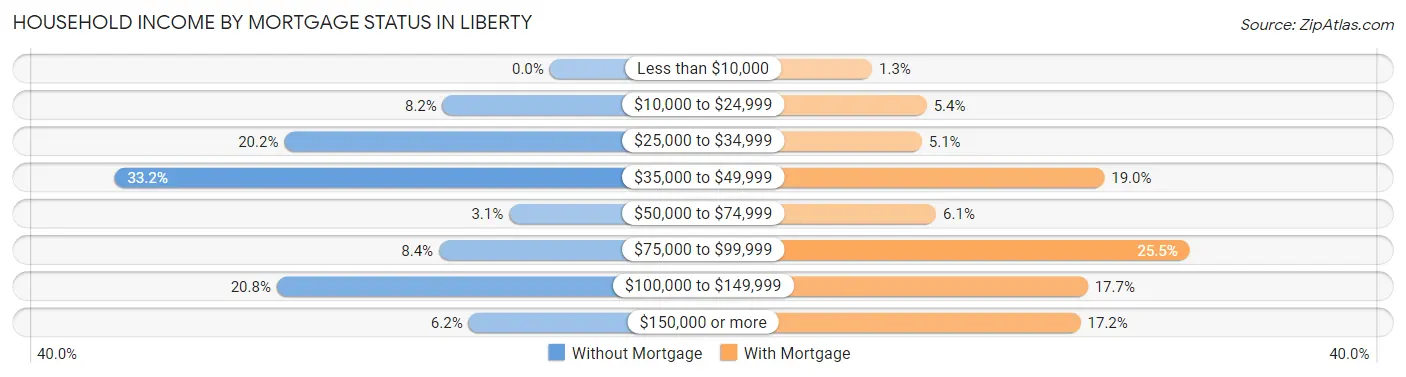
| Household Income | Without Mortgage | With Mortgage |
| Less than $10,000 | 0 (0.0%) | 7 (1.3%) |
| $10,000 to $24,999 | 29 (8.2%) | 30 (5.4%) |
| $25,000 to $34,999 | 72 (20.2%) | 28 (5.1%) |
| $35,000 to $49,999 | 118 (33.2%) | 105 (19.0%) |
| $50,000 to $74,999 | 11 (3.1%) | 34 (6.1%) |
| $75,000 to $99,999 | 30 (8.4%) | 141 (25.5%) |
| $100,000 to $149,999 | 74 (20.8%) | 98 (17.7%) |
| $150,000 or more | 22 (6.2%) | 95 (17.2%) |
| Total | 356 (100.0%) | 554 (100.0%) |
Property Value to Household Income Ratio in Liberty
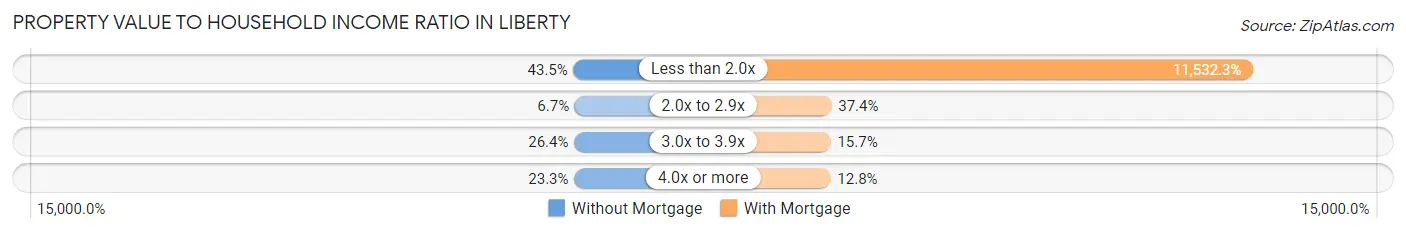
| Value-to-Income Ratio | Without Mortgage | With Mortgage |
| Less than 2.0x | 155 (43.5%) | 63,889 (11,532.3%) |
| 2.0x to 2.9x | 24 (6.7%) | 207 (37.4%) |
| 3.0x to 3.9x | 94 (26.4%) | 87 (15.7%) |
| 4.0x or more | 83 (23.3%) | 71 (12.8%) |
| Total | 356 (100.0%) | 554 (100.0%) |
Real Estate Taxes by Mortgage Status in Liberty
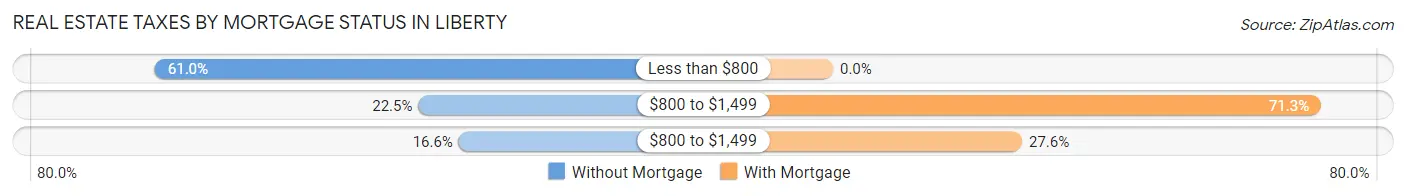
| Property Taxes | Without Mortgage | With Mortgage |
| Less than $800 | 217 (61.0%) | 0 (0.0%) |
| $800 to $1,499 | 80 (22.5%) | 395 (71.3%) |
| $800 to $1,499 | 59 (16.6%) | 153 (27.6%) |
| Total | 356 (100.0%) | 554 (100.0%) |
Health & Disability in Liberty
Health Insurance Coverage by Age in Liberty
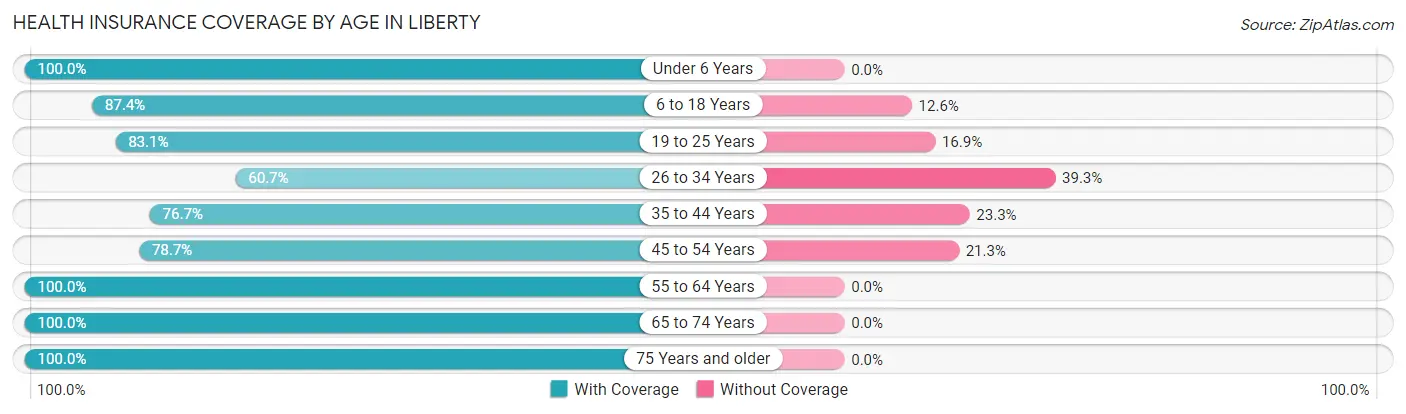
| Age Bracket | With Coverage | Without Coverage |
| Under 6 Years | 257 (100.0%) | 0 (0.0%) |
| 6 to 18 Years | 717 (87.4%) | 103 (12.6%) |
| 19 to 25 Years | 172 (83.1%) | 35 (16.9%) |
| 26 to 34 Years | 193 (60.7%) | 125 (39.3%) |
| 35 to 44 Years | 345 (76.7%) | 105 (23.3%) |
| 45 to 54 Years | 295 (78.7%) | 80 (21.3%) |
| 55 to 64 Years | 249 (100.0%) | 0 (0.0%) |
| 65 to 74 Years | 436 (100.0%) | 0 (0.0%) |
| 75 Years and older | 207 (100.0%) | 0 (0.0%) |
| Total | 2,871 (86.5%) | 448 (13.5%) |
Health Insurance Coverage by Citizenship Status in Liberty
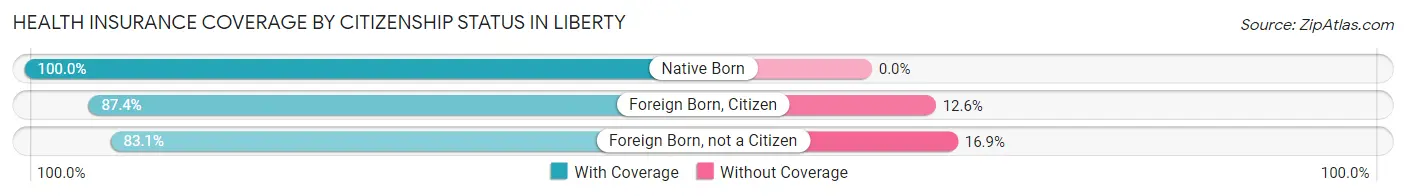
| Citizenship Status | With Coverage | Without Coverage |
| Native Born | 257 (100.0%) | 0 (0.0%) |
| Foreign Born, Citizen | 717 (87.4%) | 103 (12.6%) |
| Foreign Born, not a Citizen | 172 (83.1%) | 35 (16.9%) |
Health Insurance Coverage by Household Income in Liberty
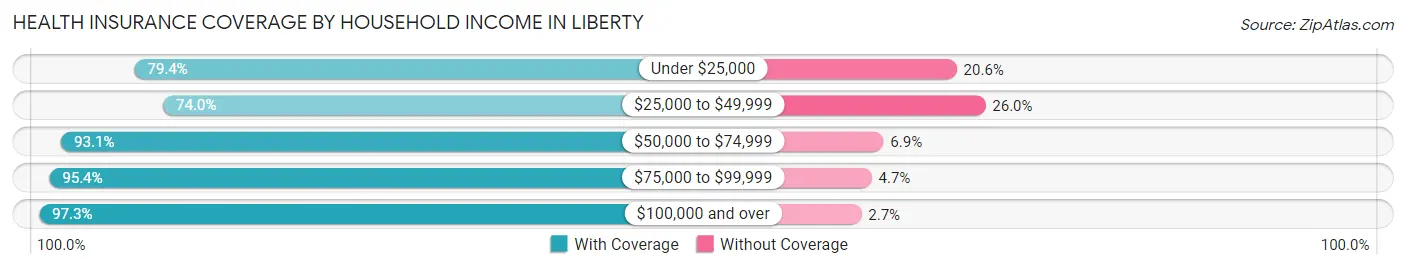
| Household Income | With Coverage | Without Coverage |
| Under $25,000 | 355 (79.4%) | 92 (20.6%) |
| $25,000 to $49,999 | 790 (74.0%) | 277 (26.0%) |
| $50,000 to $74,999 | 489 (93.1%) | 36 (6.9%) |
| $75,000 to $99,999 | 410 (95.4%) | 20 (4.6%) |
| $100,000 and over | 819 (97.3%) | 23 (2.7%) |
Public vs Private Health Insurance Coverage by Age in Liberty
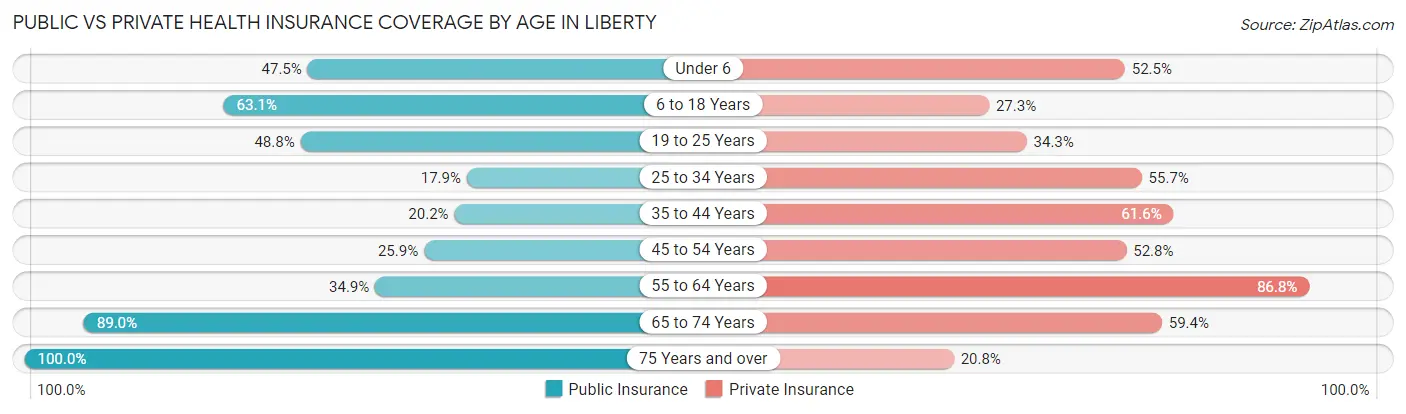
| Age Bracket | Public Insurance | Private Insurance |
| Under 6 | 122 (47.5%) | 135 (52.5%) |
| 6 to 18 Years | 517 (63.0%) | 224 (27.3%) |
| 19 to 25 Years | 101 (48.8%) | 71 (34.3%) |
| 25 to 34 Years | 57 (17.9%) | 177 (55.7%) |
| 35 to 44 Years | 91 (20.2%) | 277 (61.6%) |
| 45 to 54 Years | 97 (25.9%) | 198 (52.8%) |
| 55 to 64 Years | 87 (34.9%) | 216 (86.8%) |
| 65 to 74 Years | 388 (89.0%) | 259 (59.4%) |
| 75 Years and over | 207 (100.0%) | 43 (20.8%) |
| Total | 1,667 (50.2%) | 1,600 (48.2%) |
Disability Status by Sex by Age in Liberty
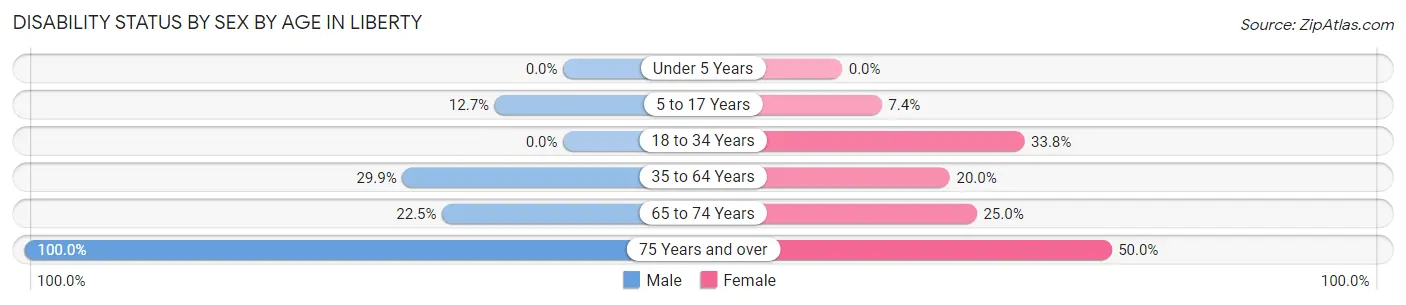
| Age Bracket | Male | Female |
| Under 5 Years | 0 (0.0%) | 0 (0.0%) |
| 5 to 17 Years | 71 (12.7%) | 20 (7.3%) |
| 18 to 34 Years | 0 (0.0%) | 134 (33.8%) |
| 35 to 64 Years | 152 (29.9%) | 113 (20.0%) |
| 65 to 74 Years | 62 (22.5%) | 40 (25.0%) |
| 75 Years and over | 83 (100.0%) | 62 (50.0%) |
Disability Class by Sex by Age in Liberty
Disability Class: Hearing Difficulty
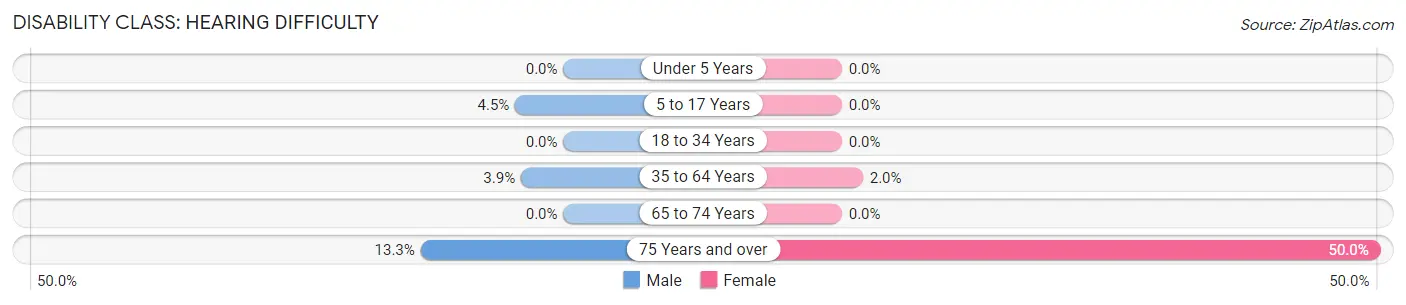
| Age Bracket | Male | Female |
| Under 5 Years | 0 (0.0%) | 0 (0.0%) |
| 5 to 17 Years | 25 (4.5%) | 0 (0.0%) |
| 18 to 34 Years | 0 (0.0%) | 0 (0.0%) |
| 35 to 64 Years | 20 (3.9%) | 11 (1.9%) |
| 65 to 74 Years | 0 (0.0%) | 0 (0.0%) |
| 75 Years and over | 11 (13.3%) | 62 (50.0%) |
Disability Class: Vision Difficulty
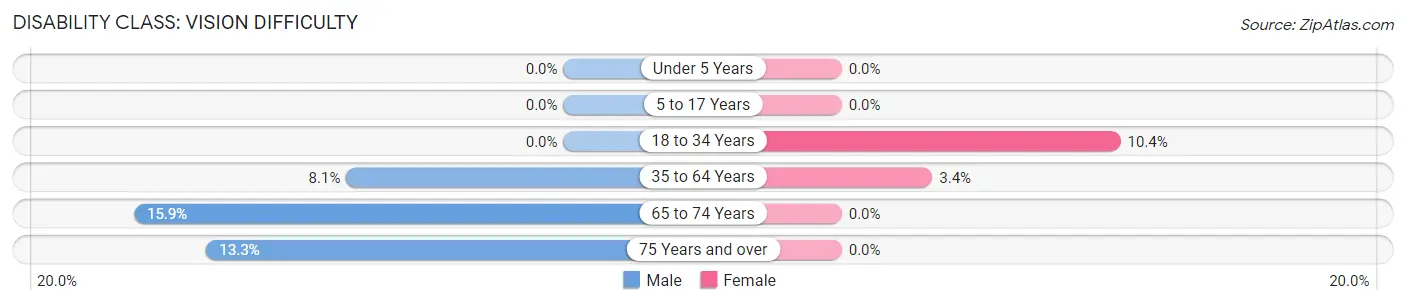
| Age Bracket | Male | Female |
| Under 5 Years | 0 (0.0%) | 0 (0.0%) |
| 5 to 17 Years | 0 (0.0%) | 0 (0.0%) |
| 18 to 34 Years | 0 (0.0%) | 41 (10.3%) |
| 35 to 64 Years | 41 (8.1%) | 19 (3.4%) |
| 65 to 74 Years | 44 (15.9%) | 0 (0.0%) |
| 75 Years and over | 11 (13.3%) | 0 (0.0%) |
Disability Class: Cognitive Difficulty
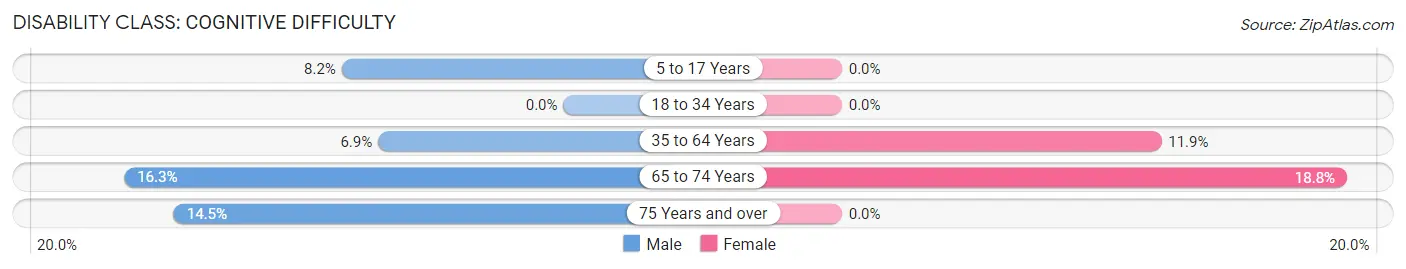
| Age Bracket | Male | Female |
| 5 to 17 Years | 46 (8.2%) | 0 (0.0%) |
| 18 to 34 Years | 0 (0.0%) | 0 (0.0%) |
| 35 to 64 Years | 35 (6.9%) | 67 (11.9%) |
| 65 to 74 Years | 45 (16.3%) | 30 (18.8%) |
| 75 Years and over | 12 (14.5%) | 0 (0.0%) |
Disability Class: Ambulatory Difficulty
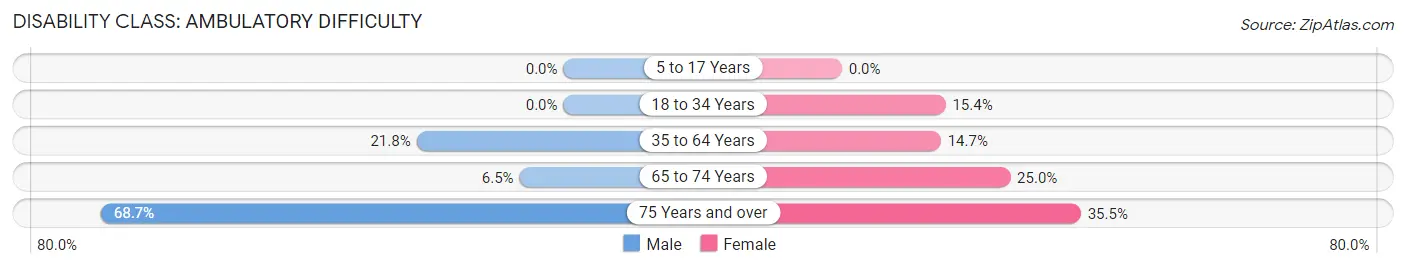
| Age Bracket | Male | Female |
| 5 to 17 Years | 0 (0.0%) | 0 (0.0%) |
| 18 to 34 Years | 0 (0.0%) | 61 (15.4%) |
| 35 to 64 Years | 111 (21.8%) | 83 (14.7%) |
| 65 to 74 Years | 18 (6.5%) | 40 (25.0%) |
| 75 Years and over | 57 (68.7%) | 44 (35.5%) |
Disability Class: Self-Care Difficulty
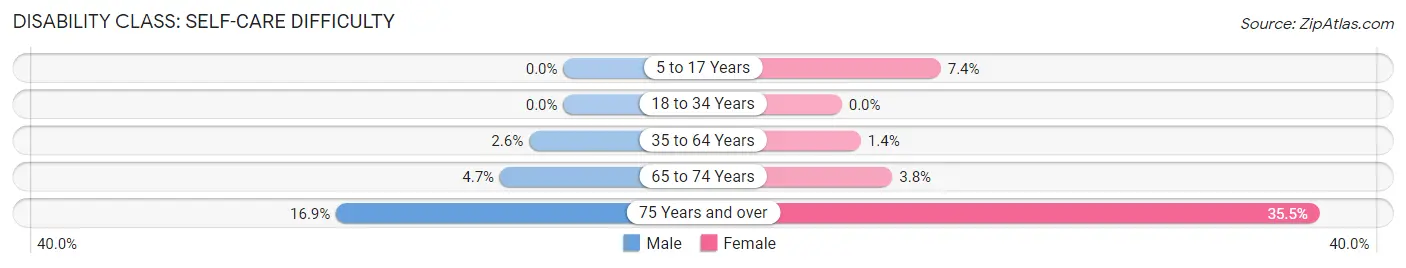
| Age Bracket | Male | Female |
| 5 to 17 Years | 0 (0.0%) | 20 (7.3%) |
| 18 to 34 Years | 0 (0.0%) | 0 (0.0%) |
| 35 to 64 Years | 13 (2.5%) | 8 (1.4%) |
| 65 to 74 Years | 13 (4.7%) | 6 (3.7%) |
| 75 Years and over | 14 (16.9%) | 44 (35.5%) |
Technology Access in Liberty
Computing Device Access in Liberty
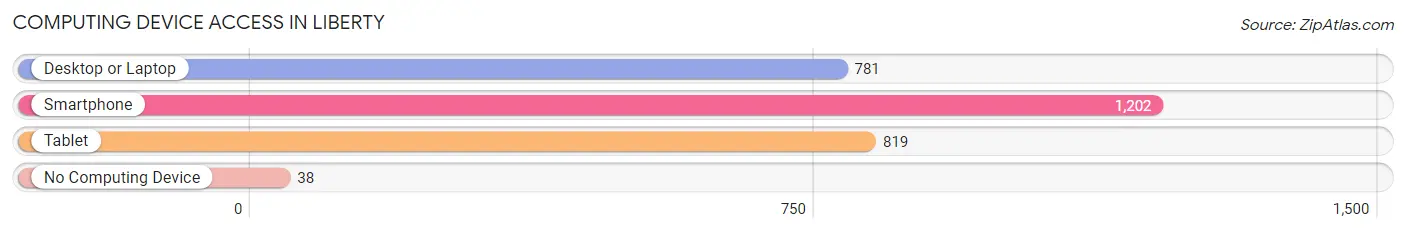
| Device Type | # Households | % Households |
| Desktop or Laptop | 781 | 62.3% |
| Smartphone | 1,202 | 95.9% |
| Tablet | 819 | 65.3% |
| No Computing Device | 38 | 3.0% |
| Total | 1,254 | 100.0% |
Internet Access in Liberty
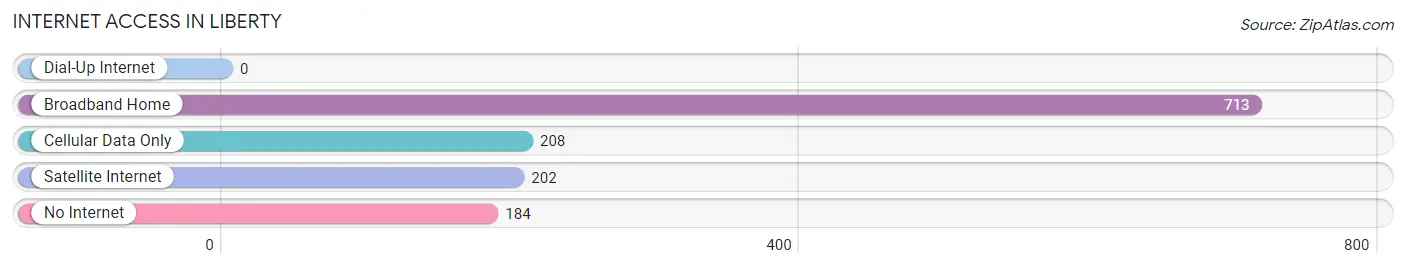
| Internet Type | # Households | % Households |
| Dial-Up Internet | 0 | 0.0% |
| Broadband Home | 713 | 56.9% |
| Cellular Data Only | 208 | 16.6% |
| Satellite Internet | 202 | 16.1% |
| No Internet | 184 | 14.7% |
| Total | 1,254 | 100.0% |
Liberty Summary
Liberty, South Carolina is a small town located in Pickens County, South Carolina. It is situated in the foothills of the Blue Ridge Mountains, approximately 30 miles from Greenville, South Carolina. The town has a population of approximately 2,000 people and is known for its small-town charm and friendly atmosphere.
Geography
Liberty is located in the foothills of the Blue Ridge Mountains, approximately 30 miles from Greenville, South Carolina. The town is situated in a valley surrounded by rolling hills and mountains. The town is located on the banks of the Keowee River, which is a popular spot for fishing and boating. The town is also home to several parks and recreational areas, including the Liberty City Park, which features a playground, picnic area, and walking trails.
Economy
The economy of Liberty is largely based on agriculture and manufacturing. The town is home to several farms, which produce a variety of crops, including corn, soybeans, and wheat. The town is also home to several manufacturing companies, which produce a variety of products, including furniture, textiles, and automotive parts.
Demographics
As of the 2010 census, the population of Liberty was 2,000 people. The racial makeup of the town was 95.2% White, 1.7% African American, 0.3% Native American, 0.3% Asian, 0.1% Pacific Islander, and 2.4% from other races. The median household income in Liberty was $35,000, and the median family income was $41,000.
History
Liberty was founded in 1820 by a group of settlers from North Carolina. The town was originally named Libertyville, but the name was changed to Liberty in 1821. The town was incorporated in 1822 and has remained a small, rural community ever since. The town was an important stop on the stagecoach route between Greenville and Asheville, North Carolina. The town was also home to several mills, which produced flour, lumber, and other products.
Today, Liberty is a small, rural town with a population of approximately 2,000 people. The town is known for its small-town charm and friendly atmosphere. The town is home to several parks and recreational areas, and is a popular spot for fishing and boating. The town is also home to several manufacturing companies, which produce a variety of products, including furniture, textiles, and automotive parts.
Common Questions
What is Per Capita Income in Liberty?
Per Capita income in Liberty is $27,634.
What is the Median Family Income in Liberty?
Median Family Income in Liberty is $52,756.
What is the Median Household income in Liberty?
Median Household Income in Liberty is $41,898.
What is Income or Wage Gap in Liberty?
Income or Wage Gap in Liberty is 58.3%.
Women in Liberty earn 41.7 cents for every dollar earned by a man.
What is Inequality or Gini Index in Liberty?
Inequality or Gini Index in Liberty is 0.49.
What is the Total Population of Liberty?
Total Population of Liberty is 3,329.
What is the Total Male Population of Liberty?
Total Male Population of Liberty is 1,696.
What is the Total Female Population of Liberty?
Total Female Population of Liberty is 1,633.
What is the Ratio of Males per 100 Females in Liberty?
There are 103.86 Males per 100 Females in Liberty.
What is the Ratio of Females per 100 Males in Liberty?
There are 96.29 Females per 100 Males in Liberty.
What is the Median Population Age in Liberty?
Median Population Age in Liberty is 36.4 Years.
What is the Average Family Size in Liberty
Average Family Size in Liberty is 3.2 People.
What is the Average Household Size in Liberty
Average Household Size in Liberty is 2.6 People.
How Large is the Labor Force in Liberty?
There are 1,552 People in the Labor Forcein in Liberty.
What is the Percentage of People in the Labor Force in Liberty?
65.1% of People are in the Labor Force in Liberty.
What is the Unemployment Rate in Liberty?
Unemployment Rate in Liberty is 10.2%.