Landrum, SC Map & Demographics
Landrum Map
Landrum Overview
$28,182
PER CAPITA INCOME
$67,188
AVG FAMILY INCOME
$41,414
AVG HOUSEHOLD INCOME
32.9%
WAGE / INCOME GAP [ % ]
67.1¢/ $1
WAGE / INCOME GAP [ $ ]
0.47
INEQUALITY / GINI INDEX
2,504
TOTAL POPULATION
1,123
MALE POPULATION
1,381
FEMALE POPULATION
81.32
MALES / 100 FEMALES
122.97
FEMALES / 100 MALES
49.1
MEDIAN AGE
2.7
AVG FAMILY SIZE
1.9
AVG HOUSEHOLD SIZE
1,081
LABOR FORCE [ PEOPLE ]
51.6%
PERCENT IN LABOR FORCE
4.2%
UNEMPLOYMENT RATE
Landrum Zip Codes
Landrum Area Codes
Income in Landrum
Income Overview in Landrum
Per Capita Income in Landrum is $28,182, while median incomes of families and households are $67,188 and $41,414 respectively.
| Characteristic | Number | Measure |
| Per Capita Income | 2,504 | $28,182 |
| Median Family Income | 660 | $67,188 |
| Mean Family Income | 660 | $77,481 |
| Median Household Income | 1,293 | $41,414 |
| Mean Household Income | 1,293 | $53,827 |
| Income Deficit | 660 | $0 |
| Wage / Income Gap (%) | 2,504 | 32.93% |
| Wage / Income Gap ($) | 2,504 | 67.07¢ per $1 |
| Gini / Inequality Index | 2,504 | 0.47 |
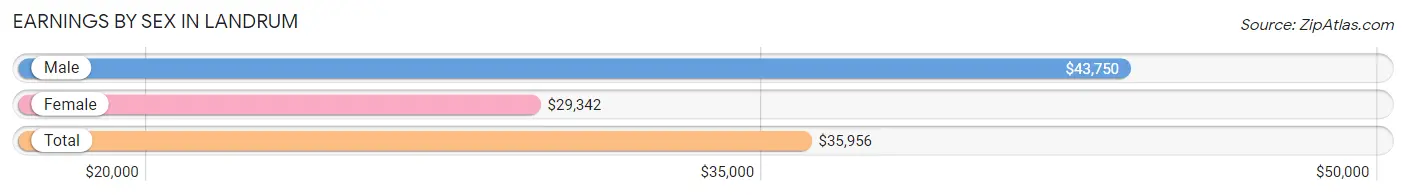
Earnings by Sex in Landrum
Average Earnings in Landrum are $35,956, $43,750 for men and $29,342 for women, a difference of 32.9%.
| Sex | Number | Average Earnings |
| Male | 586 (51.5%) | $43,750 |
| Female | 552 (48.5%) | $29,342 |
| Total | 1,138 (100.0%) | $35,956 |
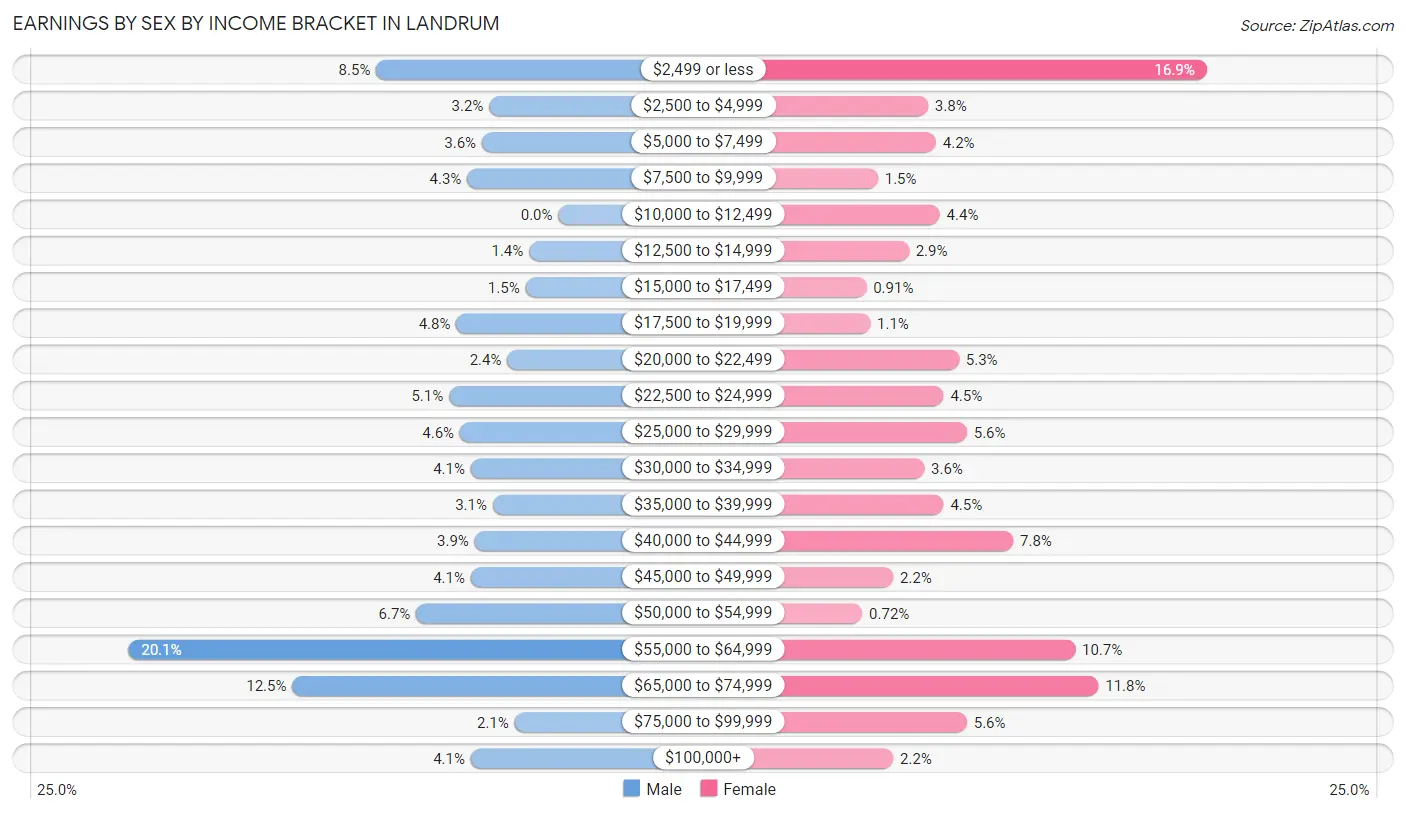
Earnings by Sex by Income Bracket in Landrum
The most common earnings brackets in Landrum are $55,000 to $64,999 for men (118 | 20.1%) and $2,499 or less for women (93 | 16.9%).
| Income | Male | Female |
| $2,499 or less | 50 (8.5%) | 93 (16.9%) |
| $2,500 to $4,999 | 19 (3.2%) | 21 (3.8%) |
| $5,000 to $7,499 | 21 (3.6%) | 23 (4.2%) |
| $7,500 to $9,999 | 25 (4.3%) | 8 (1.5%) |
| $10,000 to $12,499 | 0 (0.0%) | 24 (4.3%) |
| $12,500 to $14,999 | 8 (1.4%) | 16 (2.9%) |
| $15,000 to $17,499 | 9 (1.5%) | 5 (0.9%) |
| $17,500 to $19,999 | 28 (4.8%) | 6 (1.1%) |
| $20,000 to $22,499 | 14 (2.4%) | 29 (5.2%) |
| $22,500 to $24,999 | 30 (5.1%) | 25 (4.5%) |
| $25,000 to $29,999 | 27 (4.6%) | 31 (5.6%) |
| $30,000 to $34,999 | 24 (4.1%) | 20 (3.6%) |
| $35,000 to $39,999 | 18 (3.1%) | 25 (4.5%) |
| $40,000 to $44,999 | 23 (3.9%) | 43 (7.8%) |
| $45,000 to $49,999 | 24 (4.1%) | 12 (2.2%) |
| $50,000 to $54,999 | 39 (6.7%) | 4 (0.7%) |
| $55,000 to $64,999 | 118 (20.1%) | 59 (10.7%) |
| $65,000 to $74,999 | 73 (12.5%) | 65 (11.8%) |
| $75,000 to $99,999 | 12 (2.1%) | 31 (5.6%) |
| $100,000+ | 24 (4.1%) | 12 (2.2%) |
| Total | 586 (100.0%) | 552 (100.0%) |
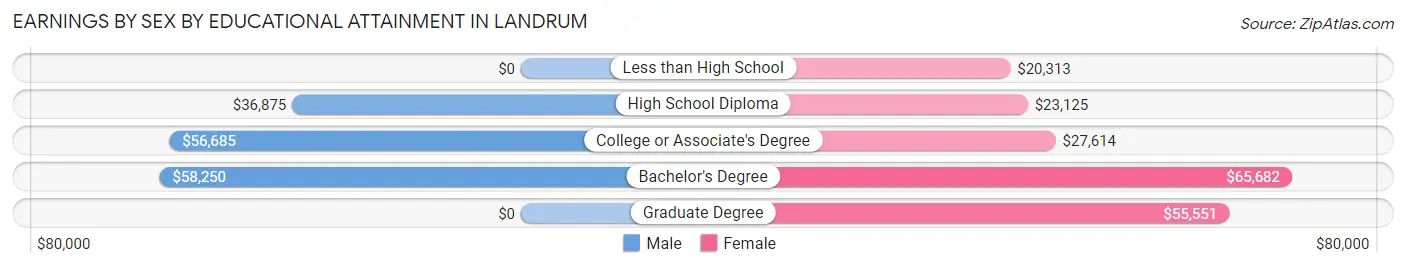
Earnings by Sex by Educational Attainment in Landrum
Average earnings in Landrum are $52,250 for men and $35,625 for women, a difference of 31.8%. Men with an educational attainment of bachelor's degree enjoy the highest average annual earnings of $58,250, while those with high school diploma education earn the least with $36,875. Women with an educational attainment of bachelor's degree earn the most with the average annual earnings of $65,682, while those with less than high school education have the smallest earnings of $20,313.
| Educational Attainment | Male Income | Female Income |
| Less than High School | - | - |
| High School Diploma | $36,875 | $23,125 |
| College or Associate's Degree | $56,685 | $27,614 |
| Bachelor's Degree | $58,250 | $65,682 |
| Graduate Degree | - | - |
| Total | $52,250 | $35,625 |
Family Income in Landrum
Family Income Brackets in Landrum
According to the Landrum family income data, there are 190 families falling into the $50,000 to $74,999 income range, which is the most common income bracket and makes up 28.8% of all families. Conversely, the $10,000 to $14,999 income bracket is the least frequent group with only 17 families (2.6%) belonging to this category.
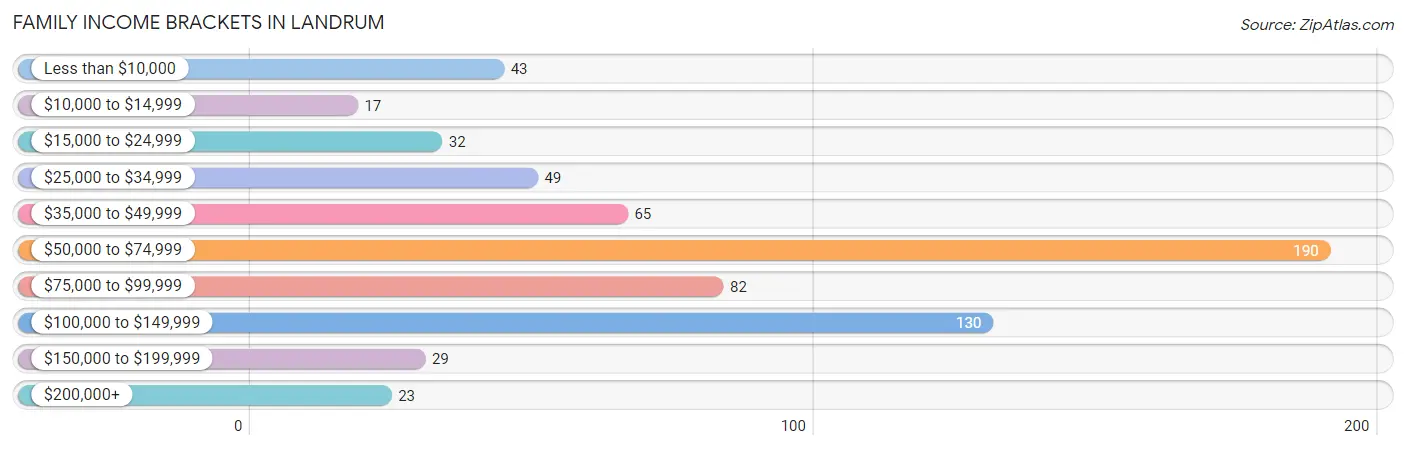
| Income Bracket | # Families | % Families |
| Less than $10,000 | 43 | 6.5% |
| $10,000 to $14,999 | 17 | 2.6% |
| $15,000 to $24,999 | 32 | 4.8% |
| $25,000 to $34,999 | 49 | 7.4% |
| $35,000 to $49,999 | 65 | 9.8% |
| $50,000 to $74,999 | 190 | 28.8% |
| $75,000 to $99,999 | 82 | 12.4% |
| $100,000 to $149,999 | 130 | 19.7% |
| $150,000 to $199,999 | 29 | 4.4% |
| $200,000+ | 23 | 3.5% |
Family Income by Famaliy Size in Landrum
5-person families (51 | 7.7%) account for the highest median family income in Landrum with $120,625 per family, while 2-person families (421 | 63.8%) have the highest median income of $28,580 per family member.
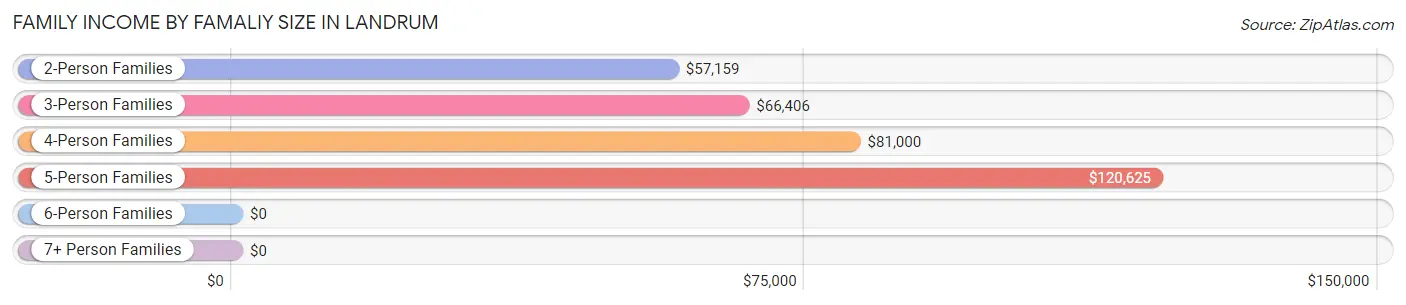
| Income Bracket | # Families | Median Income |
| 2-Person Families | 421 (63.8%) | $57,159 |
| 3-Person Families | 98 (14.8%) | $66,406 |
| 4-Person Families | 90 (13.6%) | $81,000 |
| 5-Person Families | 51 (7.7%) | $120,625 |
| 6-Person Families | 0 (0.0%) | $0 |
| 7+ Person Families | 0 (0.0%) | $0 |
| Total | 660 (100.0%) | $67,188 |
Family Income by Number of Earners in Landrum
The median family income in Landrum is $67,188, with families comprising 3+ earners (56) having the highest median family income of $120,956, while families with no earners (122) have the lowest median family income of $34,667, accounting for 8.5% and 18.5% of families, respectively.
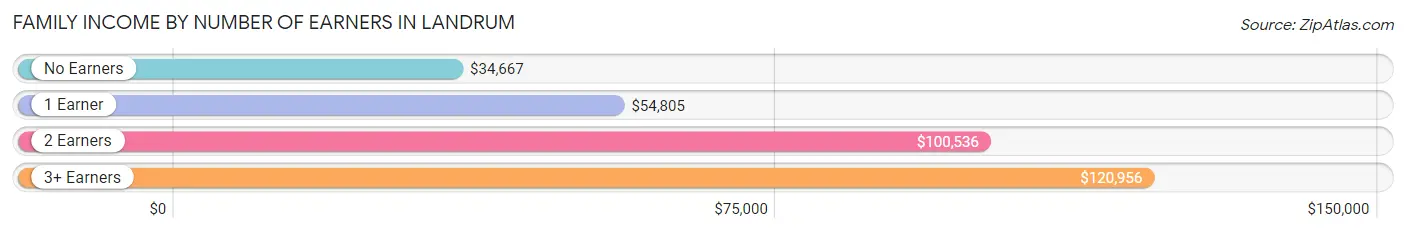
| Number of Earners | # Families | Median Income |
| No Earners | 122 (18.5%) | $34,667 |
| 1 Earner | 309 (46.8%) | $54,805 |
| 2 Earners | 173 (26.2%) | $100,536 |
| 3+ Earners | 56 (8.5%) | $120,956 |
| Total | 660 (100.0%) | $67,188 |
Household Income in Landrum
Household Income Brackets in Landrum
With 297 households falling in the category, the $15,000 to $24,999 income range is the most frequent in Landrum, accounting for 23.0% of all households. In contrast, only 23 households (1.8%) fall into the $200,000+ income bracket, making it the least populous group.
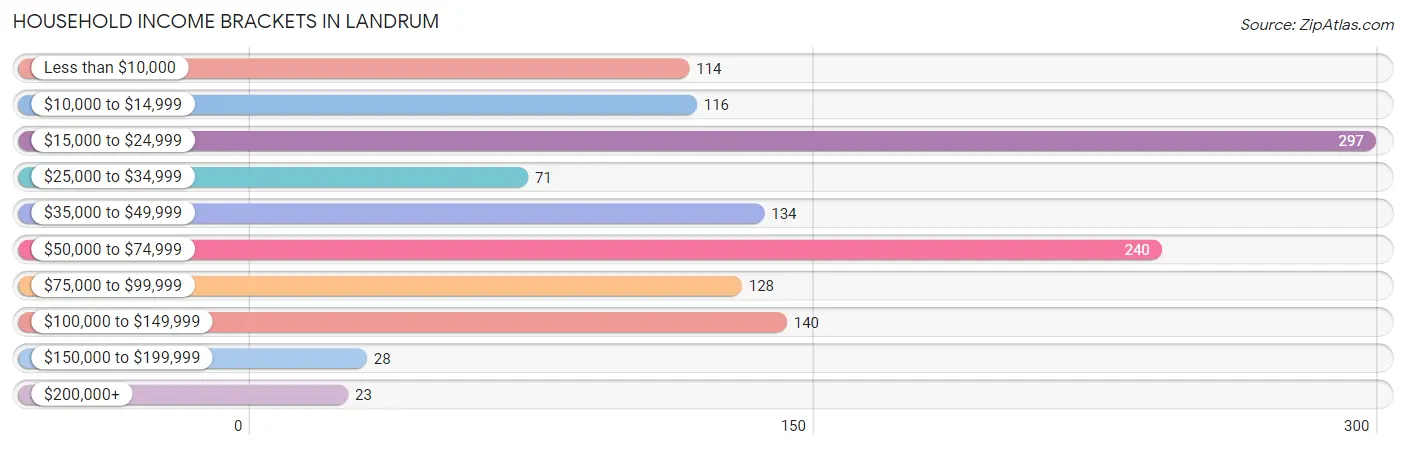
| Income Bracket | # Households | % Households |
| Less than $10,000 | 114 | 8.8% |
| $10,000 to $14,999 | 116 | 9.0% |
| $15,000 to $24,999 | 297 | 23.0% |
| $25,000 to $34,999 | 71 | 5.5% |
| $35,000 to $49,999 | 134 | 10.4% |
| $50,000 to $74,999 | 240 | 18.6% |
| $75,000 to $99,999 | 128 | 9.9% |
| $100,000 to $149,999 | 140 | 10.8% |
| $150,000 to $199,999 | 28 | 2.2% |
| $200,000+ | 23 | 1.8% |
Household Income by Householder Age in Landrum
The median household income in Landrum is $41,414, with the highest median household income of $56,875 found in the 25 to 44 years age bracket for the primary householder. A total of 288 households (22.3%) fall into this category. Meanwhile, the 15 to 24 years age bracket for the primary householder has the lowest median household income of $0, with 12 households (0.9%) in this group.
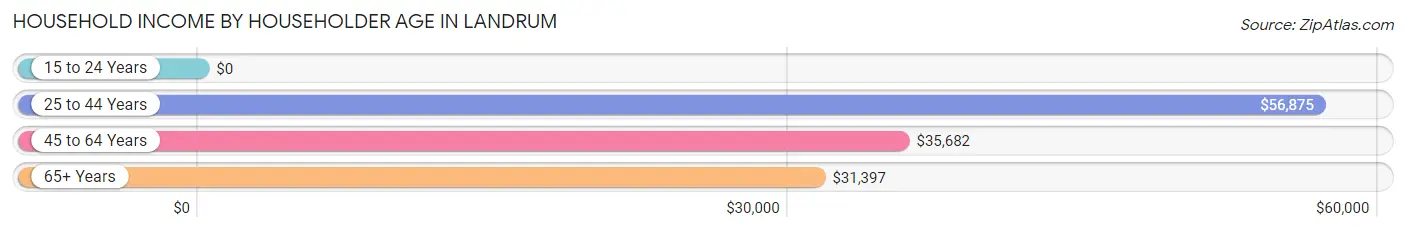
| Income Bracket | # Households | Median Income |
| 15 to 24 Years | 12 (0.9%) | $0 |
| 25 to 44 Years | 288 (22.3%) | $56,875 |
| 45 to 64 Years | 504 (39.0%) | $35,682 |
| 65+ Years | 489 (37.8%) | $31,397 |
| Total | 1,293 (100.0%) | $41,414 |
Poverty in Landrum
Income Below Poverty by Sex and Age in Landrum
With 6.1% poverty level for males and 19.3% for females among the residents of Landrum, 18 to 24 year old males and 18 to 24 year old females are the most vulnerable to poverty, with 38 males (66.7%) and 12 females (37.5%) in their respective age groups living below the poverty level.
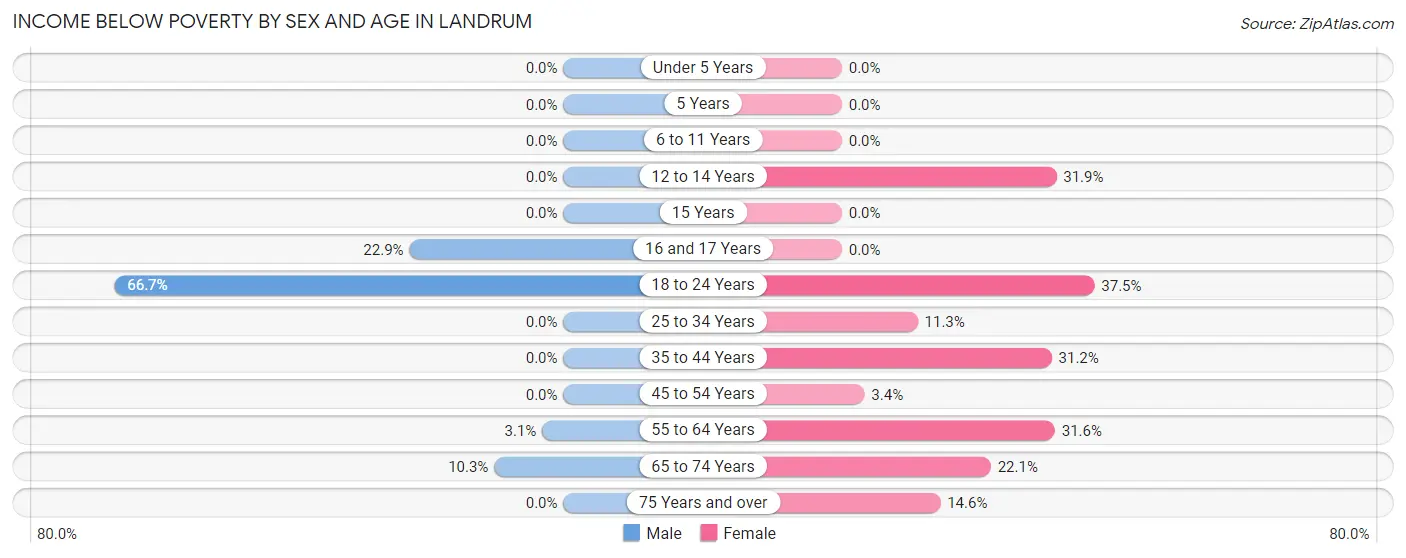
| Age Bracket | Male | Female |
| Under 5 Years | 0 (0.0%) | 0 (0.0%) |
| 5 Years | 0 (0.0%) | 0 (0.0%) |
| 6 to 11 Years | 0 (0.0%) | 0 (0.0%) |
| 12 to 14 Years | 0 (0.0%) | 43 (31.9%) |
| 15 Years | 0 (0.0%) | 0 (0.0%) |
| 16 and 17 Years | 8 (22.9%) | 0 (0.0%) |
| 18 to 24 Years | 38 (66.7%) | 12 (37.5%) |
| 25 to 34 Years | 0 (0.0%) | 17 (11.3%) |
| 35 to 44 Years | 0 (0.0%) | 43 (31.2%) |
| 45 to 54 Years | 0 (0.0%) | 5 (3.4%) |
| 55 to 64 Years | 7 (3.1%) | 68 (31.6%) |
| 65 to 74 Years | 15 (10.3%) | 48 (22.1%) |
| 75 Years and over | 0 (0.0%) | 31 (14.6%) |
| Total | 68 (6.1%) | 267 (19.3%) |
Income Above Poverty by Sex and Age in Landrum
According to the poverty statistics in Landrum, males aged under 5 years and females aged under 5 years are the age groups that are most secure financially, with 100.0% of males and 100.0% of females in these age groups living above the poverty line.
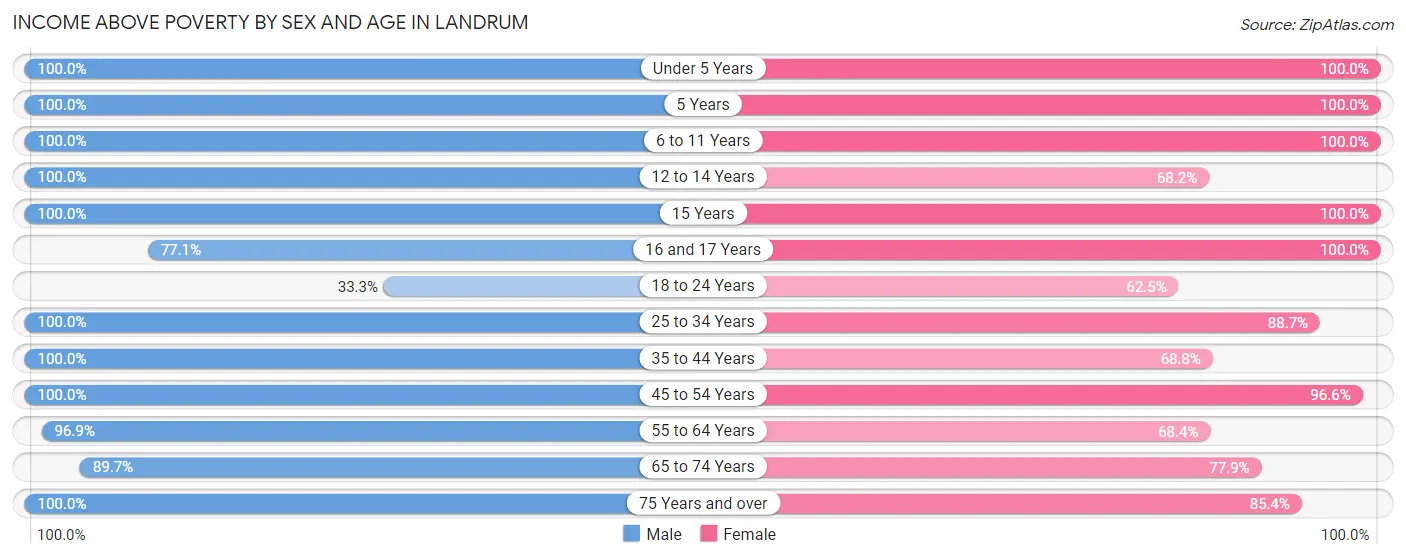
| Age Bracket | Male | Female |
| Under 5 Years | 50 (100.0%) | 25 (100.0%) |
| 5 Years | 36 (100.0%) | 12 (100.0%) |
| 6 to 11 Years | 56 (100.0%) | 51 (100.0%) |
| 12 to 14 Years | 19 (100.0%) | 92 (68.1%) |
| 15 Years | 7 (100.0%) | 4 (100.0%) |
| 16 and 17 Years | 27 (77.1%) | 40 (100.0%) |
| 18 to 24 Years | 19 (33.3%) | 20 (62.5%) |
| 25 to 34 Years | 100 (100.0%) | 134 (88.7%) |
| 35 to 44 Years | 139 (100.0%) | 95 (68.8%) |
| 45 to 54 Years | 130 (100.0%) | 144 (96.6%) |
| 55 to 64 Years | 216 (96.9%) | 147 (68.4%) |
| 65 to 74 Years | 131 (89.7%) | 169 (77.9%) |
| 75 Years and over | 111 (100.0%) | 181 (85.4%) |
| Total | 1,041 (93.9%) | 1,114 (80.7%) |
Income Below Poverty Among Married-Couple Families in Landrum
The poverty statistics for married-couple families in Landrum show that 2.9% or 14 of the total 478 families live below the poverty line. Families with 1 or 2 children have the highest poverty rate of 5.9%, comprising of 7 families. On the other hand, families with 3 or 4 children have the lowest poverty rate of 0.0%, which includes 0 families.
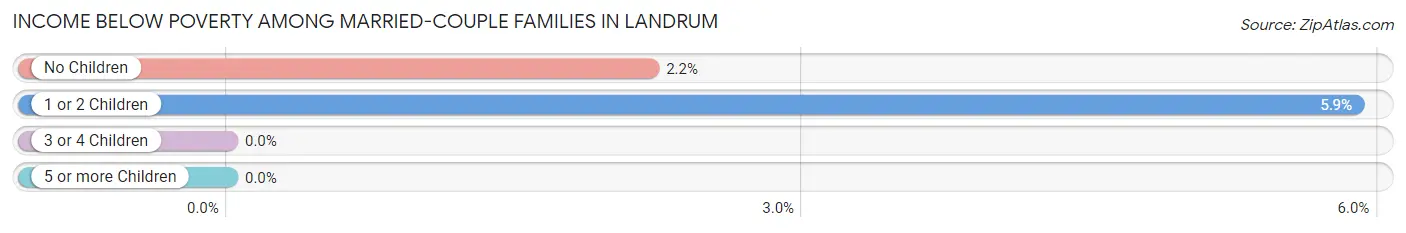
| Children | Above Poverty | Below Poverty |
| No Children | 311 (97.8%) | 7 (2.2%) |
| 1 or 2 Children | 112 (94.1%) | 7 (5.9%) |
| 3 or 4 Children | 41 (100.0%) | 0 (0.0%) |
| 5 or more Children | 0 (0.0%) | 0 (0.0%) |
| Total | 464 (97.1%) | 14 (2.9%) |
Income Below Poverty Among Single-Parent Households in Landrum
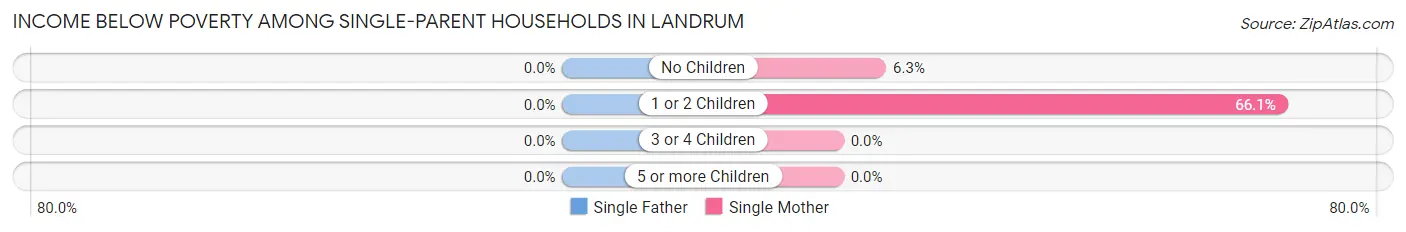
| Children | Single Father | Single Mother |
| No Children | 0 (0.0%) | 5 (6.3%) |
| 1 or 2 Children | 0 (0.0%) | 41 (66.1%) |
| 3 or 4 Children | 0 (0.0%) | 0 (0.0%) |
| 5 or more Children | 0 (0.0%) | 0 (0.0%) |
| Total | 0 (0.0%) | 46 (32.6%) |
Income Below Poverty Among Married-Couple vs Single-Parent Households in Landrum
The poverty data for Landrum shows that 14 of the married-couple family households (2.9%) and 46 of the single-parent households (25.3%) are living below the poverty level. Within the married-couple family households, those with 1 or 2 children have the highest poverty rate, with 7 households (5.9%) falling below the poverty line. Among the single-parent households, those with 1 or 2 children have the highest poverty rate, with 41 household (39.8%) living below poverty.
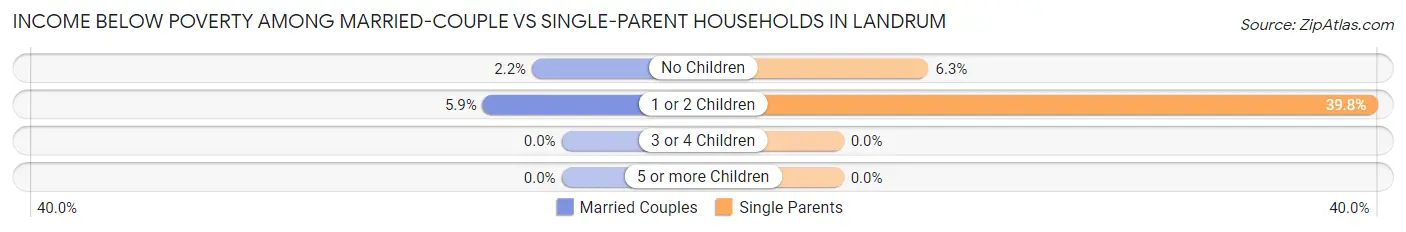
| Children | Married-Couple Families | Single-Parent Households |
| No Children | 7 (2.2%) | 5 (6.3%) |
| 1 or 2 Children | 7 (5.9%) | 41 (39.8%) |
| 3 or 4 Children | 0 (0.0%) | 0 (0.0%) |
| 5 or more Children | 0 (0.0%) | 0 (0.0%) |
| Total | 14 (2.9%) | 46 (25.3%) |
Race in Landrum
The most populous races in Landrum are White / Caucasian (2,309 | 92.2%), Black / African American (163 | 6.5%), and Hispanic or Latino (23 | 0.9%).
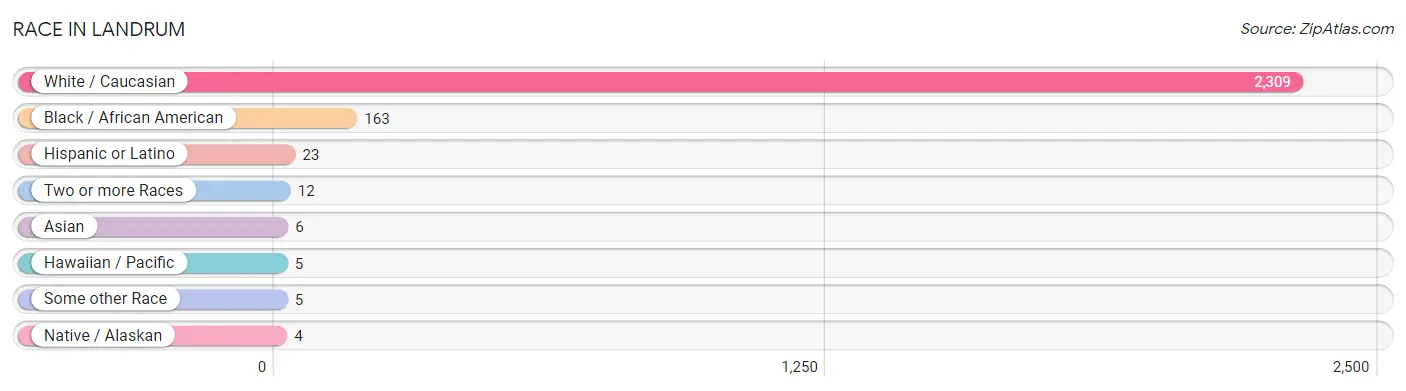
| Race | # Population | % Population |
| Asian | 6 | 0.2% |
| Black / African American | 163 | 6.5% |
| Hawaiian / Pacific | 5 | 0.2% |
| Hispanic or Latino | 23 | 0.9% |
| Native / Alaskan | 4 | 0.2% |
| White / Caucasian | 2,309 | 92.2% |
| Two or more Races | 12 | 0.5% |
| Some other Race | 5 | 0.2% |
| Total | 2,504 | 100.0% |
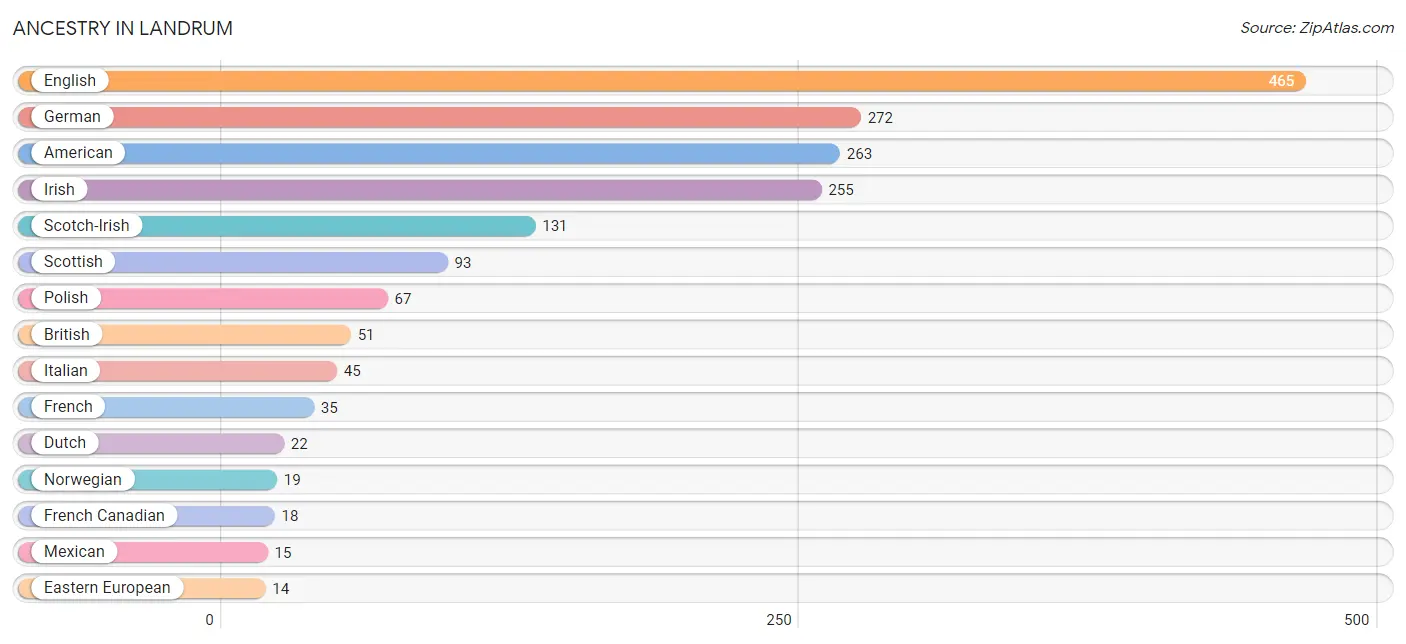
Ancestry in Landrum
The most populous ancestries reported in Landrum are English (465 | 18.6%), German (272 | 10.9%), American (263 | 10.5%), Irish (255 | 10.2%), and Scotch-Irish (131 | 5.2%), together accounting for 55.3% of all Landrum residents.
| Ancestry | # Population | % Population |
| American | 263 | 10.5% |
| Belgian | 6 | 0.2% |
| British | 51 | 2.0% |
| Burmese | 6 | 0.2% |
| Central American Indian | 4 | 0.2% |
| Czech | 4 | 0.2% |
| Dutch | 22 | 0.9% |
| Eastern European | 14 | 0.6% |
| English | 465 | 18.6% |
| French | 35 | 1.4% |
| French Canadian | 18 | 0.7% |
| German | 272 | 10.9% |
| Guamanian / Chamorro | 5 | 0.2% |
| Irish | 255 | 10.2% |
| Italian | 45 | 1.8% |
| Mexican | 15 | 0.6% |
| Northern European | 5 | 0.2% |
| Norwegian | 19 | 0.8% |
| Polish | 67 | 2.7% |
| Puerto Rican | 4 | 0.2% |
| Russian | 6 | 0.2% |
| Scandinavian | 11 | 0.4% |
| Scotch-Irish | 131 | 5.2% |
| Scottish | 93 | 3.7% |
| Swedish | 7 | 0.3% |
| Ukrainian | 4 | 0.2% |
| Welsh | 6 | 0.2% | View All 27 Rows |
Immigrants in Landrum
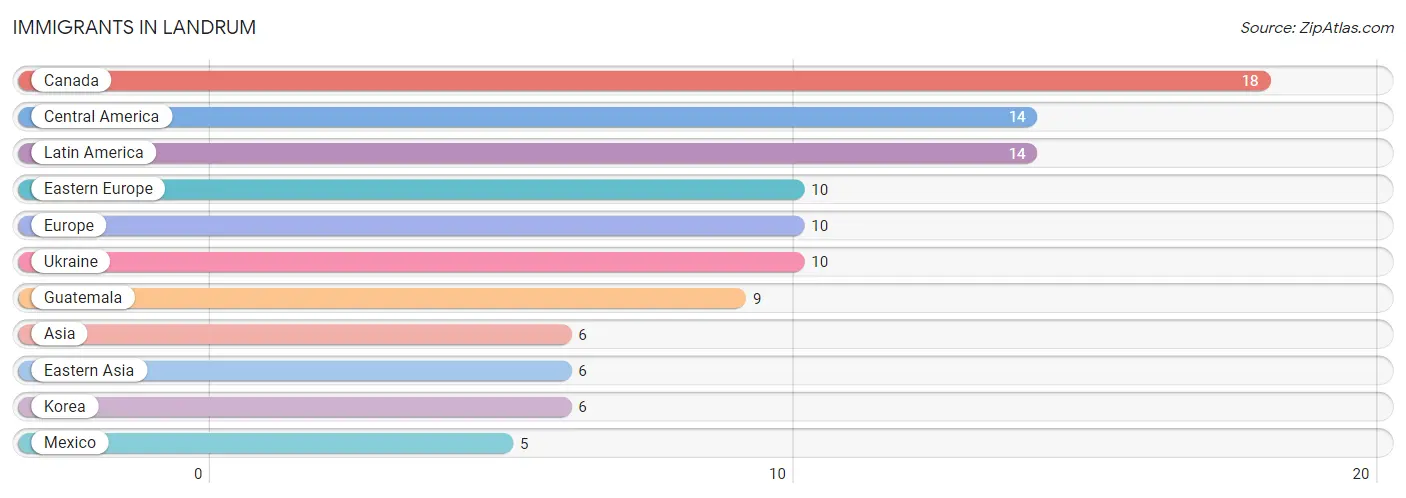
The most numerous immigrant groups reported in Landrum came from Canada (18 | 0.7%), Central America (14 | 0.6%), Latin America (14 | 0.6%), Eastern Europe (10 | 0.4%), and Europe (10 | 0.4%), together accounting for 2.6% of all Landrum residents.
| Immigration Origin | # Population | % Population |
| Asia | 6 | 0.2% |
| Canada | 18 | 0.7% |
| Central America | 14 | 0.6% |
| Eastern Asia | 6 | 0.2% |
| Eastern Europe | 10 | 0.4% |
| Europe | 10 | 0.4% |
| Guatemala | 9 | 0.4% |
| Korea | 6 | 0.2% |
| Latin America | 14 | 0.6% |
| Mexico | 5 | 0.2% |
| Ukraine | 10 | 0.4% | View All 11 Rows |
Sex and Age in Landrum
Sex and Age in Landrum
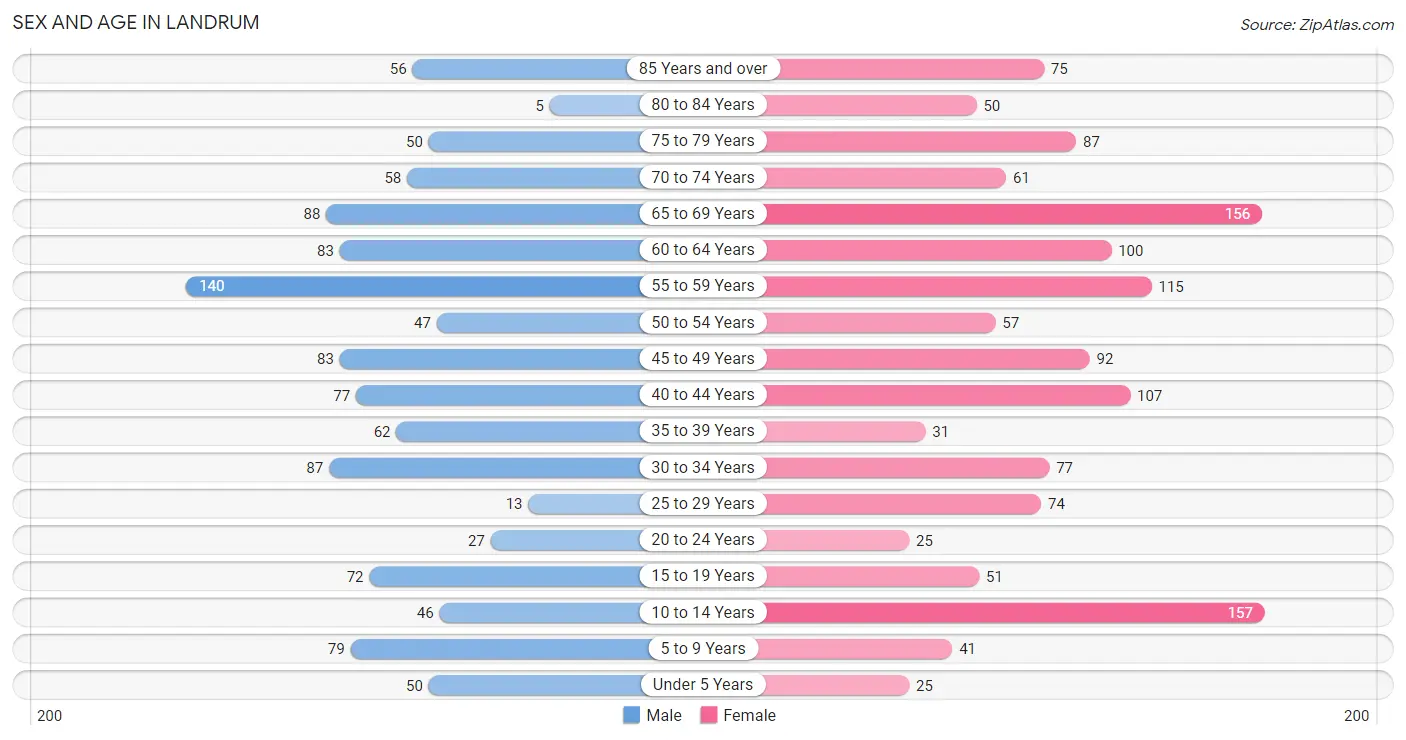
The most populous age groups in Landrum are 55 to 59 Years (140 | 12.5%) for men and 10 to 14 Years (157 | 11.4%) for women.
| Age Bracket | Male | Female |
| Under 5 Years | 50 (4.4%) | 25 (1.8%) |
| 5 to 9 Years | 79 (7.0%) | 41 (3.0%) |
| 10 to 14 Years | 46 (4.1%) | 157 (11.4%) |
| 15 to 19 Years | 72 (6.4%) | 51 (3.7%) |
| 20 to 24 Years | 27 (2.4%) | 25 (1.8%) |
| 25 to 29 Years | 13 (1.2%) | 74 (5.4%) |
| 30 to 34 Years | 87 (7.7%) | 77 (5.6%) |
| 35 to 39 Years | 62 (5.5%) | 31 (2.2%) |
| 40 to 44 Years | 77 (6.9%) | 107 (7.7%) |
| 45 to 49 Years | 83 (7.4%) | 92 (6.7%) |
| 50 to 54 Years | 47 (4.2%) | 57 (4.1%) |
| 55 to 59 Years | 140 (12.5%) | 115 (8.3%) |
| 60 to 64 Years | 83 (7.4%) | 100 (7.2%) |
| 65 to 69 Years | 88 (7.8%) | 156 (11.3%) |
| 70 to 74 Years | 58 (5.2%) | 61 (4.4%) |
| 75 to 79 Years | 50 (4.4%) | 87 (6.3%) |
| 80 to 84 Years | 5 (0.4%) | 50 (3.6%) |
| 85 Years and over | 56 (5.0%) | 75 (5.4%) |
| Total | 1,123 (100.0%) | 1,381 (100.0%) |
Families and Households in Landrum
Median Family Size in Landrum
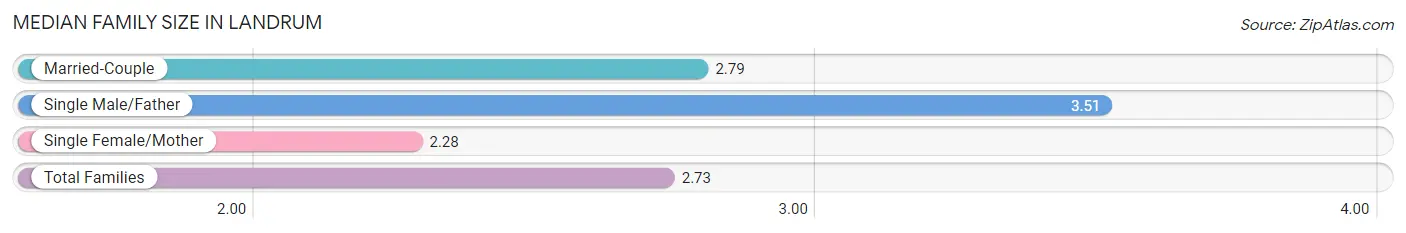
The median family size in Landrum is 2.73 persons per family, with single male/father families (41 | 6.2%) accounting for the largest median family size of 3.51 persons per family. On the other hand, single female/mother families (141 | 21.4%) represent the smallest median family size with 2.28 persons per family.
| Family Type | # Families | Family Size |
| Married-Couple | 478 (72.4%) | 2.79 |
| Single Male/Father | 41 (6.2%) | 3.51 |
| Single Female/Mother | 141 (21.4%) | 2.28 |
| Total Families | 660 (100.0%) | 2.73 |
Median Household Size in Landrum
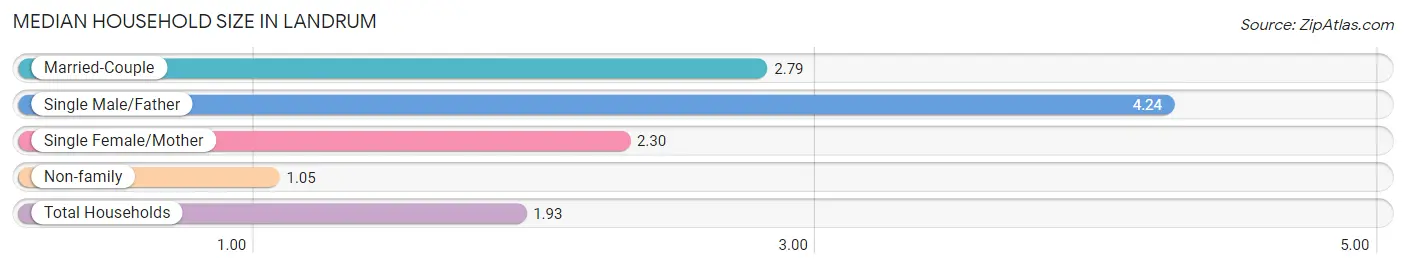
The median household size in Landrum is 1.93 persons per household, with single male/father households (41 | 3.2%) accounting for the largest median household size of 4.24 persons per household. non-family households (633 | 49.0%) represent the smallest median household size with 1.05 persons per household.
| Household Type | # Households | Household Size |
| Married-Couple | 478 (37.0%) | 2.79 |
| Single Male/Father | 41 (3.2%) | 4.24 |
| Single Female/Mother | 141 (10.9%) | 2.30 |
| Non-family | 633 (49.0%) | 1.05 |
| Total Households | 1,293 (100.0%) | 1.93 |
Household Size by Marriage Status in Landrum
Out of a total of 1,293 households in Landrum, 660 (51.0%) are family households, while 633 (49.0%) are nonfamily households. The most numerous type of family households are 2-person households, comprising 417, and the most common type of nonfamily households are 1-person households, comprising 615.
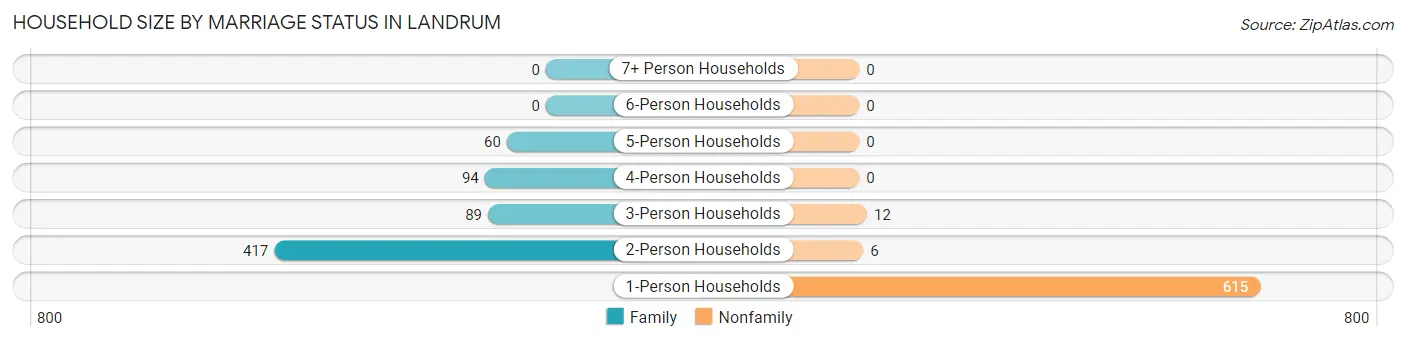
| Household Size | Family Households | Nonfamily Households |
| 1-Person Households | - | 615 (47.6%) |
| 2-Person Households | 417 (32.3%) | 6 (0.5%) |
| 3-Person Households | 89 (6.9%) | 12 (0.9%) |
| 4-Person Households | 94 (7.3%) | 0 (0.0%) |
| 5-Person Households | 60 (4.6%) | 0 (0.0%) |
| 6-Person Households | 0 (0.0%) | 0 (0.0%) |
| 7+ Person Households | 0 (0.0%) | 0 (0.0%) |
| Total | 660 (51.0%) | 633 (49.0%) |
Female Fertility in Landrum
Fertility by Age in Landrum
Average fertility rate in Landrum is 39.0 births per 1,000 women. Women in the age bracket of 20 to 34 years have the highest fertility rate with 80.0 births per 1,000 women. Women in the age bracket of 20 to 34 years acount for 77.8% of all women with births.
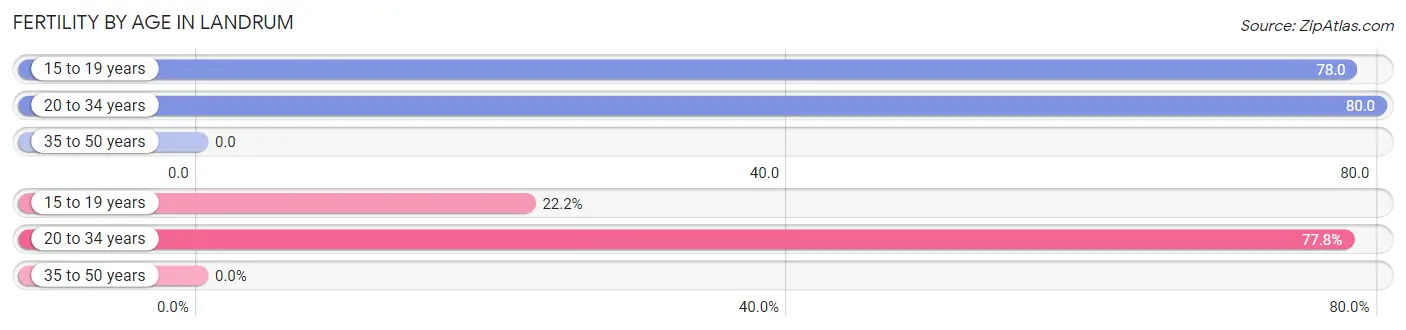
| Age Bracket | Women with Births | Births / 1,000 Women |
| 15 to 19 years | 4 (22.2%) | 78.0 |
| 20 to 34 years | 14 (77.8%) | 80.0 |
| 35 to 50 years | 0 (0.0%) | 0.0 |
| Total | 18 (100.0%) | 39.0 |
Fertility by Age by Marriage Status in Landrum
77.8% of women with births (18) in Landrum are married. The highest percentage of unmarried women with births falls into 15 to 19 years age bracket with 100.0% of them unmarried at the time of birth, while the lowest percentage of unmarried women with births belong to 20 to 34 years age bracket with 0.0% of them unmarried.
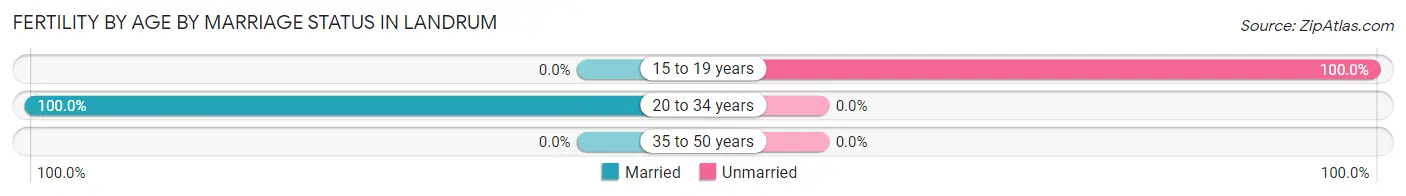
| Age Bracket | Married | Unmarried |
| 15 to 19 years | 0 (0.0%) | 4 (100.0%) |
| 20 to 34 years | 14 (100.0%) | 0 (0.0%) |
| 35 to 50 years | 0 (0.0%) | 0 (0.0%) |
| Total | 14 (77.8%) | 4 (22.2%) |
Fertility by Education in Landrum
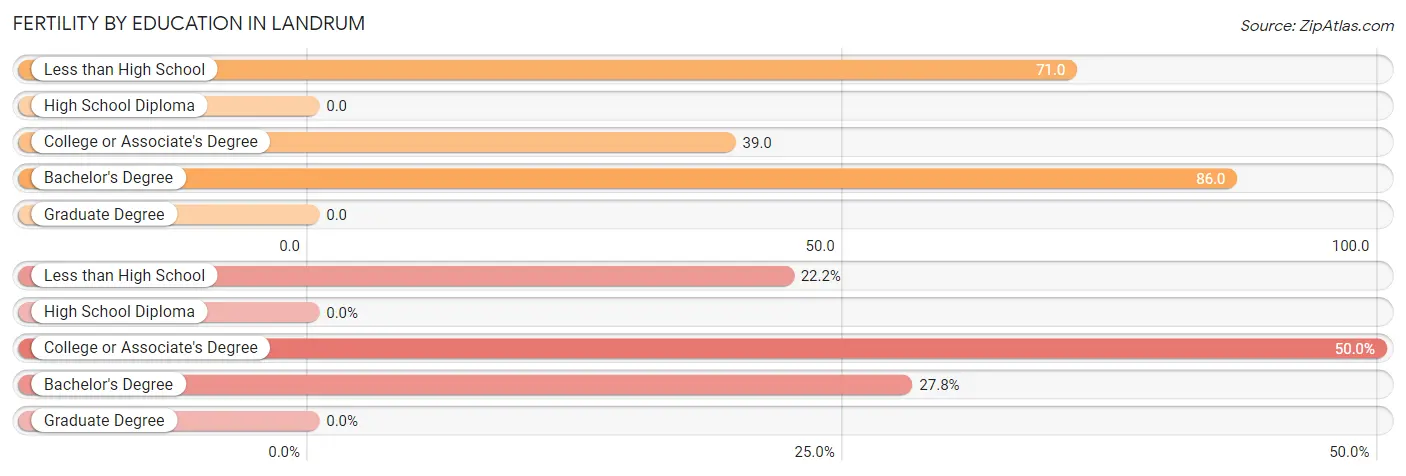
| Educational Attainment | Women with Births | Births / 1,000 Women |
| Less than High School | 4 (22.2%) | 71.0 |
| High School Diploma | 0 (0.0%) | 0.0 |
| College or Associate's Degree | 9 (50.0%) | 39.0 |
| Bachelor's Degree | 5 (27.8%) | 86.0 |
| Graduate Degree | 0 (0.0%) | 0.0 |
| Total | 18 (100.0%) | 39.0 |
Fertility by Education by Marriage Status in Landrum
22.2% of women with births in Landrum are unmarried. Women with the educational attainment of college or associate's degree are most likely to be married with 100.0% of them married at childbirth, while women with the educational attainment of less than high school are least likely to be married with 100.0% of them unmarried at childbirth.
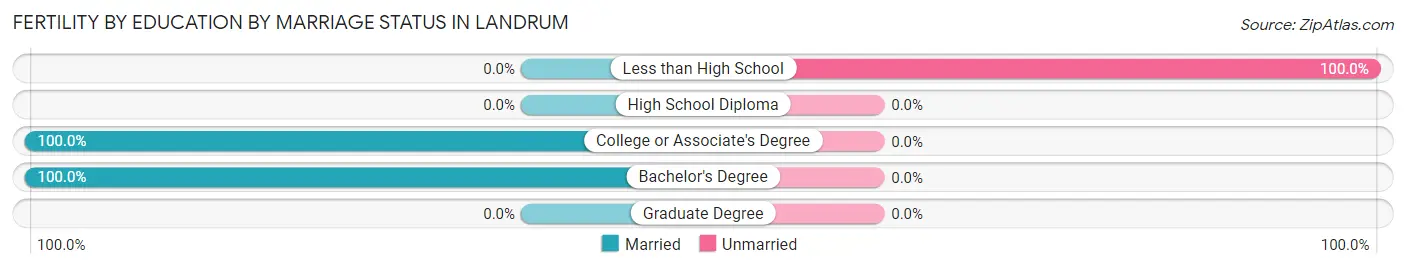
| Educational Attainment | Married | Unmarried |
| Less than High School | 0 (0.0%) | 4 (100.0%) |
| High School Diploma | 0 (0.0%) | 0 (0.0%) |
| College or Associate's Degree | 9 (100.0%) | 0 (0.0%) |
| Bachelor's Degree | 5 (100.0%) | 0 (0.0%) |
| Graduate Degree | 0 (0.0%) | 0 (0.0%) |
| Total | 14 (77.8%) | 4 (22.2%) |
Employment Characteristics in Landrum
Employment by Class of Employer in Landrum
Among the 984 employed individuals in Landrum, private company employees (687 | 69.8%), local government employees (95 | 9.7%), and self-employed (not incorporated) (82 | 8.3%) make up the most common classes of employment.
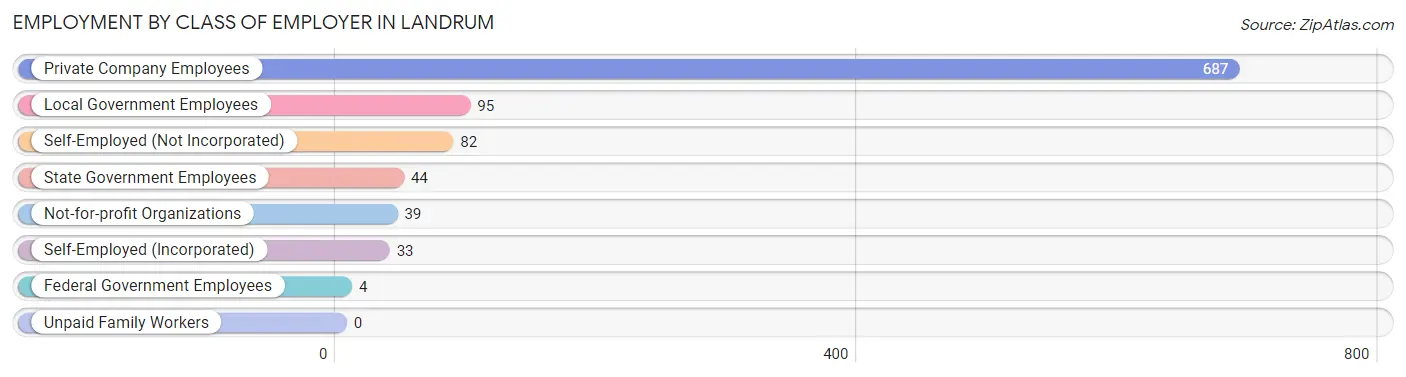
| Employer Class | # Employees | % Employees |
| Private Company Employees | 687 | 69.8% |
| Self-Employed (Incorporated) | 33 | 3.4% |
| Self-Employed (Not Incorporated) | 82 | 8.3% |
| Not-for-profit Organizations | 39 | 4.0% |
| Local Government Employees | 95 | 9.7% |
| State Government Employees | 44 | 4.5% |
| Federal Government Employees | 4 | 0.4% |
| Unpaid Family Workers | 0 | 0.0% |
| Total | 984 | 100.0% |
Employment Status by Age in Landrum
According to the labor force statistics for Landrum, out of the total population over 16 years of age (2,095), 51.6% or 1,081 individuals are in the labor force, with 4.2% or 45 of them unemployed. The age group with the highest labor force participation rate is 25 to 29 years, with 100.0% or 87 individuals in the labor force. Within the labor force, the 20 to 24 years age range has the highest percentage of unemployed individuals, with 24.2% or 8 of them being unemployed.
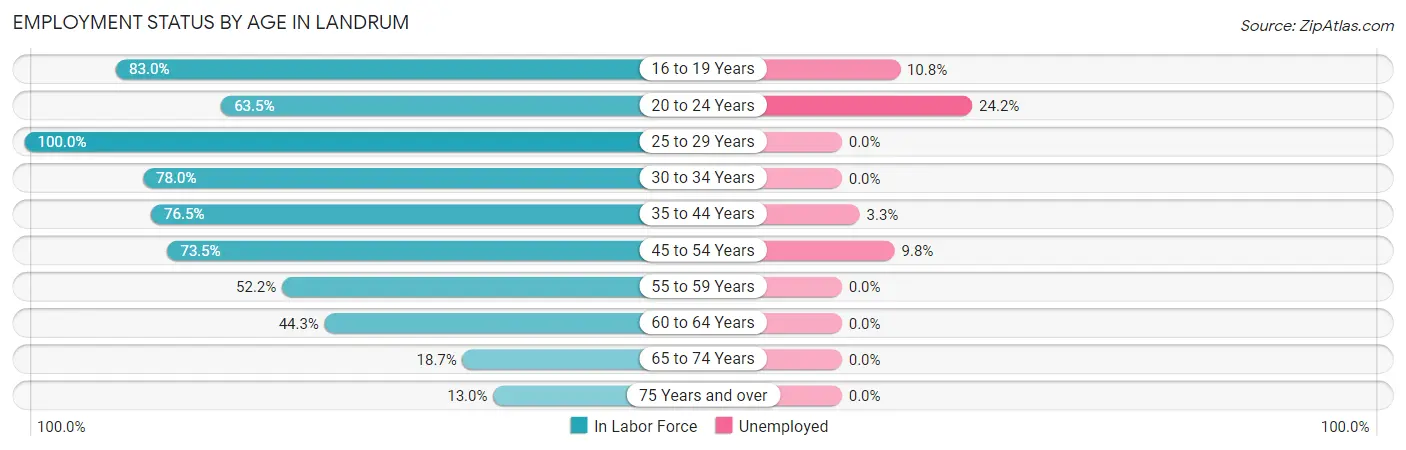
| Age Bracket | In Labor Force | Unemployed |
| 16 to 19 Years | 93 (83.0%) | 10 (10.8%) |
| 20 to 24 Years | 33 (63.5%) | 8 (24.2%) |
| 25 to 29 Years | 87 (100.0%) | 0 (0.0%) |
| 30 to 34 Years | 128 (78.0%) | 0 (0.0%) |
| 35 to 44 Years | 212 (76.5%) | 7 (3.3%) |
| 45 to 54 Years | 205 (73.5%) | 20 (9.8%) |
| 55 to 59 Years | 133 (52.2%) | 0 (0.0%) |
| 60 to 64 Years | 81 (44.3%) | 0 (0.0%) |
| 65 to 74 Years | 68 (18.7%) | 0 (0.0%) |
| 75 Years and over | 42 (13.0%) | 0 (0.0%) |
| Total | 1,081 (51.6%) | 45 (4.2%) |
Employment Status by Educational Attainment in Landrum
According to labor force statistics for Landrum, 68.0% of individuals (847) out of the total population between 25 and 64 years of age (1,245) are in the labor force, with 3.2% or 27 of them being unemployed. The group with the highest labor force participation rate are those with the educational attainment of bachelor's degree or higher, with 82.2% or 198 individuals in the labor force. Within the labor force, individuals with less than high school education have the highest percentage of unemployment, with 23.3% or 20 of them being unemployed.
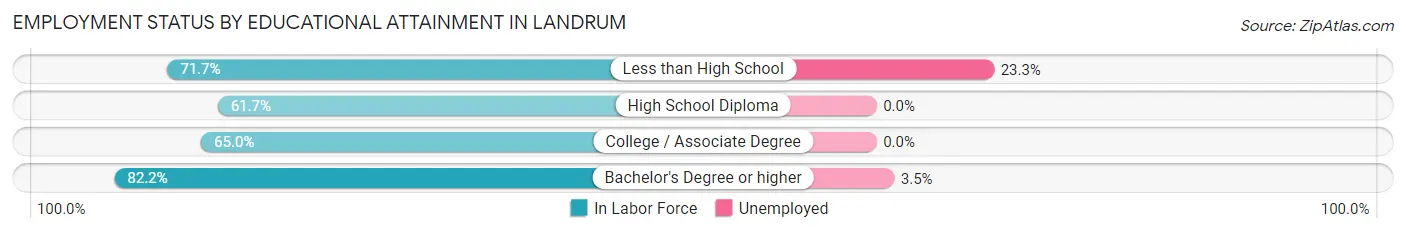
| Educational Attainment | In Labor Force | Unemployed |
| Less than High School | 86 (71.7%) | 28 (23.3%) |
| High School Diploma | 232 (61.7%) | 0 (0.0%) |
| College / Associate Degree | 330 (65.0%) | 0 (0.0%) |
| Bachelor's Degree or higher | 198 (82.2%) | 8 (3.5%) |
| Total | 847 (68.0%) | 40 (3.2%) |
Employment Occupations by Sex in Landrum
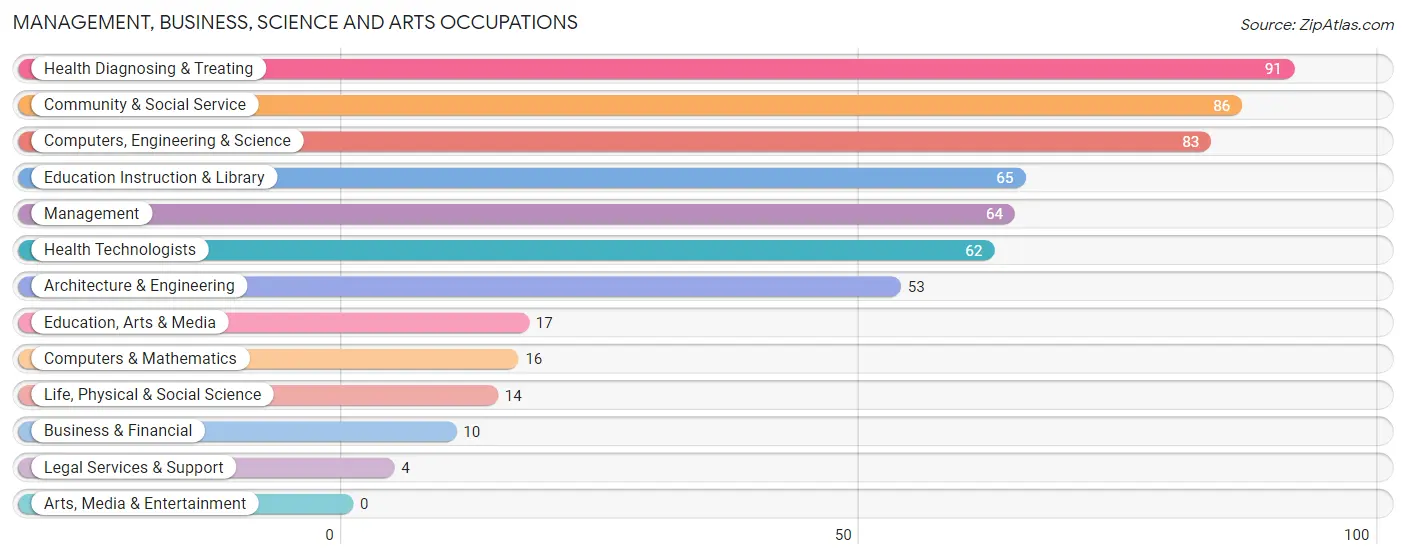
Management, Business, Science and Arts Occupations
The most common Management, Business, Science and Arts occupations in Landrum are Health Diagnosing & Treating (91 | 8.8%), Community & Social Service (86 | 8.3%), Computers, Engineering & Science (83 | 8.0%), Education Instruction & Library (65 | 6.3%), and Management (64 | 6.2%).
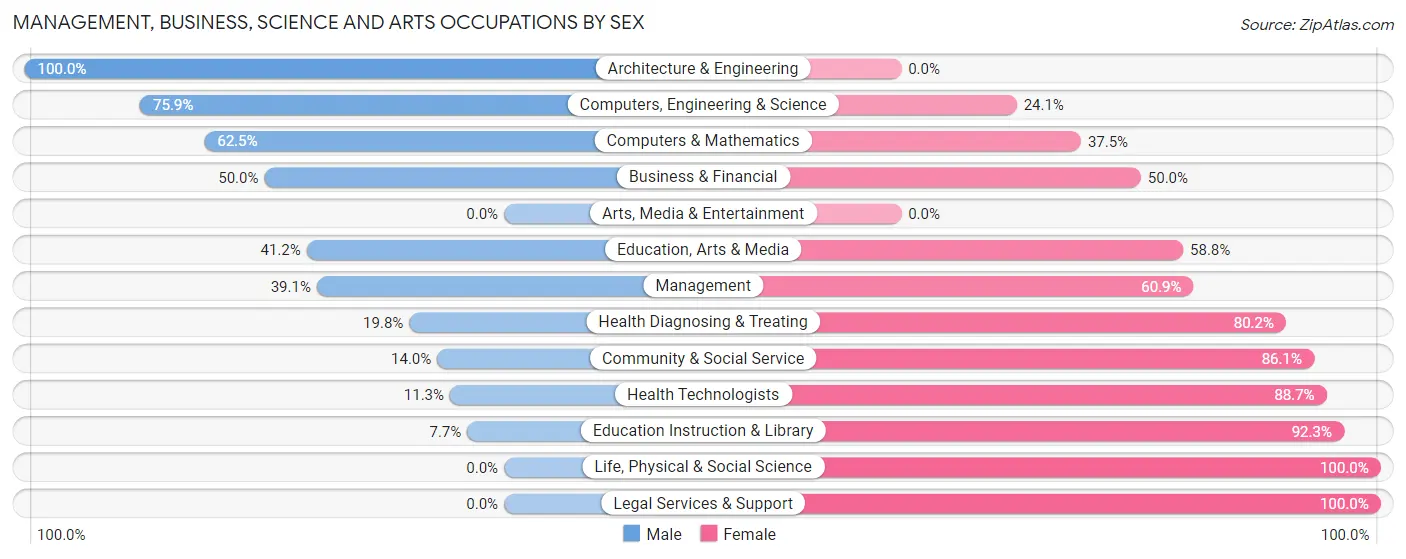
Management, Business, Science and Arts Occupations by Sex
Within the Management, Business, Science and Arts occupations in Landrum, the most male-oriented occupations are Architecture & Engineering (100.0%), Computers, Engineering & Science (75.9%), and Computers & Mathematics (62.5%), while the most female-oriented occupations are Life, Physical & Social Science (100.0%), Legal Services & Support (100.0%), and Education Instruction & Library (92.3%).
| Occupation | Male | Female |
| Management | 25 (39.1%) | 39 (60.9%) |
| Business & Financial | 5 (50.0%) | 5 (50.0%) |
| Computers, Engineering & Science | 63 (75.9%) | 20 (24.1%) |
| Computers & Mathematics | 10 (62.5%) | 6 (37.5%) |
| Architecture & Engineering | 53 (100.0%) | 0 (0.0%) |
| Life, Physical & Social Science | 0 (0.0%) | 14 (100.0%) |
| Community & Social Service | 12 (14.0%) | 74 (86.1%) |
| Education, Arts & Media | 7 (41.2%) | 10 (58.8%) |
| Legal Services & Support | 0 (0.0%) | 4 (100.0%) |
| Education Instruction & Library | 5 (7.7%) | 60 (92.3%) |
| Arts, Media & Entertainment | 0 (0.0%) | 0 (0.0%) |
| Health Diagnosing & Treating | 18 (19.8%) | 73 (80.2%) |
| Health Technologists | 7 (11.3%) | 55 (88.7%) |
| Total (Category) | 123 (36.8%) | 211 (63.2%) |
| Total (Overall) | 530 (51.1%) | 507 (48.9%) |
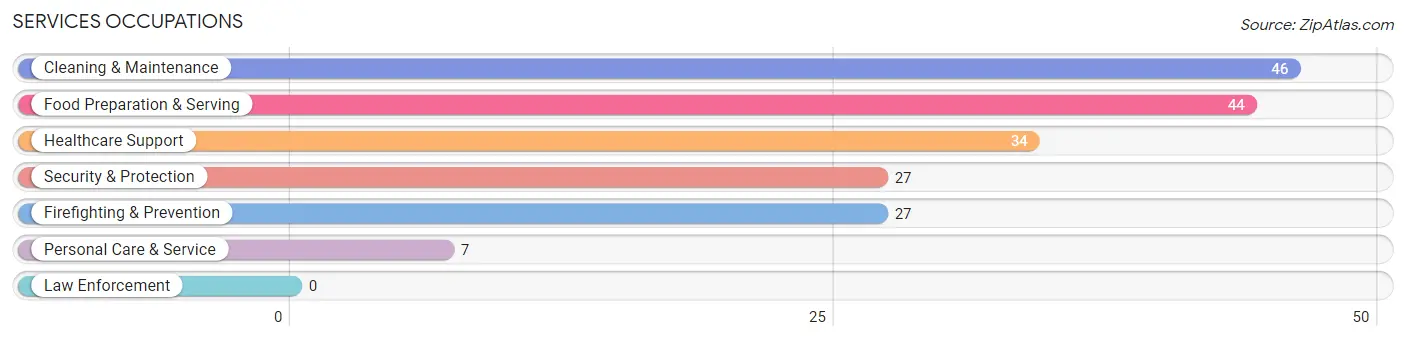
Services Occupations
The most common Services occupations in Landrum are Cleaning & Maintenance (46 | 4.4%), Food Preparation & Serving (44 | 4.2%), Healthcare Support (34 | 3.3%), Security & Protection (27 | 2.6%), and Firefighting & Prevention (27 | 2.6%).
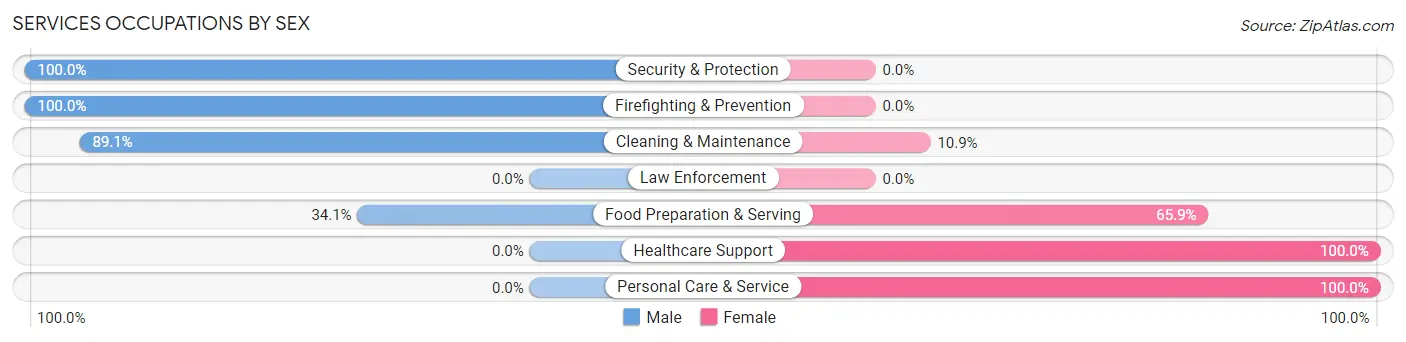
Services Occupations by Sex
Within the Services occupations in Landrum, the most male-oriented occupations are Security & Protection (100.0%), Firefighting & Prevention (100.0%), and Cleaning & Maintenance (89.1%), while the most female-oriented occupations are Healthcare Support (100.0%), Personal Care & Service (100.0%), and Food Preparation & Serving (65.9%).
| Occupation | Male | Female |
| Healthcare Support | 0 (0.0%) | 34 (100.0%) |
| Security & Protection | 27 (100.0%) | 0 (0.0%) |
| Firefighting & Prevention | 27 (100.0%) | 0 (0.0%) |
| Law Enforcement | 0 (0.0%) | 0 (0.0%) |
| Food Preparation & Serving | 15 (34.1%) | 29 (65.9%) |
| Cleaning & Maintenance | 41 (89.1%) | 5 (10.9%) |
| Personal Care & Service | 0 (0.0%) | 7 (100.0%) |
| Total (Category) | 83 (52.5%) | 75 (47.5%) |
| Total (Overall) | 530 (51.1%) | 507 (48.9%) |
Sales and Office Occupations
The most common Sales and Office occupations in Landrum are Office & Administration (140 | 13.5%), and Sales & Related (102 | 9.8%).
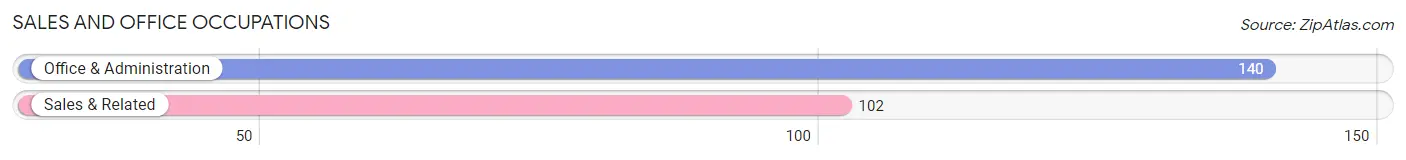
Sales and Office Occupations by Sex

| Occupation | Male | Female |
| Sales & Related | 64 (62.7%) | 38 (37.2%) |
| Office & Administration | 13 (9.3%) | 127 (90.7%) |
| Total (Category) | 77 (31.8%) | 165 (68.2%) |
| Total (Overall) | 530 (51.1%) | 507 (48.9%) |
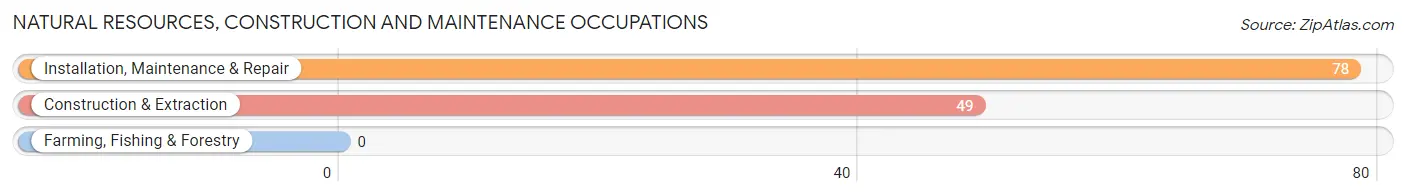
Natural Resources, Construction and Maintenance Occupations
The most common Natural Resources, Construction and Maintenance occupations in Landrum are Installation, Maintenance & Repair (78 | 7.5%), and Construction & Extraction (49 | 4.7%).
Natural Resources, Construction and Maintenance Occupations by Sex
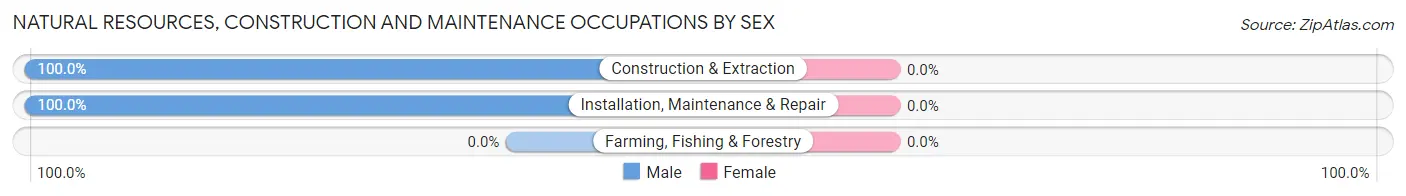
| Occupation | Male | Female |
| Farming, Fishing & Forestry | 0 (0.0%) | 0 (0.0%) |
| Construction & Extraction | 49 (100.0%) | 0 (0.0%) |
| Installation, Maintenance & Repair | 78 (100.0%) | 0 (0.0%) |
| Total (Category) | 127 (100.0%) | 0 (0.0%) |
| Total (Overall) | 530 (51.1%) | 507 (48.9%) |
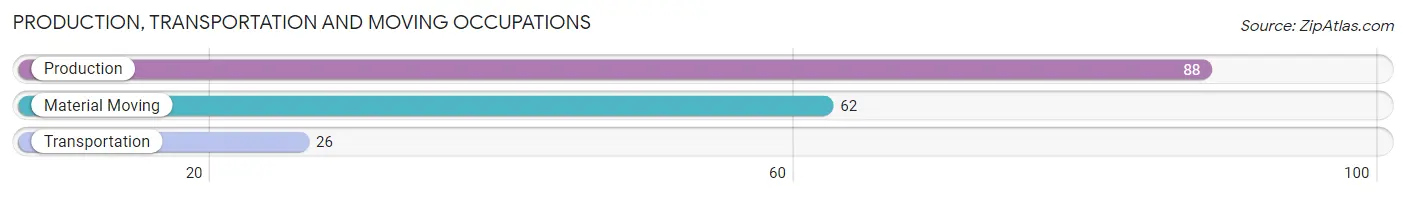
Production, Transportation and Moving Occupations
The most common Production, Transportation and Moving occupations in Landrum are Production (88 | 8.5%), Material Moving (62 | 6.0%), and Transportation (26 | 2.5%).
Production, Transportation and Moving Occupations by Sex
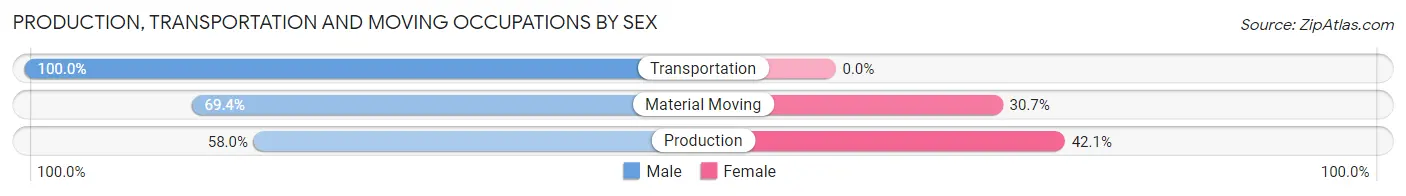
| Occupation | Male | Female |
| Production | 51 (58.0%) | 37 (42.0%) |
| Transportation | 26 (100.0%) | 0 (0.0%) |
| Material Moving | 43 (69.4%) | 19 (30.6%) |
| Total (Category) | 120 (68.2%) | 56 (31.8%) |
| Total (Overall) | 530 (51.1%) | 507 (48.9%) |
Employment Industries by Sex in Landrum
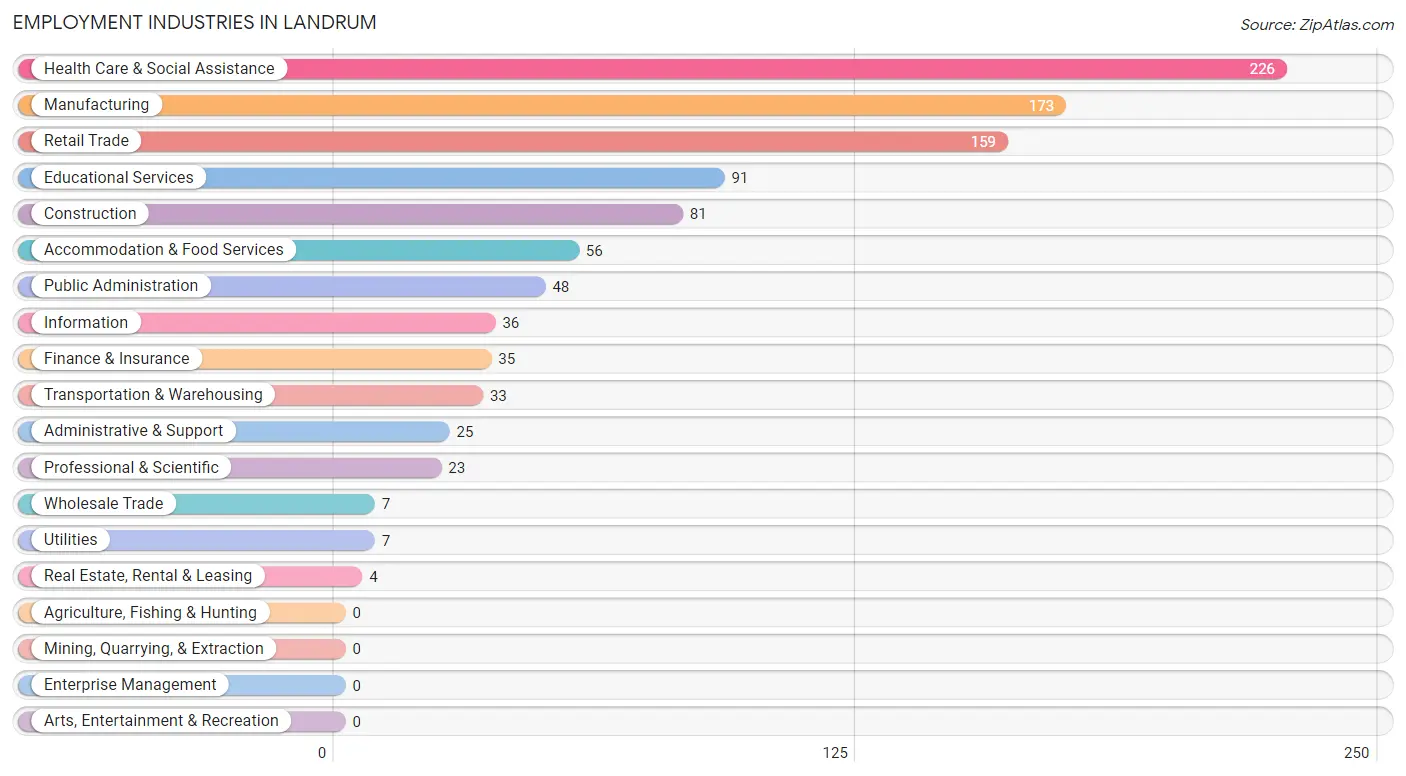
Employment Industries in Landrum
The major employment industries in Landrum include Health Care & Social Assistance (226 | 21.8%), Manufacturing (173 | 16.7%), Retail Trade (159 | 15.3%), Educational Services (91 | 8.8%), and Construction (81 | 7.8%).
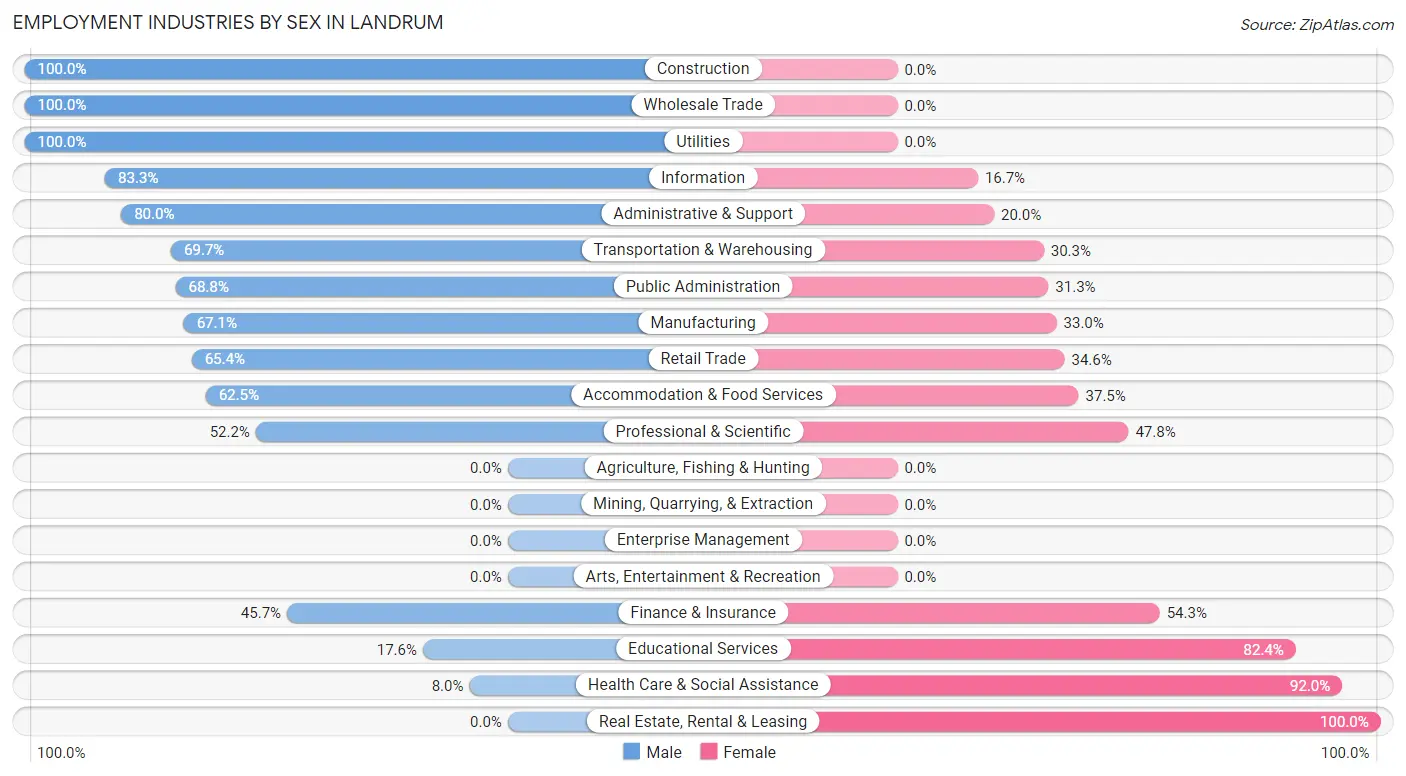
Employment Industries by Sex in Landrum
The Landrum industries that see more men than women are Construction (100.0%), Wholesale Trade (100.0%), and Utilities (100.0%), whereas the industries that tend to have a higher number of women are Real Estate, Rental & Leasing (100.0%), Health Care & Social Assistance (92.0%), and Educational Services (82.4%).
| Industry | Male | Female |
| Agriculture, Fishing & Hunting | 0 (0.0%) | 0 (0.0%) |
| Mining, Quarrying, & Extraction | 0 (0.0%) | 0 (0.0%) |
| Construction | 81 (100.0%) | 0 (0.0%) |
| Manufacturing | 116 (67.0%) | 57 (33.0%) |
| Wholesale Trade | 7 (100.0%) | 0 (0.0%) |
| Retail Trade | 104 (65.4%) | 55 (34.6%) |
| Transportation & Warehousing | 23 (69.7%) | 10 (30.3%) |
| Utilities | 7 (100.0%) | 0 (0.0%) |
| Information | 30 (83.3%) | 6 (16.7%) |
| Finance & Insurance | 16 (45.7%) | 19 (54.3%) |
| Real Estate, Rental & Leasing | 0 (0.0%) | 4 (100.0%) |
| Professional & Scientific | 12 (52.2%) | 11 (47.8%) |
| Enterprise Management | 0 (0.0%) | 0 (0.0%) |
| Administrative & Support | 20 (80.0%) | 5 (20.0%) |
| Educational Services | 16 (17.6%) | 75 (82.4%) |
| Health Care & Social Assistance | 18 (8.0%) | 208 (92.0%) |
| Arts, Entertainment & Recreation | 0 (0.0%) | 0 (0.0%) |
| Accommodation & Food Services | 35 (62.5%) | 21 (37.5%) |
| Public Administration | 33 (68.8%) | 15 (31.2%) |
| Total | 530 (51.1%) | 507 (48.9%) |
Education in Landrum
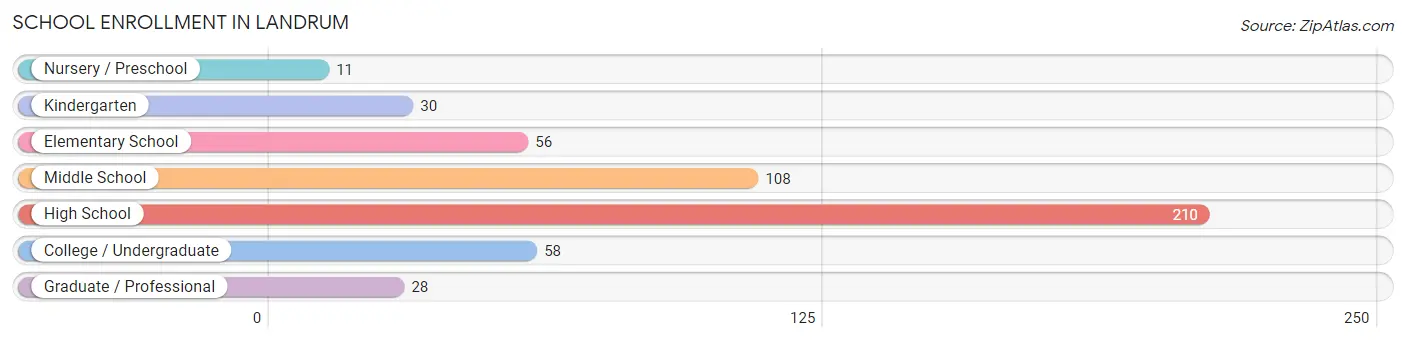
School Enrollment in Landrum
The most common levels of schooling among the 501 students in Landrum are high school (210 | 41.9%), middle school (108 | 21.6%), and college / undergraduate (58 | 11.6%).
| School Level | # Students | % Students |
| Nursery / Preschool | 11 | 2.2% |
| Kindergarten | 30 | 6.0% |
| Elementary School | 56 | 11.2% |
| Middle School | 108 | 21.6% |
| High School | 210 | 41.9% |
| College / Undergraduate | 58 | 11.6% |
| Graduate / Professional | 28 | 5.6% |
| Total | 501 | 100.0% |
School Enrollment by Age by Funding Source in Landrum
Out of a total of 501 students who are enrolled in schools in Landrum, 99 (19.8%) attend a private institution, while the remaining 402 (80.2%) are enrolled in public schools. The age group of 20 to 24 year olds has the highest likelihood of being enrolled in private schools, with 18 (100.0% in the age bracket) enrolled. Conversely, the age group of 3 to 4 year olds has the lowest likelihood of being enrolled in a private school, with 5 (100.0% in the age bracket) attending a public institution.
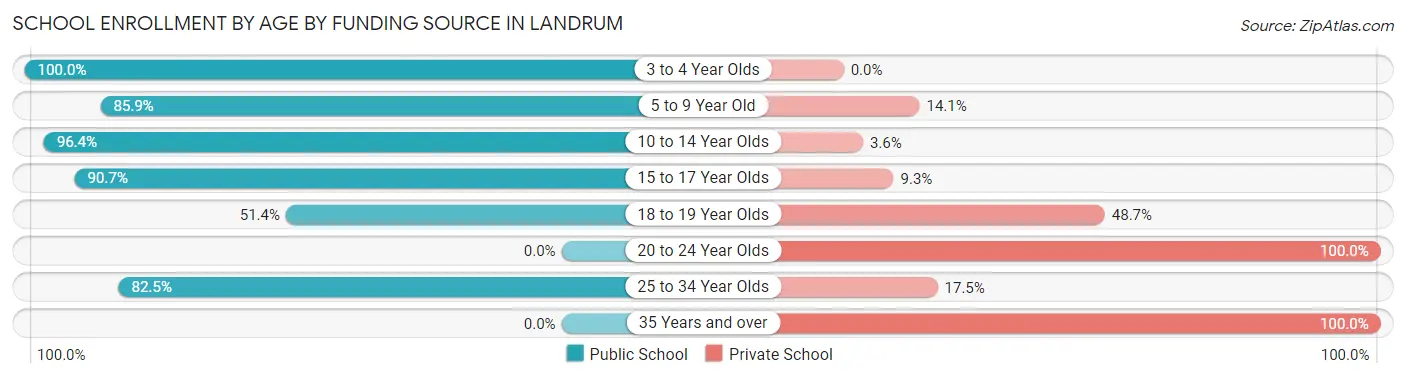
| Age Bracket | Public School | Private School |
| 3 to 4 Year Olds | 5 (100.0%) | 0 (0.0%) |
| 5 to 9 Year Old | 79 (85.9%) | 13 (14.1%) |
| 10 to 14 Year Olds | 188 (96.4%) | 7 (3.6%) |
| 15 to 17 Year Olds | 78 (90.7%) | 8 (9.3%) |
| 18 to 19 Year Olds | 19 (51.3%) | 18 (48.6%) |
| 20 to 24 Year Olds | 0 (0.0%) | 18 (100.0%) |
| 25 to 34 Year Olds | 33 (82.5%) | 7 (17.5%) |
| 35 Years and over | 0 (0.0%) | 28 (100.0%) |
| Total | 402 (80.2%) | 99 (19.8%) |
Educational Attainment by Field of Study in Landrum
Science & technology (55 | 11.7%), engineering (53 | 11.3%), education (52 | 11.0%), literature & languages (52 | 11.0%), and business (50 | 10.6%) are the most common fields of study among 471 individuals in Landrum who have obtained a bachelor's degree or higher.
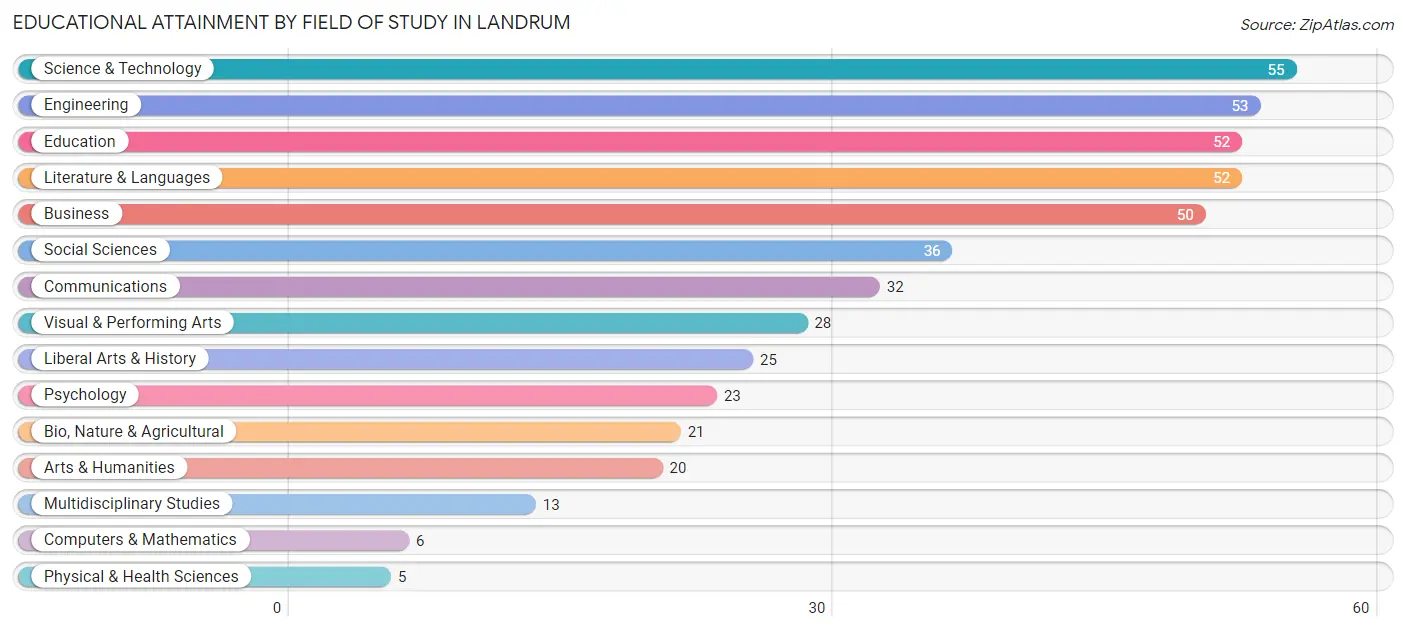
| Field of Study | # Graduates | % Graduates |
| Computers & Mathematics | 6 | 1.3% |
| Bio, Nature & Agricultural | 21 | 4.5% |
| Physical & Health Sciences | 5 | 1.1% |
| Psychology | 23 | 4.9% |
| Social Sciences | 36 | 7.6% |
| Engineering | 53 | 11.3% |
| Multidisciplinary Studies | 13 | 2.8% |
| Science & Technology | 55 | 11.7% |
| Business | 50 | 10.6% |
| Education | 52 | 11.0% |
| Literature & Languages | 52 | 11.0% |
| Liberal Arts & History | 25 | 5.3% |
| Visual & Performing Arts | 28 | 5.9% |
| Communications | 32 | 6.8% |
| Arts & Humanities | 20 | 4.3% |
| Total | 471 | 100.0% |
Transportation & Commute in Landrum
Vehicle Availability by Sex in Landrum
The most prevalent vehicle ownership categories in Landrum are males with 3 vehicles (189, accounting for 39.0%) and females with 3 vehicles (173, making up 37.9%).
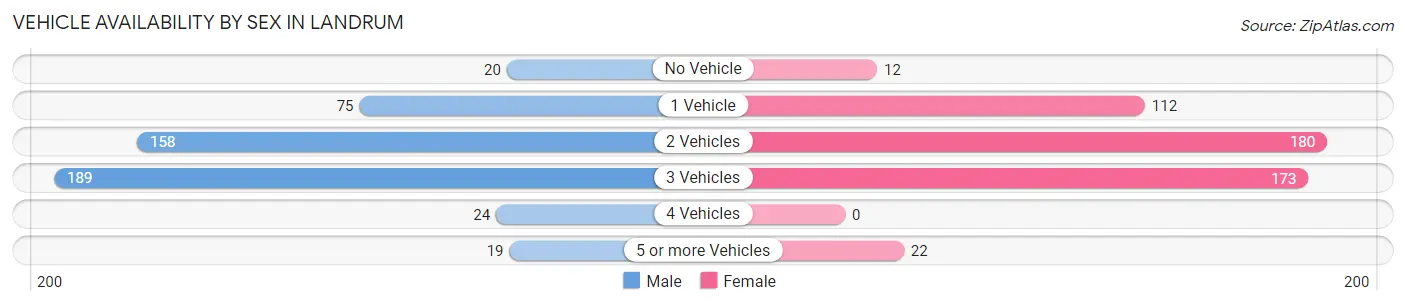
| Vehicles Available | Male | Female |
| No Vehicle | 20 (4.1%) | 12 (2.4%) |
| 1 Vehicle | 75 (15.5%) | 112 (22.4%) |
| 2 Vehicles | 158 (32.6%) | 180 (36.1%) |
| 3 Vehicles | 189 (39.0%) | 173 (34.7%) |
| 4 Vehicles | 24 (5.0%) | 0 (0.0%) |
| 5 or more Vehicles | 19 (3.9%) | 22 (4.4%) |
| Total | 485 (100.0%) | 499 (100.0%) |
Commute Time in Landrum
The most frequently occuring commute durations in Landrum are 30 to 34 minutes (170 commuters, 18.1%), 10 to 14 minutes (138 commuters, 14.7%), and 5 to 9 minutes (130 commuters, 13.8%).
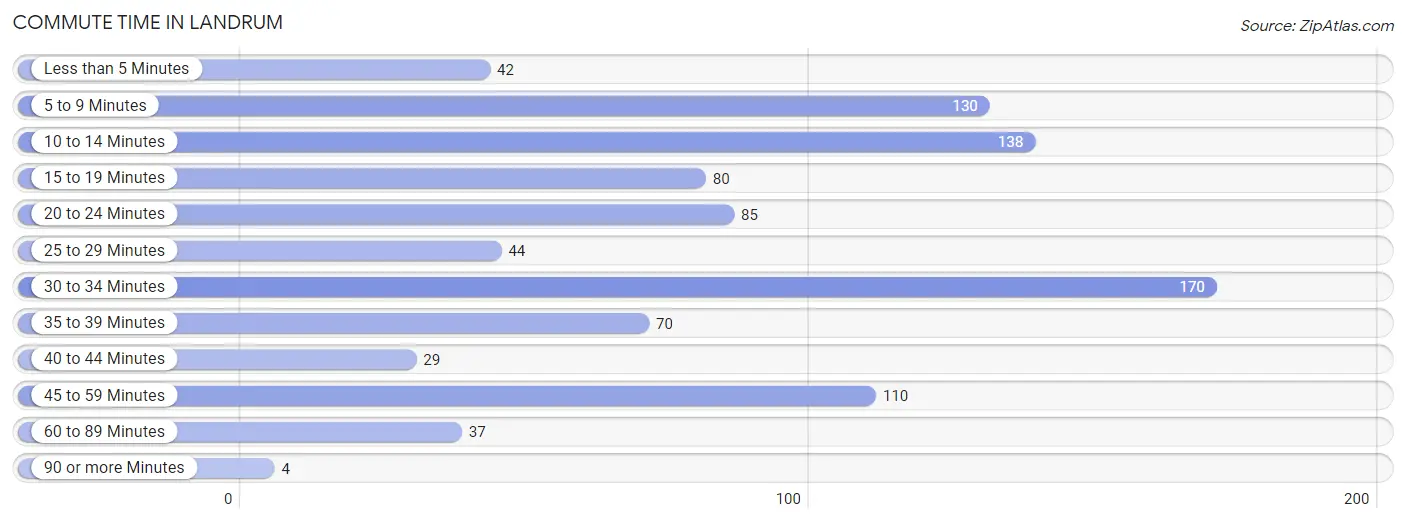
| Commute Time | # Commuters | % Commuters |
| Less than 5 Minutes | 42 | 4.5% |
| 5 to 9 Minutes | 130 | 13.8% |
| 10 to 14 Minutes | 138 | 14.7% |
| 15 to 19 Minutes | 80 | 8.5% |
| 20 to 24 Minutes | 85 | 9.0% |
| 25 to 29 Minutes | 44 | 4.7% |
| 30 to 34 Minutes | 170 | 18.1% |
| 35 to 39 Minutes | 70 | 7.4% |
| 40 to 44 Minutes | 29 | 3.1% |
| 45 to 59 Minutes | 110 | 11.7% |
| 60 to 89 Minutes | 37 | 3.9% |
| 90 or more Minutes | 4 | 0.4% |
Commute Time by Sex in Landrum
The most common commute times in Landrum are 5 to 9 minutes (110 commuters, 23.5%) for males and 30 to 34 minutes (89 commuters, 18.9%) for females.
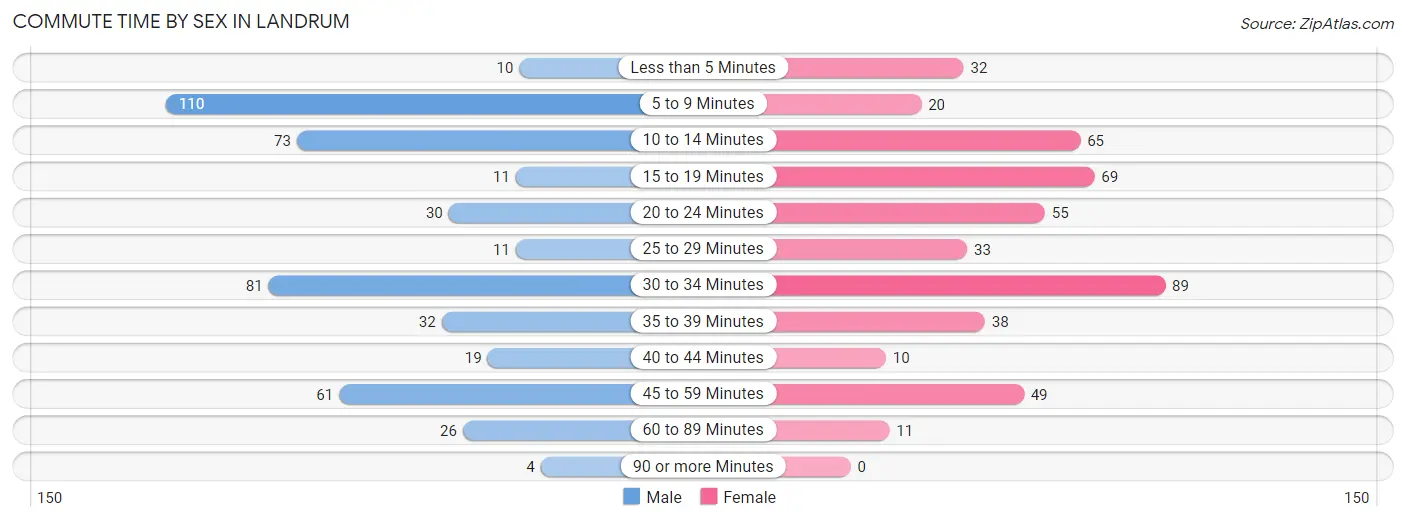
| Commute Time | Male | Female |
| Less than 5 Minutes | 10 (2.1%) | 32 (6.8%) |
| 5 to 9 Minutes | 110 (23.5%) | 20 (4.3%) |
| 10 to 14 Minutes | 73 (15.6%) | 65 (13.8%) |
| 15 to 19 Minutes | 11 (2.4%) | 69 (14.6%) |
| 20 to 24 Minutes | 30 (6.4%) | 55 (11.7%) |
| 25 to 29 Minutes | 11 (2.4%) | 33 (7.0%) |
| 30 to 34 Minutes | 81 (17.3%) | 89 (18.9%) |
| 35 to 39 Minutes | 32 (6.8%) | 38 (8.1%) |
| 40 to 44 Minutes | 19 (4.1%) | 10 (2.1%) |
| 45 to 59 Minutes | 61 (13.0%) | 49 (10.4%) |
| 60 to 89 Minutes | 26 (5.6%) | 11 (2.3%) |
| 90 or more Minutes | 4 (0.9%) | 0 (0.0%) |
Time of Departure to Work by Sex in Landrum
The most frequent times of departure to work in Landrum are 7:00 AM to 7:29 AM (115, 24.6%) for males and 7:30 AM to 7:59 AM (83, 17.6%) for females.
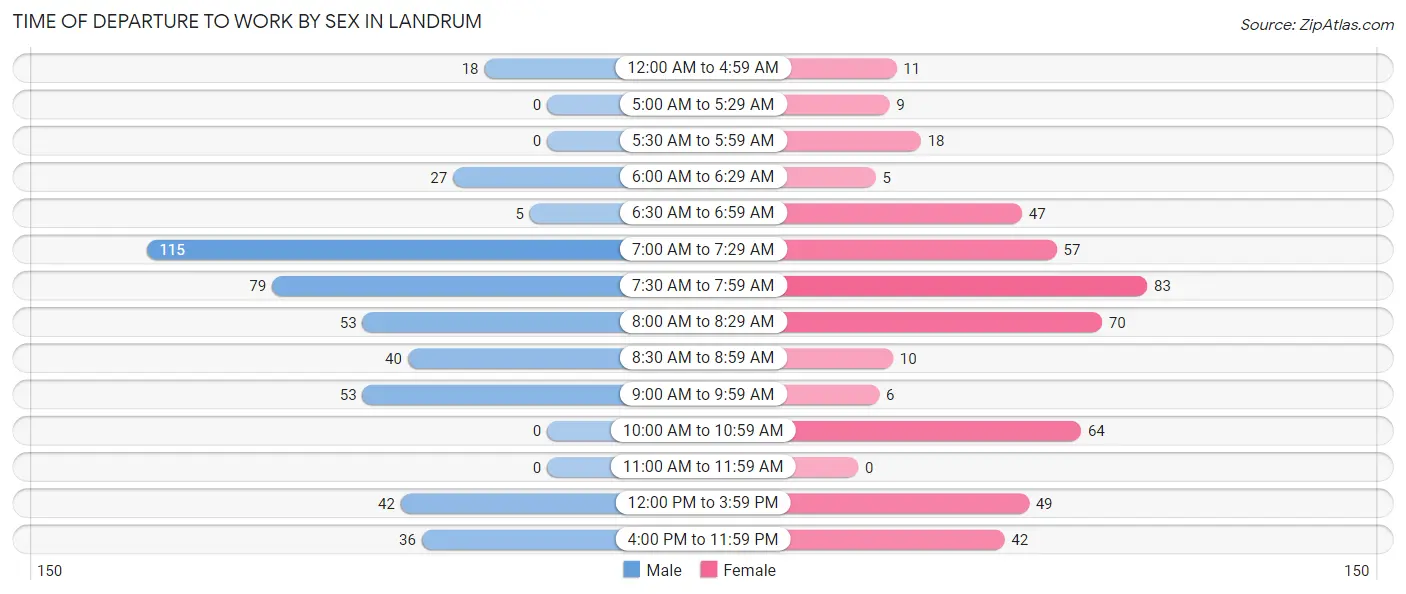
| Time of Departure | Male | Female |
| 12:00 AM to 4:59 AM | 18 (3.8%) | 11 (2.3%) |
| 5:00 AM to 5:29 AM | 0 (0.0%) | 9 (1.9%) |
| 5:30 AM to 5:59 AM | 0 (0.0%) | 18 (3.8%) |
| 6:00 AM to 6:29 AM | 27 (5.8%) | 5 (1.1%) |
| 6:30 AM to 6:59 AM | 5 (1.1%) | 47 (10.0%) |
| 7:00 AM to 7:29 AM | 115 (24.6%) | 57 (12.1%) |
| 7:30 AM to 7:59 AM | 79 (16.9%) | 83 (17.6%) |
| 8:00 AM to 8:29 AM | 53 (11.3%) | 70 (14.9%) |
| 8:30 AM to 8:59 AM | 40 (8.6%) | 10 (2.1%) |
| 9:00 AM to 9:59 AM | 53 (11.3%) | 6 (1.3%) |
| 10:00 AM to 10:59 AM | 0 (0.0%) | 64 (13.6%) |
| 11:00 AM to 11:59 AM | 0 (0.0%) | 0 (0.0%) |
| 12:00 PM to 3:59 PM | 42 (9.0%) | 49 (10.4%) |
| 4:00 PM to 11:59 PM | 36 (7.7%) | 42 (8.9%) |
| Total | 468 (100.0%) | 471 (100.0%) |
Housing Occupancy in Landrum
Occupancy by Ownership in Landrum
Of the total 1,293 dwellings in Landrum, owner-occupied units account for 952 (73.6%), while renter-occupied units make up 341 (26.4%).
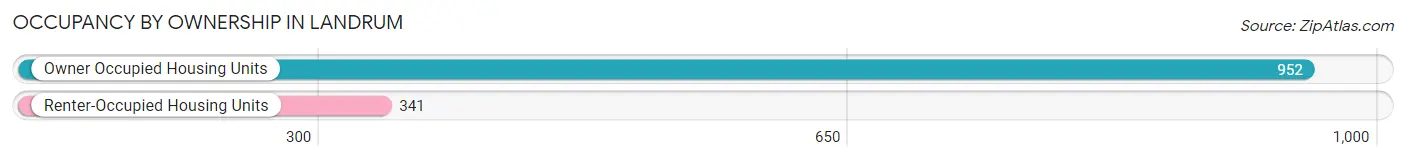
| Occupancy | # Housing Units | % Housing Units |
| Owner Occupied Housing Units | 952 | 73.6% |
| Renter-Occupied Housing Units | 341 | 26.4% |
| Total Occupied Housing Units | 1,293 | 100.0% |
Occupancy by Household Size in Landrum
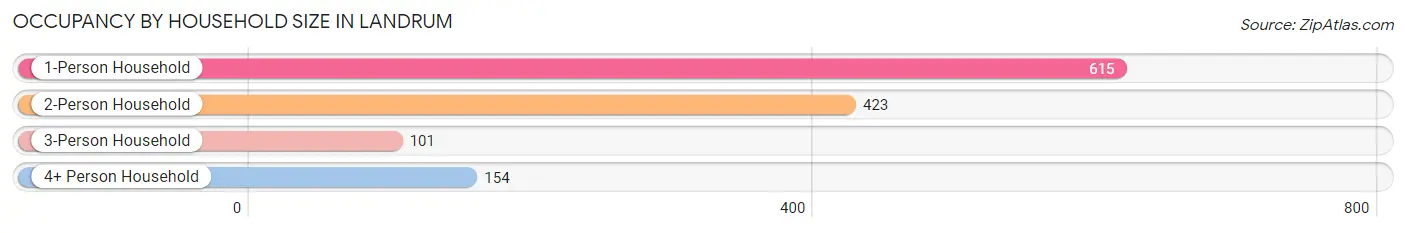
| Household Size | # Housing Units | % Housing Units |
| 1-Person Household | 615 | 47.6% |
| 2-Person Household | 423 | 32.7% |
| 3-Person Household | 101 | 7.8% |
| 4+ Person Household | 154 | 11.9% |
| Total Housing Units | 1,293 | 100.0% |
Occupancy by Ownership by Household Size in Landrum
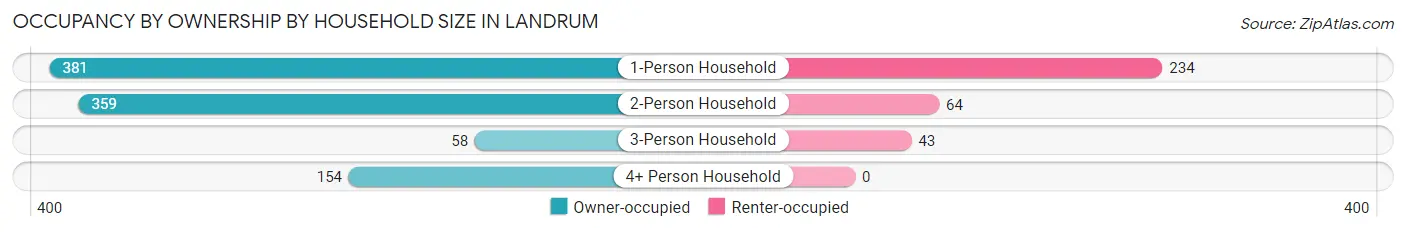
| Household Size | Owner-occupied | Renter-occupied |
| 1-Person Household | 381 (62.0%) | 234 (38.1%) |
| 2-Person Household | 359 (84.9%) | 64 (15.1%) |
| 3-Person Household | 58 (57.4%) | 43 (42.6%) |
| 4+ Person Household | 154 (100.0%) | 0 (0.0%) |
| Total Housing Units | 952 (73.6%) | 341 (26.4%) |
Occupancy by Educational Attainment in Landrum
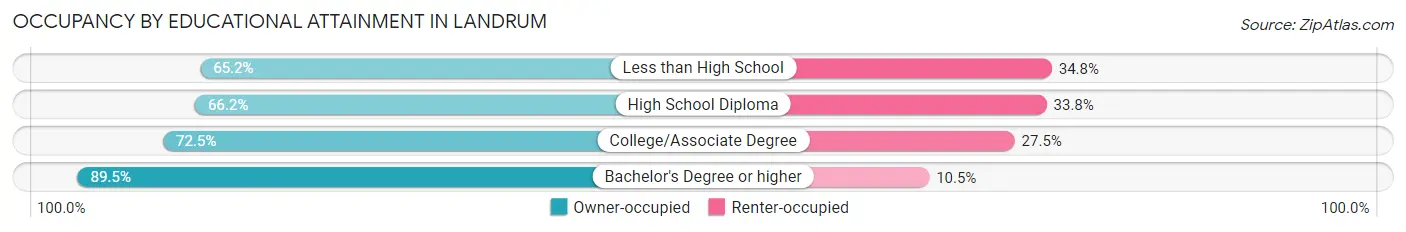
| Household Size | Owner-occupied | Renter-occupied |
| Less than High School | 73 (65.2%) | 39 (34.8%) |
| High School Diploma | 290 (66.2%) | 148 (33.8%) |
| College/Associate Degree | 325 (72.5%) | 123 (27.5%) |
| Bachelor's Degree or higher | 264 (89.5%) | 31 (10.5%) |
Occupancy by Age of Householder in Landrum
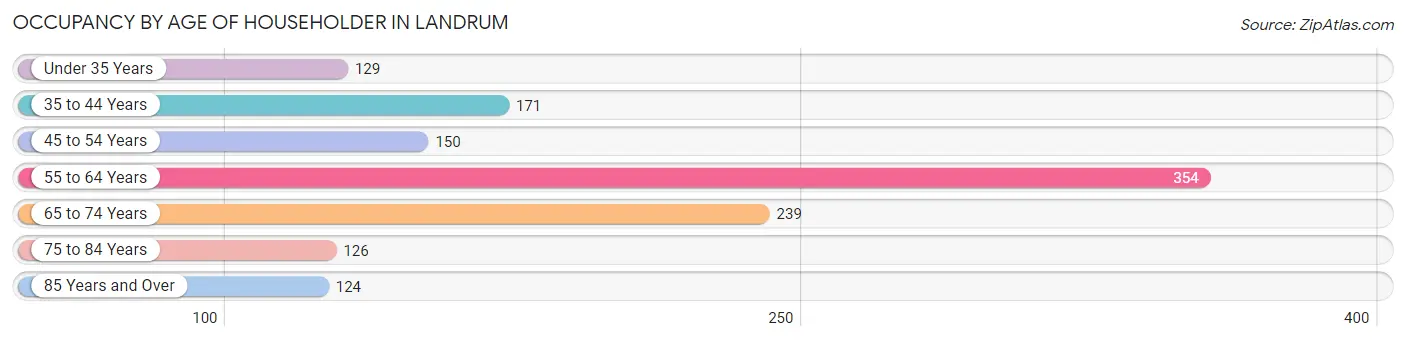
| Age Bracket | # Households | % Households |
| Under 35 Years | 129 | 10.0% |
| 35 to 44 Years | 171 | 13.2% |
| 45 to 54 Years | 150 | 11.6% |
| 55 to 64 Years | 354 | 27.4% |
| 65 to 74 Years | 239 | 18.5% |
| 75 to 84 Years | 126 | 9.7% |
| 85 Years and Over | 124 | 9.6% |
| Total | 1,293 | 100.0% |
Housing Finances in Landrum
Median Income by Occupancy in Landrum
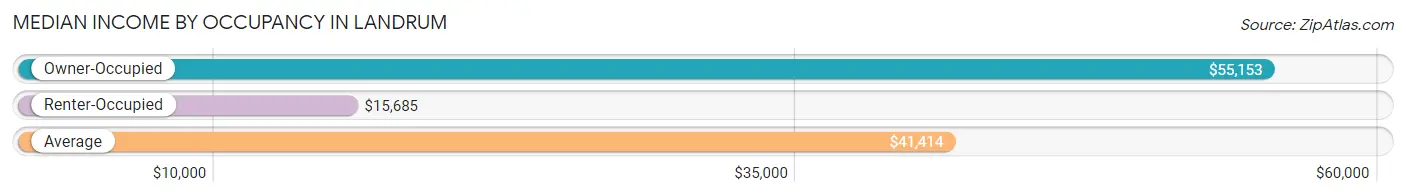
| Occupancy Type | # Households | Median Income |
| Owner-Occupied | 952 (73.6%) | $55,153 |
| Renter-Occupied | 341 (26.4%) | $15,685 |
| Average | 1,293 (100.0%) | $41,414 |
Occupancy by Householder Income Bracket in Landrum
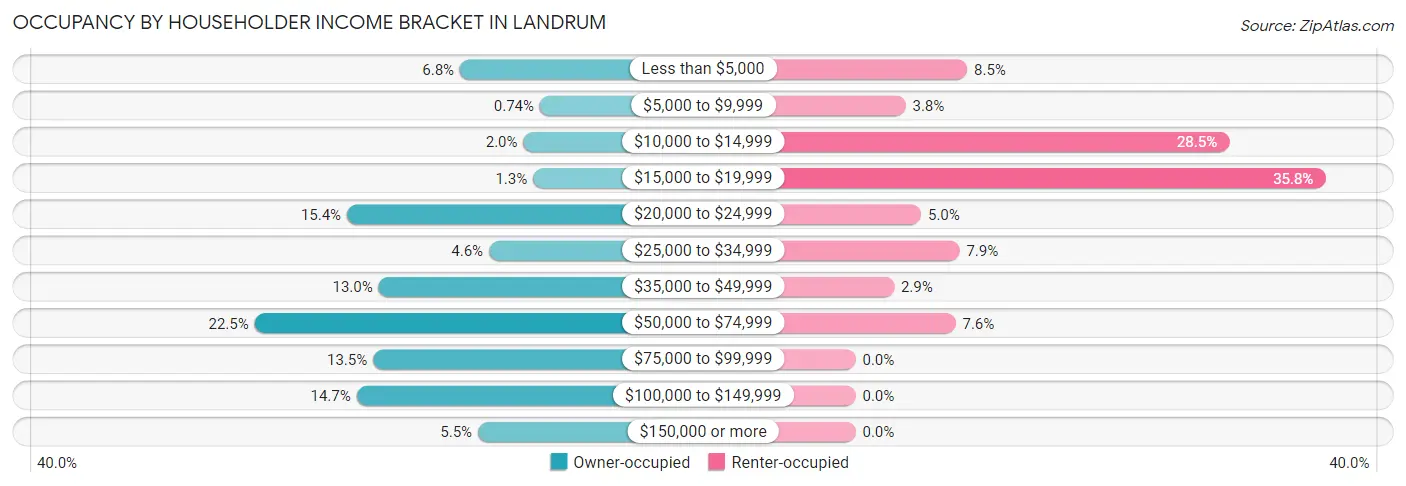
| Income Bracket | Owner-occupied | Renter-occupied |
| Less than $5,000 | 65 (6.8%) | 29 (8.5%) |
| $5,000 to $9,999 | 7 (0.7%) | 13 (3.8%) |
| $10,000 to $14,999 | 19 (2.0%) | 97 (28.4%) |
| $15,000 to $19,999 | 12 (1.3%) | 122 (35.8%) |
| $20,000 to $24,999 | 147 (15.4%) | 17 (5.0%) |
| $25,000 to $34,999 | 44 (4.6%) | 27 (7.9%) |
| $35,000 to $49,999 | 124 (13.0%) | 10 (2.9%) |
| $50,000 to $74,999 | 214 (22.5%) | 26 (7.6%) |
| $75,000 to $99,999 | 128 (13.5%) | 0 (0.0%) |
| $100,000 to $149,999 | 140 (14.7%) | 0 (0.0%) |
| $150,000 or more | 52 (5.5%) | 0 (0.0%) |
| Total | 952 (100.0%) | 341 (100.0%) |
Monthly Housing Cost Tiers in Landrum
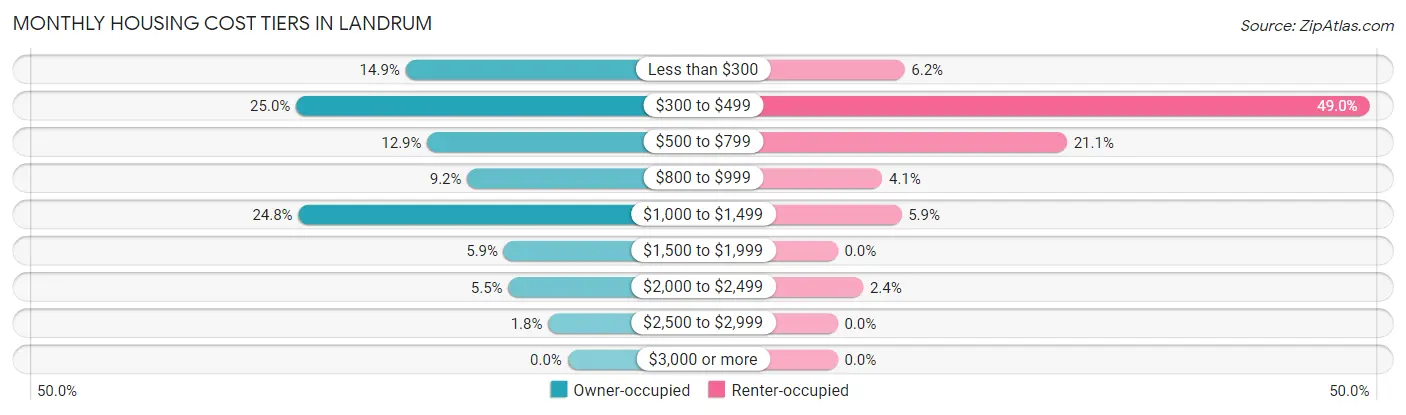
| Monthly Cost | Owner-occupied | Renter-occupied |
| Less than $300 | 142 (14.9%) | 21 (6.2%) |
| $300 to $499 | 238 (25.0%) | 167 (49.0%) |
| $500 to $799 | 123 (12.9%) | 72 (21.1%) |
| $800 to $999 | 88 (9.2%) | 14 (4.1%) |
| $1,000 to $1,499 | 236 (24.8%) | 20 (5.9%) |
| $1,500 to $1,999 | 56 (5.9%) | 0 (0.0%) |
| $2,000 to $2,499 | 52 (5.5%) | 8 (2.4%) |
| $2,500 to $2,999 | 17 (1.8%) | 0 (0.0%) |
| $3,000 or more | 0 (0.0%) | 0 (0.0%) |
| Total | 952 (100.0%) | 341 (100.0%) |
Physical Housing Characteristics in Landrum
Housing Structures in Landrum
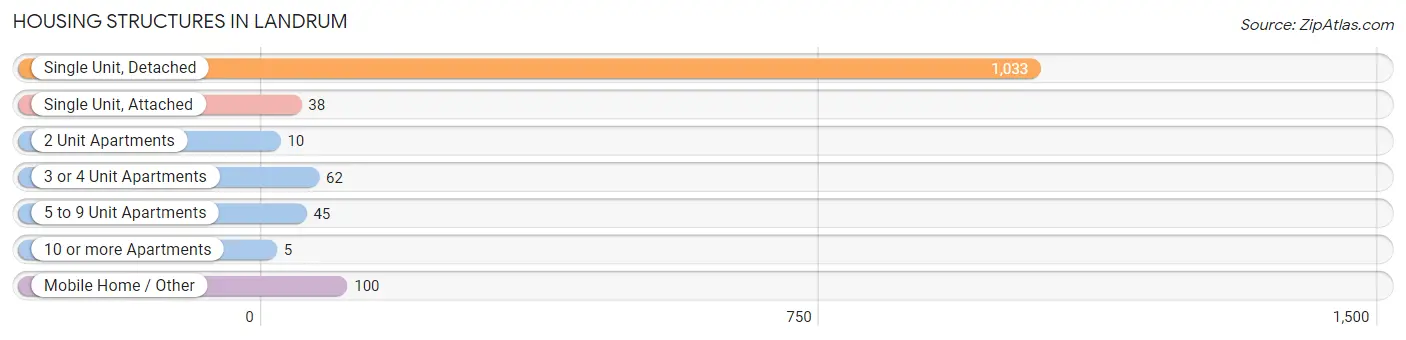
| Structure Type | # Housing Units | % Housing Units |
| Single Unit, Detached | 1,033 | 79.9% |
| Single Unit, Attached | 38 | 2.9% |
| 2 Unit Apartments | 10 | 0.8% |
| 3 or 4 Unit Apartments | 62 | 4.8% |
| 5 to 9 Unit Apartments | 45 | 3.5% |
| 10 or more Apartments | 5 | 0.4% |
| Mobile Home / Other | 100 | 7.7% |
| Total | 1,293 | 100.0% |
Housing Structures by Occupancy in Landrum
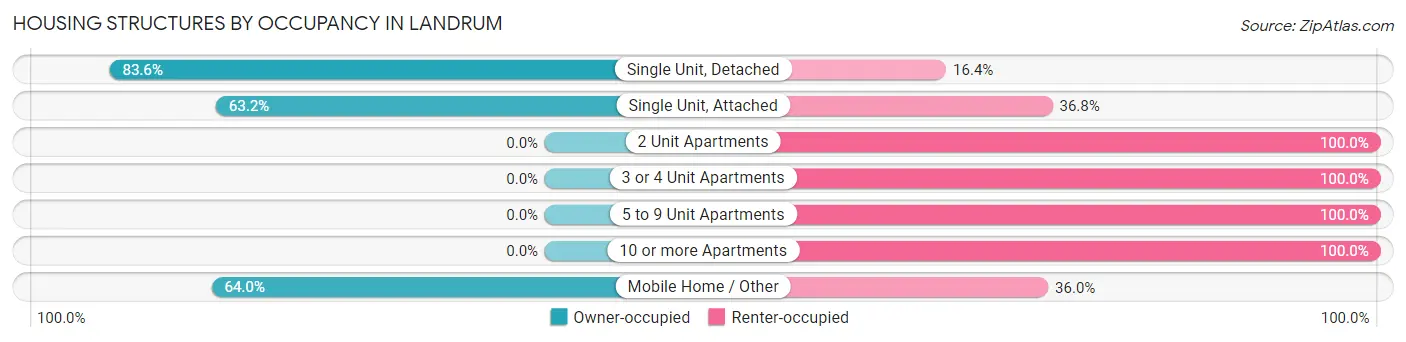
| Structure Type | Owner-occupied | Renter-occupied |
| Single Unit, Detached | 864 (83.6%) | 169 (16.4%) |
| Single Unit, Attached | 24 (63.2%) | 14 (36.8%) |
| 2 Unit Apartments | 0 (0.0%) | 10 (100.0%) |
| 3 or 4 Unit Apartments | 0 (0.0%) | 62 (100.0%) |
| 5 to 9 Unit Apartments | 0 (0.0%) | 45 (100.0%) |
| 10 or more Apartments | 0 (0.0%) | 5 (100.0%) |
| Mobile Home / Other | 64 (64.0%) | 36 (36.0%) |
| Total | 952 (73.6%) | 341 (26.4%) |
Housing Structures by Number of Rooms in Landrum
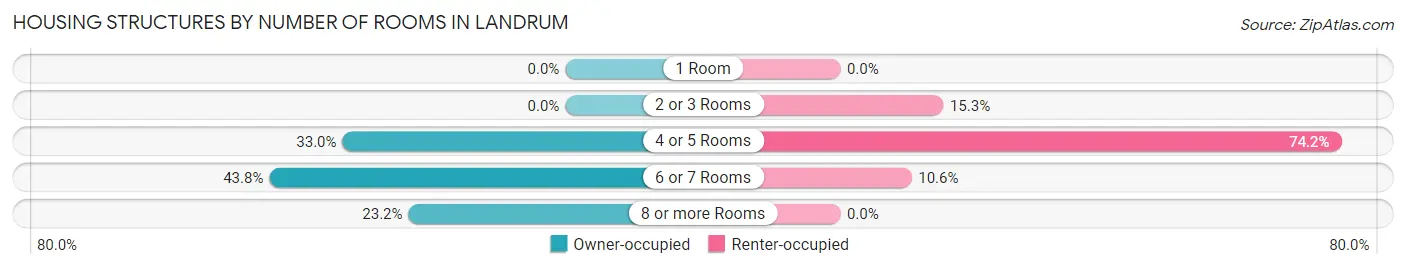
| Number of Rooms | Owner-occupied | Renter-occupied |
| 1 Room | 0 (0.0%) | 0 (0.0%) |
| 2 or 3 Rooms | 0 (0.0%) | 52 (15.2%) |
| 4 or 5 Rooms | 314 (33.0%) | 253 (74.2%) |
| 6 or 7 Rooms | 417 (43.8%) | 36 (10.6%) |
| 8 or more Rooms | 221 (23.2%) | 0 (0.0%) |
| Total | 952 (100.0%) | 341 (100.0%) |
Housing Structure by Heating Type in Landrum
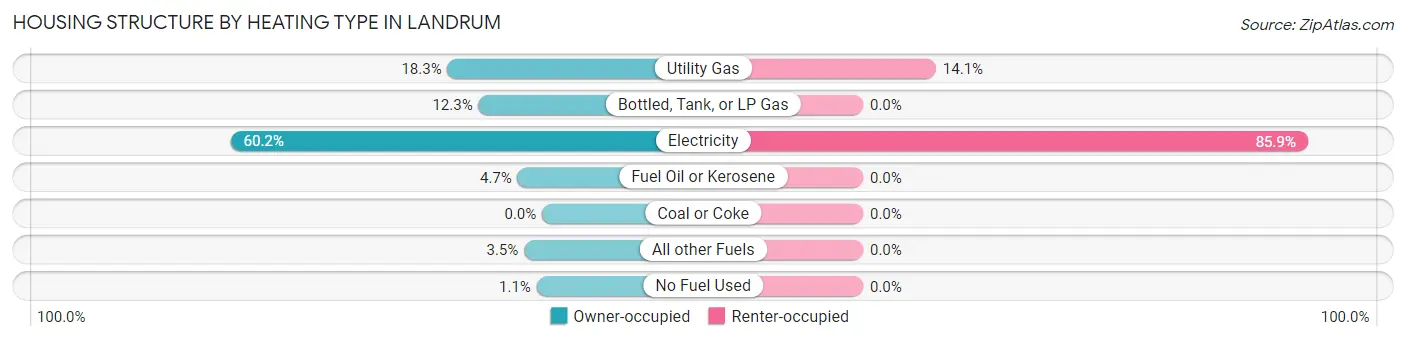
| Heating Type | Owner-occupied | Renter-occupied |
| Utility Gas | 174 (18.3%) | 48 (14.1%) |
| Bottled, Tank, or LP Gas | 117 (12.3%) | 0 (0.0%) |
| Electricity | 573 (60.2%) | 293 (85.9%) |
| Fuel Oil or Kerosene | 45 (4.7%) | 0 (0.0%) |
| Coal or Coke | 0 (0.0%) | 0 (0.0%) |
| All other Fuels | 33 (3.5%) | 0 (0.0%) |
| No Fuel Used | 10 (1.1%) | 0 (0.0%) |
| Total | 952 (100.0%) | 341 (100.0%) |
Household Vehicle Usage in Landrum
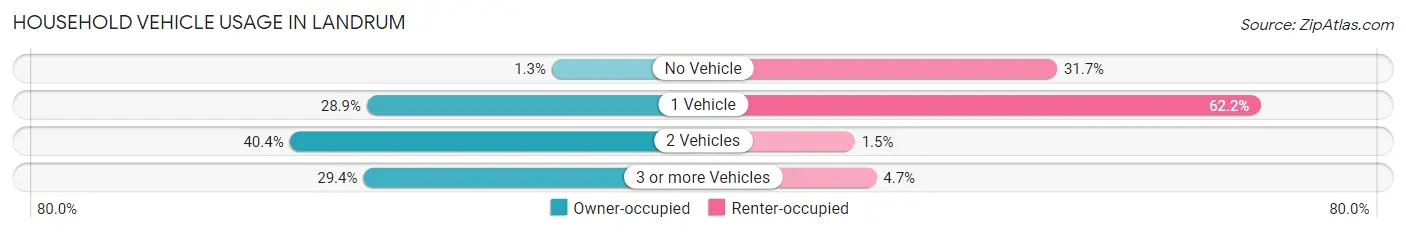
| Vehicles per Household | Owner-occupied | Renter-occupied |
| No Vehicle | 12 (1.3%) | 108 (31.7%) |
| 1 Vehicle | 275 (28.9%) | 212 (62.2%) |
| 2 Vehicles | 385 (40.4%) | 5 (1.5%) |
| 3 or more Vehicles | 280 (29.4%) | 16 (4.7%) |
| Total | 952 (100.0%) | 341 (100.0%) |
Real Estate & Mortgages in Landrum
Real Estate and Mortgage Overview in Landrum
| Characteristic | Without Mortgage | With Mortgage |
| Housing Units | 495 | 457 |
| Median Property Value | $175,900 | $180,100 |
| Median Household Income | $38,125 | $39 |
| Monthly Housing Costs | $337 | $0 |
| Real Estate Taxes | $769 | $9 |
Property Value by Mortgage Status in Landrum
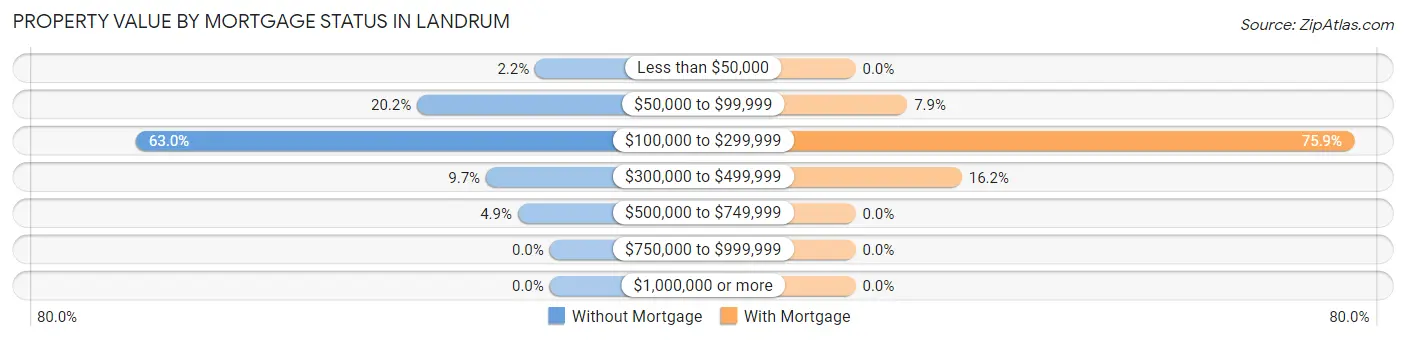
| Property Value | Without Mortgage | With Mortgage |
| Less than $50,000 | 11 (2.2%) | 0 (0.0%) |
| $50,000 to $99,999 | 100 (20.2%) | 36 (7.9%) |
| $100,000 to $299,999 | 312 (63.0%) | 347 (75.9%) |
| $300,000 to $499,999 | 48 (9.7%) | 74 (16.2%) |
| $500,000 to $749,999 | 24 (4.9%) | 0 (0.0%) |
| $750,000 to $999,999 | 0 (0.0%) | 0 (0.0%) |
| $1,000,000 or more | 0 (0.0%) | 0 (0.0%) |
| Total | 495 (100.0%) | 457 (100.0%) |
Household Income by Mortgage Status in Landrum
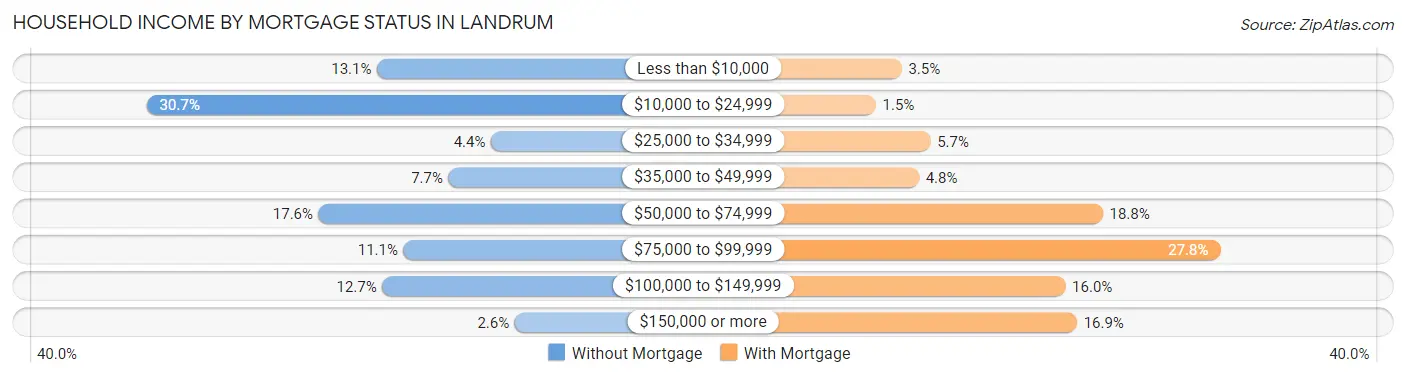
| Household Income | Without Mortgage | With Mortgage |
| Less than $10,000 | 65 (13.1%) | 16 (3.5%) |
| $10,000 to $24,999 | 152 (30.7%) | 7 (1.5%) |
| $25,000 to $34,999 | 22 (4.4%) | 26 (5.7%) |
| $35,000 to $49,999 | 38 (7.7%) | 22 (4.8%) |
| $50,000 to $74,999 | 87 (17.6%) | 86 (18.8%) |
| $75,000 to $99,999 | 55 (11.1%) | 127 (27.8%) |
| $100,000 to $149,999 | 63 (12.7%) | 73 (16.0%) |
| $150,000 or more | 13 (2.6%) | 77 (16.9%) |
| Total | 495 (100.0%) | 457 (100.0%) |
Property Value to Household Income Ratio in Landrum
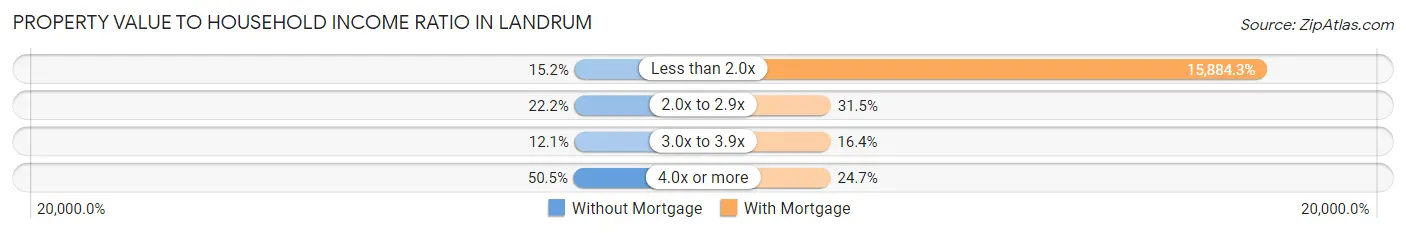
| Value-to-Income Ratio | Without Mortgage | With Mortgage |
| Less than 2.0x | 75 (15.1%) | 72,591 (15,884.3%) |
| 2.0x to 2.9x | 110 (22.2%) | 144 (31.5%) |
| 3.0x to 3.9x | 60 (12.1%) | 75 (16.4%) |
| 4.0x or more | 250 (50.5%) | 113 (24.7%) |
| Total | 495 (100.0%) | 457 (100.0%) |
Real Estate Taxes by Mortgage Status in Landrum
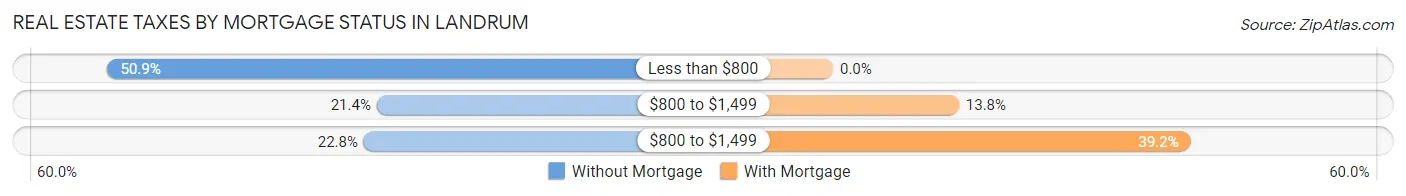
| Property Taxes | Without Mortgage | With Mortgage |
| Less than $800 | 252 (50.9%) | 0 (0.0%) |
| $800 to $1,499 | 106 (21.4%) | 63 (13.8%) |
| $800 to $1,499 | 113 (22.8%) | 179 (39.2%) |
| Total | 495 (100.0%) | 457 (100.0%) |
Health & Disability in Landrum
Health Insurance Coverage by Age in Landrum
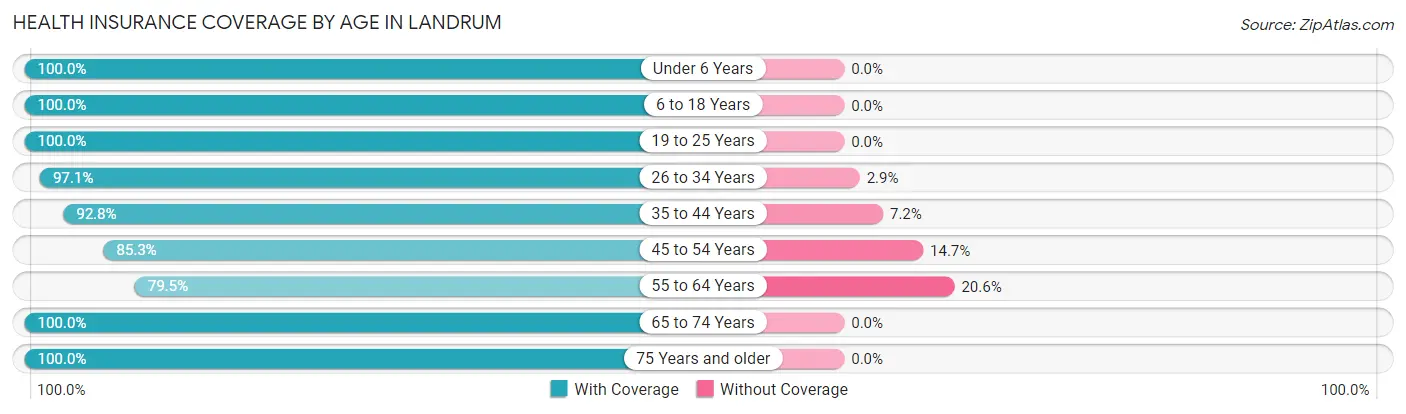
| Age Bracket | With Coverage | Without Coverage |
| Under 6 Years | 123 (100.0%) | 0 (0.0%) |
| 6 to 18 Years | 398 (100.0%) | 0 (0.0%) |
| 19 to 25 Years | 60 (100.0%) | 0 (0.0%) |
| 26 to 34 Years | 236 (97.1%) | 7 (2.9%) |
| 35 to 44 Years | 257 (92.8%) | 20 (7.2%) |
| 45 to 54 Years | 238 (85.3%) | 41 (14.7%) |
| 55 to 64 Years | 348 (79.4%) | 90 (20.5%) |
| 65 to 74 Years | 363 (100.0%) | 0 (0.0%) |
| 75 Years and older | 323 (100.0%) | 0 (0.0%) |
| Total | 2,346 (93.7%) | 158 (6.3%) |
Health Insurance Coverage by Citizenship Status in Landrum
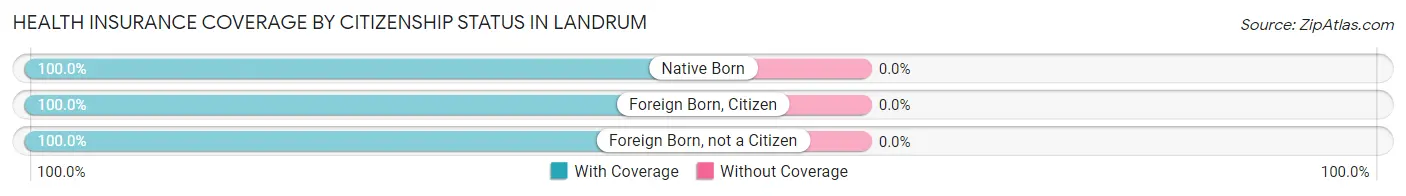
| Citizenship Status | With Coverage | Without Coverage |
| Native Born | 123 (100.0%) | 0 (0.0%) |
| Foreign Born, Citizen | 398 (100.0%) | 0 (0.0%) |
| Foreign Born, not a Citizen | 60 (100.0%) | 0 (0.0%) |
Health Insurance Coverage by Household Income in Landrum
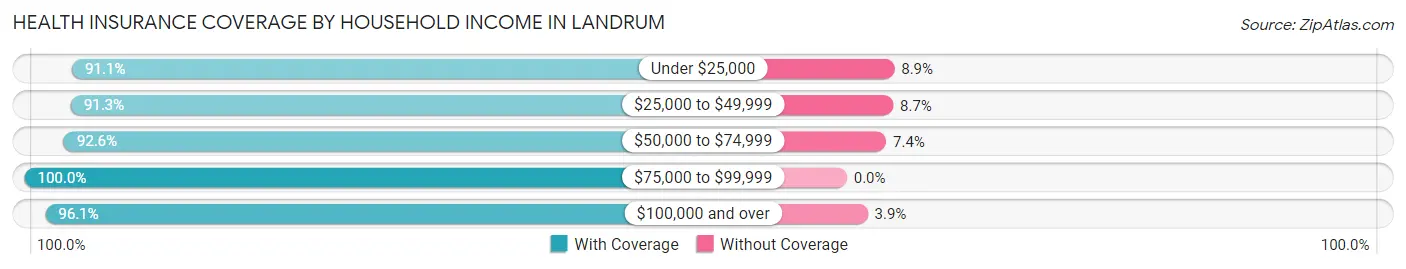
| Household Income | With Coverage | Without Coverage |
| Under $25,000 | 604 (91.1%) | 59 (8.9%) |
| $25,000 to $49,999 | 337 (91.3%) | 32 (8.7%) |
| $50,000 to $74,999 | 529 (92.6%) | 42 (7.4%) |
| $75,000 to $99,999 | 254 (100.0%) | 0 (0.0%) |
| $100,000 and over | 618 (96.1%) | 25 (3.9%) |
Public vs Private Health Insurance Coverage by Age in Landrum
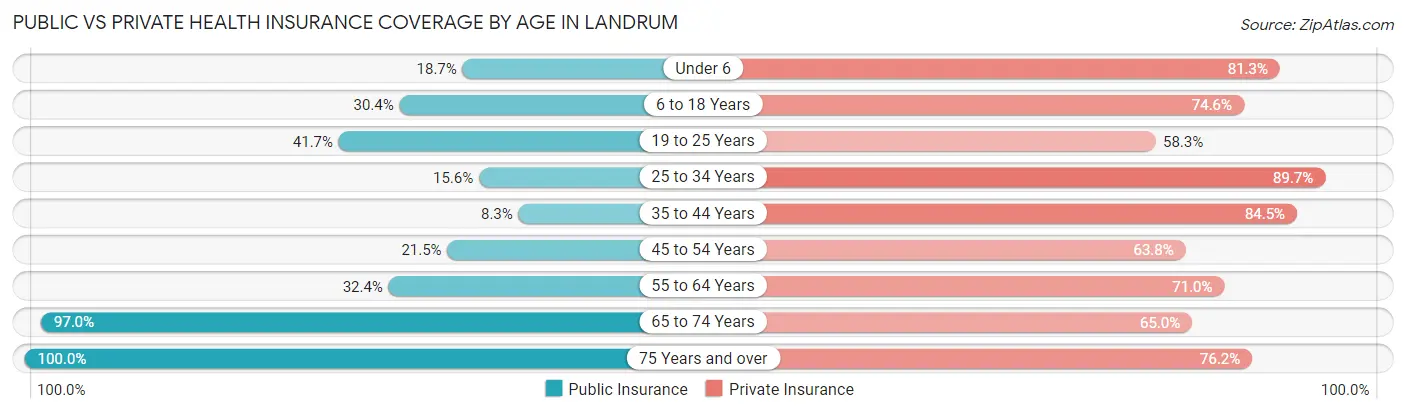
| Age Bracket | Public Insurance | Private Insurance |
| Under 6 | 23 (18.7%) | 100 (81.3%) |
| 6 to 18 Years | 121 (30.4%) | 297 (74.6%) |
| 19 to 25 Years | 25 (41.7%) | 35 (58.3%) |
| 25 to 34 Years | 38 (15.6%) | 218 (89.7%) |
| 35 to 44 Years | 23 (8.3%) | 234 (84.5%) |
| 45 to 54 Years | 60 (21.5%) | 178 (63.8%) |
| 55 to 64 Years | 142 (32.4%) | 311 (71.0%) |
| 65 to 74 Years | 352 (97.0%) | 236 (65.0%) |
| 75 Years and over | 323 (100.0%) | 246 (76.2%) |
| Total | 1,107 (44.2%) | 1,855 (74.1%) |
Disability Status by Sex by Age in Landrum
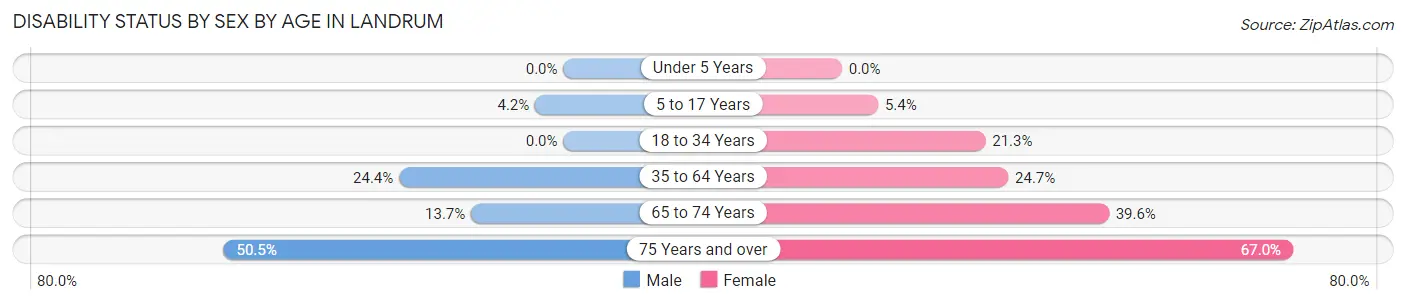
| Age Bracket | Male | Female |
| Under 5 Years | 0 (0.0%) | 0 (0.0%) |
| 5 to 17 Years | 7 (4.2%) | 13 (5.4%) |
| 18 to 34 Years | 0 (0.0%) | 39 (21.3%) |
| 35 to 64 Years | 120 (24.4%) | 124 (24.7%) |
| 65 to 74 Years | 20 (13.7%) | 86 (39.6%) |
| 75 Years and over | 56 (50.4%) | 142 (67.0%) |
Disability Class by Sex by Age in Landrum
Disability Class: Hearing Difficulty
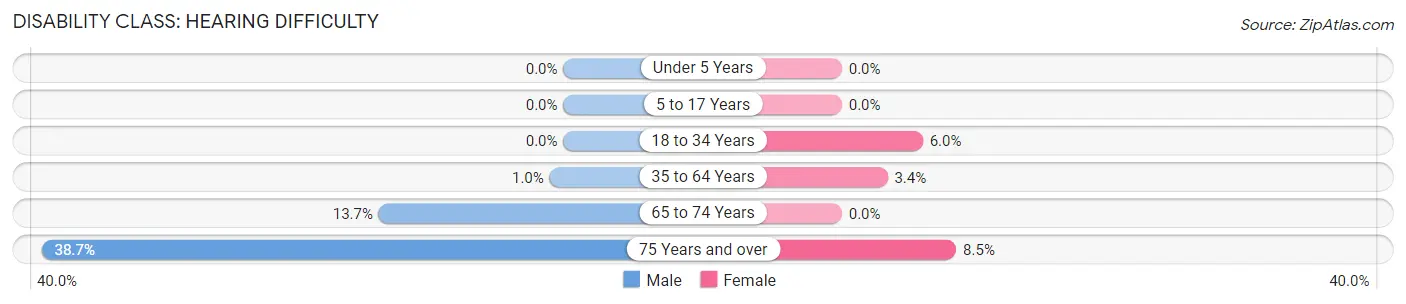
| Age Bracket | Male | Female |
| Under 5 Years | 0 (0.0%) | 0 (0.0%) |
| 5 to 17 Years | 0 (0.0%) | 0 (0.0%) |
| 18 to 34 Years | 0 (0.0%) | 11 (6.0%) |
| 35 to 64 Years | 5 (1.0%) | 17 (3.4%) |
| 65 to 74 Years | 20 (13.7%) | 0 (0.0%) |
| 75 Years and over | 43 (38.7%) | 18 (8.5%) |
Disability Class: Vision Difficulty
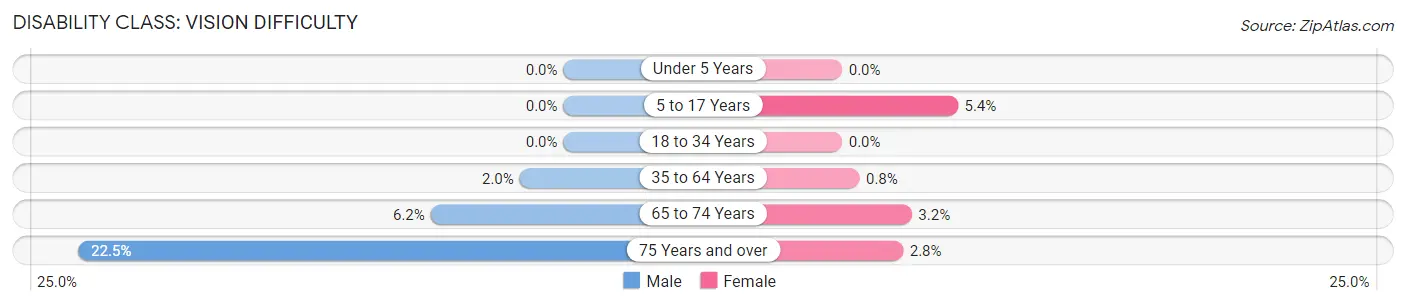
| Age Bracket | Male | Female |
| Under 5 Years | 0 (0.0%) | 0 (0.0%) |
| 5 to 17 Years | 0 (0.0%) | 13 (5.4%) |
| 18 to 34 Years | 0 (0.0%) | 0 (0.0%) |
| 35 to 64 Years | 10 (2.0%) | 4 (0.8%) |
| 65 to 74 Years | 9 (6.2%) | 7 (3.2%) |
| 75 Years and over | 25 (22.5%) | 6 (2.8%) |
Disability Class: Cognitive Difficulty
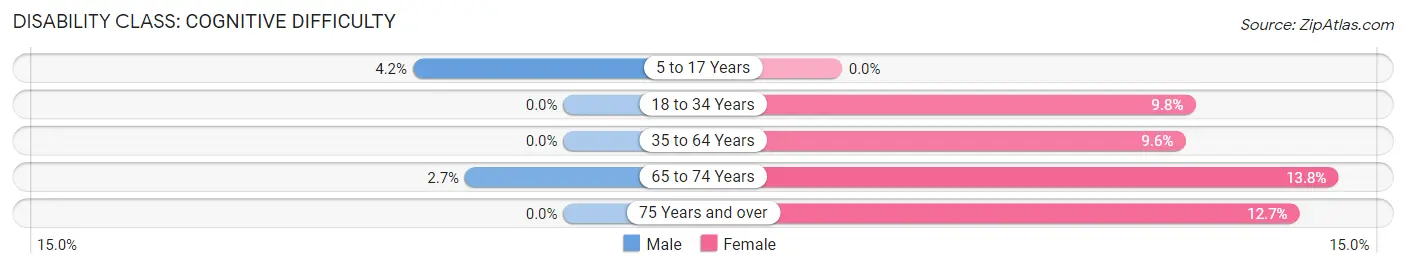
| Age Bracket | Male | Female |
| 5 to 17 Years | 7 (4.2%) | 0 (0.0%) |
| 18 to 34 Years | 0 (0.0%) | 18 (9.8%) |
| 35 to 64 Years | 0 (0.0%) | 48 (9.6%) |
| 65 to 74 Years | 4 (2.7%) | 30 (13.8%) |
| 75 Years and over | 0 (0.0%) | 27 (12.7%) |
Disability Class: Ambulatory Difficulty
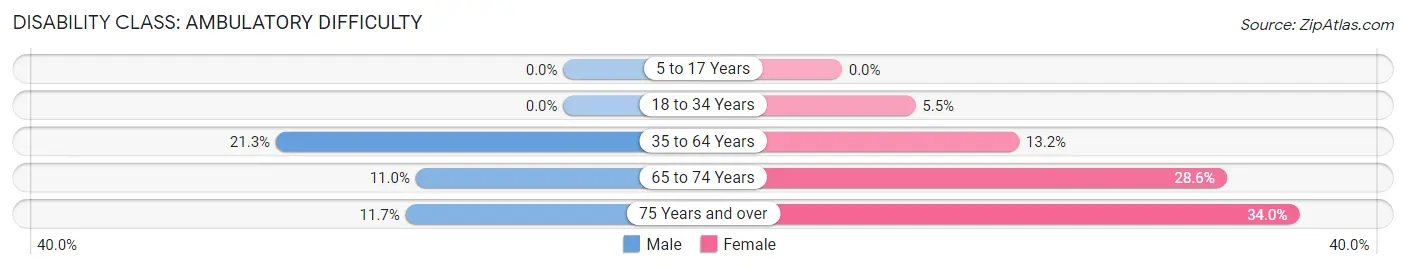
| Age Bracket | Male | Female |
| 5 to 17 Years | 0 (0.0%) | 0 (0.0%) |
| 18 to 34 Years | 0 (0.0%) | 10 (5.5%) |
| 35 to 64 Years | 105 (21.3%) | 66 (13.2%) |
| 65 to 74 Years | 16 (11.0%) | 62 (28.6%) |
| 75 Years and over | 13 (11.7%) | 72 (34.0%) |
Disability Class: Self-Care Difficulty
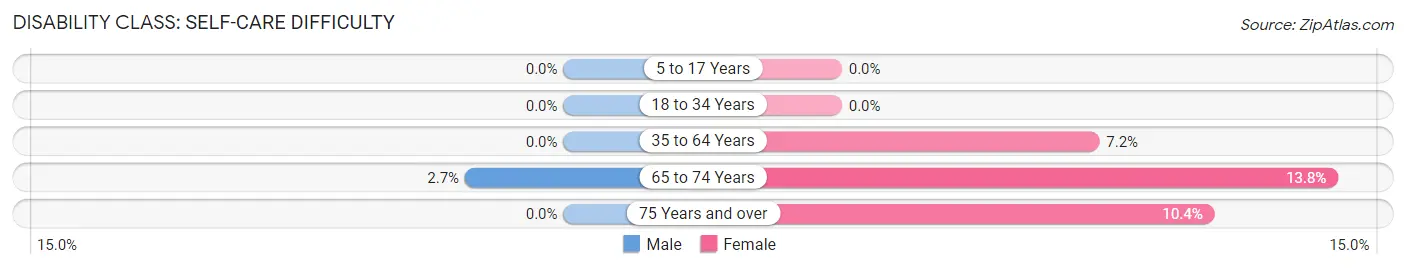
| Age Bracket | Male | Female |
| 5 to 17 Years | 0 (0.0%) | 0 (0.0%) |
| 18 to 34 Years | 0 (0.0%) | 0 (0.0%) |
| 35 to 64 Years | 0 (0.0%) | 36 (7.2%) |
| 65 to 74 Years | 4 (2.7%) | 30 (13.8%) |
| 75 Years and over | 0 (0.0%) | 22 (10.4%) |
Technology Access in Landrum
Computing Device Access in Landrum
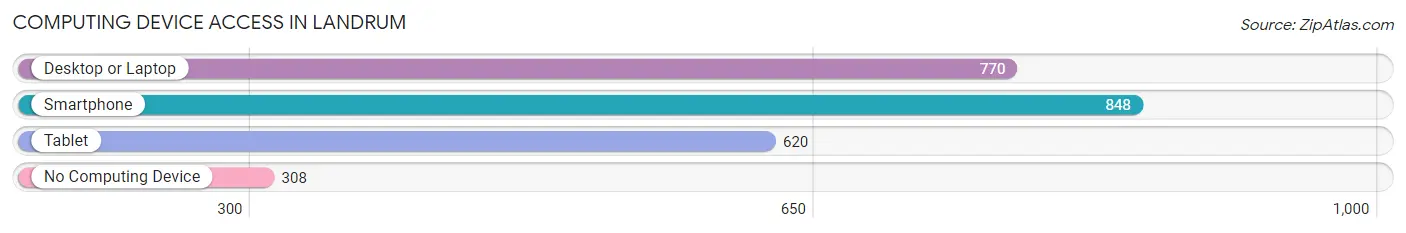
| Device Type | # Households | % Households |
| Desktop or Laptop | 770 | 59.6% |
| Smartphone | 848 | 65.6% |
| Tablet | 620 | 47.9% |
| No Computing Device | 308 | 23.8% |
| Total | 1,293 | 100.0% |
Internet Access in Landrum

| Internet Type | # Households | % Households |
| Dial-Up Internet | 0 | 0.0% |
| Broadband Home | 845 | 65.3% |
| Cellular Data Only | 70 | 5.4% |
| Satellite Internet | 90 | 7.0% |
| No Internet | 336 | 26.0% |
| Total | 1,293 | 100.0% |
Landrum Summary
History
The town of Landrum, South Carolina is located in the foothills of the Blue Ridge Mountains in the Upstate region of the state. It was founded in 1883 by a group of settlers from North Carolina who were looking for a place to settle and start a new life. The town was named after the Landrum family, who were among the first settlers. The town was originally a farming community, but over the years it has grown and developed into a thriving small town.
The town of Landrum has a rich history that dates back to the early 1800s. The first settlers in the area were the Cherokee Indians, who were forced to move to the area after the Indian Removal Act of 1830. The Cherokee were followed by settlers from North Carolina, who began to settle in the area in the 1840s. The town was officially founded in 1883 and was named after the Landrum family, who were among the first settlers.
The town of Landrum has seen many changes over the years. In the early 1900s, the town was a bustling center of commerce and industry, with several mills and factories located in the area. The town also had a thriving agricultural industry, with many farms located in the area. The town was also home to several churches, schools, and other businesses.
In the late 1950s, the town began to experience a decline in population and economic activity. This decline was due to the closing of many of the mills and factories in the area, as well as the decline of the agricultural industry. The town was also affected by the construction of Interstate 26, which bypassed the town and caused many businesses to relocate.
In the late 1980s, the town began to experience a resurgence in population and economic activity. This resurgence was due to the opening of several new businesses in the area, as well as the construction of a new hospital and other medical facilities. The town has also seen an increase in tourism, with many visitors coming to the area to enjoy the natural beauty of the Blue Ridge Mountains.
Geography
Landrum is located in the foothills of the Blue Ridge Mountains in the Upstate region of South Carolina. The town is situated in the Piedmont region of the state, which is characterized by rolling hills and valleys. The town is located in Spartanburg County, and is bordered by the towns of Campobello, Gowensville, and Tryon. The town is located approximately 25 miles from the city of Spartanburg and about 50 miles from the city of Greenville.
The town of Landrum is located at an elevation of 1,000 feet above sea level. The town is located in a temperate climate, with mild winters and hot, humid summers. The average annual temperature is around 60 degrees Fahrenheit, with an average annual precipitation of around 45 inches.
Economy
The economy of Landrum is largely based on agriculture and tourism. The town is home to several farms, which produce a variety of crops, including corn, soybeans, wheat, and hay. The town is also home to several wineries, which produce a variety of wines.
The town is also home to several businesses, including restaurants, retail stores, and other services. The town is also home to several manufacturing companies, which produce a variety of products, including furniture, textiles, and automotive parts.
The town is also home to several tourist attractions, including the Landrum Country Club, the Landrum Historical Museum, and the Landrum Railroad Museum. The town is also home to several parks, including the Landrum City Park and the Landrum Nature Preserve.
Demographics
As of the 2010 census, the town of Landrum had a population of 2,845 people. The population is largely white, with a small percentage of African Americans and Hispanics. The median age of the population is 44.7 years, and the median household income is $41,945. The town has a low unemployment rate of 4.2%.
The town of Landrum is served by the Spartanburg County School District. The town is home to several schools, including Landrum High School, Landrum Middle School, and Landrum Elementary School. The town is also home to several private schools, including Landrum Christian Academy and Landrum Academy.
Common Questions
What is Per Capita Income in Landrum?
Per Capita income in Landrum is $28,182.
What is the Median Family Income in Landrum?
Median Family Income in Landrum is $67,188.
What is the Median Household income in Landrum?
Median Household Income in Landrum is $41,414.
What is Income or Wage Gap in Landrum?
Income or Wage Gap in Landrum is 32.9%.
Women in Landrum earn 67.1 cents for every dollar earned by a man.
What is Inequality or Gini Index in Landrum?
Inequality or Gini Index in Landrum is 0.47.
What is the Total Population of Landrum?
Total Population of Landrum is 2,504.
What is the Total Male Population of Landrum?
Total Male Population of Landrum is 1,123.
What is the Total Female Population of Landrum?
Total Female Population of Landrum is 1,381.
What is the Ratio of Males per 100 Females in Landrum?
There are 81.32 Males per 100 Females in Landrum.
What is the Ratio of Females per 100 Males in Landrum?
There are 122.97 Females per 100 Males in Landrum.
What is the Median Population Age in Landrum?
Median Population Age in Landrum is 49.1 Years.
What is the Average Family Size in Landrum
Average Family Size in Landrum is 2.7 People.
What is the Average Household Size in Landrum
Average Household Size in Landrum is 1.9 People.
How Large is the Labor Force in Landrum?
There are 1,081 People in the Labor Forcein in Landrum.
What is the Percentage of People in the Labor Force in Landrum?
51.6% of People are in the Labor Force in Landrum.
What is the Unemployment Rate in Landrum?
Unemployment Rate in Landrum is 4.2%.