Lake Secession, SC Map & Demographics
Lake Secession Map
Lake Secession Overview
$37,864
PER CAPITA INCOME
$87,006
AVG FAMILY INCOME
$45,759
AVG HOUSEHOLD INCOME
29.1%
WAGE / INCOME GAP [ % ]
70.9¢/ $1
WAGE / INCOME GAP [ $ ]
0.43
INEQUALITY / GINI INDEX
1,246
TOTAL POPULATION
481
MALE POPULATION
765
FEMALE POPULATION
62.88
MALES / 100 FEMALES
159.04
FEMALES / 100 MALES
56.8
MEDIAN AGE
2.8
AVG FAMILY SIZE
2.3
AVG HOUSEHOLD SIZE
479
LABOR FORCE [ PEOPLE ]
44.1%
PERCENT IN LABOR FORCE
6.9%
UNEMPLOYMENT RATE
Income in Lake Secession
Income Overview in Lake Secession
Per Capita Income in Lake Secession is $37,864, while median incomes of families and households are $87,006 and $45,759 respectively.
| Characteristic | Number | Measure |
| Per Capita Income | 1,246 | $37,864 |
| Median Family Income | 357 | $87,006 |
| Mean Family Income | 357 | $106,481 |
| Median Household Income | 547 | $45,759 |
| Mean Household Income | 547 | $85,182 |
| Income Deficit | 357 | $0 |
| Wage / Income Gap (%) | 1,246 | 29.12% |
| Wage / Income Gap ($) | 1,246 | 70.88¢ per $1 |
| Gini / Inequality Index | 1,246 | 0.43 |
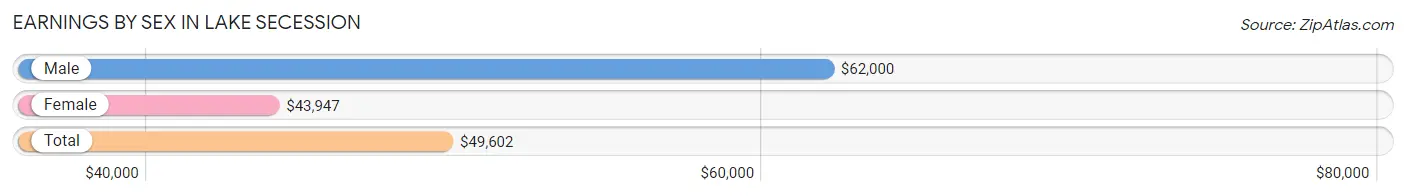
Earnings by Sex in Lake Secession
Average Earnings in Lake Secession are $49,602, $62,000 for men and $43,947 for women, a difference of 29.1%.
| Sex | Number | Average Earnings |
| Male | 222 (42.2%) | $62,000 |
| Female | 304 (57.8%) | $43,947 |
| Total | 526 (100.0%) | $49,602 |
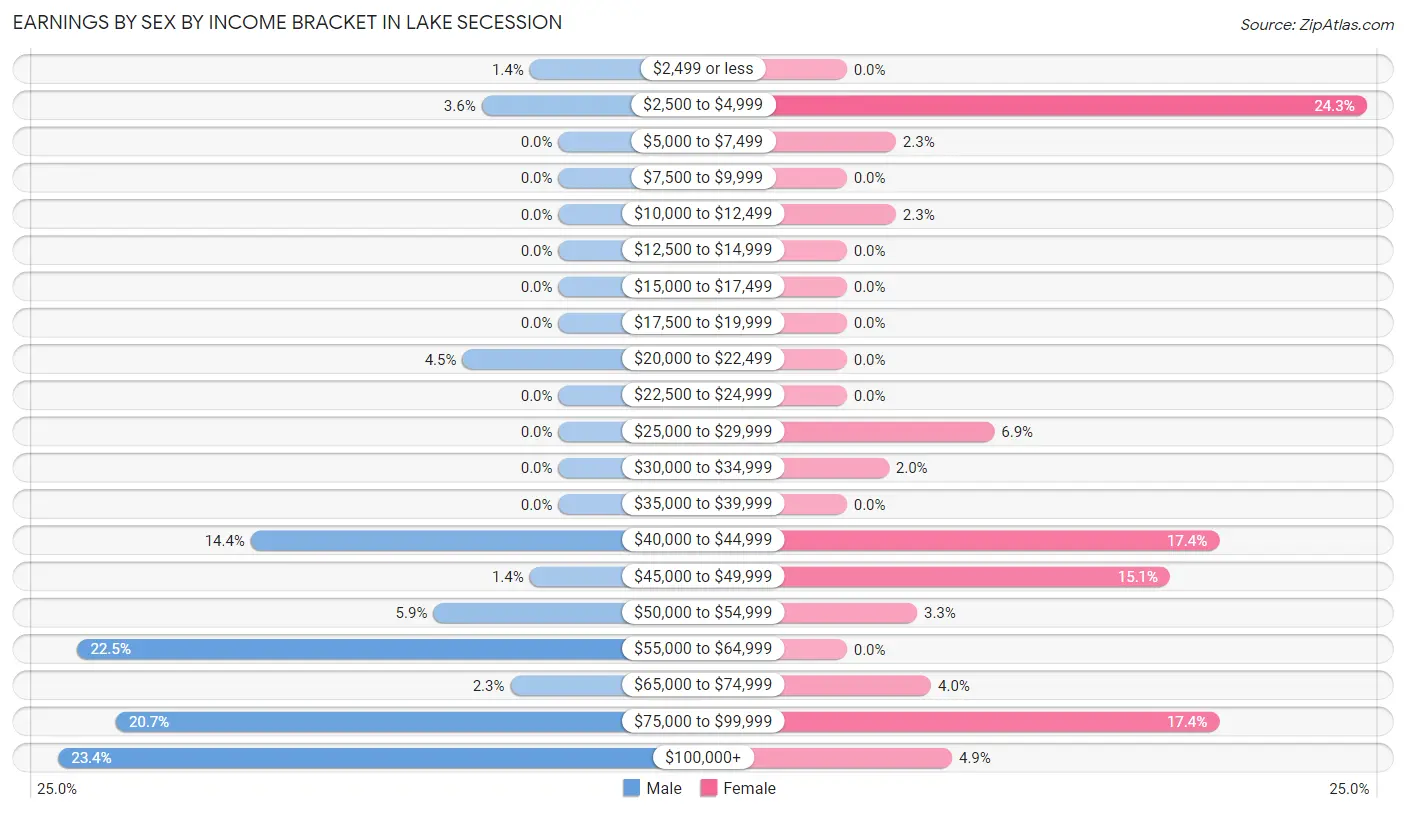
Earnings by Sex by Income Bracket in Lake Secession
The most common earnings brackets in Lake Secession are $100,000+ for men (52 | 23.4%) and $2,500 to $4,999 for women (74 | 24.3%).
| Income | Male | Female |
| $2,499 or less | 3 (1.3%) | 0 (0.0%) |
| $2,500 to $4,999 | 8 (3.6%) | 74 (24.3%) |
| $5,000 to $7,499 | 0 (0.0%) | 7 (2.3%) |
| $7,500 to $9,999 | 0 (0.0%) | 0 (0.0%) |
| $10,000 to $12,499 | 0 (0.0%) | 7 (2.3%) |
| $12,500 to $14,999 | 0 (0.0%) | 0 (0.0%) |
| $15,000 to $17,499 | 0 (0.0%) | 0 (0.0%) |
| $17,500 to $19,999 | 0 (0.0%) | 0 (0.0%) |
| $20,000 to $22,499 | 10 (4.5%) | 0 (0.0%) |
| $22,500 to $24,999 | 0 (0.0%) | 0 (0.0%) |
| $25,000 to $29,999 | 0 (0.0%) | 21 (6.9%) |
| $30,000 to $34,999 | 0 (0.0%) | 6 (2.0%) |
| $35,000 to $39,999 | 0 (0.0%) | 0 (0.0%) |
| $40,000 to $44,999 | 32 (14.4%) | 53 (17.4%) |
| $45,000 to $49,999 | 3 (1.3%) | 46 (15.1%) |
| $50,000 to $54,999 | 13 (5.9%) | 10 (3.3%) |
| $55,000 to $64,999 | 50 (22.5%) | 0 (0.0%) |
| $65,000 to $74,999 | 5 (2.2%) | 12 (4.0%) |
| $75,000 to $99,999 | 46 (20.7%) | 53 (17.4%) |
| $100,000+ | 52 (23.4%) | 15 (4.9%) |
| Total | 222 (100.0%) | 304 (100.0%) |
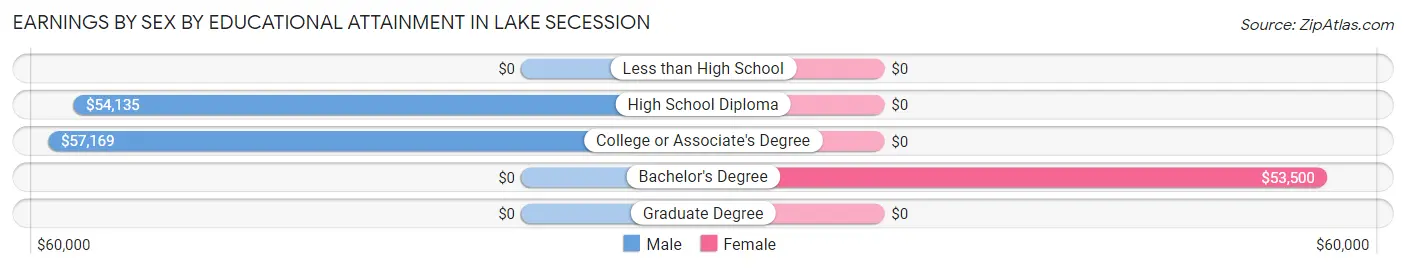
Earnings by Sex by Educational Attainment in Lake Secession
Average earnings in Lake Secession are $62,000 for men and $48,415 for women, a difference of 21.9%. Men with an educational attainment of college or associate's degree enjoy the highest average annual earnings of $57,169, while those with high school diploma education earn the least with $54,135. Women with an educational attainment of bachelor's degree earn the most with the average annual earnings of $53,500, while those with bachelor's degree education have the smallest earnings of $53,500.
| Educational Attainment | Male Income | Female Income |
| Less than High School | - | - |
| High School Diploma | $54,135 | $0 |
| College or Associate's Degree | $57,169 | $0 |
| Bachelor's Degree | - | - |
| Graduate Degree | - | - |
| Total | $62,000 | $48,415 |
Family Income in Lake Secession
Family Income Brackets in Lake Secession
According to the Lake Secession family income data, there are 78 families falling into the $150,000 to $199,999 income range, which is the most common income bracket and makes up 21.8% of all families.
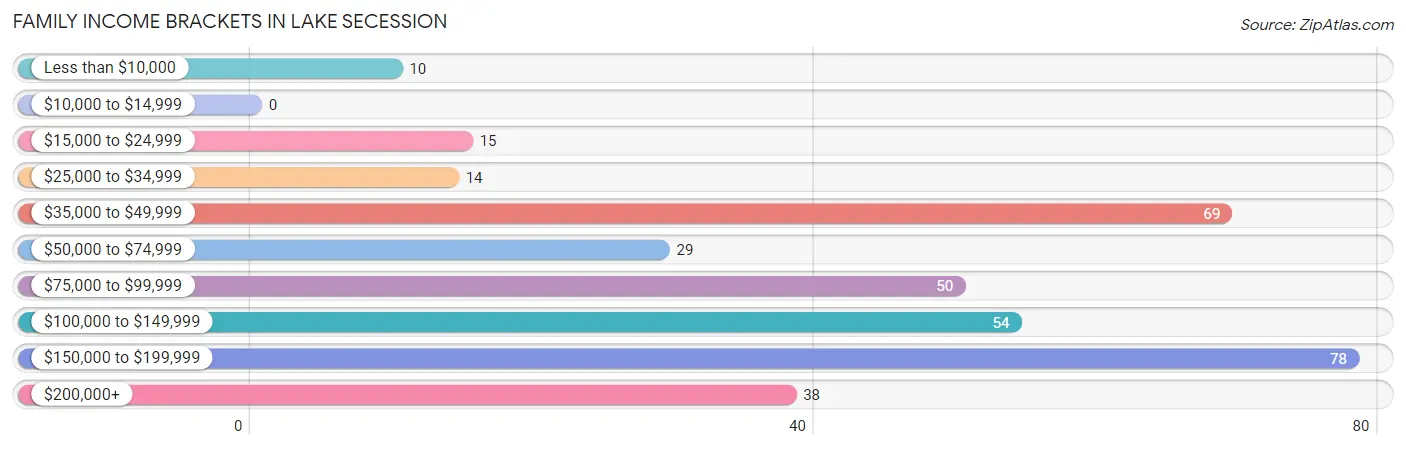
| Income Bracket | # Families | % Families |
| Less than $10,000 | 10 | 2.8% |
| $10,000 to $14,999 | 0 | 0.0% |
| $15,000 to $24,999 | 15 | 4.2% |
| $25,000 to $34,999 | 14 | 3.9% |
| $35,000 to $49,999 | 69 | 19.3% |
| $50,000 to $74,999 | 29 | 8.1% |
| $75,000 to $99,999 | 50 | 14.0% |
| $100,000 to $149,999 | 54 | 15.1% |
| $150,000 to $199,999 | 78 | 21.8% |
| $200,000+ | 38 | 10.6% |
Family Income by Famaliy Size in Lake Secession
4-person families (37 | 10.4%) account for the highest median family income in Lake Secession with $217,989 per family, while 4-person families (37 | 10.4%) have the highest median income of $54,497 per family member.
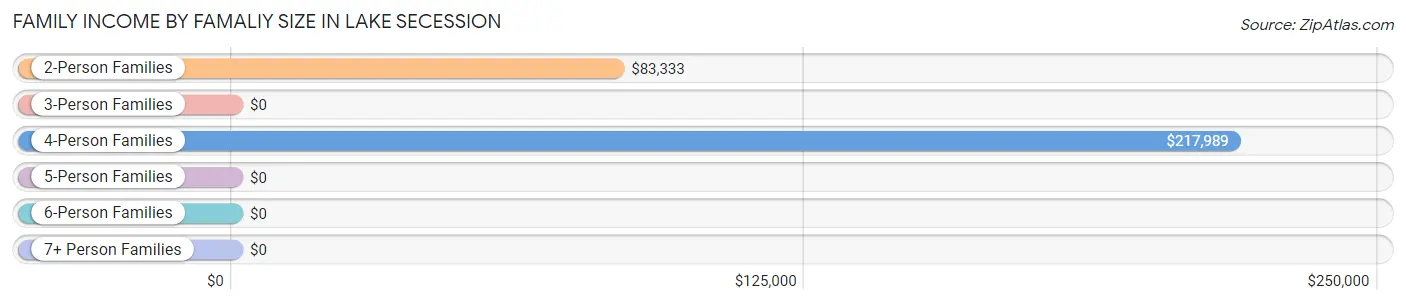
| Income Bracket | # Families | Median Income |
| 2-Person Families | 222 (62.2%) | $83,333 |
| 3-Person Families | 73 (20.4%) | $0 |
| 4-Person Families | 37 (10.4%) | $217,989 |
| 5-Person Families | 15 (4.2%) | $0 |
| 6-Person Families | 10 (2.8%) | $0 |
| 7+ Person Families | 0 (0.0%) | $0 |
| Total | 357 (100.0%) | $87,006 |
Family Income by Number of Earners in Lake Secession
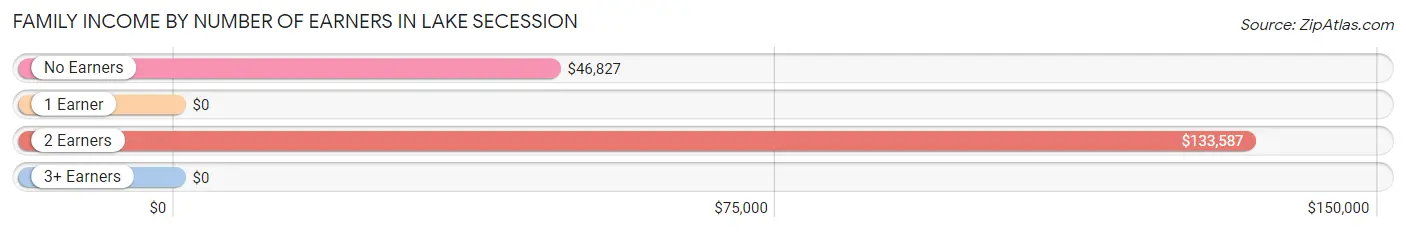
| Number of Earners | # Families | Median Income |
| No Earners | 101 (28.3%) | $46,827 |
| 1 Earner | 125 (35.0%) | $0 |
| 2 Earners | 116 (32.5%) | $133,587 |
| 3+ Earners | 15 (4.2%) | $0 |
| Total | 357 (100.0%) | $87,006 |
Household Income in Lake Secession
Household Income Brackets in Lake Secession
With 157 households falling in the category, the $25,000 to $34,999 income range is the most frequent in Lake Secession, accounting for 28.7% of all households.
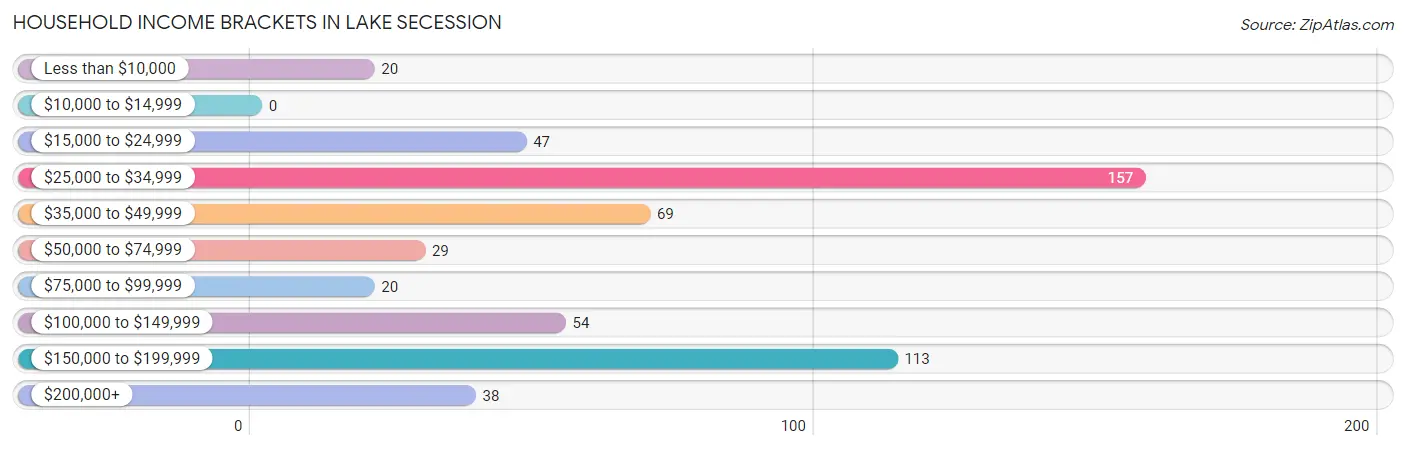
| Income Bracket | # Households | % Households |
| Less than $10,000 | 20 | 3.7% |
| $10,000 to $14,999 | 0 | 0.0% |
| $15,000 to $24,999 | 47 | 8.6% |
| $25,000 to $34,999 | 157 | 28.7% |
| $35,000 to $49,999 | 69 | 12.6% |
| $50,000 to $74,999 | 29 | 5.3% |
| $75,000 to $99,999 | 20 | 3.7% |
| $100,000 to $149,999 | 54 | 9.9% |
| $150,000 to $199,999 | 113 | 20.7% |
| $200,000+ | 38 | 6.9% |
Household Income by Householder Age in Lake Secession
The median household income in Lake Secession is $45,759, with the highest median household income of $217,772 found in the 25 to 44 years age bracket for the primary householder. A total of 41 households (7.5%) fall into this category.
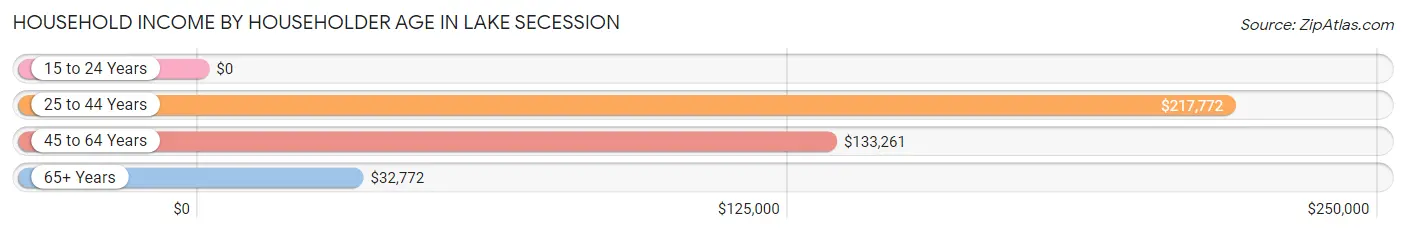
| Income Bracket | # Households | Median Income |
| 15 to 24 Years | 0 (0.0%) | $0 |
| 25 to 44 Years | 41 (7.5%) | $217,772 |
| 45 to 64 Years | 184 (33.6%) | $133,261 |
| 65+ Years | 322 (58.9%) | $32,772 |
| Total | 547 (100.0%) | $45,759 |
Poverty in Lake Secession
Income Below Poverty by Sex and Age in Lake Secession
With 10.0% poverty level for males and 3.3% for females among the residents of Lake Secession, 5 year old males and 35 to 44 year old females are the most vulnerable to poverty, with 2 males (100.0%) and 5 females (25.0%) in their respective age groups living below the poverty level.
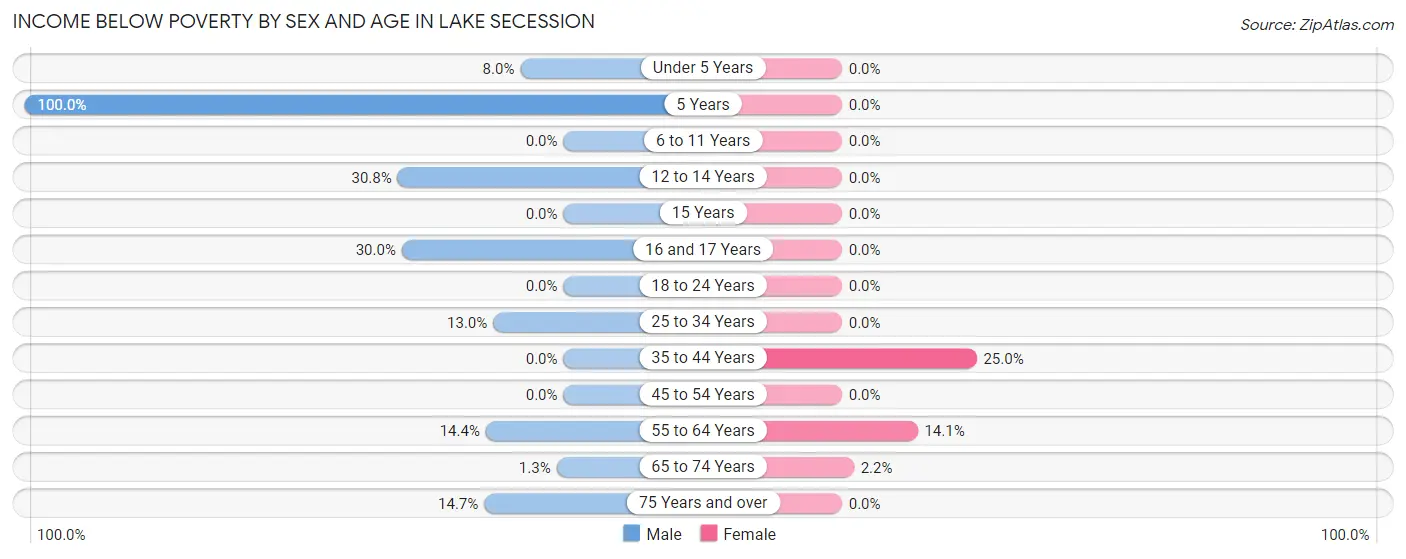
| Age Bracket | Male | Female |
| Under 5 Years | 2 (8.0%) | 0 (0.0%) |
| 5 Years | 2 (100.0%) | 0 (0.0%) |
| 6 to 11 Years | 0 (0.0%) | 0 (0.0%) |
| 12 to 14 Years | 4 (30.8%) | 0 (0.0%) |
| 15 Years | 0 (0.0%) | 0 (0.0%) |
| 16 and 17 Years | 9 (30.0%) | 0 (0.0%) |
| 18 to 24 Years | 0 (0.0%) | 0 (0.0%) |
| 25 to 34 Years | 3 (13.0%) | 0 (0.0%) |
| 35 to 44 Years | 0 (0.0%) | 5 (25.0%) |
| 45 to 54 Years | 0 (0.0%) | 0 (0.0%) |
| 55 to 64 Years | 17 (14.4%) | 17 (14.1%) |
| 65 to 74 Years | 1 (1.3%) | 3 (2.2%) |
| 75 Years and over | 10 (14.7%) | 0 (0.0%) |
| Total | 48 (10.0%) | 25 (3.3%) |
Income Above Poverty by Sex and Age in Lake Secession
According to the poverty statistics in Lake Secession, males aged 6 to 11 years and females aged 5 years are the age groups that are most secure financially, with 100.0% of males and 100.0% of females in these age groups living above the poverty line.
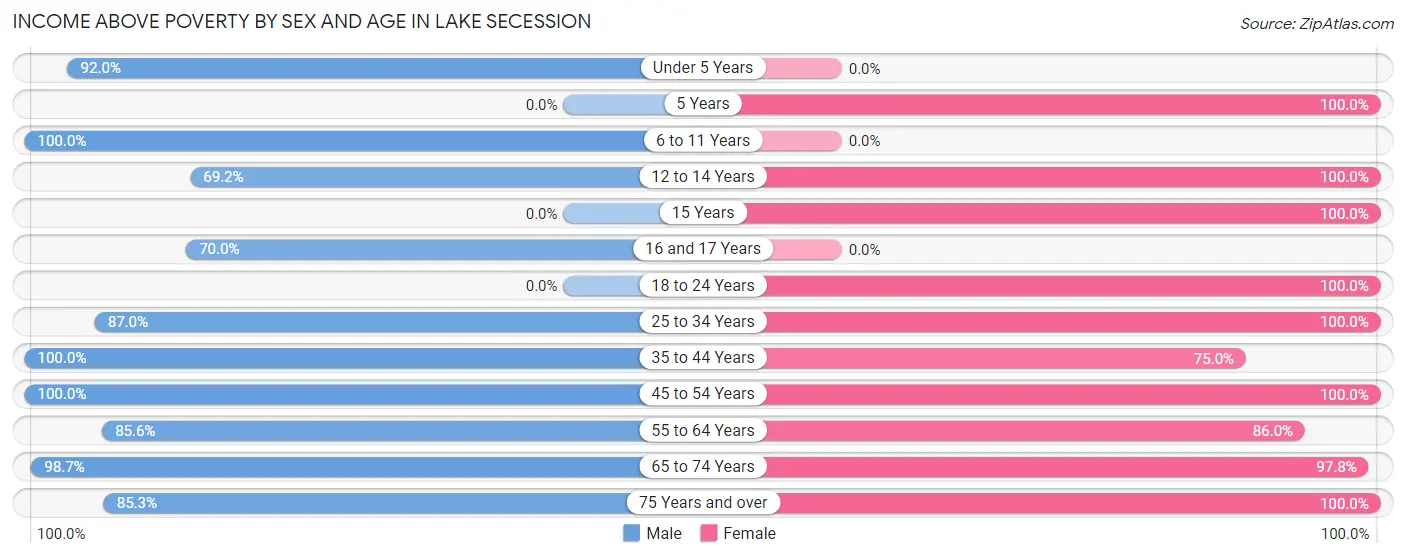
| Age Bracket | Male | Female |
| Under 5 Years | 23 (92.0%) | 0 (0.0%) |
| 5 Years | 0 (0.0%) | 17 (100.0%) |
| 6 to 11 Years | 30 (100.0%) | 0 (0.0%) |
| 12 to 14 Years | 9 (69.2%) | 58 (100.0%) |
| 15 Years | 0 (0.0%) | 15 (100.0%) |
| 16 and 17 Years | 21 (70.0%) | 0 (0.0%) |
| 18 to 24 Years | 0 (0.0%) | 72 (100.0%) |
| 25 to 34 Years | 20 (87.0%) | 51 (100.0%) |
| 35 to 44 Years | 13 (100.0%) | 15 (75.0%) |
| 45 to 54 Years | 80 (100.0%) | 129 (100.0%) |
| 55 to 64 Years | 101 (85.6%) | 104 (86.0%) |
| 65 to 74 Years | 78 (98.7%) | 133 (97.8%) |
| 75 Years and over | 58 (85.3%) | 146 (100.0%) |
| Total | 433 (90.0%) | 740 (96.7%) |
Income Below Poverty Among Married-Couple Families in Lake Secession
The poverty statistics for married-couple families in Lake Secession show that 6.5% or 20 of the total 307 families live below the poverty line. Families with 1 or 2 children have the highest poverty rate of 9.2%, comprising of 7 families. On the other hand, families with no children have the lowest poverty rate of 5.6%, which includes 13 families.
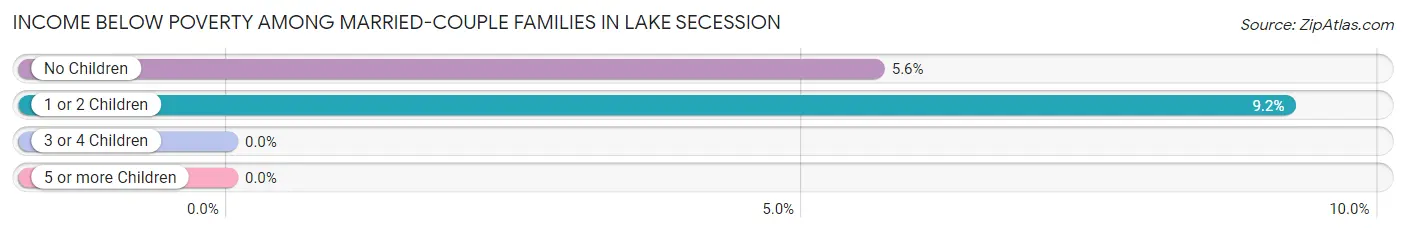
| Children | Above Poverty | Below Poverty |
| No Children | 218 (94.4%) | 13 (5.6%) |
| 1 or 2 Children | 69 (90.8%) | 7 (9.2%) |
| 3 or 4 Children | 0 (0.0%) | 0 (0.0%) |
| 5 or more Children | 0 (0.0%) | 0 (0.0%) |
| Total | 287 (93.5%) | 20 (6.5%) |
Income Below Poverty Among Single-Parent Households in Lake Secession
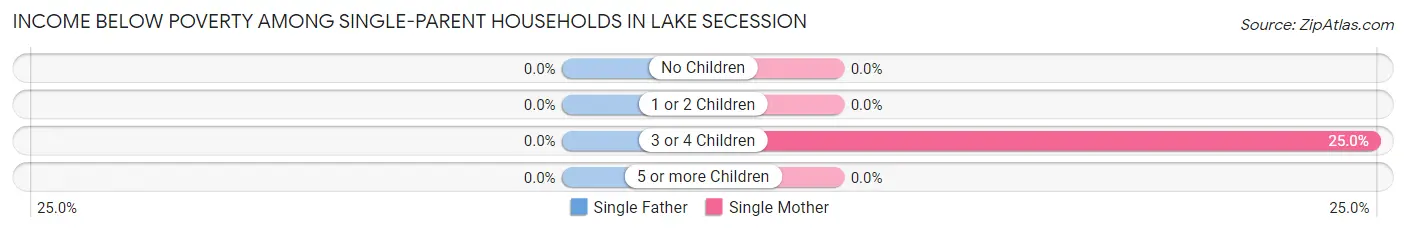
| Children | Single Father | Single Mother |
| No Children | 0 (0.0%) | 0 (0.0%) |
| 1 or 2 Children | 0 (0.0%) | 0 (0.0%) |
| 3 or 4 Children | 0 (0.0%) | 5 (25.0%) |
| 5 or more Children | 0 (0.0%) | 0 (0.0%) |
| Total | 0 (0.0%) | 5 (10.0%) |
Income Below Poverty Among Married-Couple vs Single-Parent Households in Lake Secession
The poverty data for Lake Secession shows that 20 of the married-couple family households (6.5%) and 5 of the single-parent households (10.0%) are living below the poverty level. Within the married-couple family households, those with 1 or 2 children have the highest poverty rate, with 7 households (9.2%) falling below the poverty line. Among the single-parent households, those with 3 or 4 children have the highest poverty rate, with 5 household (25.0%) living below poverty.
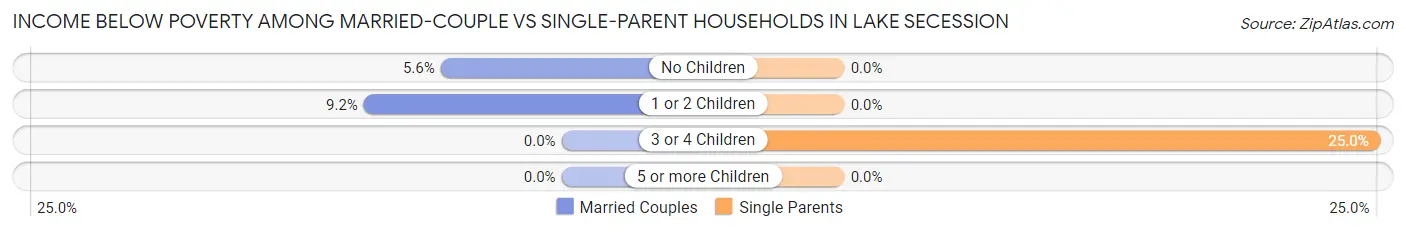
| Children | Married-Couple Families | Single-Parent Households |
| No Children | 13 (5.6%) | 0 (0.0%) |
| 1 or 2 Children | 7 (9.2%) | 0 (0.0%) |
| 3 or 4 Children | 0 (0.0%) | 5 (25.0%) |
| 5 or more Children | 0 (0.0%) | 0 (0.0%) |
| Total | 20 (6.5%) | 5 (10.0%) |
Race in Lake Secession
The most populous races in Lake Secession are White / Caucasian (1,066 | 85.6%), Two or more Races (177 | 14.2%), and Native / Alaskan (3 | 0.2%).
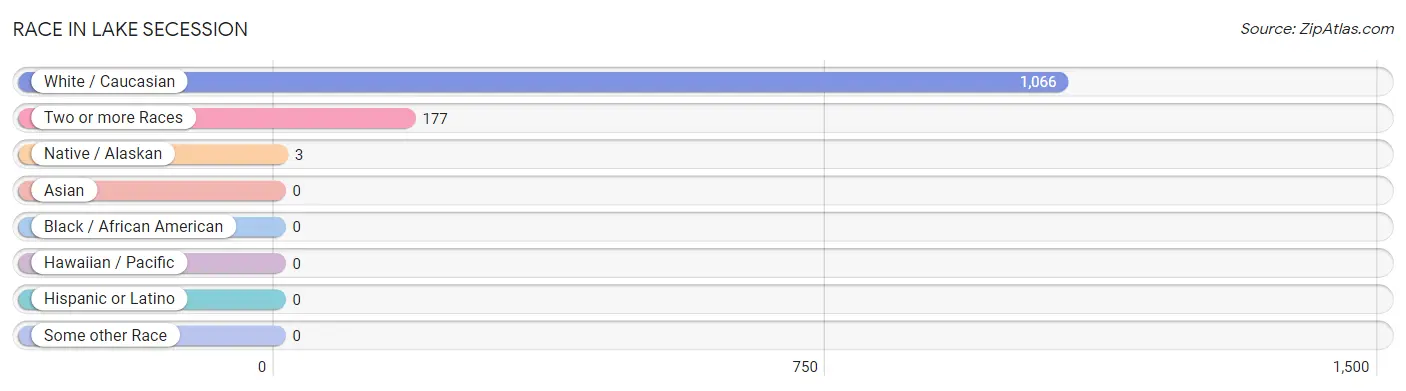
| Race | # Population | % Population |
| Asian | 0 | 0.0% |
| Black / African American | 0 | 0.0% |
| Hawaiian / Pacific | 0 | 0.0% |
| Hispanic or Latino | 0 | 0.0% |
| Native / Alaskan | 3 | 0.2% |
| White / Caucasian | 1,066 | 85.6% |
| Two or more Races | 177 | 14.2% |
| Some other Race | 0 | 0.0% |
| Total | 1,246 | 100.0% |
Ancestry in Lake Secession
The most populous ancestries reported in Lake Secession are Irish (225 | 18.1%), American (192 | 15.4%), German (143 | 11.5%), European (85 | 6.8%), and Welsh (76 | 6.1%), together accounting for 57.9% of all Lake Secession residents.
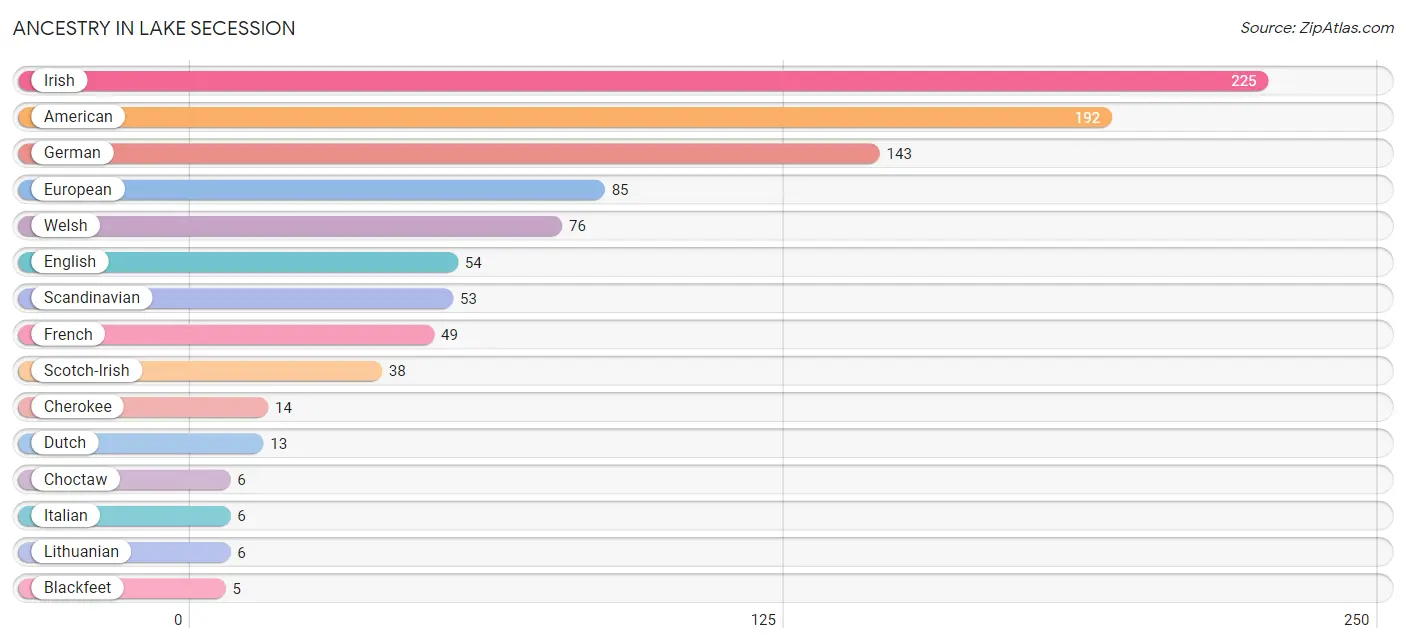
| Ancestry | # Population | % Population |
| American | 192 | 15.4% |
| Blackfeet | 5 | 0.4% |
| Cherokee | 14 | 1.1% |
| Choctaw | 6 | 0.5% |
| Dutch | 13 | 1.0% |
| English | 54 | 4.3% |
| European | 85 | 6.8% |
| French | 49 | 3.9% |
| French Canadian | 4 | 0.3% |
| German | 143 | 11.5% |
| Irish | 225 | 18.1% |
| Italian | 6 | 0.5% |
| Lithuanian | 6 | 0.5% |
| Scandinavian | 53 | 4.3% |
| Scotch-Irish | 38 | 3.0% |
| Scottish | 2 | 0.2% |
| Swedish | 3 | 0.2% |
| Welsh | 76 | 6.1% | View All 18 Rows |
Immigrants in Lake Secession

| Immigration Origin | # Population | % Population | View All 0 Rows |
Sex and Age in Lake Secession
Sex and Age in Lake Secession
The most populous age groups in Lake Secession are 60 to 64 Years (71 | 14.8%) for men and 80 to 84 Years (116 | 15.2%) for women.
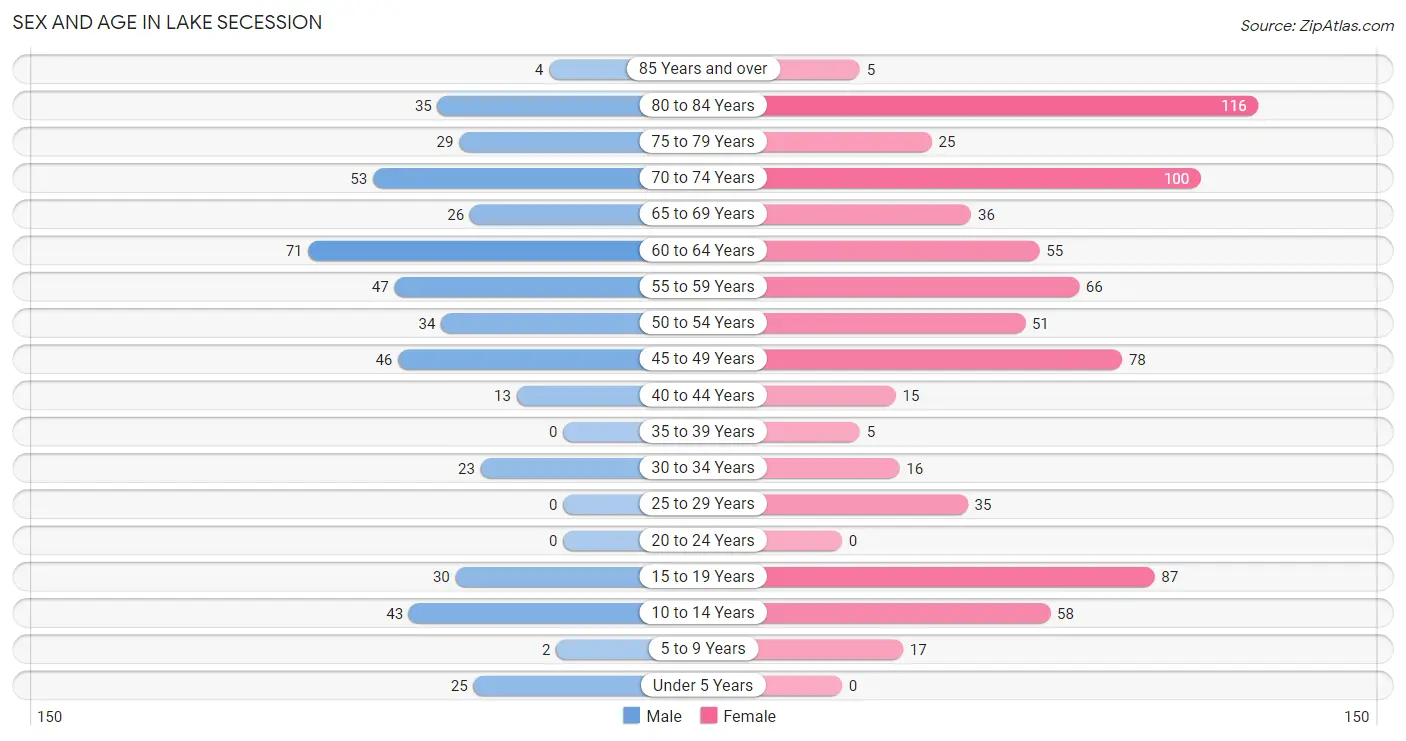
| Age Bracket | Male | Female |
| Under 5 Years | 25 (5.2%) | 0 (0.0%) |
| 5 to 9 Years | 2 (0.4%) | 17 (2.2%) |
| 10 to 14 Years | 43 (8.9%) | 58 (7.6%) |
| 15 to 19 Years | 30 (6.2%) | 87 (11.4%) |
| 20 to 24 Years | 0 (0.0%) | 0 (0.0%) |
| 25 to 29 Years | 0 (0.0%) | 35 (4.6%) |
| 30 to 34 Years | 23 (4.8%) | 16 (2.1%) |
| 35 to 39 Years | 0 (0.0%) | 5 (0.6%) |
| 40 to 44 Years | 13 (2.7%) | 15 (2.0%) |
| 45 to 49 Years | 46 (9.6%) | 78 (10.2%) |
| 50 to 54 Years | 34 (7.1%) | 51 (6.7%) |
| 55 to 59 Years | 47 (9.8%) | 66 (8.6%) |
| 60 to 64 Years | 71 (14.8%) | 55 (7.2%) |
| 65 to 69 Years | 26 (5.4%) | 36 (4.7%) |
| 70 to 74 Years | 53 (11.0%) | 100 (13.1%) |
| 75 to 79 Years | 29 (6.0%) | 25 (3.3%) |
| 80 to 84 Years | 35 (7.3%) | 116 (15.2%) |
| 85 Years and over | 4 (0.8%) | 5 (0.6%) |
| Total | 481 (100.0%) | 765 (100.0%) |
Families and Households in Lake Secession
Median Family Size in Lake Secession
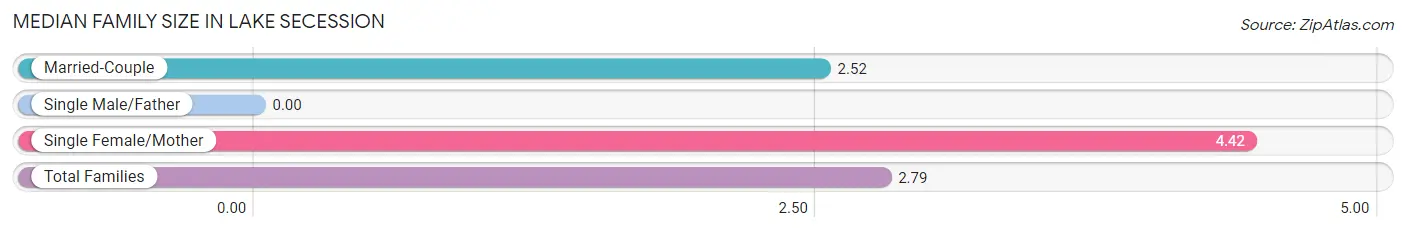
| Family Type | # Families | Family Size |
| Married-Couple | 307 (86.0%) | 2.52 |
| Single Male/Father | 0 (0.0%) | - |
| Single Female/Mother | 50 (14.0%) | 4.42 |
| Total Families | 357 (100.0%) | 2.79 |
Median Household Size in Lake Secession
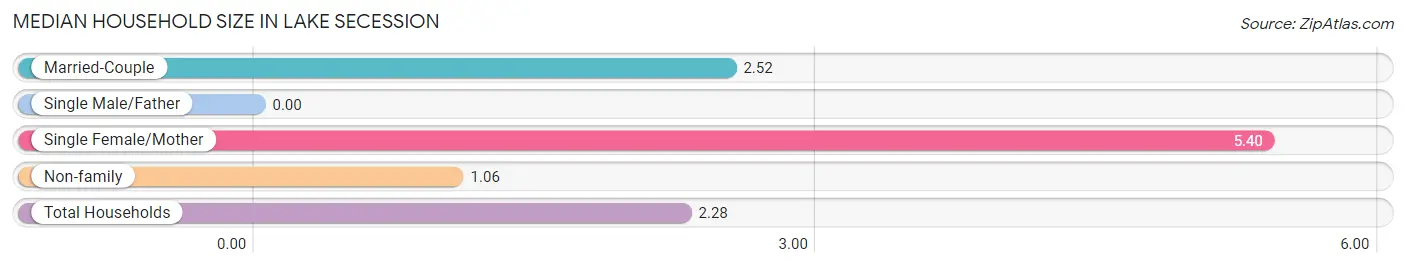
| Household Type | # Households | Household Size |
| Married-Couple | 307 (56.1%) | 2.52 |
| Single Male/Father | 0 (0.0%) | - |
| Single Female/Mother | 50 (9.1%) | 5.40 |
| Non-family | 190 (34.7%) | 1.06 |
| Total Households | 547 (100.0%) | 2.28 |
Household Size by Marriage Status in Lake Secession
Out of a total of 547 households in Lake Secession, 357 (65.3%) are family households, while 190 (34.7%) are nonfamily households. The most numerous type of family households are 2-person households, comprising 222, and the most common type of nonfamily households are 1-person households, comprising 185.
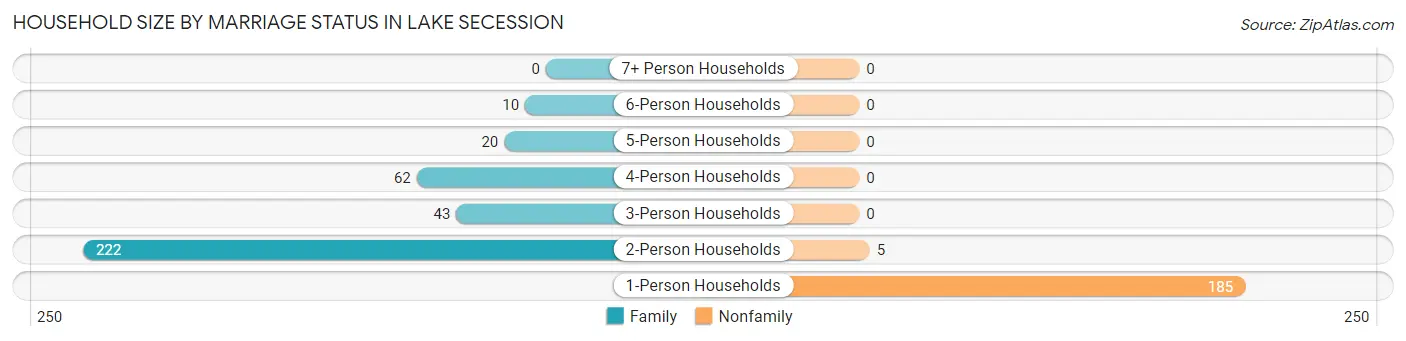
| Household Size | Family Households | Nonfamily Households |
| 1-Person Households | - | 185 (33.8%) |
| 2-Person Households | 222 (40.6%) | 5 (0.9%) |
| 3-Person Households | 43 (7.9%) | 0 (0.0%) |
| 4-Person Households | 62 (11.3%) | 0 (0.0%) |
| 5-Person Households | 20 (3.7%) | 0 (0.0%) |
| 6-Person Households | 10 (1.8%) | 0 (0.0%) |
| 7+ Person Households | 0 (0.0%) | 0 (0.0%) |
| Total | 357 (65.3%) | 190 (34.7%) |
Female Fertility in Lake Secession
Fertility by Age in Lake Secession
| Age Bracket | Women with Births | Births / 1,000 Women |
| 15 to 19 years | 0 (0.0%) | 0.0 |
| 20 to 34 years | 0 (0.0%) | 0.0 |
| 35 to 50 years | 0 (0.0%) | 0.0 |
| Total | 0 (0.0%) | 0.0 |
Fertility by Age by Marriage Status in Lake Secession
| Age Bracket | Married | Unmarried |
| 15 to 19 years | 0 (0.0%) | 0 (0.0%) |
| 20 to 34 years | 0 (0.0%) | 0 (0.0%) |
| 35 to 50 years | 0 (0.0%) | 0 (0.0%) |
| Total | 0 (0.0%) | 0 (0.0%) |
Fertility by Education in Lake Secession
| Educational Attainment | Women with Births | Births / 1,000 Women |
| Less than High School | 0 (0.0%) | 0.0 |
| High School Diploma | 0 (0.0%) | 0.0 |
| College or Associate's Degree | 0 (0.0%) | 0.0 |
| Bachelor's Degree | 0 (0.0%) | 0.0 |
| Graduate Degree | 0 (0.0%) | 0.0 |
| Total | 0 (0.0%) | 0.0 |
Fertility by Education by Marriage Status in Lake Secession
| Educational Attainment | Married | Unmarried |
| Less than High School | 0 (0.0%) | 0 (0.0%) |
| High School Diploma | 0 (0.0%) | 0 (0.0%) |
| College or Associate's Degree | 0 (0.0%) | 0 (0.0%) |
| Bachelor's Degree | 0 (0.0%) | 0 (0.0%) |
| Graduate Degree | 0 (0.0%) | 0 (0.0%) |
| Total | 0 (0.0%) | 0 (0.0%) |
Employment Characteristics in Lake Secession
Employment by Class of Employer in Lake Secession
Among the 440 employed individuals in Lake Secession, private company employees (288 | 65.4%), not-for-profit organizations (61 | 13.9%), and self-employed (not incorporated) (40 | 9.1%) make up the most common classes of employment.
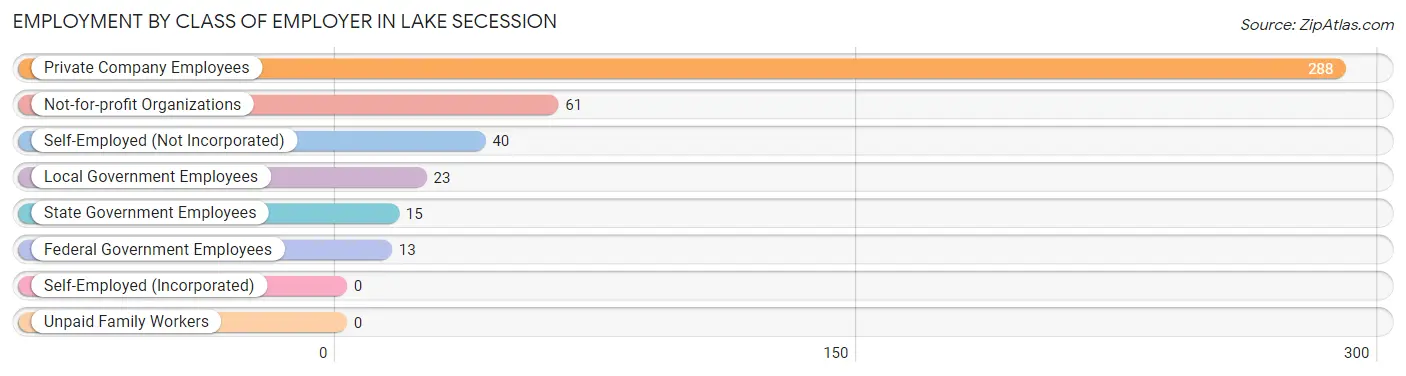
| Employer Class | # Employees | % Employees |
| Private Company Employees | 288 | 65.4% |
| Self-Employed (Incorporated) | 0 | 0.0% |
| Self-Employed (Not Incorporated) | 40 | 9.1% |
| Not-for-profit Organizations | 61 | 13.9% |
| Local Government Employees | 23 | 5.2% |
| State Government Employees | 15 | 3.4% |
| Federal Government Employees | 13 | 2.9% |
| Unpaid Family Workers | 0 | 0.0% |
| Total | 440 | 100.0% |
Employment Status by Age in Lake Secession
According to the labor force statistics for Lake Secession, out of the total population over 16 years of age (1,086), 44.1% or 479 individuals are in the labor force, with 6.9% or 33 of them unemployed. The age group with the highest labor force participation rate is 30 to 34 years, with 92.3% or 36 individuals in the labor force. Within the labor force, the 55 to 59 years age range has the highest percentage of unemployed individuals, with 15.8% or 15 of them being unemployed.
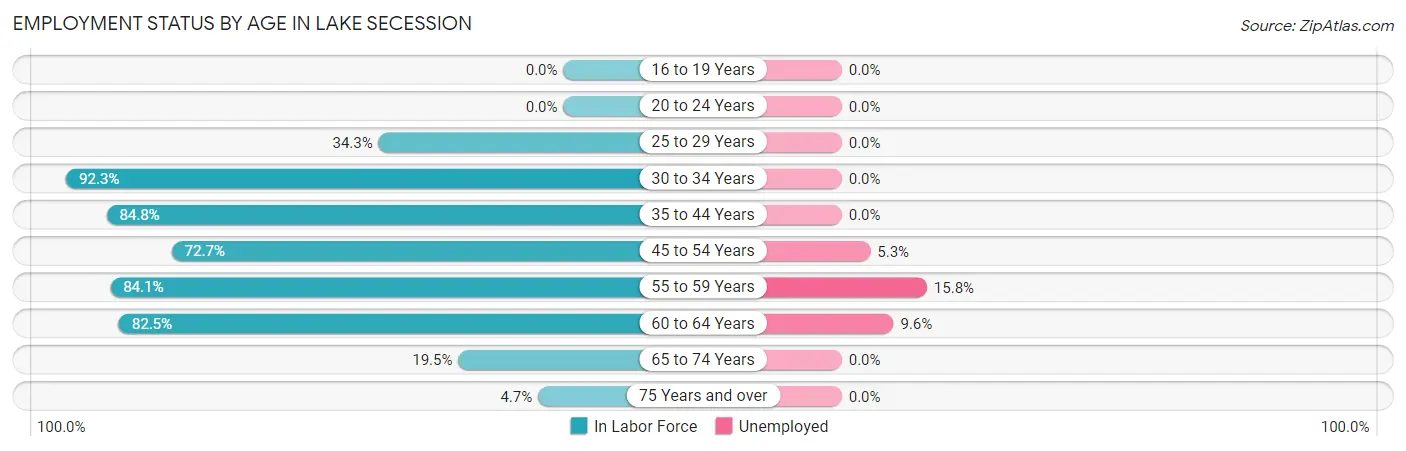
| Age Bracket | In Labor Force | Unemployed |
| 16 to 19 Years | 0 (0.0%) | 0 (0.0%) |
| 20 to 24 Years | 0 (0.0%) | 0 (0.0%) |
| 25 to 29 Years | 12 (34.3%) | 0 (0.0%) |
| 30 to 34 Years | 36 (92.3%) | 0 (0.0%) |
| 35 to 44 Years | 28 (84.8%) | 0 (0.0%) |
| 45 to 54 Years | 152 (72.7%) | 8 (5.3%) |
| 55 to 59 Years | 95 (84.1%) | 15 (15.8%) |
| 60 to 64 Years | 104 (82.5%) | 10 (9.6%) |
| 65 to 74 Years | 42 (19.5%) | 0 (0.0%) |
| 75 Years and over | 10 (4.7%) | 0 (0.0%) |
| Total | 479 (44.1%) | 33 (6.9%) |
Employment Status by Educational Attainment in Lake Secession
According to labor force statistics for Lake Secession, 76.9% of individuals (427) out of the total population between 25 and 64 years of age (555) are in the labor force, with 7.7% or 33 of them being unemployed. The group with the highest labor force participation rate are those with the educational attainment of less than high school, with 86.5% or 45 individuals in the labor force. Within the labor force, individuals with college / associate degree education have the highest percentage of unemployment, with 11.1% or 28 of them being unemployed.
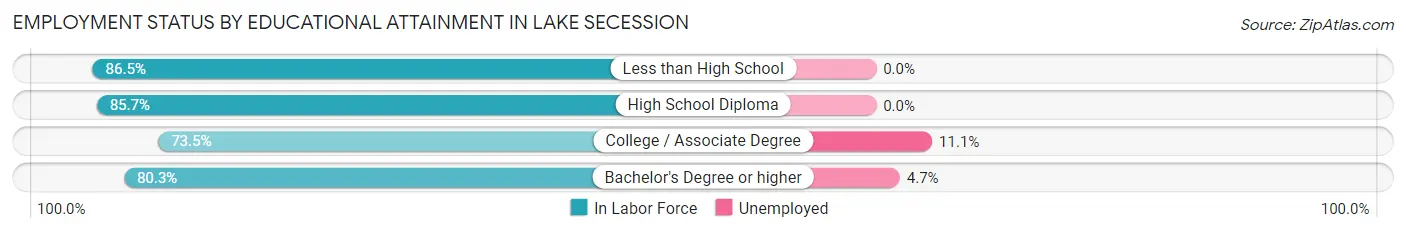
| Educational Attainment | In Labor Force | Unemployed |
| Less than High School | 45 (86.5%) | 0 (0.0%) |
| High School Diploma | 24 (85.7%) | 0 (0.0%) |
| College / Associate Degree | 252 (73.5%) | 38 (11.1%) |
| Bachelor's Degree or higher | 106 (80.3%) | 6 (4.7%) |
| Total | 427 (76.9%) | 43 (7.7%) |
Employment Occupations by Sex in Lake Secession
Management, Business, Science and Arts Occupations
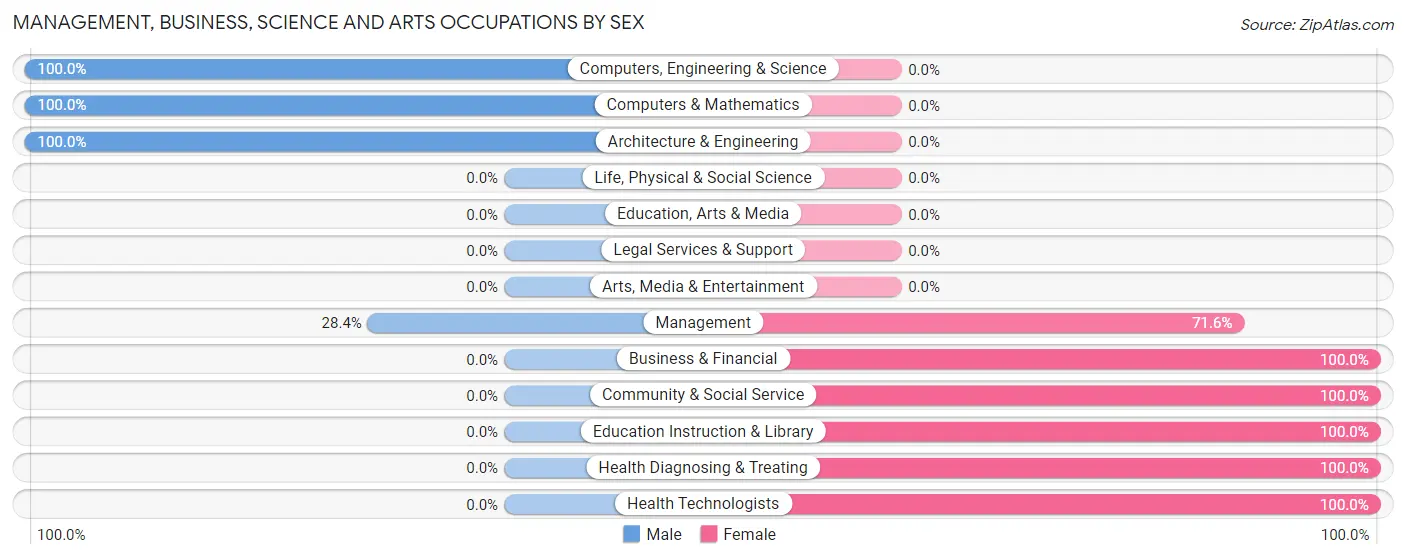
The most common Management, Business, Science and Arts occupations in Lake Secession are Management (109 | 24.4%), Computers, Engineering & Science (70 | 15.7%), Health Diagnosing & Treating (63 | 14.1%), Architecture & Engineering (60 | 13.5%), and Health Technologists (33 | 7.4%).
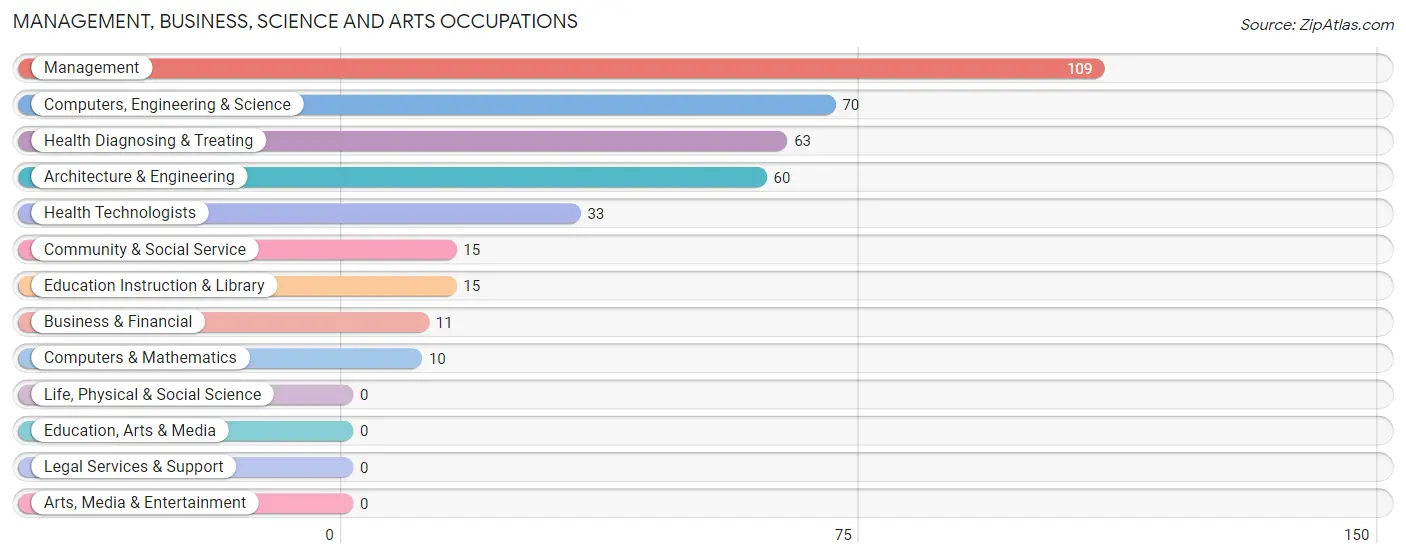
Management, Business, Science and Arts Occupations by Sex
Within the Management, Business, Science and Arts occupations in Lake Secession, the most male-oriented occupations are Computers, Engineering & Science (100.0%), Computers & Mathematics (100.0%), and Architecture & Engineering (100.0%), while the most female-oriented occupations are Business & Financial (100.0%), Community & Social Service (100.0%), and Education Instruction & Library (100.0%).
| Occupation | Male | Female |
| Management | 31 (28.4%) | 78 (71.6%) |
| Business & Financial | 0 (0.0%) | 11 (100.0%) |
| Computers, Engineering & Science | 70 (100.0%) | 0 (0.0%) |
| Computers & Mathematics | 10 (100.0%) | 0 (0.0%) |
| Architecture & Engineering | 60 (100.0%) | 0 (0.0%) |
| Life, Physical & Social Science | 0 (0.0%) | 0 (0.0%) |
| Community & Social Service | 0 (0.0%) | 15 (100.0%) |
| Education, Arts & Media | 0 (0.0%) | 0 (0.0%) |
| Legal Services & Support | 0 (0.0%) | 0 (0.0%) |
| Education Instruction & Library | 0 (0.0%) | 15 (100.0%) |
| Arts, Media & Entertainment | 0 (0.0%) | 0 (0.0%) |
| Health Diagnosing & Treating | 0 (0.0%) | 63 (100.0%) |
| Health Technologists | 0 (0.0%) | 33 (100.0%) |
| Total (Category) | 101 (37.7%) | 167 (62.3%) |
| Total (Overall) | 219 (49.1%) | 227 (50.9%) |
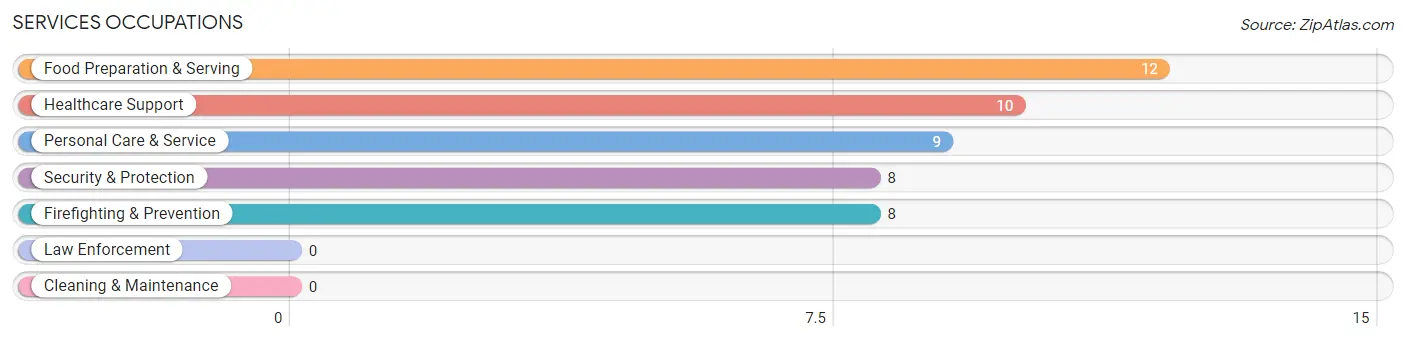
Services Occupations
The most common Services occupations in Lake Secession are Food Preparation & Serving (12 | 2.7%), Healthcare Support (10 | 2.2%), Personal Care & Service (9 | 2.0%), Security & Protection (8 | 1.8%), and Firefighting & Prevention (8 | 1.8%).
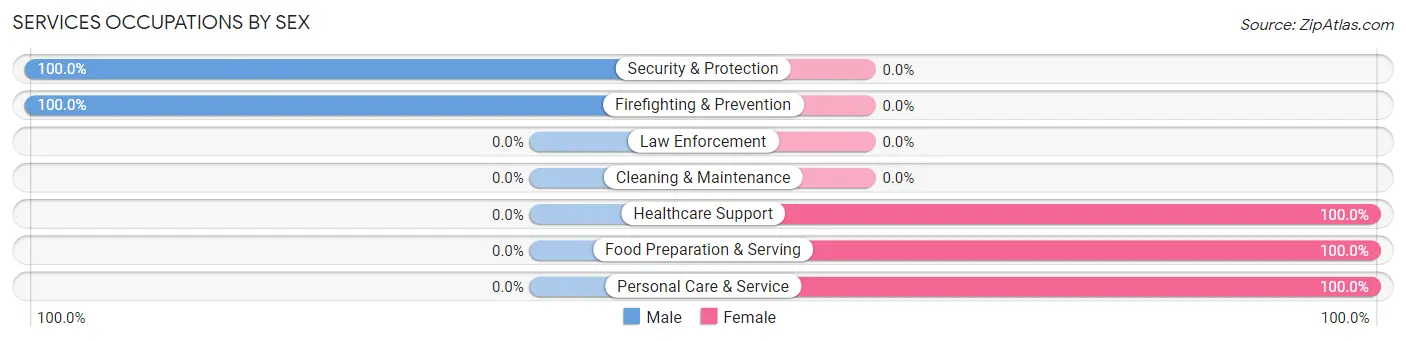
Services Occupations by Sex
Within the Services occupations in Lake Secession, the most male-oriented occupations are Security & Protection (100.0%), and Firefighting & Prevention (100.0%), while the most female-oriented occupations are Healthcare Support (100.0%), Food Preparation & Serving (100.0%), and Personal Care & Service (100.0%).
| Occupation | Male | Female |
| Healthcare Support | 0 (0.0%) | 10 (100.0%) |
| Security & Protection | 8 (100.0%) | 0 (0.0%) |
| Firefighting & Prevention | 8 (100.0%) | 0 (0.0%) |
| Law Enforcement | 0 (0.0%) | 0 (0.0%) |
| Food Preparation & Serving | 0 (0.0%) | 12 (100.0%) |
| Cleaning & Maintenance | 0 (0.0%) | 0 (0.0%) |
| Personal Care & Service | 0 (0.0%) | 9 (100.0%) |
| Total (Category) | 8 (20.5%) | 31 (79.5%) |
| Total (Overall) | 219 (49.1%) | 227 (50.9%) |
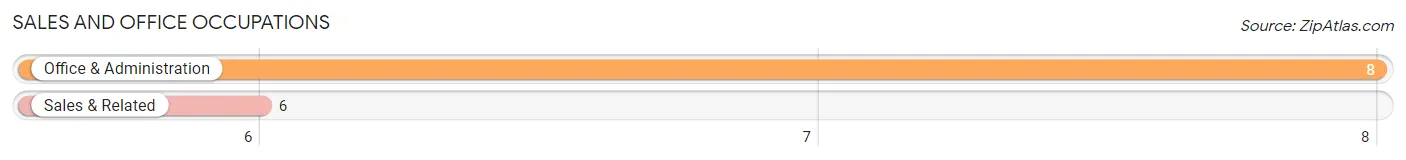
Sales and Office Occupations
The most common Sales and Office occupations in Lake Secession are Office & Administration (8 | 1.8%), and Sales & Related (6 | 1.3%).
Sales and Office Occupations by Sex
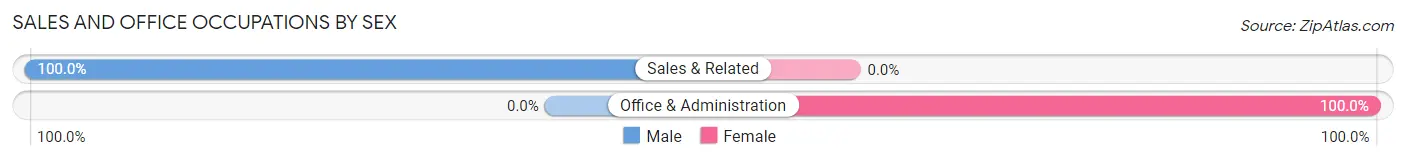
| Occupation | Male | Female |
| Sales & Related | 6 (100.0%) | 0 (0.0%) |
| Office & Administration | 0 (0.0%) | 8 (100.0%) |
| Total (Category) | 6 (42.9%) | 8 (57.1%) |
| Total (Overall) | 219 (49.1%) | 227 (50.9%) |
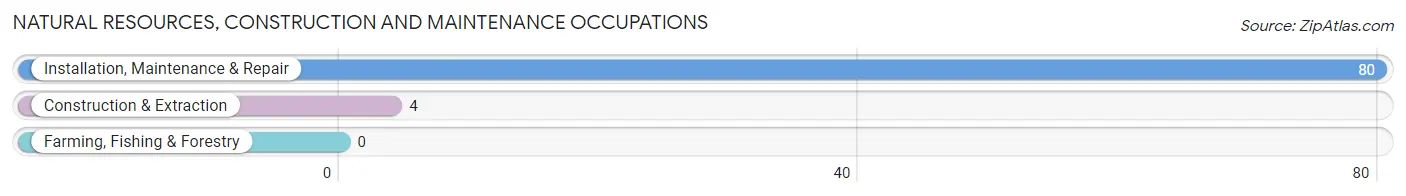
Natural Resources, Construction and Maintenance Occupations
The most common Natural Resources, Construction and Maintenance occupations in Lake Secession are Installation, Maintenance & Repair (80 | 17.9%), and Construction & Extraction (4 | 0.9%).
Natural Resources, Construction and Maintenance Occupations by Sex
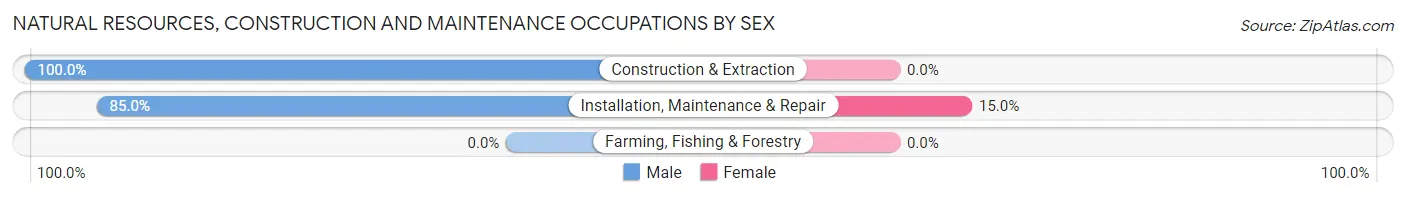
| Occupation | Male | Female |
| Farming, Fishing & Forestry | 0 (0.0%) | 0 (0.0%) |
| Construction & Extraction | 4 (100.0%) | 0 (0.0%) |
| Installation, Maintenance & Repair | 68 (85.0%) | 12 (15.0%) |
| Total (Category) | 72 (85.7%) | 12 (14.3%) |
| Total (Overall) | 219 (49.1%) | 227 (50.9%) |
Production, Transportation and Moving Occupations
The most common Production, Transportation and Moving occupations in Lake Secession are Production (32 | 7.2%), and Transportation (9 | 2.0%).
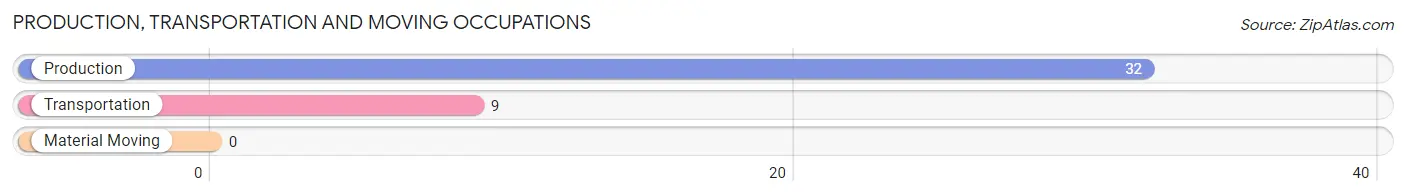
Production, Transportation and Moving Occupations by Sex
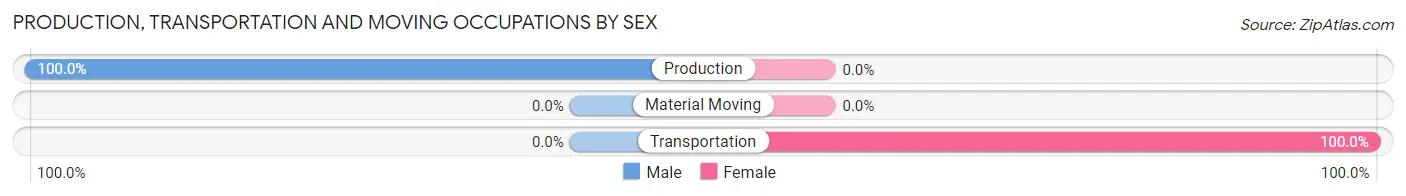
| Occupation | Male | Female |
| Production | 32 (100.0%) | 0 (0.0%) |
| Transportation | 0 (0.0%) | 9 (100.0%) |
| Material Moving | 0 (0.0%) | 0 (0.0%) |
| Total (Category) | 32 (78.0%) | 9 (22.0%) |
| Total (Overall) | 219 (49.1%) | 227 (50.9%) |
Employment Industries by Sex in Lake Secession
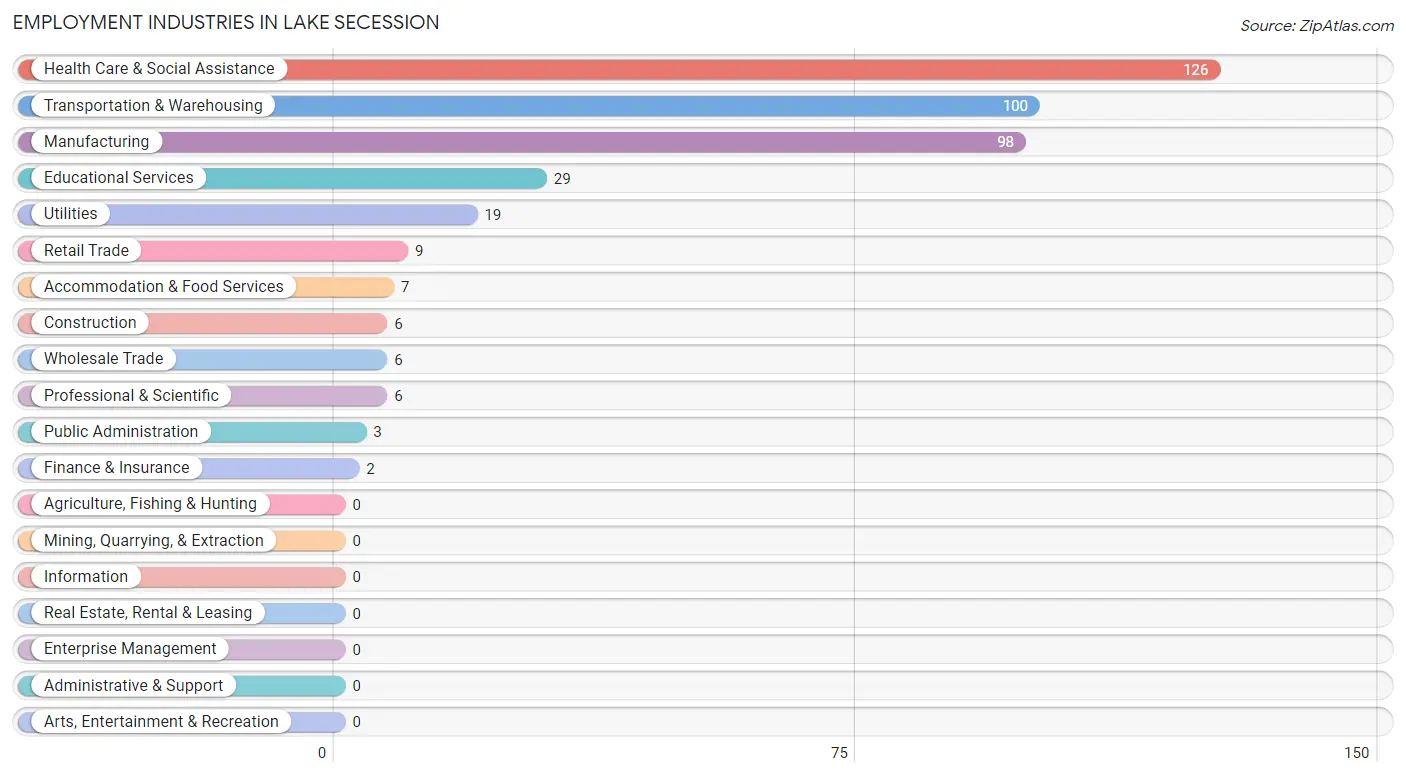
Employment Industries in Lake Secession
The major employment industries in Lake Secession include Health Care & Social Assistance (126 | 28.2%), Transportation & Warehousing (100 | 22.4%), Manufacturing (98 | 22.0%), Educational Services (29 | 6.5%), and Utilities (19 | 4.3%).
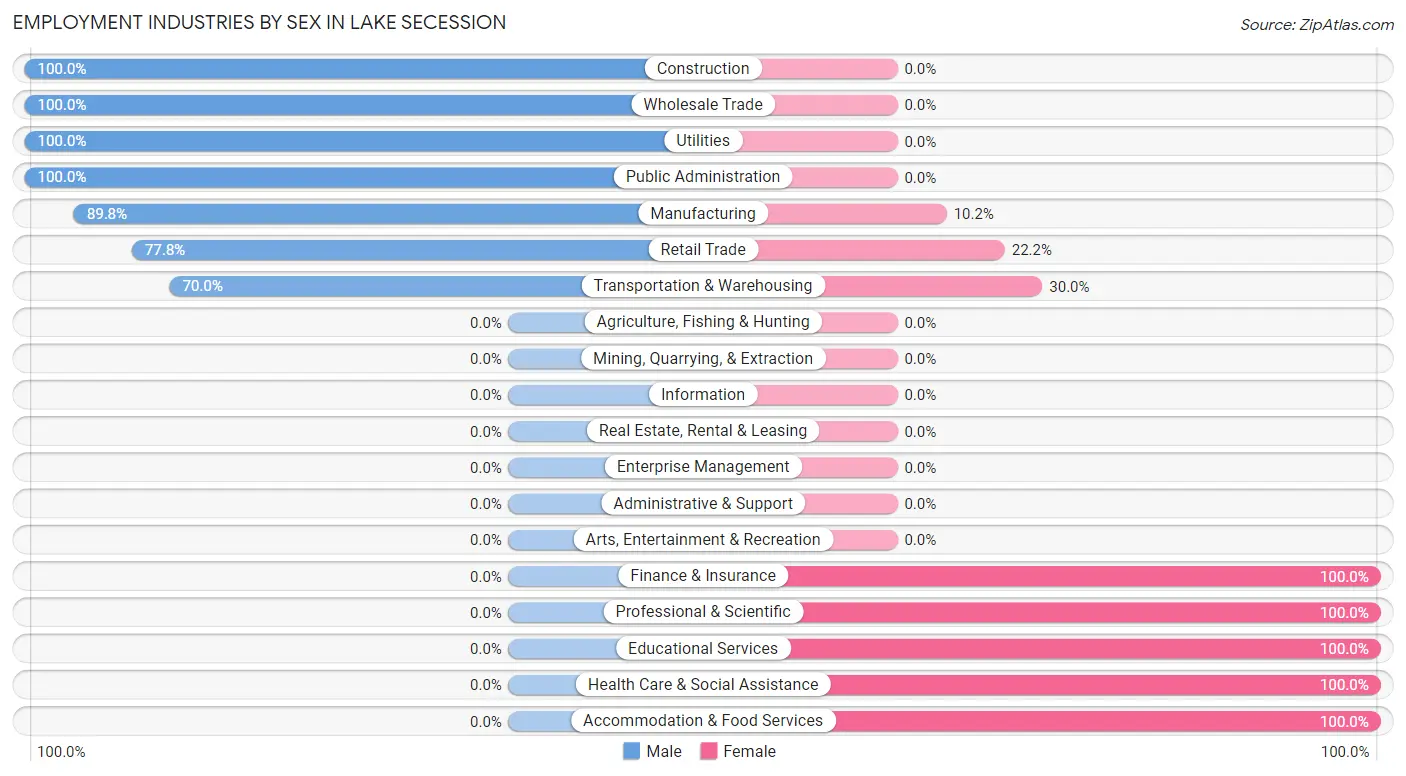
Employment Industries by Sex in Lake Secession
The Lake Secession industries that see more men than women are Construction (100.0%), Wholesale Trade (100.0%), and Utilities (100.0%), whereas the industries that tend to have a higher number of women are Finance & Insurance (100.0%), Professional & Scientific (100.0%), and Educational Services (100.0%).
| Industry | Male | Female |
| Agriculture, Fishing & Hunting | 0 (0.0%) | 0 (0.0%) |
| Mining, Quarrying, & Extraction | 0 (0.0%) | 0 (0.0%) |
| Construction | 6 (100.0%) | 0 (0.0%) |
| Manufacturing | 88 (89.8%) | 10 (10.2%) |
| Wholesale Trade | 6 (100.0%) | 0 (0.0%) |
| Retail Trade | 7 (77.8%) | 2 (22.2%) |
| Transportation & Warehousing | 70 (70.0%) | 30 (30.0%) |
| Utilities | 19 (100.0%) | 0 (0.0%) |
| Information | 0 (0.0%) | 0 (0.0%) |
| Finance & Insurance | 0 (0.0%) | 2 (100.0%) |
| Real Estate, Rental & Leasing | 0 (0.0%) | 0 (0.0%) |
| Professional & Scientific | 0 (0.0%) | 6 (100.0%) |
| Enterprise Management | 0 (0.0%) | 0 (0.0%) |
| Administrative & Support | 0 (0.0%) | 0 (0.0%) |
| Educational Services | 0 (0.0%) | 29 (100.0%) |
| Health Care & Social Assistance | 0 (0.0%) | 126 (100.0%) |
| Arts, Entertainment & Recreation | 0 (0.0%) | 0 (0.0%) |
| Accommodation & Food Services | 0 (0.0%) | 7 (100.0%) |
| Public Administration | 3 (100.0%) | 0 (0.0%) |
| Total | 219 (49.1%) | 227 (50.9%) |
Education in Lake Secession
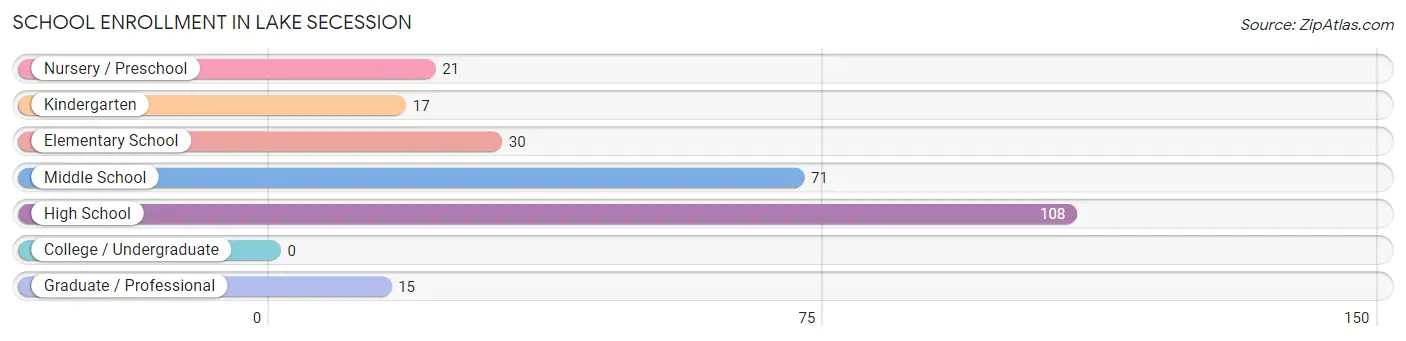
School Enrollment in Lake Secession
The most common levels of schooling among the 262 students in Lake Secession are high school (108 | 41.2%), middle school (71 | 27.1%), and elementary school (30 | 11.5%).
| School Level | # Students | % Students |
| Nursery / Preschool | 21 | 8.0% |
| Kindergarten | 17 | 6.5% |
| Elementary School | 30 | 11.5% |
| Middle School | 71 | 27.1% |
| High School | 108 | 41.2% |
| College / Undergraduate | 0 | 0.0% |
| Graduate / Professional | 15 | 5.7% |
| Total | 262 | 100.0% |
School Enrollment by Age by Funding Source in Lake Secession
Out of a total of 262 students who are enrolled in schools in Lake Secession, 36 (13.7%) attend a private institution, while the remaining 226 (86.3%) are enrolled in public schools. The age group of 3 to 4 year olds has the highest likelihood of being enrolled in private schools, with 19 (100.0% in the age bracket) enrolled. Conversely, the age group of 10 to 14 year olds has the lowest likelihood of being enrolled in a private school, with 101 (100.0% in the age bracket) attending a public institution.
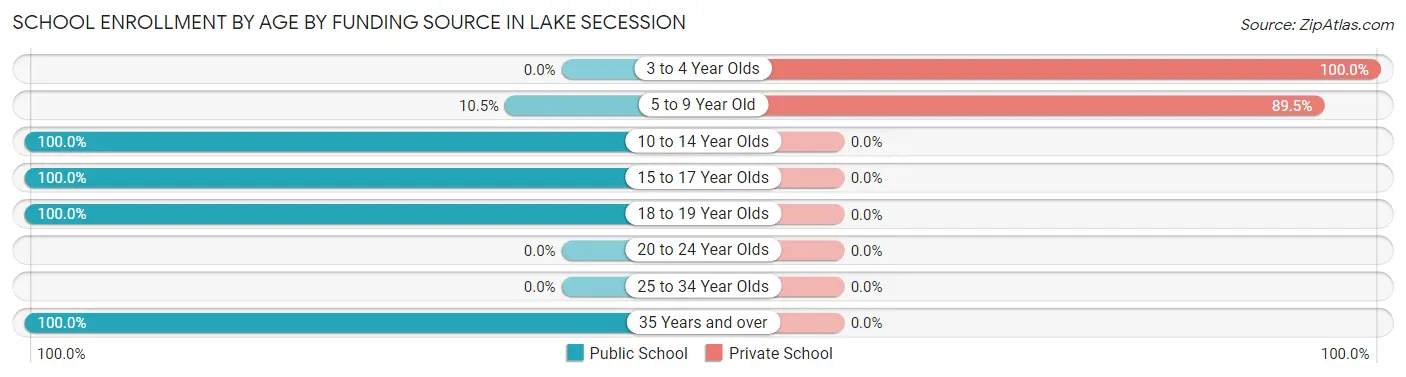
| Age Bracket | Public School | Private School |
| 3 to 4 Year Olds | 0 (0.0%) | 19 (100.0%) |
| 5 to 9 Year Old | 2 (10.5%) | 17 (89.5%) |
| 10 to 14 Year Olds | 101 (100.0%) | 0 (0.0%) |
| 15 to 17 Year Olds | 36 (100.0%) | 0 (0.0%) |
| 18 to 19 Year Olds | 72 (100.0%) | 0 (0.0%) |
| 20 to 24 Year Olds | 0 (0.0%) | 0 (0.0%) |
| 25 to 34 Year Olds | 0 (0.0%) | 0 (0.0%) |
| 35 Years and over | 15 (100.0%) | 0 (0.0%) |
| Total | 226 (86.3%) | 36 (13.7%) |
Educational Attainment by Field of Study in Lake Secession
Business (87 | 41.0%), science & technology (50 | 23.6%), engineering (25 | 11.8%), arts & humanities (18 | 8.5%), and liberal arts & history (10 | 4.7%) are the most common fields of study among 212 individuals in Lake Secession who have obtained a bachelor's degree or higher.
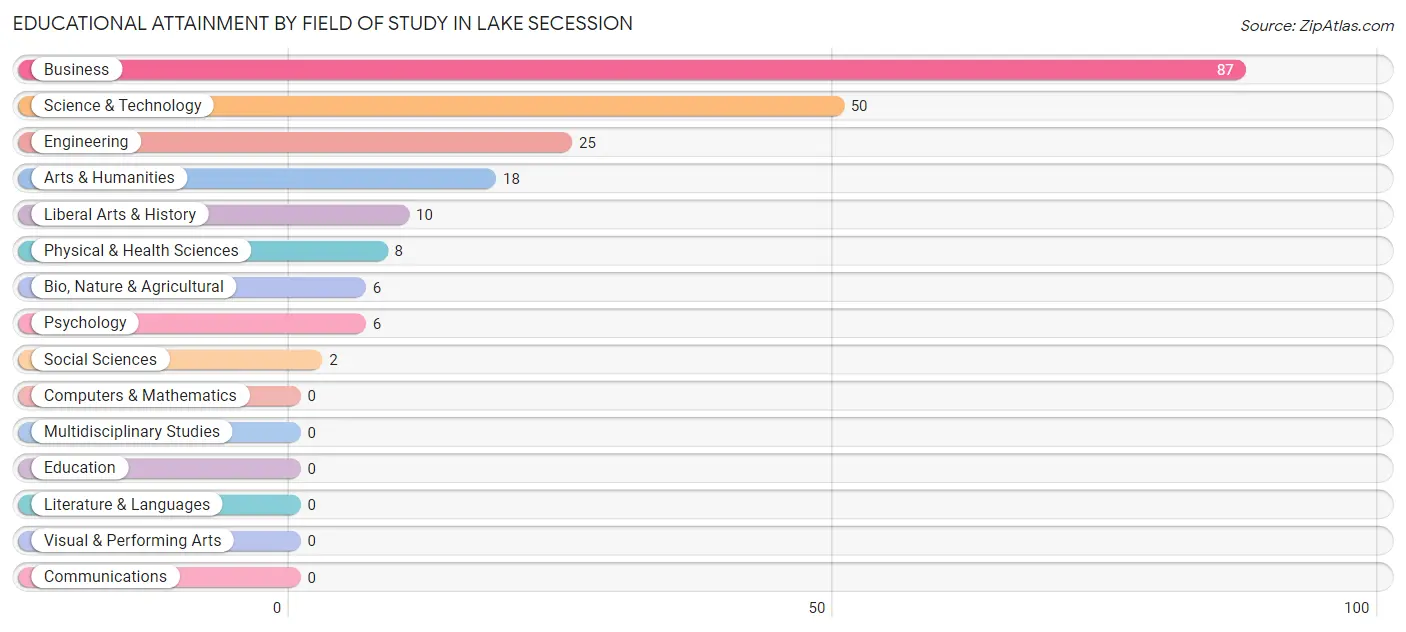
| Field of Study | # Graduates | % Graduates |
| Computers & Mathematics | 0 | 0.0% |
| Bio, Nature & Agricultural | 6 | 2.8% |
| Physical & Health Sciences | 8 | 3.8% |
| Psychology | 6 | 2.8% |
| Social Sciences | 2 | 0.9% |
| Engineering | 25 | 11.8% |
| Multidisciplinary Studies | 0 | 0.0% |
| Science & Technology | 50 | 23.6% |
| Business | 87 | 41.0% |
| Education | 0 | 0.0% |
| Literature & Languages | 0 | 0.0% |
| Liberal Arts & History | 10 | 4.7% |
| Visual & Performing Arts | 0 | 0.0% |
| Communications | 0 | 0.0% |
| Arts & Humanities | 18 | 8.5% |
| Total | 212 | 100.0% |
Transportation & Commute in Lake Secession
Vehicle Availability by Sex in Lake Secession
The most prevalent vehicle ownership categories in Lake Secession are males with 2 vehicles (117, accounting for 54.9%) and females with 2 vehicles (47, making up 51.5%).
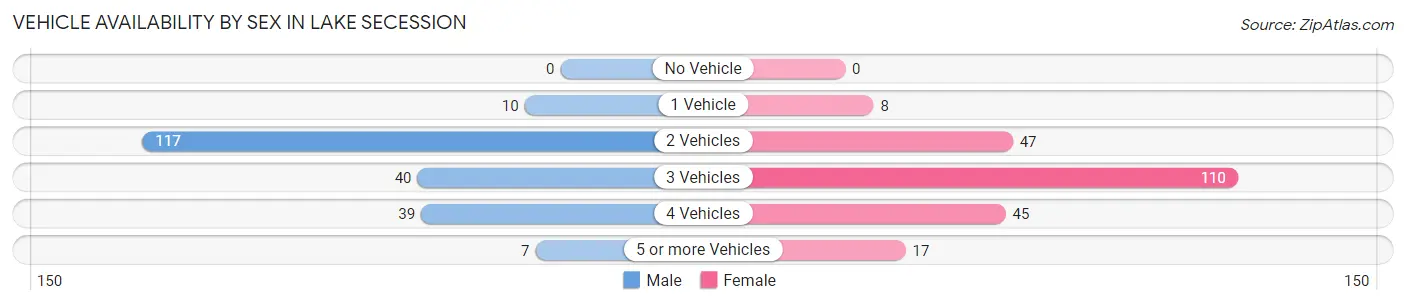
| Vehicles Available | Male | Female |
| No Vehicle | 0 (0.0%) | 0 (0.0%) |
| 1 Vehicle | 10 (4.7%) | 8 (3.5%) |
| 2 Vehicles | 117 (54.9%) | 47 (20.7%) |
| 3 Vehicles | 40 (18.8%) | 110 (48.5%) |
| 4 Vehicles | 39 (18.3%) | 45 (19.8%) |
| 5 or more Vehicles | 7 (3.3%) | 17 (7.5%) |
| Total | 213 (100.0%) | 227 (100.0%) |
Commute Time in Lake Secession
The most frequently occuring commute durations in Lake Secession are 30 to 34 minutes (149 commuters, 35.8%), 20 to 24 minutes (72 commuters, 17.3%), and 45 to 59 minutes (70 commuters, 16.8%).
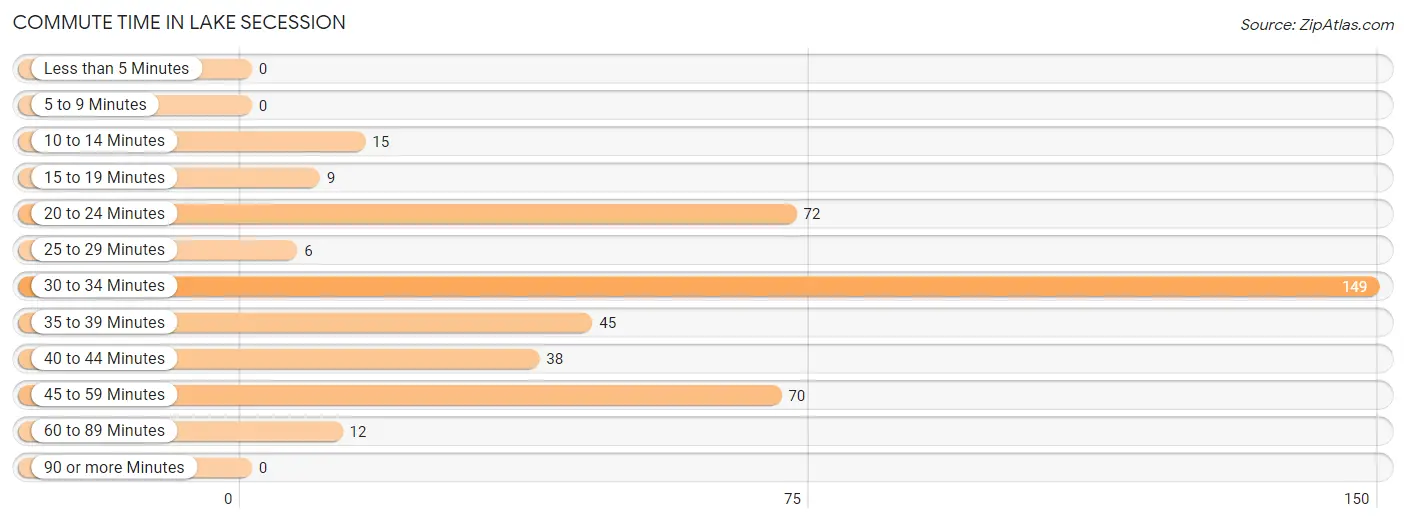
| Commute Time | # Commuters | % Commuters |
| Less than 5 Minutes | 0 | 0.0% |
| 5 to 9 Minutes | 0 | 0.0% |
| 10 to 14 Minutes | 15 | 3.6% |
| 15 to 19 Minutes | 9 | 2.2% |
| 20 to 24 Minutes | 72 | 17.3% |
| 25 to 29 Minutes | 6 | 1.4% |
| 30 to 34 Minutes | 149 | 35.8% |
| 35 to 39 Minutes | 45 | 10.8% |
| 40 to 44 Minutes | 38 | 9.1% |
| 45 to 59 Minutes | 70 | 16.8% |
| 60 to 89 Minutes | 12 | 2.9% |
| 90 or more Minutes | 0 | 0.0% |
Commute Time by Sex in Lake Secession
The most common commute times in Lake Secession are 30 to 34 minutes (102 commuters, 49.3%) for males and 20 to 24 minutes (55 commuters, 26.3%) for females.
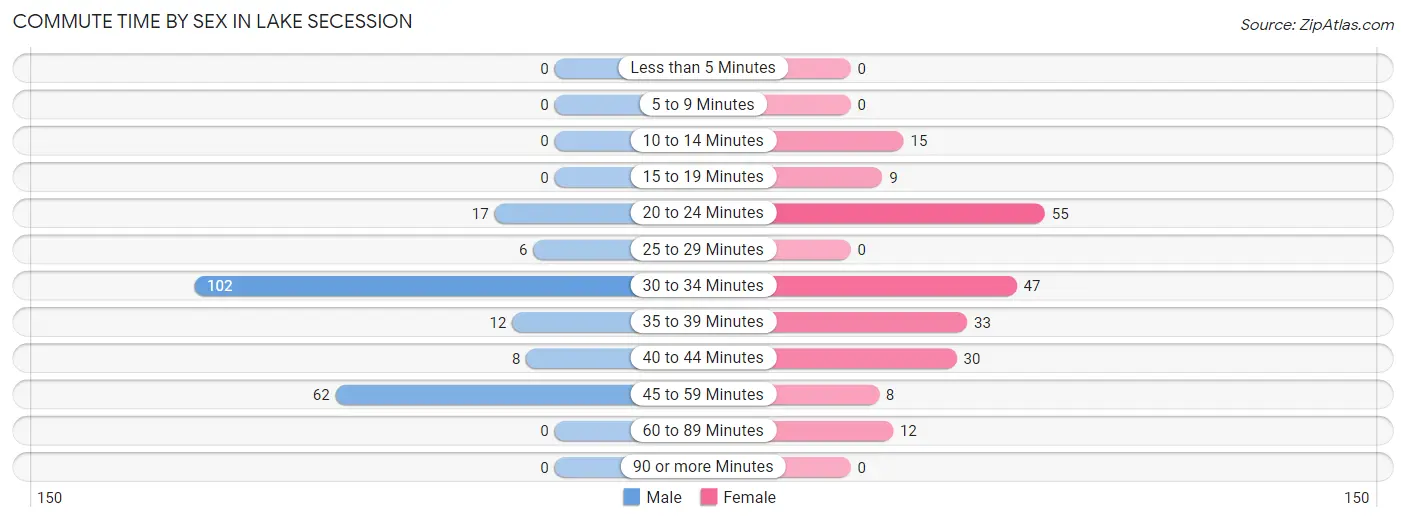
| Commute Time | Male | Female |
| Less than 5 Minutes | 0 (0.0%) | 0 (0.0%) |
| 5 to 9 Minutes | 0 (0.0%) | 0 (0.0%) |
| 10 to 14 Minutes | 0 (0.0%) | 15 (7.2%) |
| 15 to 19 Minutes | 0 (0.0%) | 9 (4.3%) |
| 20 to 24 Minutes | 17 (8.2%) | 55 (26.3%) |
| 25 to 29 Minutes | 6 (2.9%) | 0 (0.0%) |
| 30 to 34 Minutes | 102 (49.3%) | 47 (22.5%) |
| 35 to 39 Minutes | 12 (5.8%) | 33 (15.8%) |
| 40 to 44 Minutes | 8 (3.9%) | 30 (14.3%) |
| 45 to 59 Minutes | 62 (29.9%) | 8 (3.8%) |
| 60 to 89 Minutes | 0 (0.0%) | 12 (5.7%) |
| 90 or more Minutes | 0 (0.0%) | 0 (0.0%) |
Time of Departure to Work by Sex in Lake Secession
The most frequent times of departure to work in Lake Secession are 6:00 AM to 6:29 AM (48, 23.2%) for males and 5:30 AM to 5:59 AM (44, 21.0%) for females.
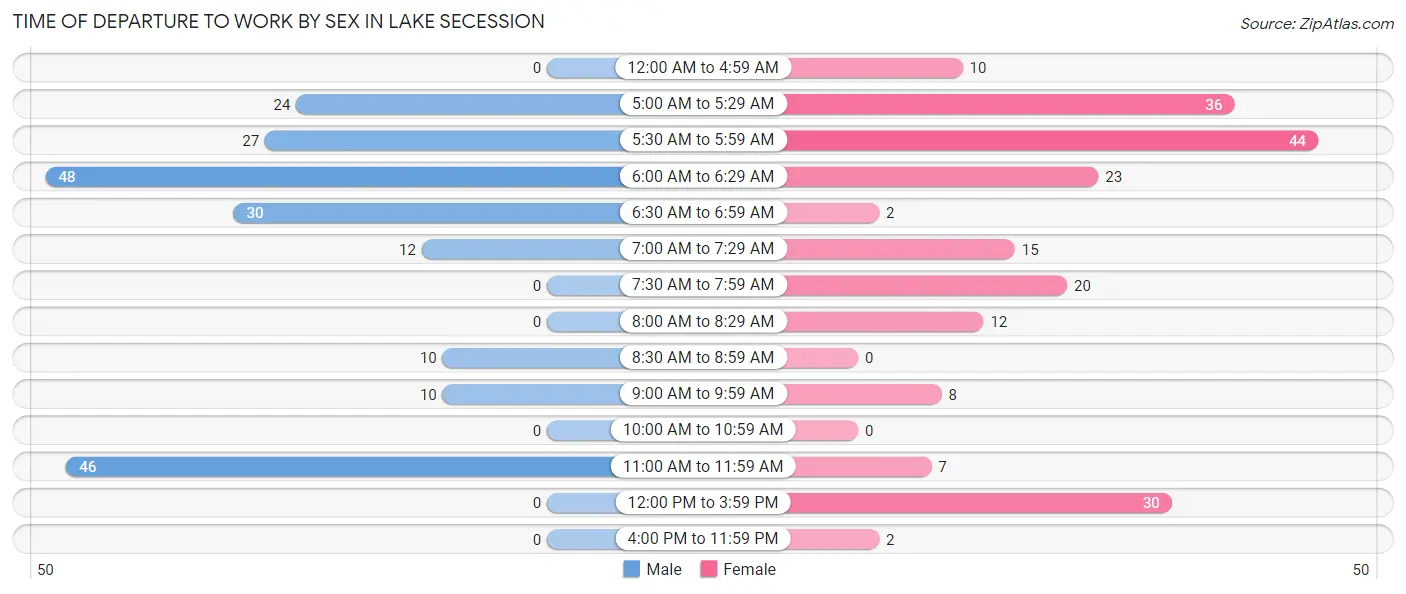
| Time of Departure | Male | Female |
| 12:00 AM to 4:59 AM | 0 (0.0%) | 10 (4.8%) |
| 5:00 AM to 5:29 AM | 24 (11.6%) | 36 (17.2%) |
| 5:30 AM to 5:59 AM | 27 (13.0%) | 44 (21.0%) |
| 6:00 AM to 6:29 AM | 48 (23.2%) | 23 (11.0%) |
| 6:30 AM to 6:59 AM | 30 (14.5%) | 2 (1.0%) |
| 7:00 AM to 7:29 AM | 12 (5.8%) | 15 (7.2%) |
| 7:30 AM to 7:59 AM | 0 (0.0%) | 20 (9.6%) |
| 8:00 AM to 8:29 AM | 0 (0.0%) | 12 (5.7%) |
| 8:30 AM to 8:59 AM | 10 (4.8%) | 0 (0.0%) |
| 9:00 AM to 9:59 AM | 10 (4.8%) | 8 (3.8%) |
| 10:00 AM to 10:59 AM | 0 (0.0%) | 0 (0.0%) |
| 11:00 AM to 11:59 AM | 46 (22.2%) | 7 (3.4%) |
| 12:00 PM to 3:59 PM | 0 (0.0%) | 30 (14.3%) |
| 4:00 PM to 11:59 PM | 0 (0.0%) | 2 (1.0%) |
| Total | 207 (100.0%) | 209 (100.0%) |
Housing Occupancy in Lake Secession
Occupancy by Ownership in Lake Secession
Of the total 547 dwellings in Lake Secession, owner-occupied units account for 527 (96.3%), while renter-occupied units make up 20 (3.7%).
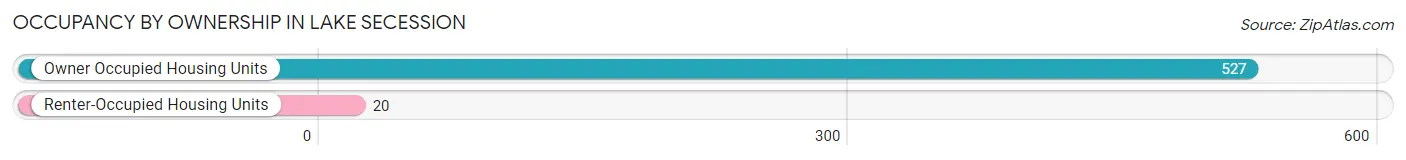
| Occupancy | # Housing Units | % Housing Units |
| Owner Occupied Housing Units | 527 | 96.3% |
| Renter-Occupied Housing Units | 20 | 3.7% |
| Total Occupied Housing Units | 547 | 100.0% |
Occupancy by Household Size in Lake Secession
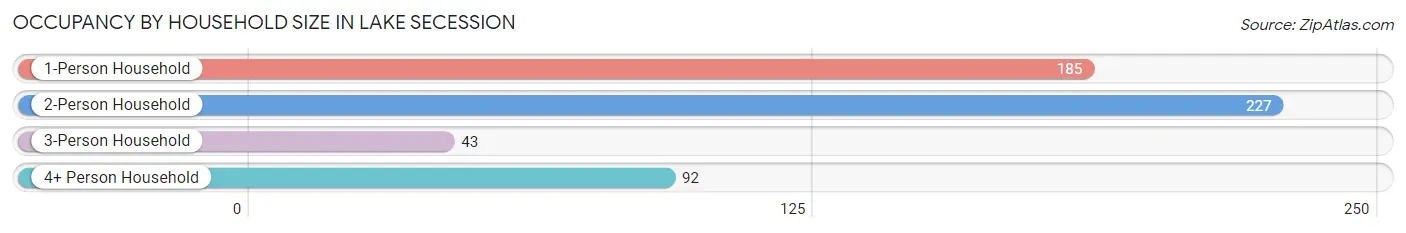
| Household Size | # Housing Units | % Housing Units |
| 1-Person Household | 185 | 33.8% |
| 2-Person Household | 227 | 41.5% |
| 3-Person Household | 43 | 7.9% |
| 4+ Person Household | 92 | 16.8% |
| Total Housing Units | 547 | 100.0% |
Occupancy by Ownership by Household Size in Lake Secession
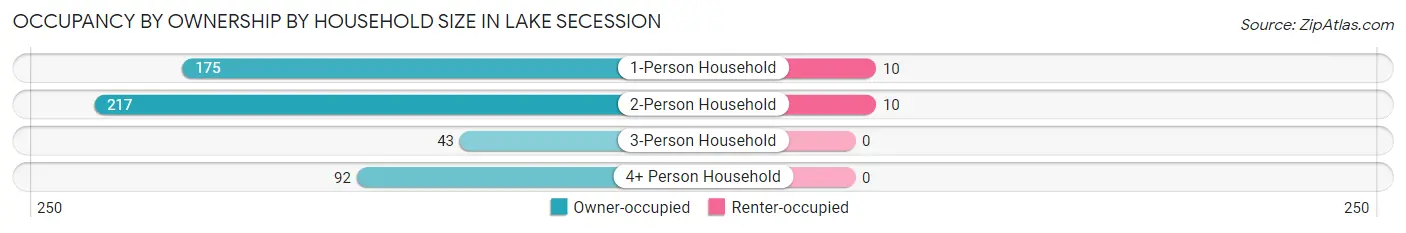
| Household Size | Owner-occupied | Renter-occupied |
| 1-Person Household | 175 (94.6%) | 10 (5.4%) |
| 2-Person Household | 217 (95.6%) | 10 (4.4%) |
| 3-Person Household | 43 (100.0%) | 0 (0.0%) |
| 4+ Person Household | 92 (100.0%) | 0 (0.0%) |
| Total Housing Units | 527 (96.3%) | 20 (3.7%) |
Occupancy by Educational Attainment in Lake Secession
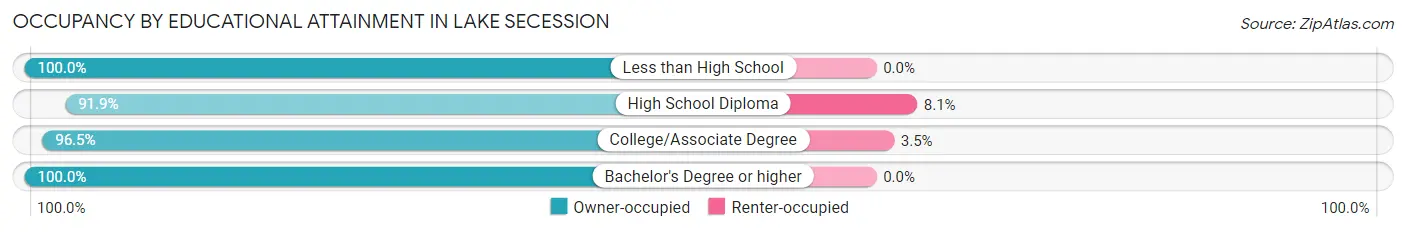
| Household Size | Owner-occupied | Renter-occupied |
| Less than High School | 7 (100.0%) | 0 (0.0%) |
| High School Diploma | 114 (91.9%) | 10 (8.1%) |
| College/Associate Degree | 275 (96.5%) | 10 (3.5%) |
| Bachelor's Degree or higher | 131 (100.0%) | 0 (0.0%) |
Occupancy by Age of Householder in Lake Secession
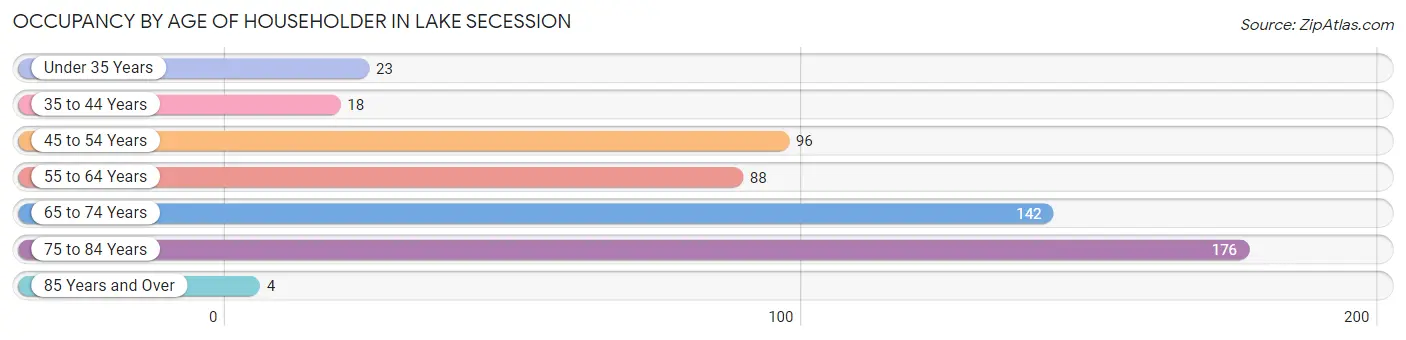
| Age Bracket | # Households | % Households |
| Under 35 Years | 23 | 4.2% |
| 35 to 44 Years | 18 | 3.3% |
| 45 to 54 Years | 96 | 17.5% |
| 55 to 64 Years | 88 | 16.1% |
| 65 to 74 Years | 142 | 26.0% |
| 75 to 84 Years | 176 | 32.2% |
| 85 Years and Over | 4 | 0.7% |
| Total | 547 | 100.0% |
Housing Finances in Lake Secession
Median Income by Occupancy in Lake Secession
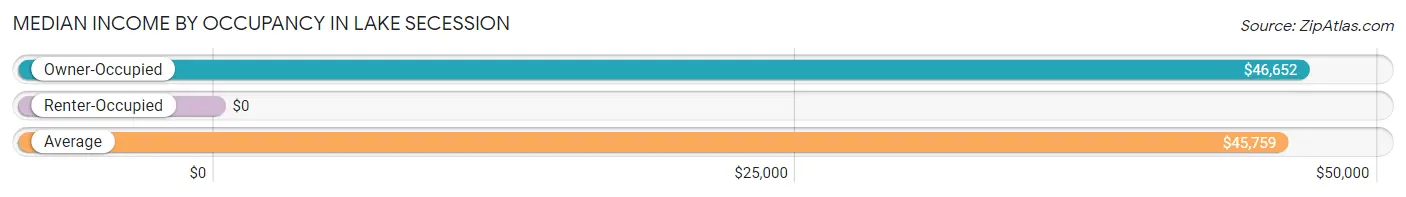
| Occupancy Type | # Households | Median Income |
| Owner-Occupied | 527 (96.3%) | $46,652 |
| Renter-Occupied | 20 (3.7%) | $0 |
| Average | 547 (100.0%) | $45,759 |
Occupancy by Householder Income Bracket in Lake Secession
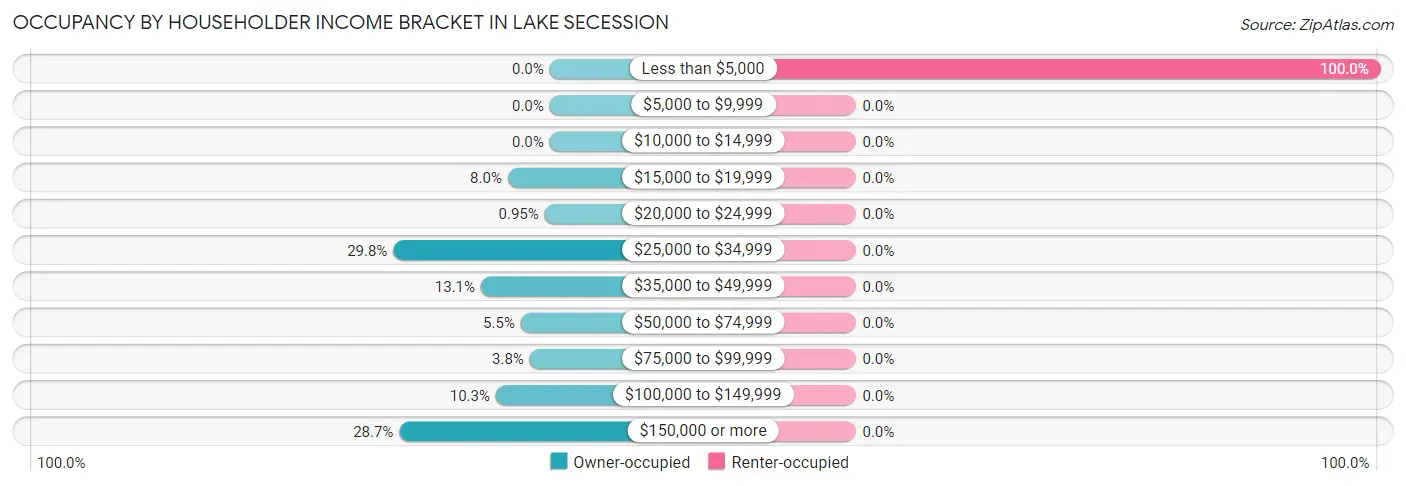
| Income Bracket | Owner-occupied | Renter-occupied |
| Less than $5,000 | 0 (0.0%) | 20 (100.0%) |
| $5,000 to $9,999 | 0 (0.0%) | 0 (0.0%) |
| $10,000 to $14,999 | 0 (0.0%) | 0 (0.0%) |
| $15,000 to $19,999 | 42 (8.0%) | 0 (0.0%) |
| $20,000 to $24,999 | 5 (0.9%) | 0 (0.0%) |
| $25,000 to $34,999 | 157 (29.8%) | 0 (0.0%) |
| $35,000 to $49,999 | 69 (13.1%) | 0 (0.0%) |
| $50,000 to $74,999 | 29 (5.5%) | 0 (0.0%) |
| $75,000 to $99,999 | 20 (3.8%) | 0 (0.0%) |
| $100,000 to $149,999 | 54 (10.2%) | 0 (0.0%) |
| $150,000 or more | 151 (28.6%) | 0 (0.0%) |
| Total | 527 (100.0%) | 20 (100.0%) |
Monthly Housing Cost Tiers in Lake Secession
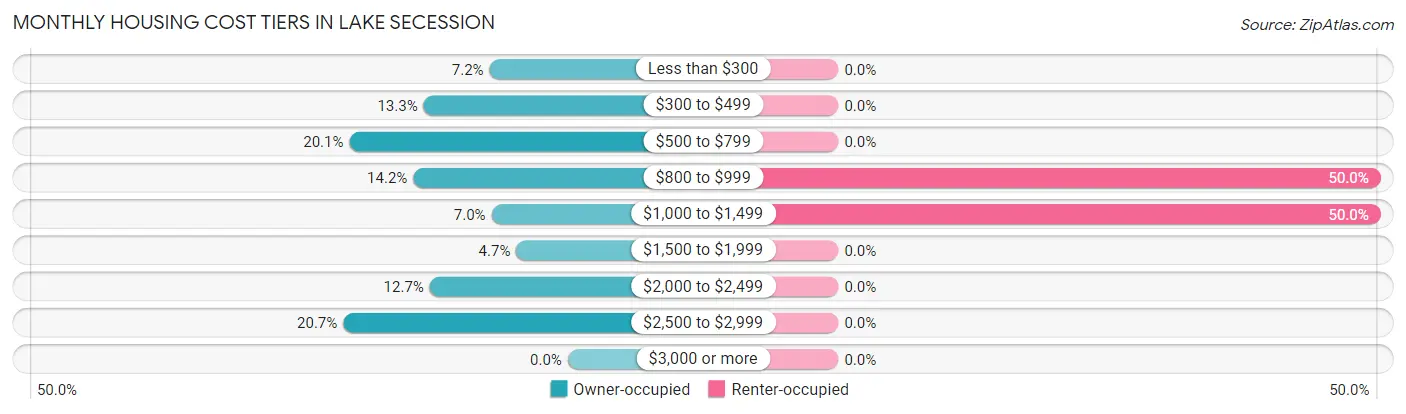
| Monthly Cost | Owner-occupied | Renter-occupied |
| Less than $300 | 38 (7.2%) | 0 (0.0%) |
| $300 to $499 | 70 (13.3%) | 0 (0.0%) |
| $500 to $799 | 106 (20.1%) | 0 (0.0%) |
| $800 to $999 | 75 (14.2%) | 10 (50.0%) |
| $1,000 to $1,499 | 37 (7.0%) | 10 (50.0%) |
| $1,500 to $1,999 | 25 (4.7%) | 0 (0.0%) |
| $2,000 to $2,499 | 67 (12.7%) | 0 (0.0%) |
| $2,500 to $2,999 | 109 (20.7%) | 0 (0.0%) |
| $3,000 or more | 0 (0.0%) | 0 (0.0%) |
| Total | 527 (100.0%) | 20 (100.0%) |
Physical Housing Characteristics in Lake Secession
Housing Structures in Lake Secession
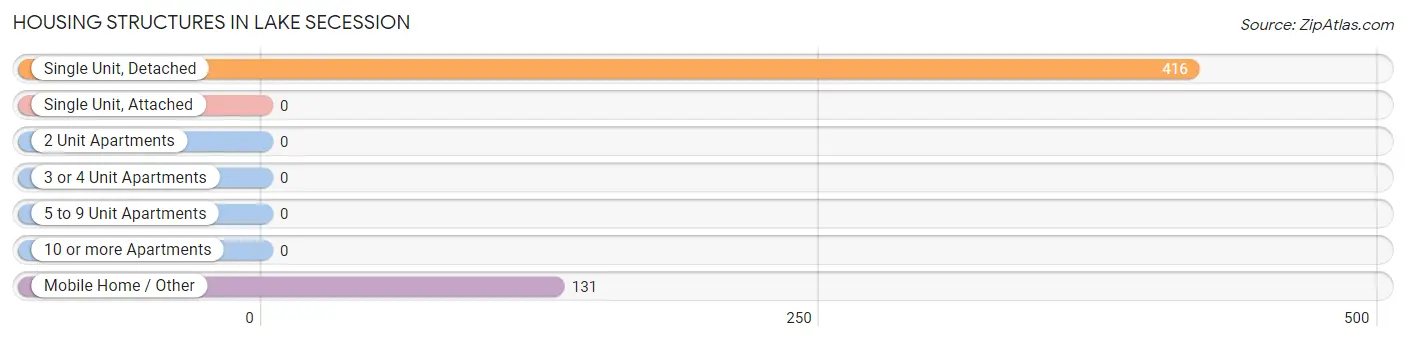
| Structure Type | # Housing Units | % Housing Units |
| Single Unit, Detached | 416 | 76.0% |
| Single Unit, Attached | 0 | 0.0% |
| 2 Unit Apartments | 0 | 0.0% |
| 3 or 4 Unit Apartments | 0 | 0.0% |
| 5 to 9 Unit Apartments | 0 | 0.0% |
| 10 or more Apartments | 0 | 0.0% |
| Mobile Home / Other | 131 | 23.9% |
| Total | 547 | 100.0% |
Housing Structures by Occupancy in Lake Secession
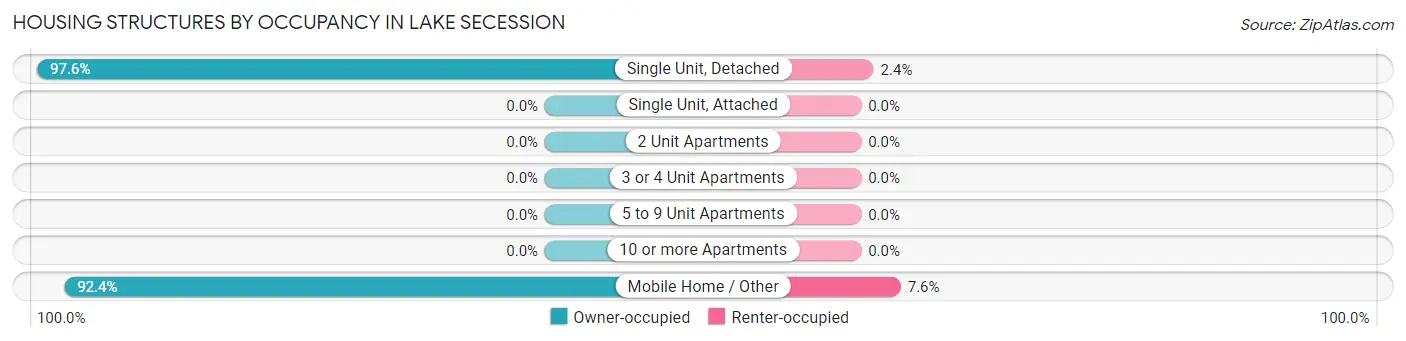
| Structure Type | Owner-occupied | Renter-occupied |
| Single Unit, Detached | 406 (97.6%) | 10 (2.4%) |
| Single Unit, Attached | 0 (0.0%) | 0 (0.0%) |
| 2 Unit Apartments | 0 (0.0%) | 0 (0.0%) |
| 3 or 4 Unit Apartments | 0 (0.0%) | 0 (0.0%) |
| 5 to 9 Unit Apartments | 0 (0.0%) | 0 (0.0%) |
| 10 or more Apartments | 0 (0.0%) | 0 (0.0%) |
| Mobile Home / Other | 121 (92.4%) | 10 (7.6%) |
| Total | 527 (96.3%) | 20 (3.7%) |
Housing Structures by Number of Rooms in Lake Secession
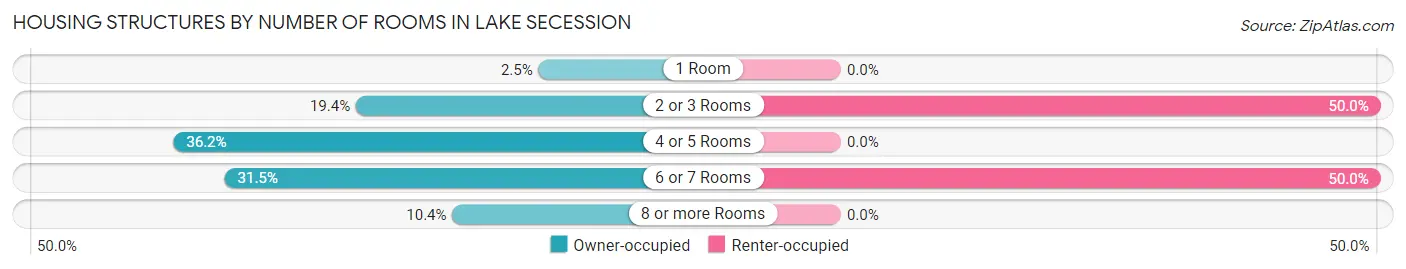
| Number of Rooms | Owner-occupied | Renter-occupied |
| 1 Room | 13 (2.5%) | 0 (0.0%) |
| 2 or 3 Rooms | 102 (19.4%) | 10 (50.0%) |
| 4 or 5 Rooms | 191 (36.2%) | 0 (0.0%) |
| 6 or 7 Rooms | 166 (31.5%) | 10 (50.0%) |
| 8 or more Rooms | 55 (10.4%) | 0 (0.0%) |
| Total | 527 (100.0%) | 20 (100.0%) |
Housing Structure by Heating Type in Lake Secession
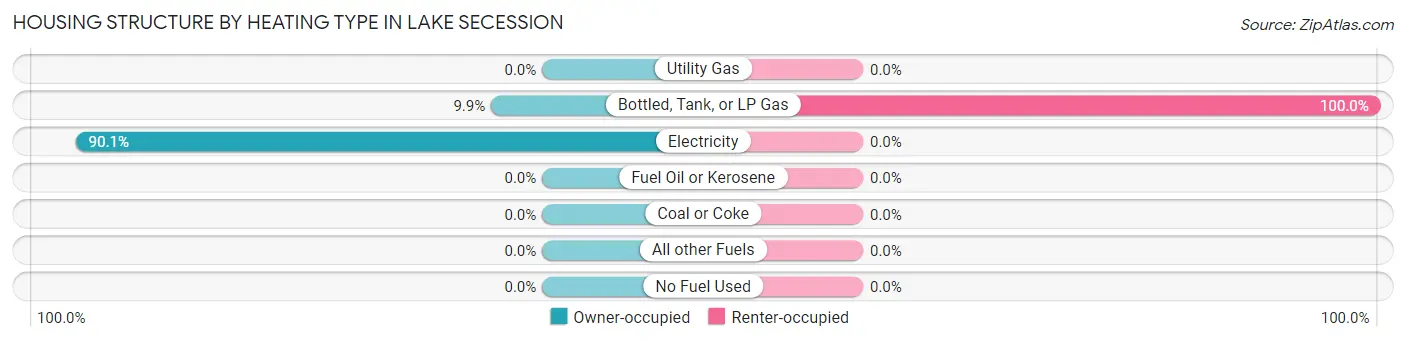
| Heating Type | Owner-occupied | Renter-occupied |
| Utility Gas | 0 (0.0%) | 0 (0.0%) |
| Bottled, Tank, or LP Gas | 52 (9.9%) | 20 (100.0%) |
| Electricity | 475 (90.1%) | 0 (0.0%) |
| Fuel Oil or Kerosene | 0 (0.0%) | 0 (0.0%) |
| Coal or Coke | 0 (0.0%) | 0 (0.0%) |
| All other Fuels | 0 (0.0%) | 0 (0.0%) |
| No Fuel Used | 0 (0.0%) | 0 (0.0%) |
| Total | 527 (100.0%) | 20 (100.0%) |
Household Vehicle Usage in Lake Secession
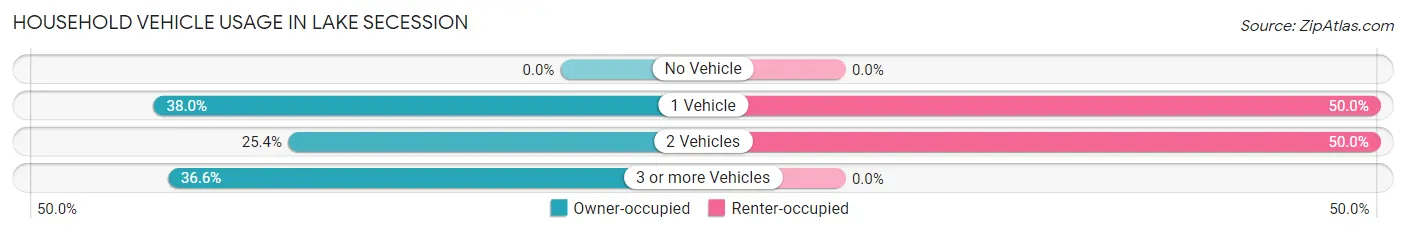
| Vehicles per Household | Owner-occupied | Renter-occupied |
| No Vehicle | 0 (0.0%) | 0 (0.0%) |
| 1 Vehicle | 200 (38.0%) | 10 (50.0%) |
| 2 Vehicles | 134 (25.4%) | 10 (50.0%) |
| 3 or more Vehicles | 193 (36.6%) | 0 (0.0%) |
| Total | 527 (100.0%) | 20 (100.0%) |
Real Estate & Mortgages in Lake Secession
Real Estate and Mortgage Overview in Lake Secession
| Characteristic | Without Mortgage | With Mortgage |
| Housing Units | 204 | 323 |
| Median Property Value | $302,000 | $331,200 |
| Median Household Income | - | - |
| Monthly Housing Costs | $471 | $0 |
| Real Estate Taxes | $973 | $0 |
Property Value by Mortgage Status in Lake Secession
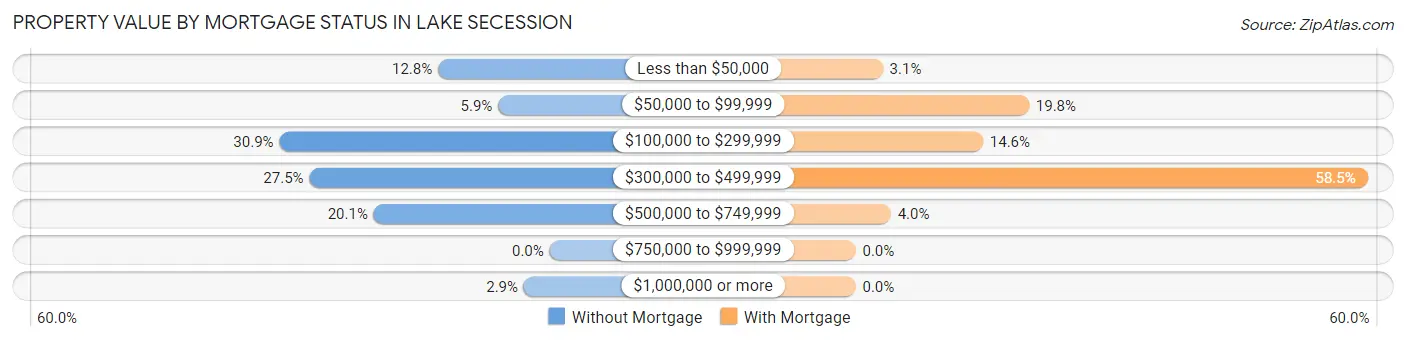
| Property Value | Without Mortgage | With Mortgage |
| Less than $50,000 | 26 (12.8%) | 10 (3.1%) |
| $50,000 to $99,999 | 12 (5.9%) | 64 (19.8%) |
| $100,000 to $299,999 | 63 (30.9%) | 47 (14.5%) |
| $300,000 to $499,999 | 56 (27.5%) | 189 (58.5%) |
| $500,000 to $749,999 | 41 (20.1%) | 13 (4.0%) |
| $750,000 to $999,999 | 0 (0.0%) | 0 (0.0%) |
| $1,000,000 or more | 6 (2.9%) | 0 (0.0%) |
| Total | 204 (100.0%) | 323 (100.0%) |
Household Income by Mortgage Status in Lake Secession
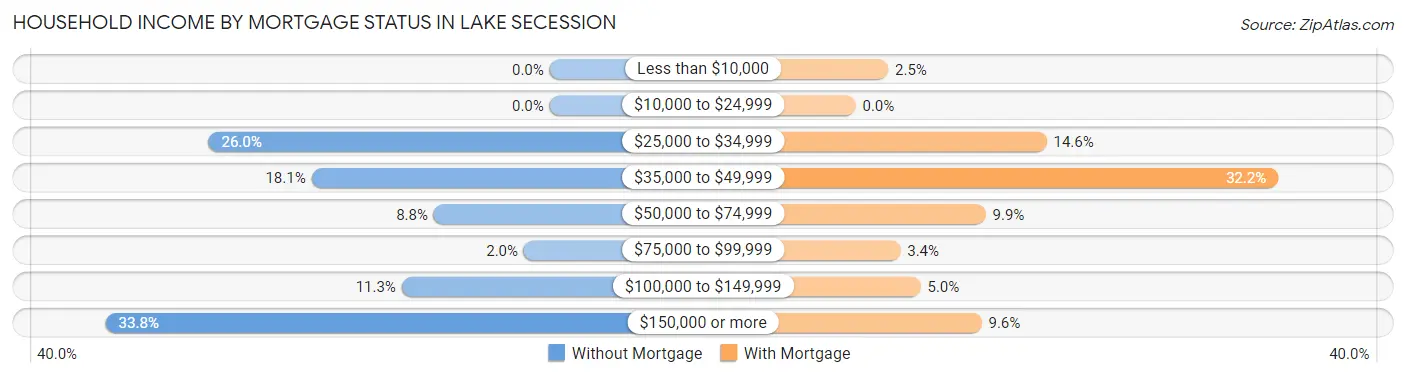
| Household Income | Without Mortgage | With Mortgage |
| Less than $10,000 | 0 (0.0%) | 8 (2.5%) |
| $10,000 to $24,999 | 0 (0.0%) | 0 (0.0%) |
| $25,000 to $34,999 | 53 (26.0%) | 47 (14.5%) |
| $35,000 to $49,999 | 37 (18.1%) | 104 (32.2%) |
| $50,000 to $74,999 | 18 (8.8%) | 32 (9.9%) |
| $75,000 to $99,999 | 4 (2.0%) | 11 (3.4%) |
| $100,000 to $149,999 | 23 (11.3%) | 16 (5.0%) |
| $150,000 or more | 69 (33.8%) | 31 (9.6%) |
| Total | 204 (100.0%) | 323 (100.0%) |
Property Value to Household Income Ratio in Lake Secession
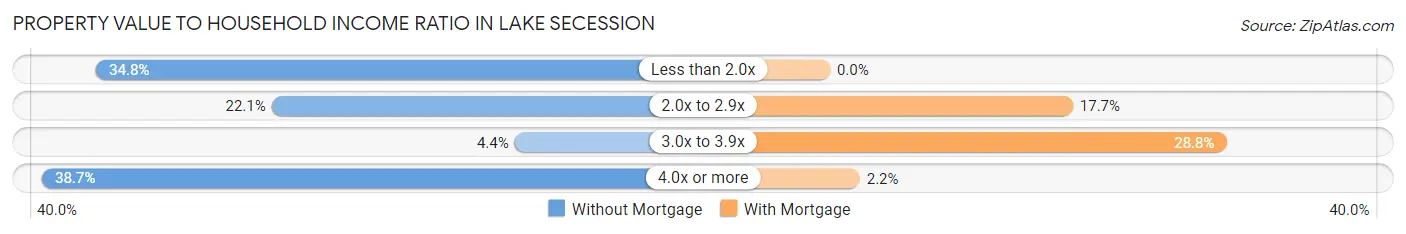
| Value-to-Income Ratio | Without Mortgage | With Mortgage |
| Less than 2.0x | 71 (34.8%) | 0 (0.0%) |
| 2.0x to 2.9x | 45 (22.1%) | 57 (17.6%) |
| 3.0x to 3.9x | 9 (4.4%) | 93 (28.8%) |
| 4.0x or more | 79 (38.7%) | 7 (2.2%) |
| Total | 204 (100.0%) | 323 (100.0%) |
Real Estate Taxes by Mortgage Status in Lake Secession
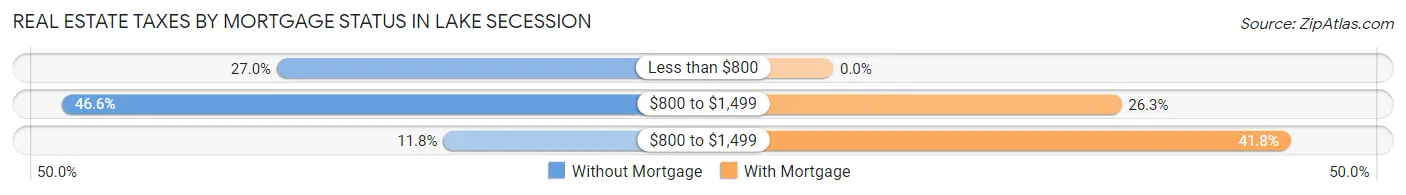
| Property Taxes | Without Mortgage | With Mortgage |
| Less than $800 | 55 (27.0%) | 0 (0.0%) |
| $800 to $1,499 | 95 (46.6%) | 85 (26.3%) |
| $800 to $1,499 | 24 (11.8%) | 135 (41.8%) |
| Total | 204 (100.0%) | 323 (100.0%) |
Health & Disability in Lake Secession
Health Insurance Coverage by Age in Lake Secession
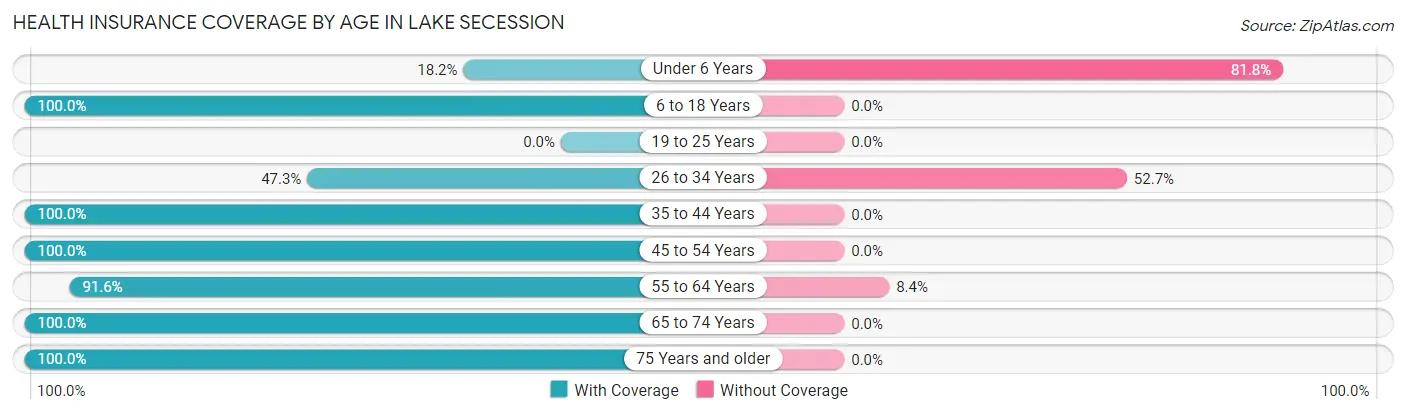
| Age Bracket | With Coverage | Without Coverage |
| Under 6 Years | 8 (18.2%) | 36 (81.8%) |
| 6 to 18 Years | 218 (100.0%) | 0 (0.0%) |
| 19 to 25 Years | 0 (0.0%) | 0 (0.0%) |
| 26 to 34 Years | 35 (47.3%) | 39 (52.7%) |
| 35 to 44 Years | 33 (100.0%) | 0 (0.0%) |
| 45 to 54 Years | 209 (100.0%) | 0 (0.0%) |
| 55 to 64 Years | 219 (91.6%) | 20 (8.4%) |
| 65 to 74 Years | 215 (100.0%) | 0 (0.0%) |
| 75 Years and older | 214 (100.0%) | 0 (0.0%) |
| Total | 1,151 (92.4%) | 95 (7.6%) |
Health Insurance Coverage by Citizenship Status in Lake Secession
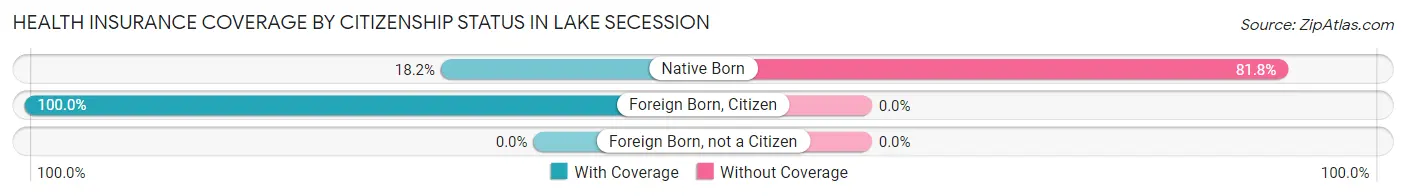
| Citizenship Status | With Coverage | Without Coverage |
| Native Born | 8 (18.2%) | 36 (81.8%) |
| Foreign Born, Citizen | 218 (100.0%) | 0 (0.0%) |
| Foreign Born, not a Citizen | 0 (0.0%) | 0 (0.0%) |
Health Insurance Coverage by Household Income in Lake Secession
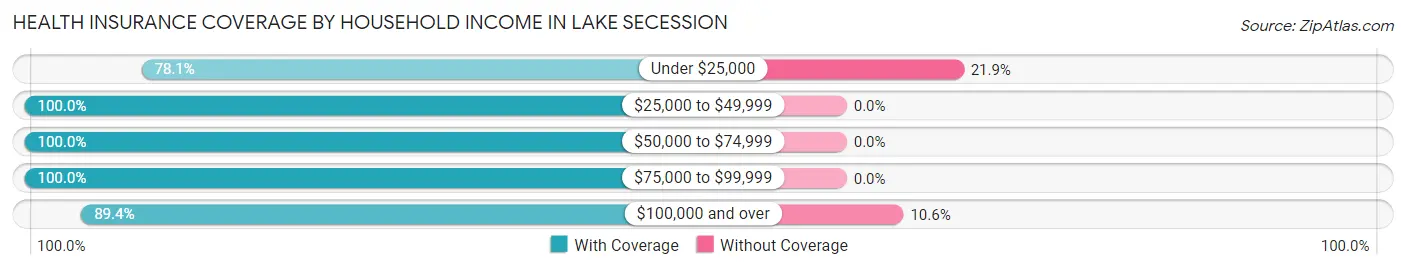
| Household Income | With Coverage | Without Coverage |
| Under $25,000 | 82 (78.1%) | 23 (21.9%) |
| $25,000 to $49,999 | 352 (100.0%) | 0 (0.0%) |
| $50,000 to $74,999 | 67 (100.0%) | 0 (0.0%) |
| $75,000 to $99,999 | 44 (100.0%) | 0 (0.0%) |
| $100,000 and over | 606 (89.4%) | 72 (10.6%) |
Public vs Private Health Insurance Coverage by Age in Lake Secession
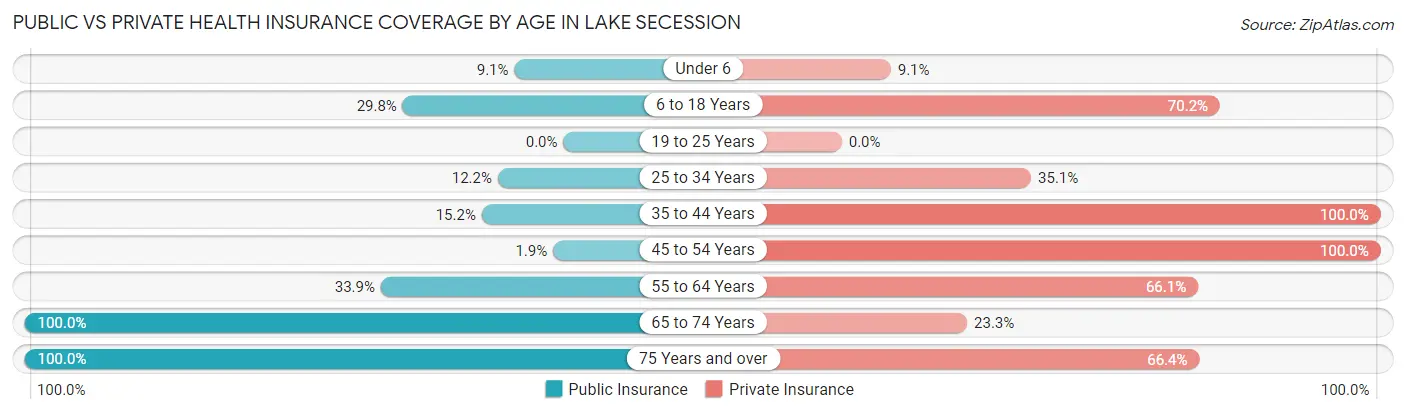
| Age Bracket | Public Insurance | Private Insurance |
| Under 6 | 4 (9.1%) | 4 (9.1%) |
| 6 to 18 Years | 65 (29.8%) | 153 (70.2%) |
| 19 to 25 Years | 0 (0.0%) | 0 (0.0%) |
| 25 to 34 Years | 9 (12.2%) | 26 (35.1%) |
| 35 to 44 Years | 5 (15.1%) | 33 (100.0%) |
| 45 to 54 Years | 4 (1.9%) | 209 (100.0%) |
| 55 to 64 Years | 81 (33.9%) | 158 (66.1%) |
| 65 to 74 Years | 215 (100.0%) | 50 (23.3%) |
| 75 Years and over | 214 (100.0%) | 142 (66.4%) |
| Total | 597 (47.9%) | 775 (62.2%) |
Disability Status by Sex by Age in Lake Secession
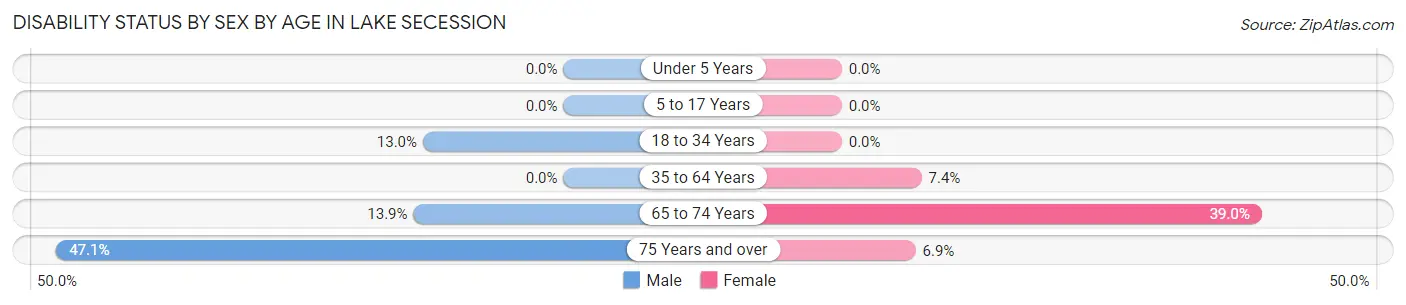
| Age Bracket | Male | Female |
| Under 5 Years | 0 (0.0%) | 0 (0.0%) |
| 5 to 17 Years | 0 (0.0%) | 0 (0.0%) |
| 18 to 34 Years | 3 (13.0%) | 0 (0.0%) |
| 35 to 64 Years | 0 (0.0%) | 20 (7.4%) |
| 65 to 74 Years | 11 (13.9%) | 53 (39.0%) |
| 75 Years and over | 32 (47.1%) | 10 (6.9%) |
Disability Class by Sex by Age in Lake Secession
Disability Class: Hearing Difficulty
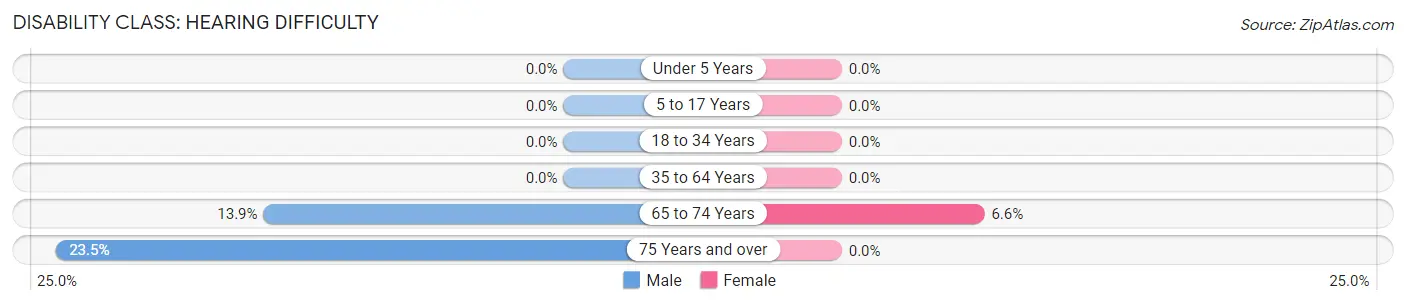
| Age Bracket | Male | Female |
| Under 5 Years | 0 (0.0%) | 0 (0.0%) |
| 5 to 17 Years | 0 (0.0%) | 0 (0.0%) |
| 18 to 34 Years | 0 (0.0%) | 0 (0.0%) |
| 35 to 64 Years | 0 (0.0%) | 0 (0.0%) |
| 65 to 74 Years | 11 (13.9%) | 9 (6.6%) |
| 75 Years and over | 16 (23.5%) | 0 (0.0%) |
Disability Class: Vision Difficulty
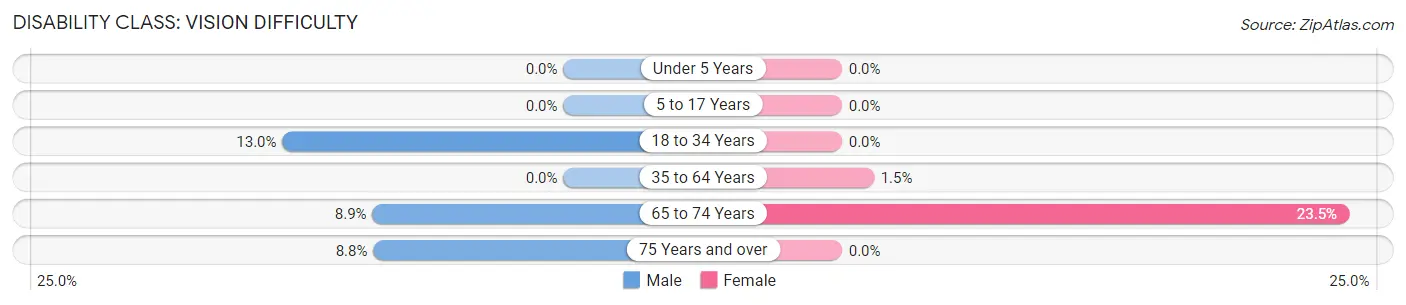
| Age Bracket | Male | Female |
| Under 5 Years | 0 (0.0%) | 0 (0.0%) |
| 5 to 17 Years | 0 (0.0%) | 0 (0.0%) |
| 18 to 34 Years | 3 (13.0%) | 0 (0.0%) |
| 35 to 64 Years | 0 (0.0%) | 4 (1.5%) |
| 65 to 74 Years | 7 (8.9%) | 32 (23.5%) |
| 75 Years and over | 6 (8.8%) | 0 (0.0%) |
Disability Class: Cognitive Difficulty
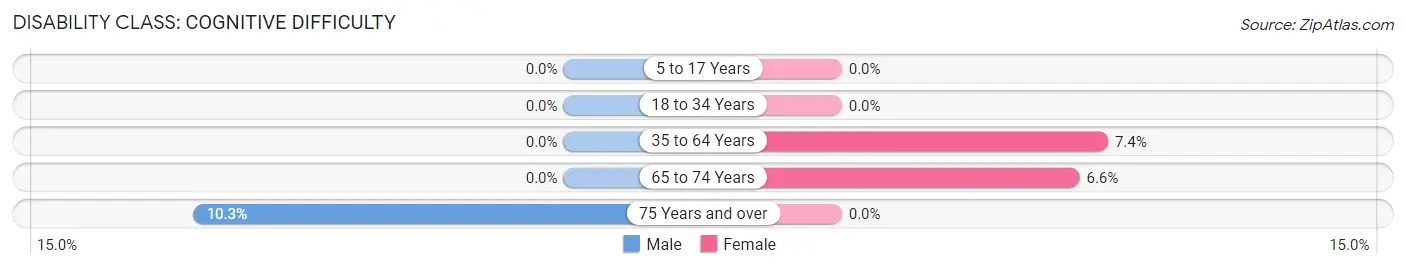
| Age Bracket | Male | Female |
| 5 to 17 Years | 0 (0.0%) | 0 (0.0%) |
| 18 to 34 Years | 0 (0.0%) | 0 (0.0%) |
| 35 to 64 Years | 0 (0.0%) | 20 (7.4%) |
| 65 to 74 Years | 0 (0.0%) | 9 (6.6%) |
| 75 Years and over | 7 (10.3%) | 0 (0.0%) |
Disability Class: Ambulatory Difficulty
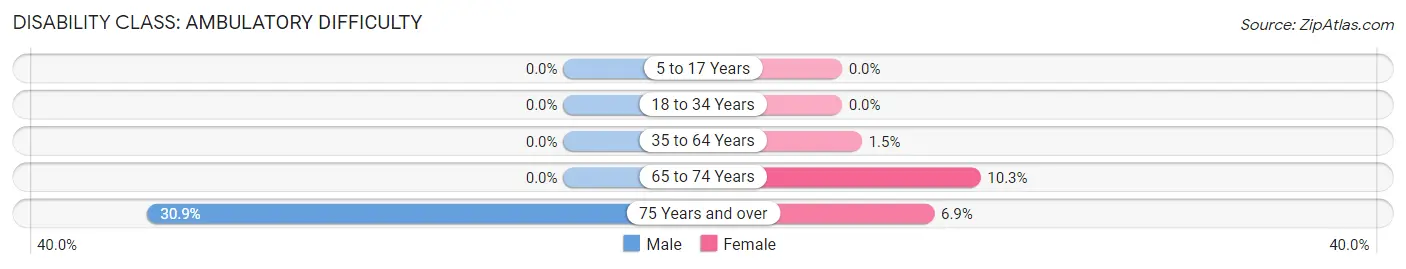
| Age Bracket | Male | Female |
| 5 to 17 Years | 0 (0.0%) | 0 (0.0%) |
| 18 to 34 Years | 0 (0.0%) | 0 (0.0%) |
| 35 to 64 Years | 0 (0.0%) | 4 (1.5%) |
| 65 to 74 Years | 0 (0.0%) | 14 (10.3%) |
| 75 Years and over | 21 (30.9%) | 10 (6.9%) |
Disability Class: Self-Care Difficulty
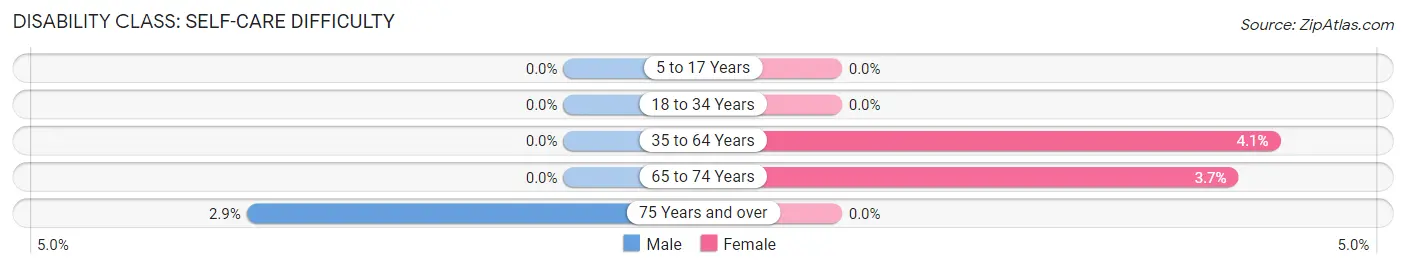
| Age Bracket | Male | Female |
| 5 to 17 Years | 0 (0.0%) | 0 (0.0%) |
| 18 to 34 Years | 0 (0.0%) | 0 (0.0%) |
| 35 to 64 Years | 0 (0.0%) | 11 (4.1%) |
| 65 to 74 Years | 0 (0.0%) | 5 (3.7%) |
| 75 Years and over | 2 (2.9%) | 0 (0.0%) |
Technology Access in Lake Secession
Computing Device Access in Lake Secession
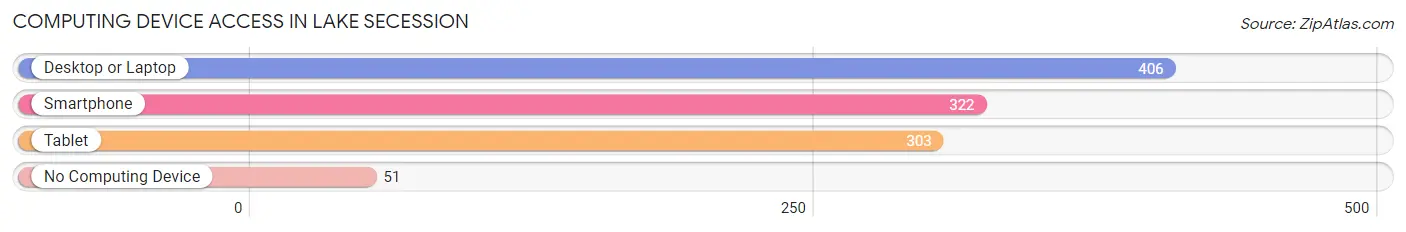
| Device Type | # Households | % Households |
| Desktop or Laptop | 406 | 74.2% |
| Smartphone | 322 | 58.9% |
| Tablet | 303 | 55.4% |
| No Computing Device | 51 | 9.3% |
| Total | 547 | 100.0% |
Internet Access in Lake Secession
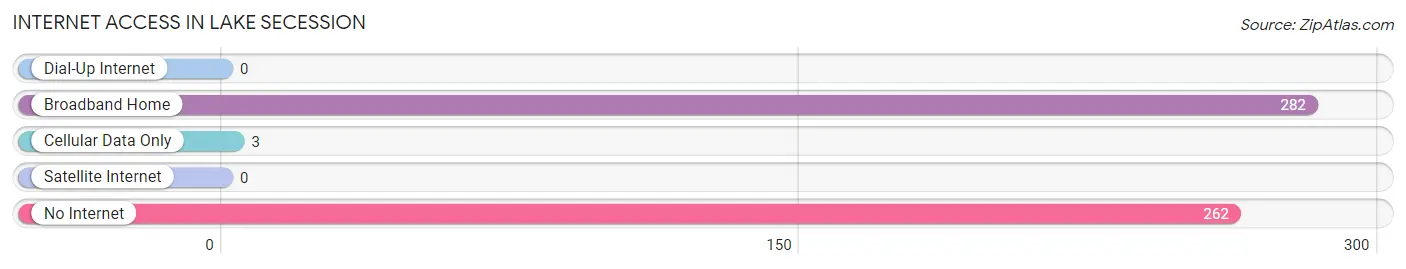
| Internet Type | # Households | % Households |
| Dial-Up Internet | 0 | 0.0% |
| Broadband Home | 282 | 51.5% |
| Cellular Data Only | 3 | 0.5% |
| Satellite Internet | 0 | 0.0% |
| No Internet | 262 | 47.9% |
| Total | 547 | 100.0% |
Lake Secession Summary
History
Lake Secession is a small town located in Abbeville County, South Carolina. It is situated on the shores of Lake Secession, a man-made lake created in the 1950s. The lake was created by the South Carolina Electric and Gas Company (SCE&G) to provide hydroelectric power to the area. The lake is named after the Secession Convention of 1860, which was held in Abbeville County and resulted in South Carolina becoming the first state to secede from the Union.
The town of Lake Secession was founded in the late 1950s, shortly after the lake was created. The town was originally known as “Secessionville”, but the name was changed to Lake Secession in the early 1960s. The town was incorporated in 1962 and has since grown to a population of approximately 1,000 people.
Geography
Lake Secession is located in the Piedmont region of South Carolina, approximately 30 miles south of Greenville. The town is situated on the shores of Lake Secession, a man-made lake created in the 1950s. The lake is approximately 1,000 acres in size and is fed by the Saluda River. The lake is a popular destination for fishing, boating, and other recreational activities.
The town of Lake Secession is surrounded by rolling hills and forests. The town is located in a rural area, with the nearest major city being Greenville, which is approximately 30 miles away.
Economy
The economy of Lake Secession is largely based on tourism and agriculture. The town is a popular destination for fishing, boating, and other recreational activities. The lake is also home to several marinas, which provide boat rentals and other services.
Agriculture is also an important part of the local economy. The area is home to several farms, which produce a variety of crops, including corn, soybeans, and cotton.
Demographics
As of the 2010 census, the population of Lake Secession was 1,000 people. The racial makeup of the town was 94.2% White, 3.2% African American, 0.7% Native American, 0.3% Asian, and 1.6% from other races. The median household income was $37,500, and the median family income was $45,000. The per capita income was $19,000.
Conclusion
Lake Secession is a small town located in Abbeville County, South Carolina. It is situated on the shores of Lake Secession, a man-made lake created in the 1950s. The town was founded in the late 1950s and has since grown to a population of approximately 1,000 people. The economy of Lake Secession is largely based on tourism and agriculture, and the town is a popular destination for fishing, boating, and other recreational activities. The racial makeup of the town is 94.2% White, 3.2% African American, 0.7% Native American, 0.3% Asian, and 1.6% from other races. The median household income was $37,500, and the median family income was $45,000.
Common Questions
What is Per Capita Income in Lake Secession?
Per Capita income in Lake Secession is $37,864.
What is the Median Family Income in Lake Secession?
Median Family Income in Lake Secession is $87,006.
What is the Median Household income in Lake Secession?
Median Household Income in Lake Secession is $45,759.
What is Income or Wage Gap in Lake Secession?
Income or Wage Gap in Lake Secession is 29.1%.
Women in Lake Secession earn 70.9 cents for every dollar earned by a man.
What is Inequality or Gini Index in Lake Secession?
Inequality or Gini Index in Lake Secession is 0.43.
What is the Total Population of Lake Secession?
Total Population of Lake Secession is 1,246.
What is the Total Male Population of Lake Secession?
Total Male Population of Lake Secession is 481.
What is the Total Female Population of Lake Secession?
Total Female Population of Lake Secession is 765.
What is the Ratio of Males per 100 Females in Lake Secession?
There are 62.88 Males per 100 Females in Lake Secession.
What is the Ratio of Females per 100 Males in Lake Secession?
There are 159.04 Females per 100 Males in Lake Secession.
What is the Median Population Age in Lake Secession?
Median Population Age in Lake Secession is 56.8 Years.
What is the Average Family Size in Lake Secession
Average Family Size in Lake Secession is 2.8 People.
What is the Average Household Size in Lake Secession
Average Household Size in Lake Secession is 2.3 People.
How Large is the Labor Force in Lake Secession?
There are 479 People in the Labor Forcein in Lake Secession.
What is the Percentage of People in the Labor Force in Lake Secession?
44.1% of People are in the Labor Force in Lake Secession.
What is the Unemployment Rate in Lake Secession?
Unemployment Rate in Lake Secession is 6.9%.