Jefferson, SC Map & Demographics
Jefferson Map
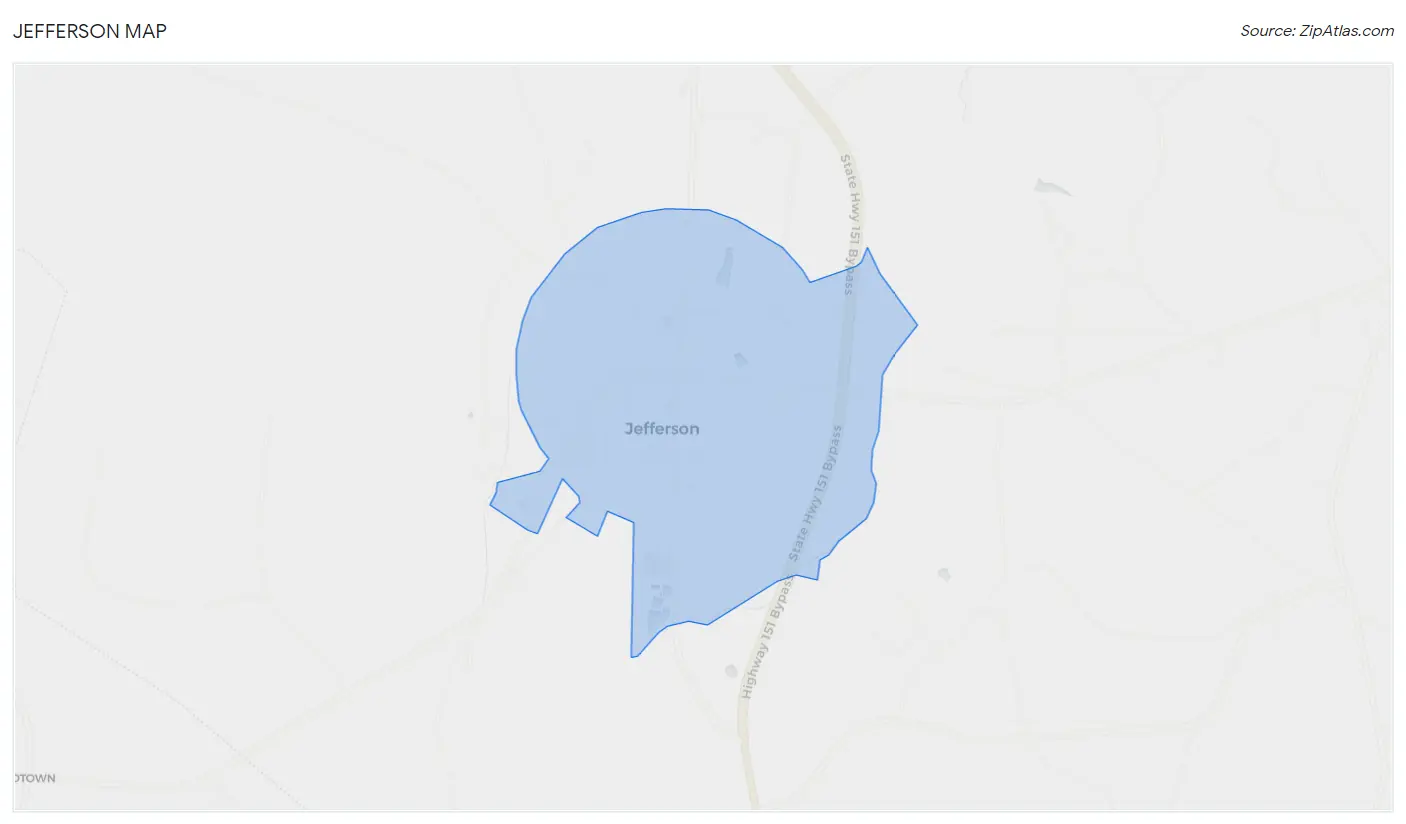
Jefferson Overview
$25,763
PER CAPITA INCOME
$53,958
AVG FAMILY INCOME
$35,208
AVG HOUSEHOLD INCOME
46.3%
WAGE / INCOME GAP [ % ]
53.7¢/ $1
WAGE / INCOME GAP [ $ ]
$11,993
FAMILY INCOME DEFICIT
0.51
INEQUALITY / GINI INDEX
830
TOTAL POPULATION
392
MALE POPULATION
438
FEMALE POPULATION
89.50
MALES / 100 FEMALES
111.73
FEMALES / 100 MALES
32.6
MEDIAN AGE
3.1
AVG FAMILY SIZE
2.5
AVG HOUSEHOLD SIZE
401
LABOR FORCE [ PEOPLE ]
63.2%
PERCENT IN LABOR FORCE
9.7%
UNEMPLOYMENT RATE
Jefferson Zip Codes
Jefferson Area Codes
Income in Jefferson
Income Overview in Jefferson
Per Capita Income in Jefferson is $25,763, while median incomes of families and households are $53,958 and $35,208 respectively.
| Characteristic | Number | Measure |
| Per Capita Income | 830 | $25,763 |
| Median Family Income | 221 | $53,958 |
| Mean Family Income | 221 | $67,306 |
| Median Household Income | 327 | $35,208 |
| Mean Household Income | 327 | $61,045 |
| Income Deficit | 221 | $11,993 |
| Wage / Income Gap (%) | 830 | 46.31% |
| Wage / Income Gap ($) | 830 | 53.69¢ per $1 |
| Gini / Inequality Index | 830 | 0.51 |
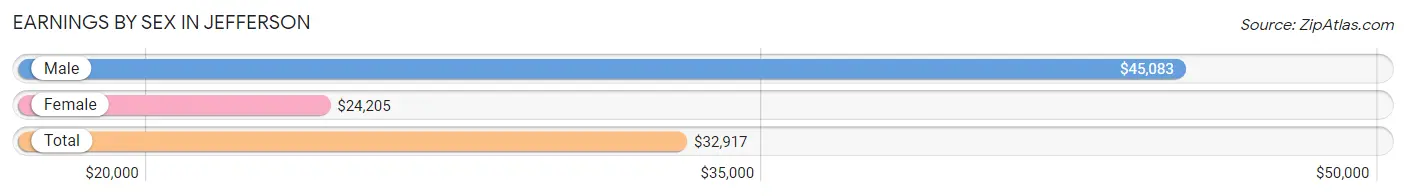
Earnings by Sex in Jefferson
Average Earnings in Jefferson are $32,917, $45,083 for men and $24,205 for women, a difference of 46.3%.
| Sex | Number | Average Earnings |
| Male | 187 (47.7%) | $45,083 |
| Female | 205 (52.3%) | $24,205 |
| Total | 392 (100.0%) | $32,917 |
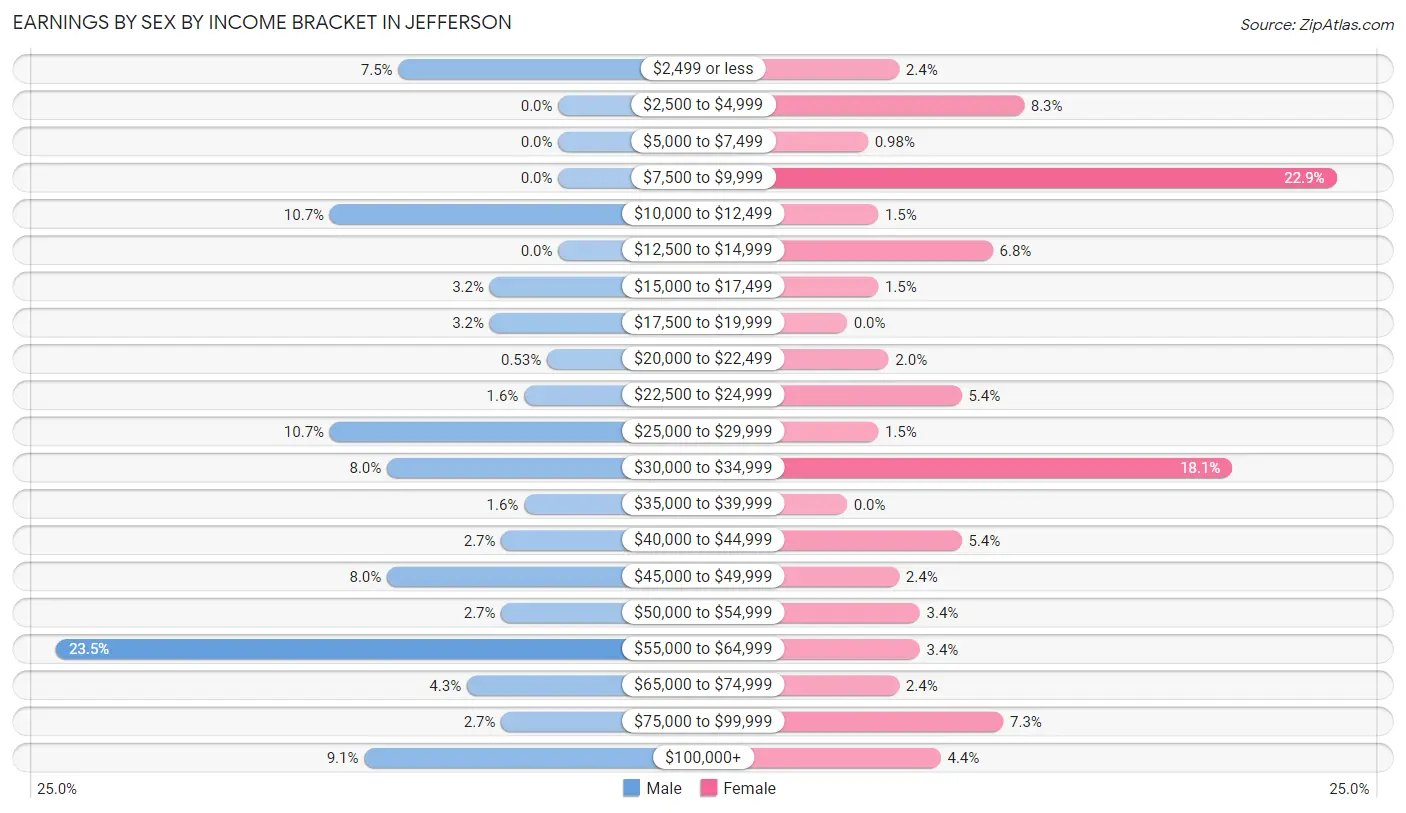
Earnings by Sex by Income Bracket in Jefferson
The most common earnings brackets in Jefferson are $55,000 to $64,999 for men (44 | 23.5%) and $7,500 to $9,999 for women (47 | 22.9%).
| Income | Male | Female |
| $2,499 or less | 14 (7.5%) | 5 (2.4%) |
| $2,500 to $4,999 | 0 (0.0%) | 17 (8.3%) |
| $5,000 to $7,499 | 0 (0.0%) | 2 (1.0%) |
| $7,500 to $9,999 | 0 (0.0%) | 47 (22.9%) |
| $10,000 to $12,499 | 20 (10.7%) | 3 (1.5%) |
| $12,500 to $14,999 | 0 (0.0%) | 14 (6.8%) |
| $15,000 to $17,499 | 6 (3.2%) | 3 (1.5%) |
| $17,500 to $19,999 | 6 (3.2%) | 0 (0.0%) |
| $20,000 to $22,499 | 1 (0.5%) | 4 (1.9%) |
| $22,500 to $24,999 | 3 (1.6%) | 11 (5.4%) |
| $25,000 to $29,999 | 20 (10.7%) | 3 (1.5%) |
| $30,000 to $34,999 | 15 (8.0%) | 37 (18.0%) |
| $35,000 to $39,999 | 3 (1.6%) | 0 (0.0%) |
| $40,000 to $44,999 | 5 (2.7%) | 11 (5.4%) |
| $45,000 to $49,999 | 15 (8.0%) | 5 (2.4%) |
| $50,000 to $54,999 | 5 (2.7%) | 7 (3.4%) |
| $55,000 to $64,999 | 44 (23.5%) | 7 (3.4%) |
| $65,000 to $74,999 | 8 (4.3%) | 5 (2.4%) |
| $75,000 to $99,999 | 5 (2.7%) | 15 (7.3%) |
| $100,000+ | 17 (9.1%) | 9 (4.4%) |
| Total | 187 (100.0%) | 205 (100.0%) |
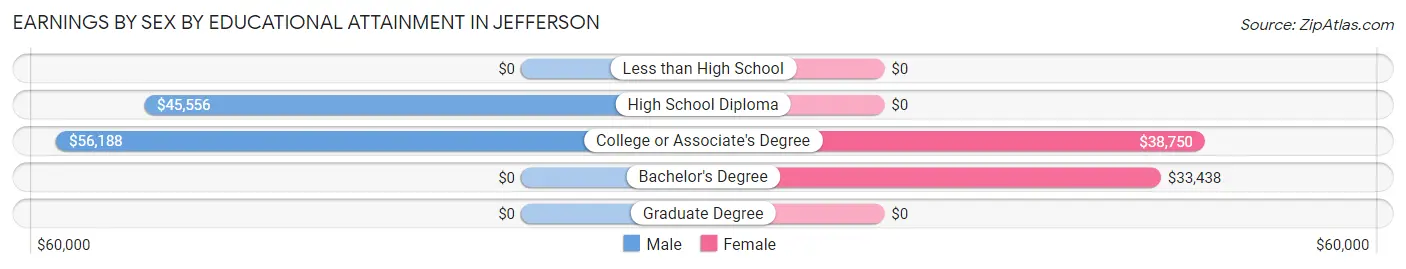
Earnings by Sex by Educational Attainment in Jefferson
Average earnings in Jefferson are $46,750 for men and $32,917 for women, a difference of 29.6%. Men with an educational attainment of college or associate's degree enjoy the highest average annual earnings of $56,188, while those with high school diploma education earn the least with $45,556. Women with an educational attainment of college or associate's degree earn the most with the average annual earnings of $38,750, while those with bachelor's degree education have the smallest earnings of $33,438.
| Educational Attainment | Male Income | Female Income |
| Less than High School | - | - |
| High School Diploma | $45,556 | $0 |
| College or Associate's Degree | $56,188 | $38,750 |
| Bachelor's Degree | - | - |
| Graduate Degree | - | - |
| Total | $46,750 | $32,917 |
Family Income in Jefferson
Family Income Brackets in Jefferson
According to the Jefferson family income data, there are 38 families falling into the $75,000 to $99,999 income range, which is the most common income bracket and makes up 17.2% of all families. Conversely, the $10,000 to $14,999 income bracket is the least frequent group with only 3 families (1.4%) belonging to this category.
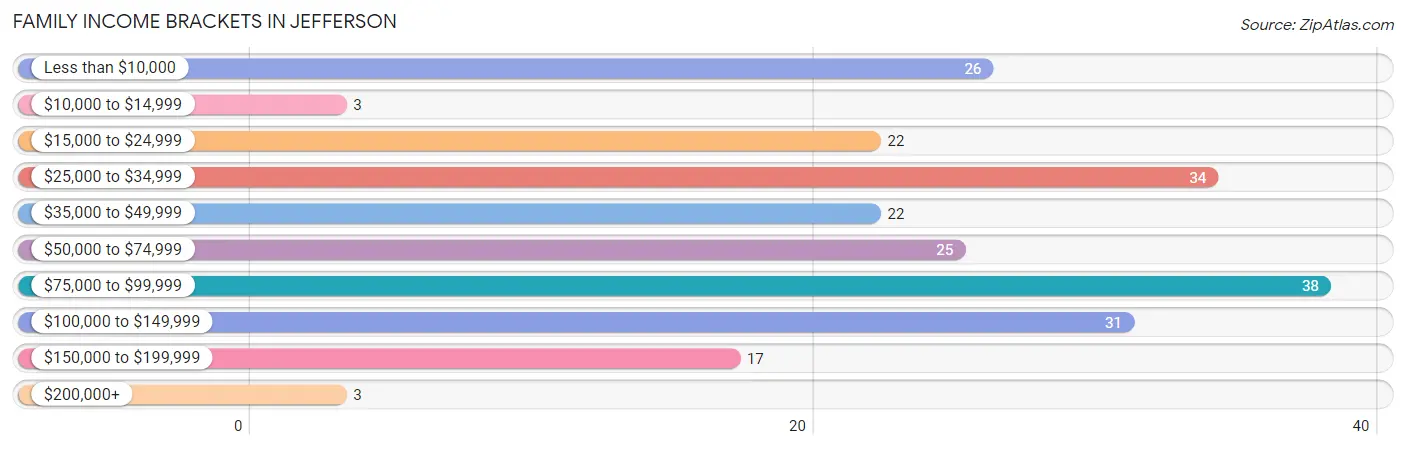
| Income Bracket | # Families | % Families |
| Less than $10,000 | 26 | 11.8% |
| $10,000 to $14,999 | 3 | 1.4% |
| $15,000 to $24,999 | 22 | 10.0% |
| $25,000 to $34,999 | 34 | 15.4% |
| $35,000 to $49,999 | 22 | 10.0% |
| $50,000 to $74,999 | 25 | 11.3% |
| $75,000 to $99,999 | 38 | 17.2% |
| $100,000 to $149,999 | 31 | 14.0% |
| $150,000 to $199,999 | 17 | 7.7% |
| $200,000+ | 3 | 1.4% |
Family Income by Famaliy Size in Jefferson
4-person families (48 | 21.7%) account for the highest median family income in Jefferson with $90,625 per family, while 2-person families (120 | 54.3%) have the highest median income of $33,125 per family member.
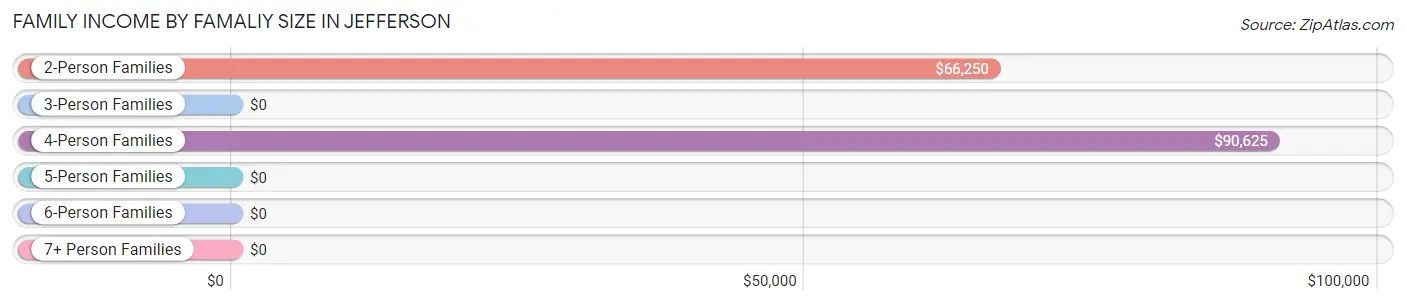
| Income Bracket | # Families | Median Income |
| 2-Person Families | 120 (54.3%) | $66,250 |
| 3-Person Families | 45 (20.4%) | $0 |
| 4-Person Families | 48 (21.7%) | $90,625 |
| 5-Person Families | 3 (1.4%) | $0 |
| 6-Person Families | 5 (2.3%) | $0 |
| 7+ Person Families | 0 (0.0%) | $0 |
| Total | 221 (100.0%) | $53,958 |
Family Income by Number of Earners in Jefferson
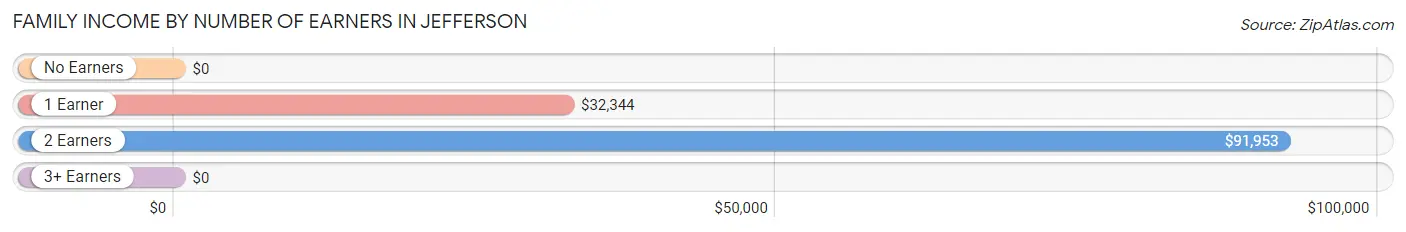
| Number of Earners | # Families | Median Income |
| No Earners | 36 (16.3%) | $0 |
| 1 Earner | 93 (42.1%) | $32,344 |
| 2 Earners | 89 (40.3%) | $91,953 |
| 3+ Earners | 3 (1.4%) | $0 |
| Total | 221 (100.0%) | $53,958 |
Household Income in Jefferson
Household Income Brackets in Jefferson
With 55 households falling in the category, the $10,000 to $14,999 income range is the most frequent in Jefferson, accounting for 16.8% of all households. In contrast, only 12 households (3.7%) fall into the $200,000+ income bracket, making it the least populous group.
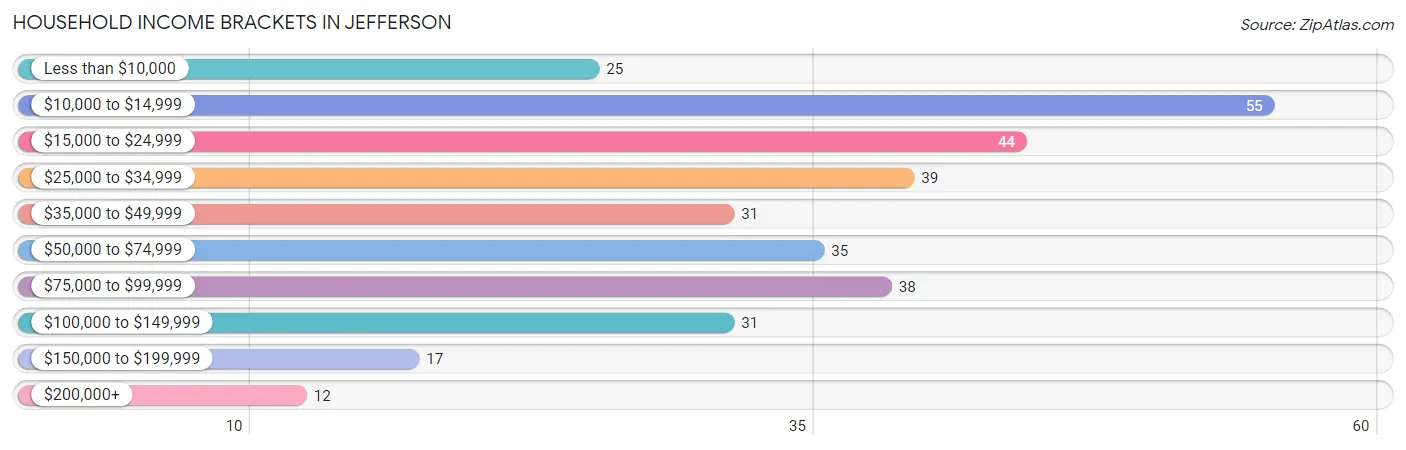
| Income Bracket | # Households | % Households |
| Less than $10,000 | 25 | 7.6% |
| $10,000 to $14,999 | 55 | 16.8% |
| $15,000 to $24,999 | 44 | 13.5% |
| $25,000 to $34,999 | 39 | 11.9% |
| $35,000 to $49,999 | 31 | 9.5% |
| $50,000 to $74,999 | 35 | 10.7% |
| $75,000 to $99,999 | 38 | 11.6% |
| $100,000 to $149,999 | 31 | 9.5% |
| $150,000 to $199,999 | 17 | 5.2% |
| $200,000+ | 12 | 3.7% |
Household Income by Householder Age in Jefferson
The median household income in Jefferson is $35,208, with the highest median household income of $60,833 found in the 25 to 44 years age bracket for the primary householder. A total of 88 households (26.9%) fall into this category. Meanwhile, the 15 to 24 years age bracket for the primary householder has the lowest median household income of $0, with 11 households (3.4%) in this group.
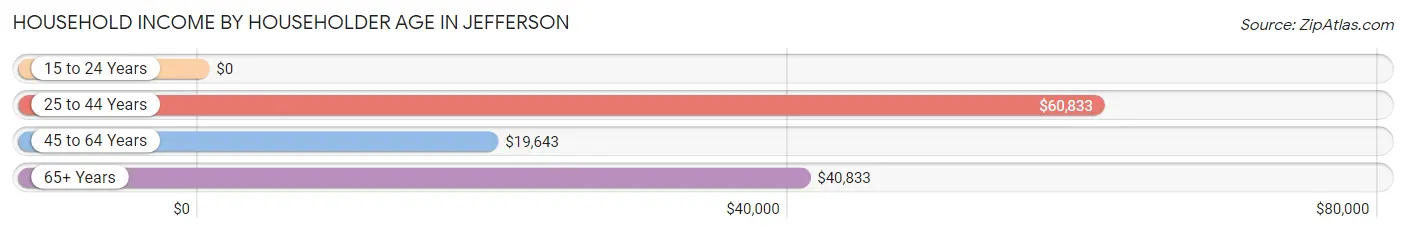
| Income Bracket | # Households | Median Income |
| 15 to 24 Years | 11 (3.4%) | $0 |
| 25 to 44 Years | 88 (26.9%) | $60,833 |
| 45 to 64 Years | 130 (39.8%) | $19,643 |
| 65+ Years | 98 (30.0%) | $40,833 |
| Total | 327 (100.0%) | $35,208 |
Poverty in Jefferson
Income Below Poverty by Sex and Age in Jefferson
With 21.7% poverty level for males and 27.4% for females among the residents of Jefferson, 12 to 14 year old males and 45 to 54 year old females are the most vulnerable to poverty, with 15 males (83.3%) and 41 females (69.5%) in their respective age groups living below the poverty level.
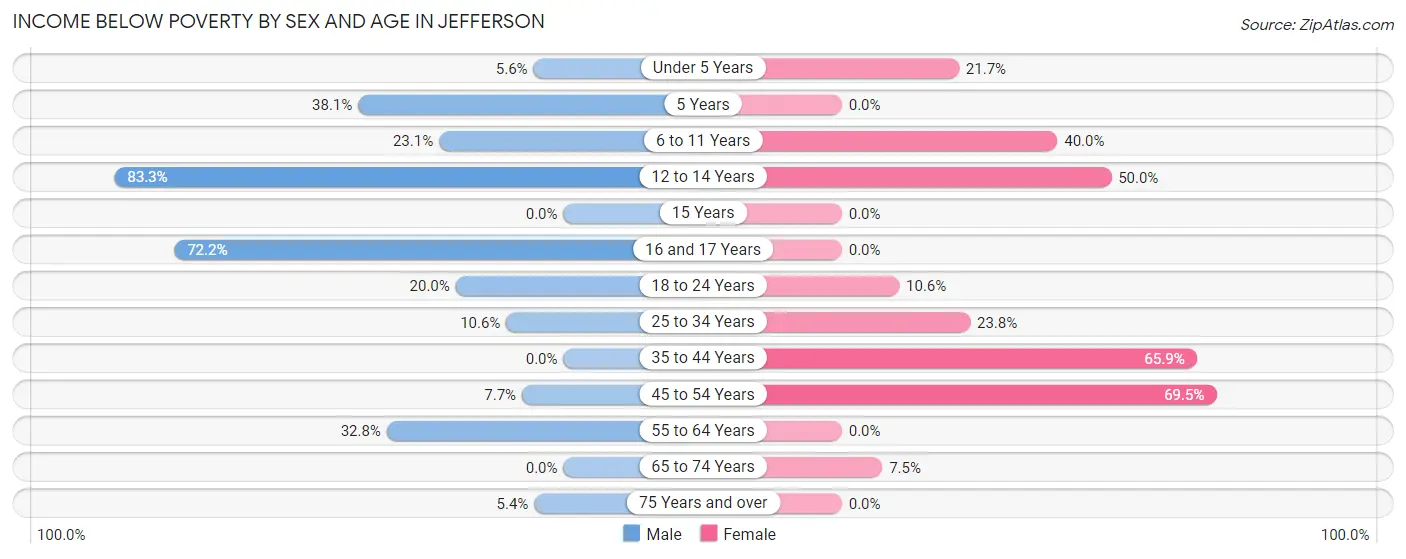
| Age Bracket | Male | Female |
| Under 5 Years | 2 (5.6%) | 5 (21.7%) |
| 5 Years | 8 (38.1%) | 0 (0.0%) |
| 6 to 11 Years | 12 (23.1%) | 8 (40.0%) |
| 12 to 14 Years | 15 (83.3%) | 11 (50.0%) |
| 15 Years | 0 (0.0%) | 0 (0.0%) |
| 16 and 17 Years | 13 (72.2%) | 0 (0.0%) |
| 18 to 24 Years | 4 (20.0%) | 5 (10.6%) |
| 25 to 34 Years | 7 (10.6%) | 20 (23.8%) |
| 35 to 44 Years | 0 (0.0%) | 27 (65.8%) |
| 45 to 54 Years | 2 (7.7%) | 41 (69.5%) |
| 55 to 64 Years | 20 (32.8%) | 0 (0.0%) |
| 65 to 74 Years | 0 (0.0%) | 3 (7.5%) |
| 75 Years and over | 2 (5.4%) | 0 (0.0%) |
| Total | 85 (21.7%) | 120 (27.4%) |
Income Above Poverty by Sex and Age in Jefferson
According to the poverty statistics in Jefferson, males aged 15 years and females aged 5 years are the age groups that are most secure financially, with 100.0% of males and 100.0% of females in these age groups living above the poverty line.
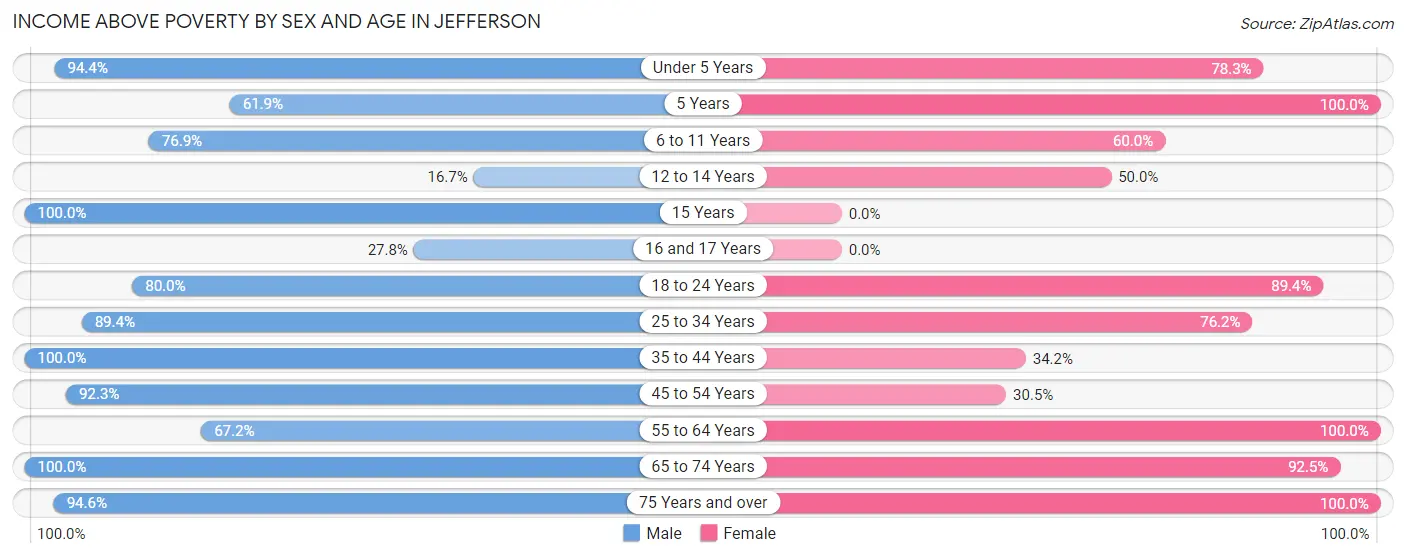
| Age Bracket | Male | Female |
| Under 5 Years | 34 (94.4%) | 18 (78.3%) |
| 5 Years | 13 (61.9%) | 2 (100.0%) |
| 6 to 11 Years | 40 (76.9%) | 12 (60.0%) |
| 12 to 14 Years | 3 (16.7%) | 11 (50.0%) |
| 15 Years | 2 (100.0%) | 0 (0.0%) |
| 16 and 17 Years | 5 (27.8%) | 0 (0.0%) |
| 18 to 24 Years | 16 (80.0%) | 42 (89.4%) |
| 25 to 34 Years | 59 (89.4%) | 64 (76.2%) |
| 35 to 44 Years | 2 (100.0%) | 14 (34.2%) |
| 45 to 54 Years | 24 (92.3%) | 18 (30.5%) |
| 55 to 64 Years | 41 (67.2%) | 60 (100.0%) |
| 65 to 74 Years | 33 (100.0%) | 37 (92.5%) |
| 75 Years and over | 35 (94.6%) | 40 (100.0%) |
| Total | 307 (78.3%) | 318 (72.6%) |
Income Below Poverty Among Married-Couple Families in Jefferson
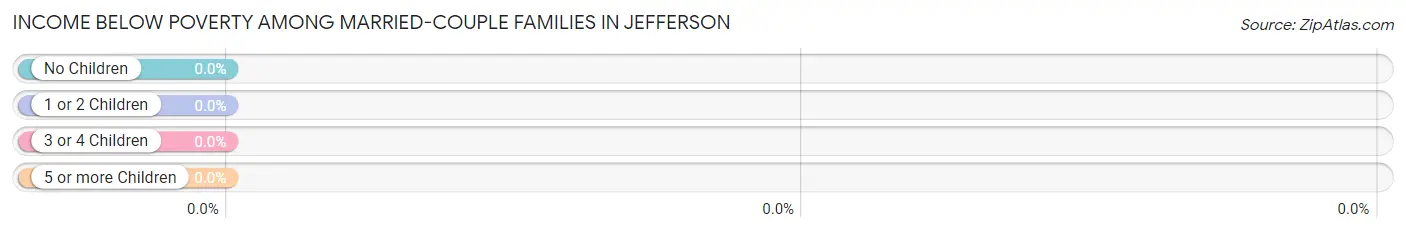
| Children | Above Poverty | Below Poverty |
| No Children | 86 (100.0%) | 0 (0.0%) |
| 1 or 2 Children | 43 (100.0%) | 0 (0.0%) |
| 3 or 4 Children | 2 (100.0%) | 0 (0.0%) |
| 5 or more Children | 0 (0.0%) | 0 (0.0%) |
| Total | 131 (100.0%) | 0 (0.0%) |
Income Below Poverty Among Single-Parent Households in Jefferson
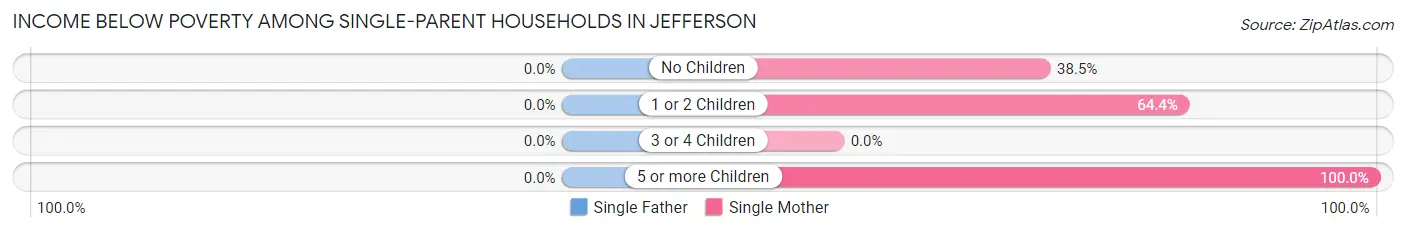
| Children | Single Father | Single Mother |
| No Children | 0 (0.0%) | 10 (38.5%) |
| 1 or 2 Children | 0 (0.0%) | 29 (64.4%) |
| 3 or 4 Children | 0 (0.0%) | 0 (0.0%) |
| 5 or more Children | 0 (0.0%) | 3 (100.0%) |
| Total | 0 (0.0%) | 42 (49.4%) |
Income Below Poverty Among Married-Couple vs Single-Parent Households in Jefferson
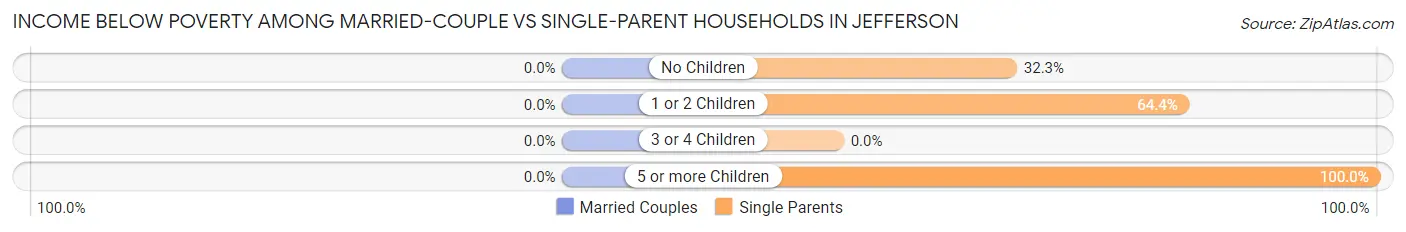
| Children | Married-Couple Families | Single-Parent Households |
| No Children | 0 (0.0%) | 10 (32.3%) |
| 1 or 2 Children | 0 (0.0%) | 29 (64.4%) |
| 3 or 4 Children | 0 (0.0%) | 0 (0.0%) |
| 5 or more Children | 0 (0.0%) | 3 (100.0%) |
| Total | 0 (0.0%) | 42 (46.7%) |
Race in Jefferson
The most populous races in Jefferson are White / Caucasian (527 | 63.5%), Black / African American (273 | 32.9%), and Two or more Races (26 | 3.1%).
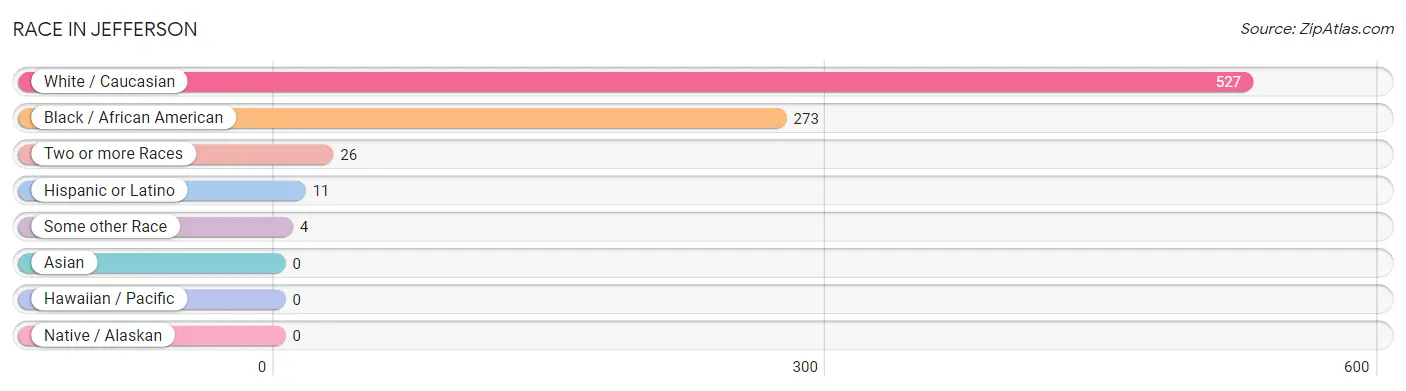
| Race | # Population | % Population |
| Asian | 0 | 0.0% |
| Black / African American | 273 | 32.9% |
| Hawaiian / Pacific | 0 | 0.0% |
| Hispanic or Latino | 11 | 1.3% |
| Native / Alaskan | 0 | 0.0% |
| White / Caucasian | 527 | 63.5% |
| Two or more Races | 26 | 3.1% |
| Some other Race | 4 | 0.5% |
| Total | 830 | 100.0% |
Ancestry in Jefferson
The most populous ancestries reported in Jefferson are English (80 | 9.6%), American (61 | 7.3%), Irish (39 | 4.7%), German (38 | 4.6%), and Scotch-Irish (38 | 4.6%), together accounting for 30.8% of all Jefferson residents.
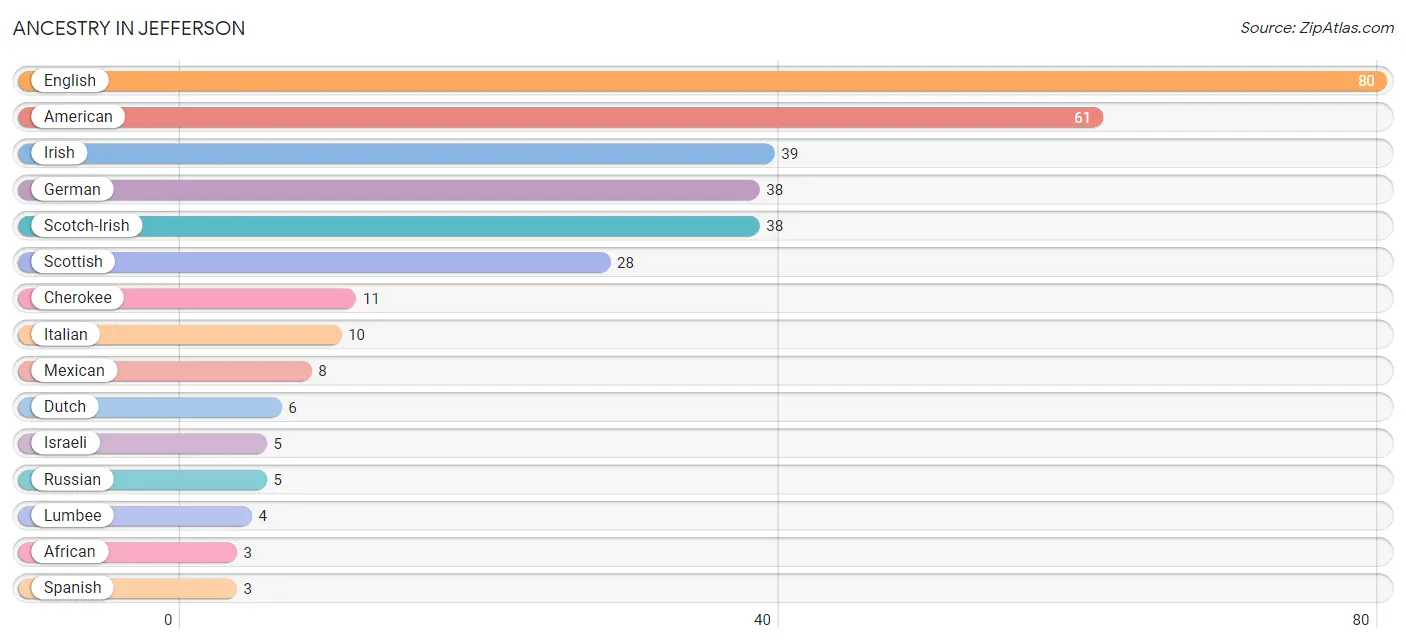
| Ancestry | # Population | % Population |
| African | 3 | 0.4% |
| American | 61 | 7.3% |
| Cherokee | 11 | 1.3% |
| Dutch | 6 | 0.7% |
| English | 80 | 9.6% |
| European | 1 | 0.1% |
| German | 38 | 4.6% |
| Irish | 39 | 4.7% |
| Israeli | 5 | 0.6% |
| Italian | 10 | 1.2% |
| Lumbee | 4 | 0.5% |
| Mexican | 8 | 1.0% |
| Russian | 5 | 0.6% |
| Scotch-Irish | 38 | 4.6% |
| Scottish | 28 | 3.4% |
| Spanish | 3 | 0.4% |
| Subsaharan African | 3 | 0.4% |
| Welsh | 3 | 0.4% | View All 18 Rows |
Immigrants in Jefferson

| Immigration Origin | # Population | % Population | View All 0 Rows |
Sex and Age in Jefferson
Sex and Age in Jefferson
The most populous age groups in Jefferson are 5 to 9 Years (56 | 14.3%) for men and 25 to 29 Years (51 | 11.6%) for women.
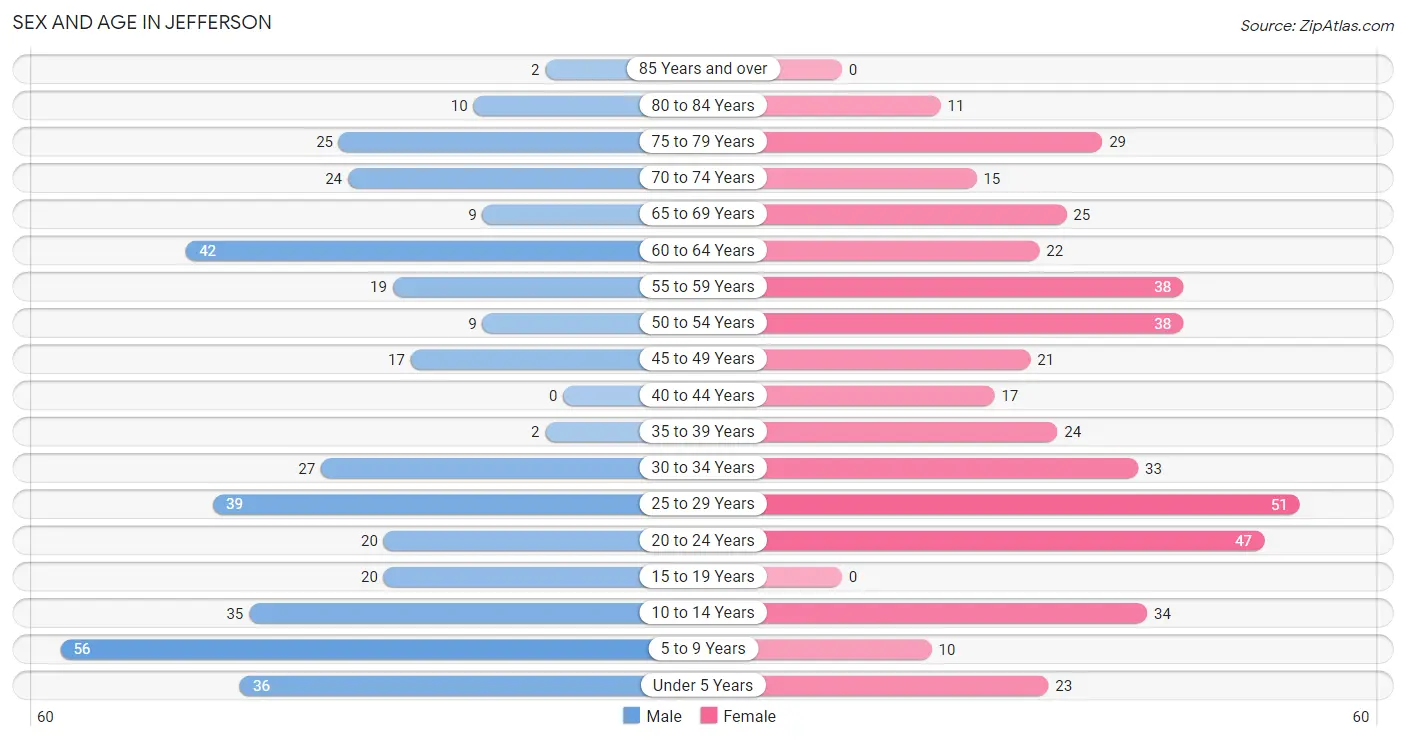
| Age Bracket | Male | Female |
| Under 5 Years | 36 (9.2%) | 23 (5.2%) |
| 5 to 9 Years | 56 (14.3%) | 10 (2.3%) |
| 10 to 14 Years | 35 (8.9%) | 34 (7.8%) |
| 15 to 19 Years | 20 (5.1%) | 0 (0.0%) |
| 20 to 24 Years | 20 (5.1%) | 47 (10.7%) |
| 25 to 29 Years | 39 (10.0%) | 51 (11.6%) |
| 30 to 34 Years | 27 (6.9%) | 33 (7.5%) |
| 35 to 39 Years | 2 (0.5%) | 24 (5.5%) |
| 40 to 44 Years | 0 (0.0%) | 17 (3.9%) |
| 45 to 49 Years | 17 (4.3%) | 21 (4.8%) |
| 50 to 54 Years | 9 (2.3%) | 38 (8.7%) |
| 55 to 59 Years | 19 (4.9%) | 38 (8.7%) |
| 60 to 64 Years | 42 (10.7%) | 22 (5.0%) |
| 65 to 69 Years | 9 (2.3%) | 25 (5.7%) |
| 70 to 74 Years | 24 (6.1%) | 15 (3.4%) |
| 75 to 79 Years | 25 (6.4%) | 29 (6.6%) |
| 80 to 84 Years | 10 (2.5%) | 11 (2.5%) |
| 85 Years and over | 2 (0.5%) | 0 (0.0%) |
| Total | 392 (100.0%) | 438 (100.0%) |
Families and Households in Jefferson
Median Family Size in Jefferson
The median family size in Jefferson is 3.07 persons per family, with single female/mother families (85 | 38.5%) accounting for the largest median family size of 3.56 persons per family. On the other hand, single male/father families (5 | 2.3%) represent the smallest median family size with 2.40 persons per family.
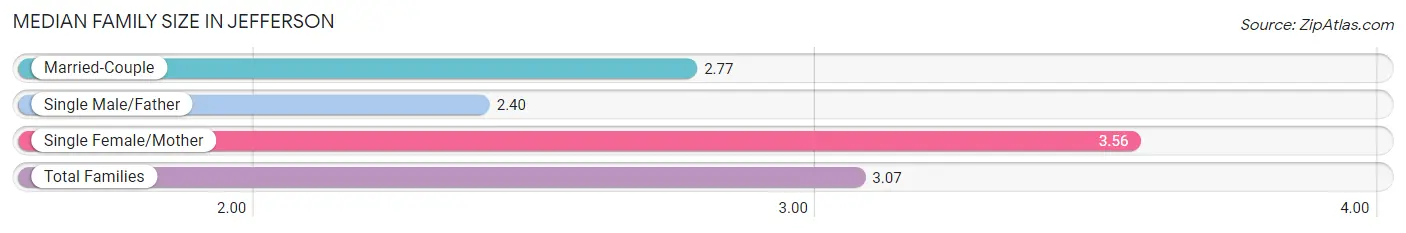
| Family Type | # Families | Family Size |
| Married-Couple | 131 (59.3%) | 2.77 |
| Single Male/Father | 5 (2.3%) | 2.40 |
| Single Female/Mother | 85 (38.5%) | 3.56 |
| Total Families | 221 (100.0%) | 3.07 |
Median Household Size in Jefferson
The median household size in Jefferson is 2.46 persons per household, with single female/mother households (85 | 26.0%) accounting for the largest median household size of 3.71 persons per household. non-family households (106 | 32.4%) represent the smallest median household size with 1.08 persons per household.
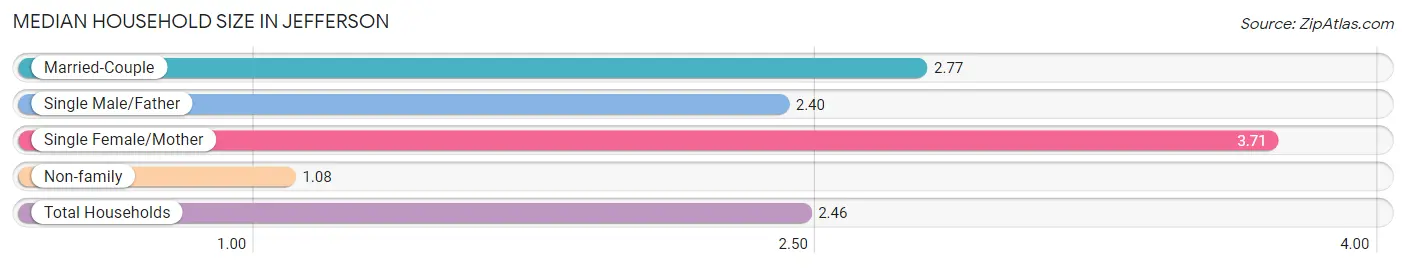
| Household Type | # Households | Household Size |
| Married-Couple | 131 (40.1%) | 2.77 |
| Single Male/Father | 5 (1.5%) | 2.40 |
| Single Female/Mother | 85 (26.0%) | 3.71 |
| Non-family | 106 (32.4%) | 1.08 |
| Total Households | 327 (100.0%) | 2.46 |
Household Size by Marriage Status in Jefferson
Out of a total of 327 households in Jefferson, 221 (67.6%) are family households, while 106 (32.4%) are nonfamily households. The most numerous type of family households are 2-person households, comprising 120, and the most common type of nonfamily households are 1-person households, comprising 97.
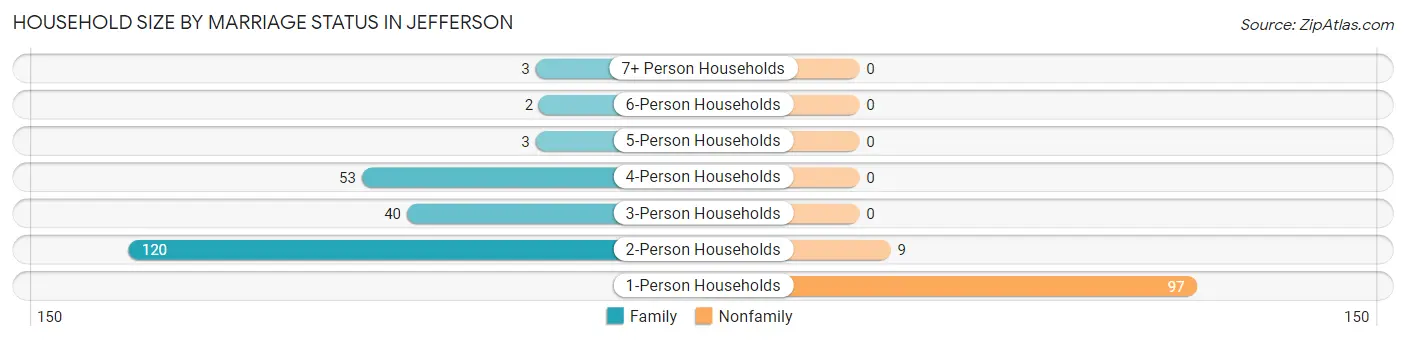
| Household Size | Family Households | Nonfamily Households |
| 1-Person Households | - | 97 (29.7%) |
| 2-Person Households | 120 (36.7%) | 9 (2.8%) |
| 3-Person Households | 40 (12.2%) | 0 (0.0%) |
| 4-Person Households | 53 (16.2%) | 0 (0.0%) |
| 5-Person Households | 3 (0.9%) | 0 (0.0%) |
| 6-Person Households | 2 (0.6%) | 0 (0.0%) |
| 7+ Person Households | 3 (0.9%) | 0 (0.0%) |
| Total | 221 (67.6%) | 106 (32.4%) |
Female Fertility in Jefferson
Fertility by Age in Jefferson
Average fertility rate in Jefferson is 20.0 births per 1,000 women. Women in the age bracket of 20 to 34 years have the highest fertility rate with 31.0 births per 1,000 women. Women in the age bracket of 20 to 34 years acount for 100.0% of all women with births.
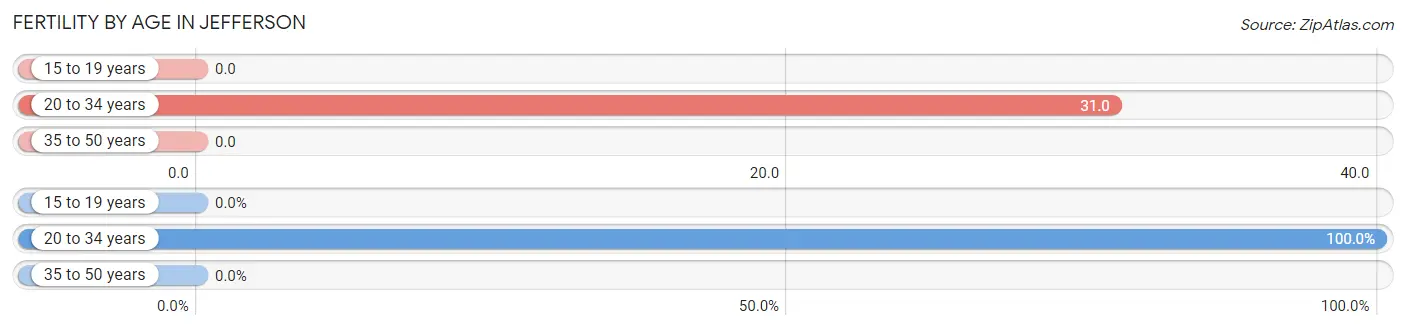
| Age Bracket | Women with Births | Births / 1,000 Women |
| 15 to 19 years | 0 (0.0%) | 0.0 |
| 20 to 34 years | 4 (100.0%) | 31.0 |
| 35 to 50 years | 0 (0.0%) | 0.0 |
| Total | 4 (100.0%) | 20.0 |
Fertility by Age by Marriage Status in Jefferson
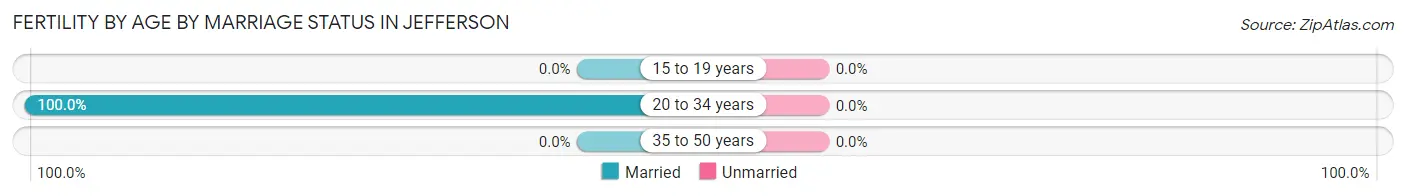
| Age Bracket | Married | Unmarried |
| 15 to 19 years | 0 (0.0%) | 0 (0.0%) |
| 20 to 34 years | 4 (100.0%) | 0 (0.0%) |
| 35 to 50 years | 0 (0.0%) | 0 (0.0%) |
| Total | 4 (100.0%) | 0 (0.0%) |
Fertility by Education in Jefferson
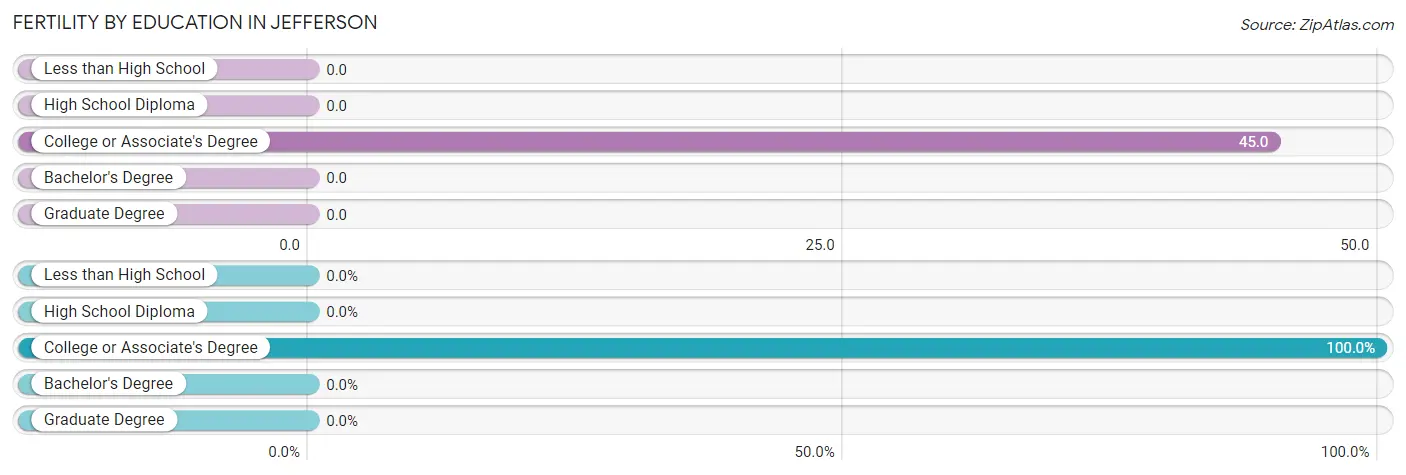
| Educational Attainment | Women with Births | Births / 1,000 Women |
| Less than High School | 0 (0.0%) | 0.0 |
| High School Diploma | 0 (0.0%) | 0.0 |
| College or Associate's Degree | 4 (100.0%) | 45.0 |
| Bachelor's Degree | 0 (0.0%) | 0.0 |
| Graduate Degree | 0 (0.0%) | 0.0 |
| Total | 4 (100.0%) | 20.0 |
Fertility by Education by Marriage Status in Jefferson
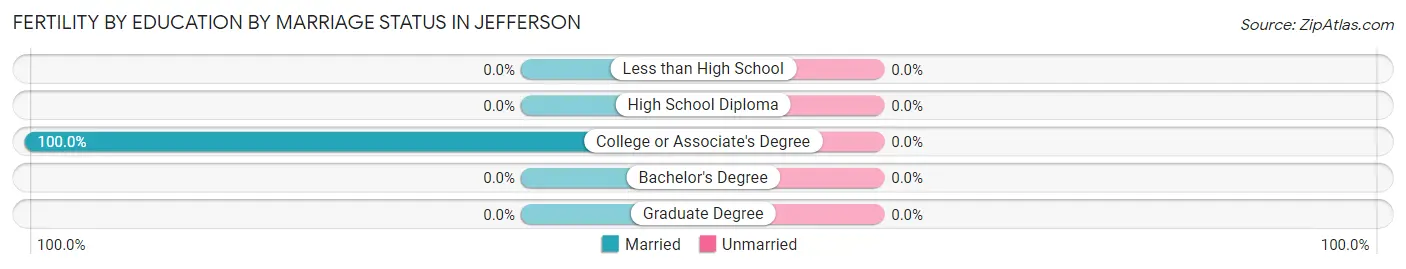
| Educational Attainment | Married | Unmarried |
| Less than High School | 0 (0.0%) | 0 (0.0%) |
| High School Diploma | 0 (0.0%) | 0 (0.0%) |
| College or Associate's Degree | 4 (100.0%) | 0 (0.0%) |
| Bachelor's Degree | 0 (0.0%) | 0 (0.0%) |
| Graduate Degree | 0 (0.0%) | 0 (0.0%) |
| Total | 4 (100.0%) | 0 (0.0%) |
Employment Characteristics in Jefferson
Employment by Class of Employer in Jefferson
Among the 362 employed individuals in Jefferson, private company employees (170 | 47.0%), self-employed (not incorporated) (54 | 14.9%), and state government employees (44 | 12.1%) make up the most common classes of employment.
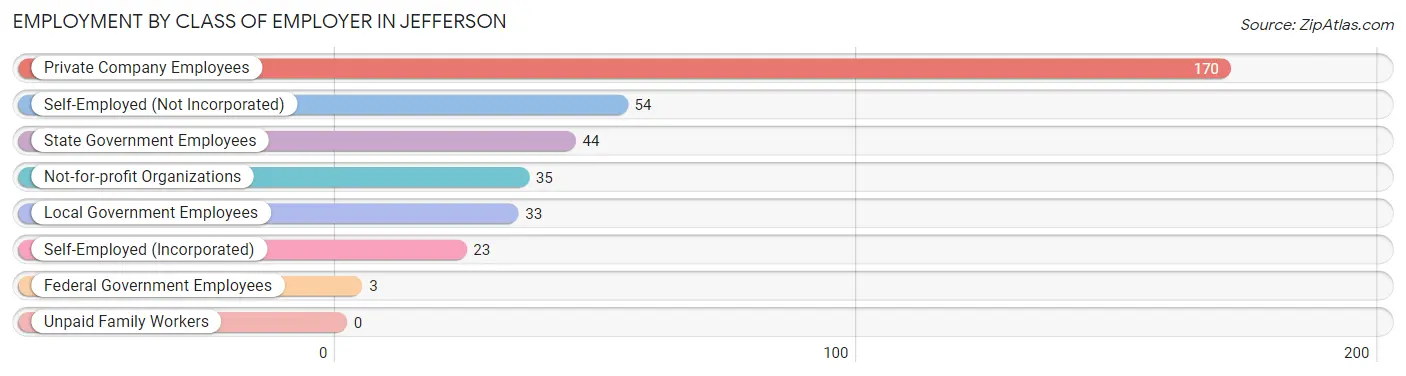
| Employer Class | # Employees | % Employees |
| Private Company Employees | 170 | 47.0% |
| Self-Employed (Incorporated) | 23 | 6.4% |
| Self-Employed (Not Incorporated) | 54 | 14.9% |
| Not-for-profit Organizations | 35 | 9.7% |
| Local Government Employees | 33 | 9.1% |
| State Government Employees | 44 | 12.1% |
| Federal Government Employees | 3 | 0.8% |
| Unpaid Family Workers | 0 | 0.0% |
| Total | 362 | 100.0% |
Employment Status by Age in Jefferson
According to the labor force statistics for Jefferson, out of the total population over 16 years of age (634), 63.2% or 401 individuals are in the labor force, with 9.7% or 39 of them unemployed. The age group with the highest labor force participation rate is 30 to 34 years, with 93.3% or 56 individuals in the labor force. Within the labor force, the 30 to 34 years age range has the highest percentage of unemployed individuals, with 28.6% or 16 of them being unemployed.
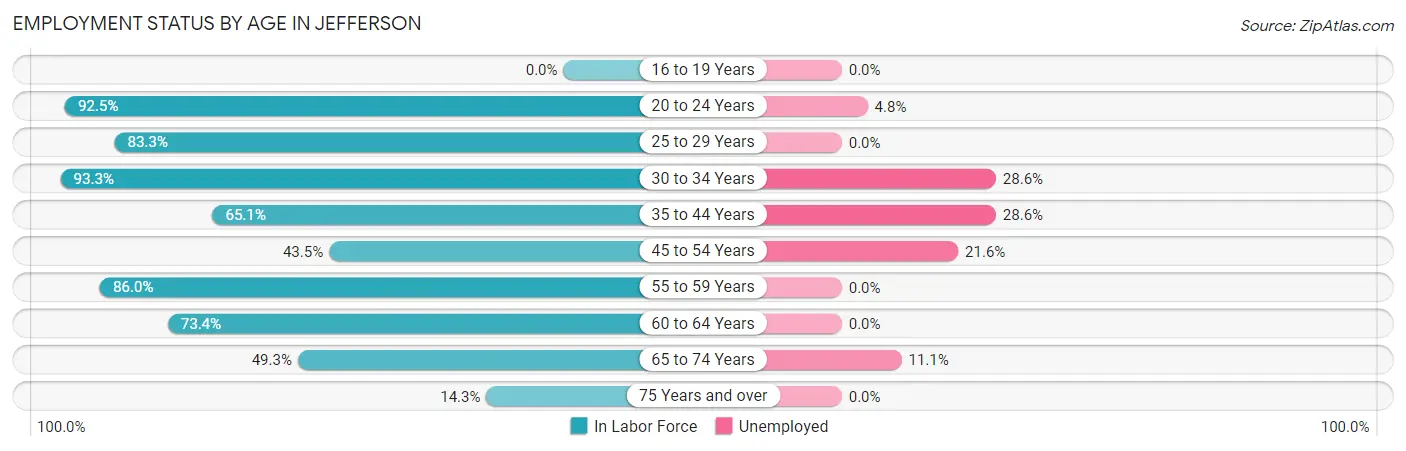
| Age Bracket | In Labor Force | Unemployed |
| 16 to 19 Years | 0 (0.0%) | 0 (0.0%) |
| 20 to 24 Years | 62 (92.5%) | 3 (4.8%) |
| 25 to 29 Years | 75 (83.3%) | 0 (0.0%) |
| 30 to 34 Years | 56 (93.3%) | 16 (28.6%) |
| 35 to 44 Years | 28 (65.1%) | 8 (28.6%) |
| 45 to 54 Years | 37 (43.5%) | 8 (21.6%) |
| 55 to 59 Years | 49 (86.0%) | 0 (0.0%) |
| 60 to 64 Years | 47 (73.4%) | 0 (0.0%) |
| 65 to 74 Years | 36 (49.3%) | 4 (11.1%) |
| 75 Years and over | 11 (14.3%) | 0 (0.0%) |
| Total | 401 (63.2%) | 39 (9.7%) |
Employment Status by Educational Attainment in Jefferson
According to labor force statistics for Jefferson, 73.2% of individuals (292) out of the total population between 25 and 64 years of age (399) are in the labor force, with 11.0% or 32 of them being unemployed. The group with the highest labor force participation rate are those with the educational attainment of bachelor's degree or higher, with 81.3% or 26 individuals in the labor force. Within the labor force, individuals with less than high school education have the highest percentage of unemployment, with 41.2% or 21 of them being unemployed.
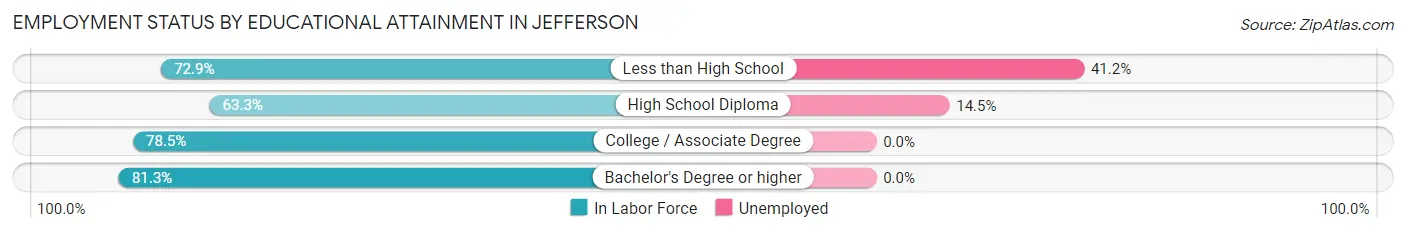
| Educational Attainment | In Labor Force | Unemployed |
| Less than High School | 51 (72.9%) | 29 (41.2%) |
| High School Diploma | 76 (63.3%) | 17 (14.5%) |
| College / Associate Degree | 139 (78.5%) | 0 (0.0%) |
| Bachelor's Degree or higher | 26 (81.3%) | 0 (0.0%) |
| Total | 292 (73.2%) | 44 (11.0%) |
Employment Occupations by Sex in Jefferson
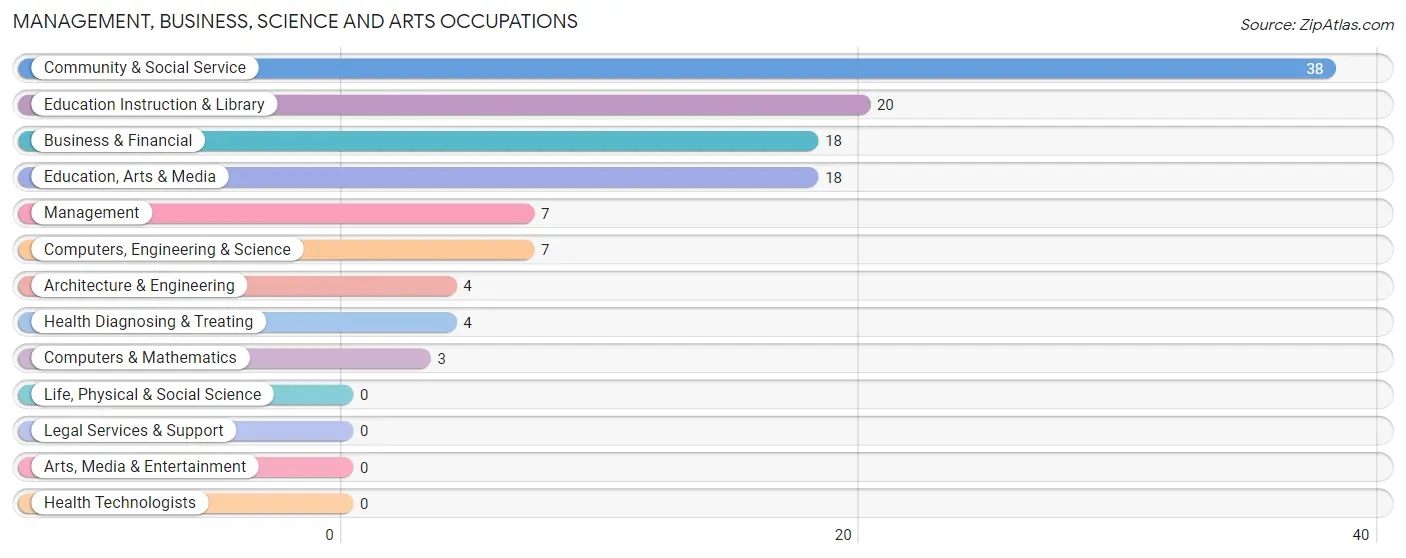
Management, Business, Science and Arts Occupations
The most common Management, Business, Science and Arts occupations in Jefferson are Community & Social Service (38 | 10.5%), Education Instruction & Library (20 | 5.5%), Business & Financial (18 | 5.0%), Education, Arts & Media (18 | 5.0%), and Management (7 | 1.9%).
Management, Business, Science and Arts Occupations by Sex
Within the Management, Business, Science and Arts occupations in Jefferson, the most male-oriented occupations are Computers, Engineering & Science (100.0%), Computers & Mathematics (100.0%), and Architecture & Engineering (100.0%), while the most female-oriented occupations are Management (100.0%), Education Instruction & Library (100.0%), and Health Diagnosing & Treating (100.0%).
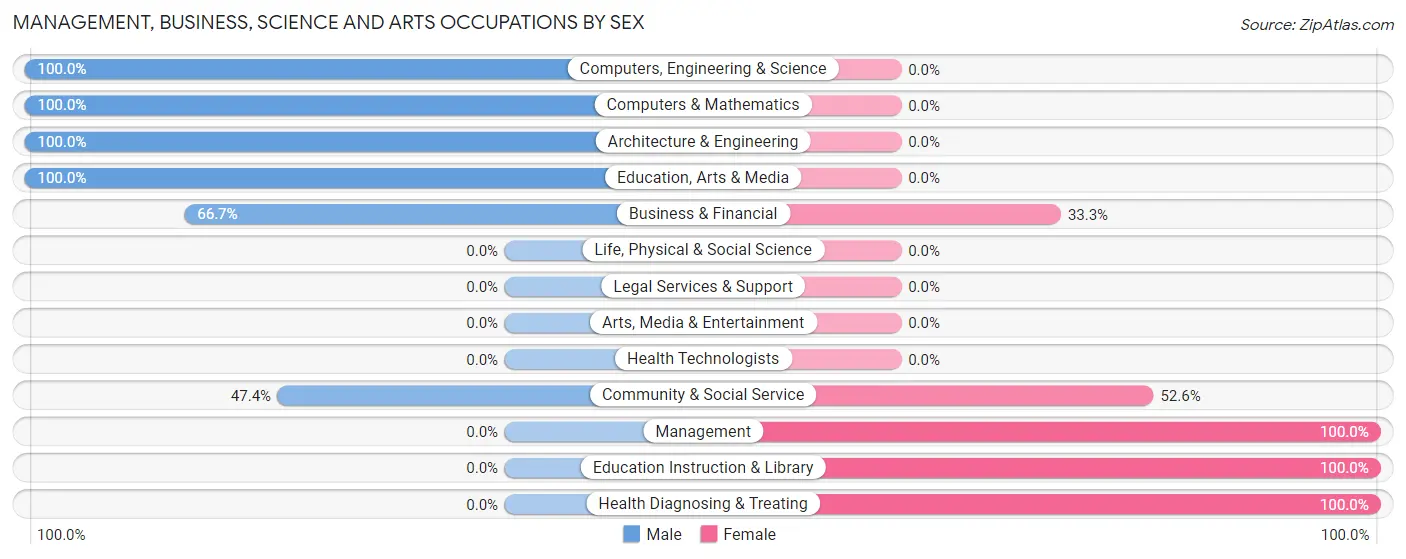
| Occupation | Male | Female |
| Management | 0 (0.0%) | 7 (100.0%) |
| Business & Financial | 12 (66.7%) | 6 (33.3%) |
| Computers, Engineering & Science | 7 (100.0%) | 0 (0.0%) |
| Computers & Mathematics | 3 (100.0%) | 0 (0.0%) |
| Architecture & Engineering | 4 (100.0%) | 0 (0.0%) |
| Life, Physical & Social Science | 0 (0.0%) | 0 (0.0%) |
| Community & Social Service | 18 (47.4%) | 20 (52.6%) |
| Education, Arts & Media | 18 (100.0%) | 0 (0.0%) |
| Legal Services & Support | 0 (0.0%) | 0 (0.0%) |
| Education Instruction & Library | 0 (0.0%) | 20 (100.0%) |
| Arts, Media & Entertainment | 0 (0.0%) | 0 (0.0%) |
| Health Diagnosing & Treating | 0 (0.0%) | 4 (100.0%) |
| Health Technologists | 0 (0.0%) | 0 (0.0%) |
| Total (Category) | 37 (50.0%) | 37 (50.0%) |
| Total (Overall) | 184 (50.8%) | 178 (49.2%) |
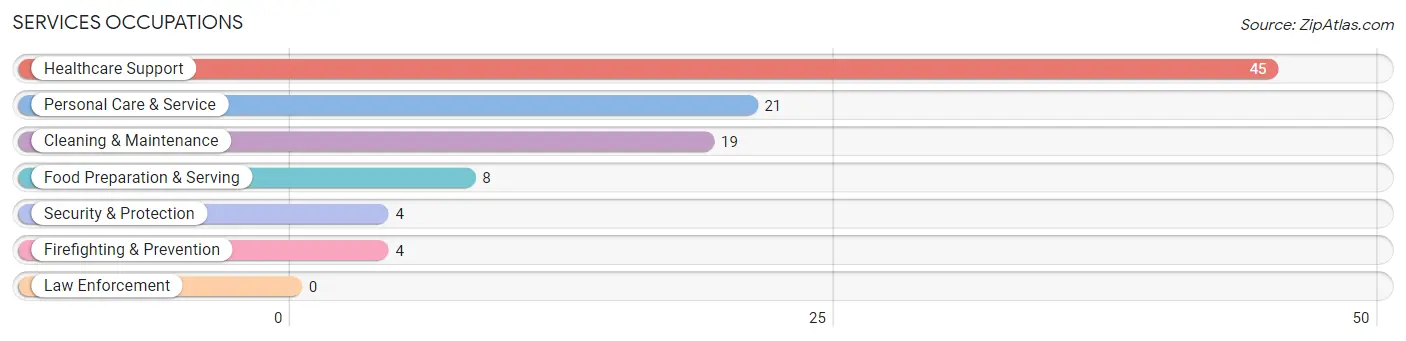
Services Occupations
The most common Services occupations in Jefferson are Healthcare Support (45 | 12.4%), Personal Care & Service (21 | 5.8%), Cleaning & Maintenance (19 | 5.2%), Food Preparation & Serving (8 | 2.2%), and Security & Protection (4 | 1.1%).
Services Occupations by Sex
Within the Services occupations in Jefferson, the most male-oriented occupations are Security & Protection (100.0%), Firefighting & Prevention (100.0%), and Cleaning & Maintenance (84.2%), while the most female-oriented occupations are Healthcare Support (100.0%), Personal Care & Service (85.7%), and Food Preparation & Serving (50.0%).
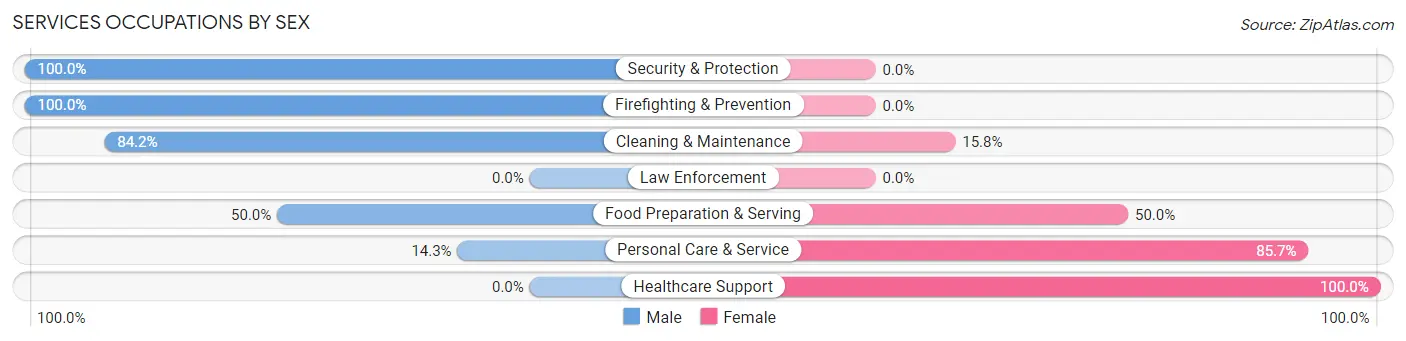
| Occupation | Male | Female |
| Healthcare Support | 0 (0.0%) | 45 (100.0%) |
| Security & Protection | 4 (100.0%) | 0 (0.0%) |
| Firefighting & Prevention | 4 (100.0%) | 0 (0.0%) |
| Law Enforcement | 0 (0.0%) | 0 (0.0%) |
| Food Preparation & Serving | 4 (50.0%) | 4 (50.0%) |
| Cleaning & Maintenance | 16 (84.2%) | 3 (15.8%) |
| Personal Care & Service | 3 (14.3%) | 18 (85.7%) |
| Total (Category) | 27 (27.8%) | 70 (72.2%) |
| Total (Overall) | 184 (50.8%) | 178 (49.2%) |
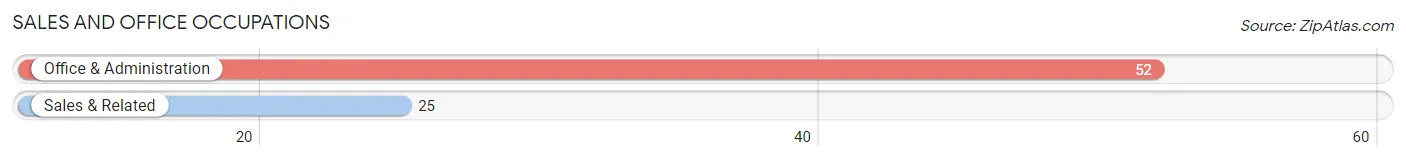
Sales and Office Occupations
The most common Sales and Office occupations in Jefferson are Office & Administration (52 | 14.4%), and Sales & Related (25 | 6.9%).
Sales and Office Occupations by Sex
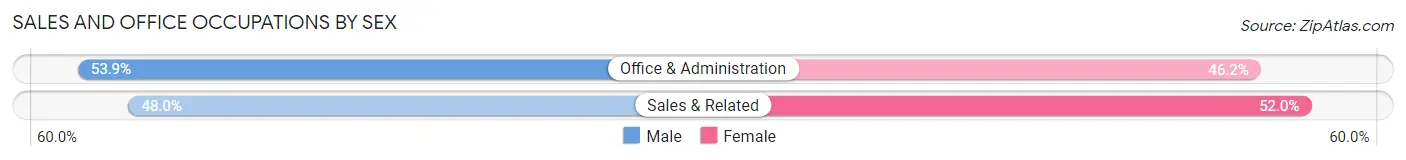
| Occupation | Male | Female |
| Sales & Related | 12 (48.0%) | 13 (52.0%) |
| Office & Administration | 28 (53.8%) | 24 (46.2%) |
| Total (Category) | 40 (51.9%) | 37 (48.0%) |
| Total (Overall) | 184 (50.8%) | 178 (49.2%) |
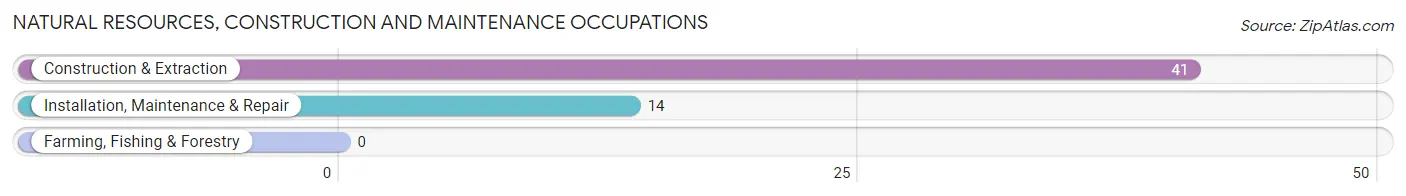
Natural Resources, Construction and Maintenance Occupations
The most common Natural Resources, Construction and Maintenance occupations in Jefferson are Construction & Extraction (41 | 11.3%), and Installation, Maintenance & Repair (14 | 3.9%).
Natural Resources, Construction and Maintenance Occupations by Sex
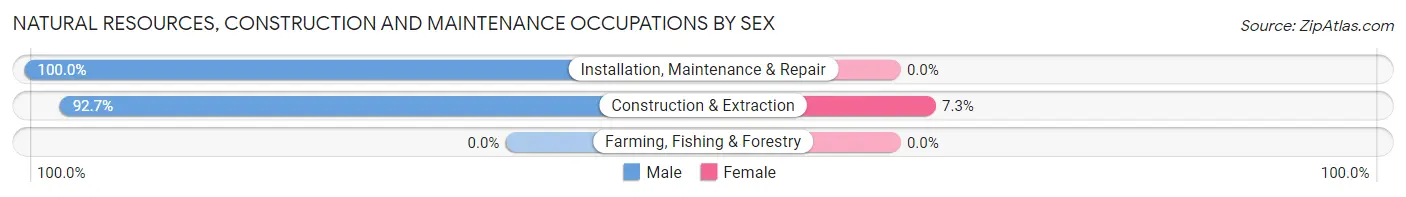
| Occupation | Male | Female |
| Farming, Fishing & Forestry | 0 (0.0%) | 0 (0.0%) |
| Construction & Extraction | 38 (92.7%) | 3 (7.3%) |
| Installation, Maintenance & Repair | 14 (100.0%) | 0 (0.0%) |
| Total (Category) | 52 (94.6%) | 3 (5.4%) |
| Total (Overall) | 184 (50.8%) | 178 (49.2%) |
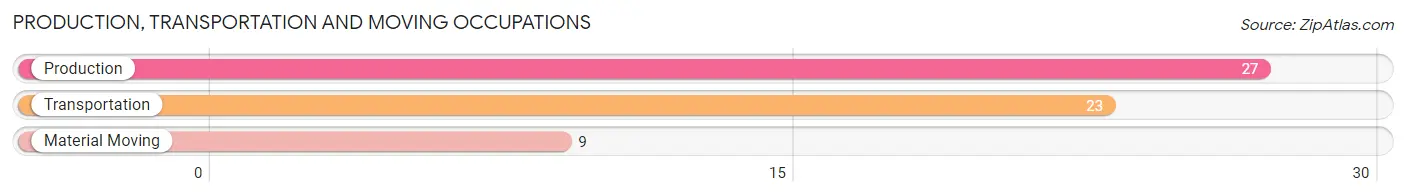
Production, Transportation and Moving Occupations
The most common Production, Transportation and Moving occupations in Jefferson are Production (27 | 7.5%), Transportation (23 | 6.4%), and Material Moving (9 | 2.5%).
Production, Transportation and Moving Occupations by Sex
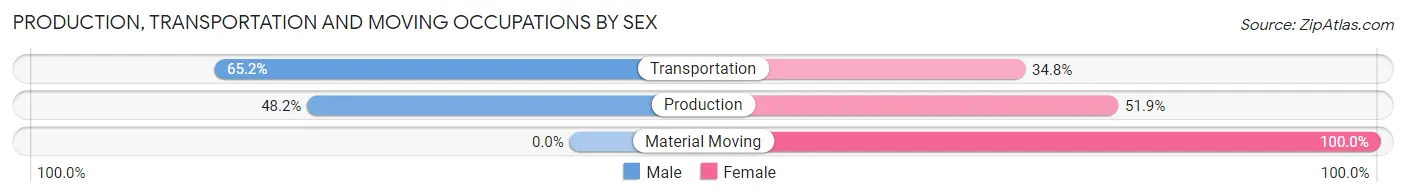
| Occupation | Male | Female |
| Production | 13 (48.1%) | 14 (51.8%) |
| Transportation | 15 (65.2%) | 8 (34.8%) |
| Material Moving | 0 (0.0%) | 9 (100.0%) |
| Total (Category) | 28 (47.5%) | 31 (52.5%) |
| Total (Overall) | 184 (50.8%) | 178 (49.2%) |
Employment Industries by Sex in Jefferson
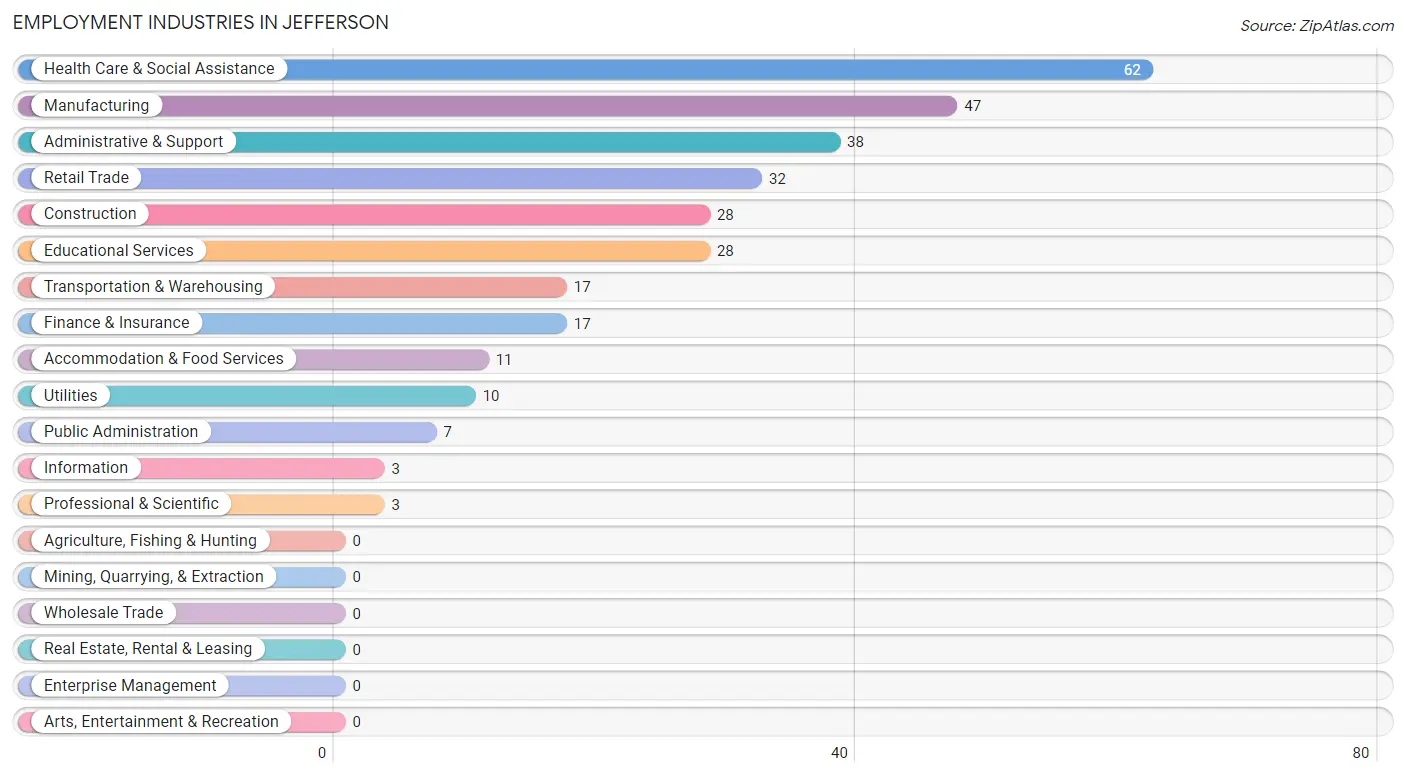
Employment Industries in Jefferson
The major employment industries in Jefferson include Health Care & Social Assistance (62 | 17.1%), Manufacturing (47 | 13.0%), Administrative & Support (38 | 10.5%), Retail Trade (32 | 8.8%), and Construction (28 | 7.7%).
Employment Industries by Sex in Jefferson
The Jefferson industries that see more men than women are Utilities (100.0%), Information (100.0%), and Construction (89.3%), whereas the industries that tend to have a higher number of women are Professional & Scientific (100.0%), Educational Services (89.3%), and Health Care & Social Assistance (79.0%).
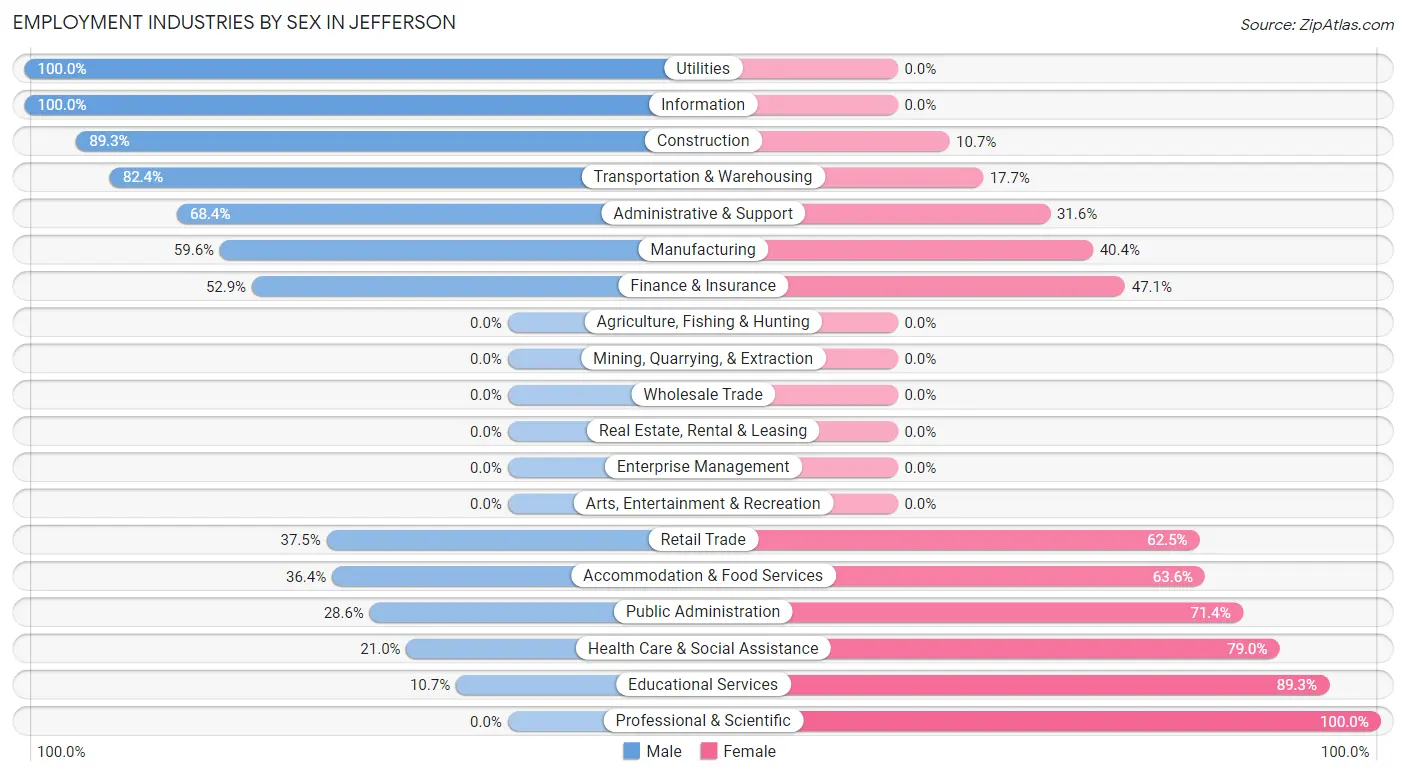
| Industry | Male | Female |
| Agriculture, Fishing & Hunting | 0 (0.0%) | 0 (0.0%) |
| Mining, Quarrying, & Extraction | 0 (0.0%) | 0 (0.0%) |
| Construction | 25 (89.3%) | 3 (10.7%) |
| Manufacturing | 28 (59.6%) | 19 (40.4%) |
| Wholesale Trade | 0 (0.0%) | 0 (0.0%) |
| Retail Trade | 12 (37.5%) | 20 (62.5%) |
| Transportation & Warehousing | 14 (82.4%) | 3 (17.6%) |
| Utilities | 10 (100.0%) | 0 (0.0%) |
| Information | 3 (100.0%) | 0 (0.0%) |
| Finance & Insurance | 9 (52.9%) | 8 (47.1%) |
| Real Estate, Rental & Leasing | 0 (0.0%) | 0 (0.0%) |
| Professional & Scientific | 0 (0.0%) | 3 (100.0%) |
| Enterprise Management | 0 (0.0%) | 0 (0.0%) |
| Administrative & Support | 26 (68.4%) | 12 (31.6%) |
| Educational Services | 3 (10.7%) | 25 (89.3%) |
| Health Care & Social Assistance | 13 (21.0%) | 49 (79.0%) |
| Arts, Entertainment & Recreation | 0 (0.0%) | 0 (0.0%) |
| Accommodation & Food Services | 4 (36.4%) | 7 (63.6%) |
| Public Administration | 2 (28.6%) | 5 (71.4%) |
| Total | 184 (50.8%) | 178 (49.2%) |
Education in Jefferson
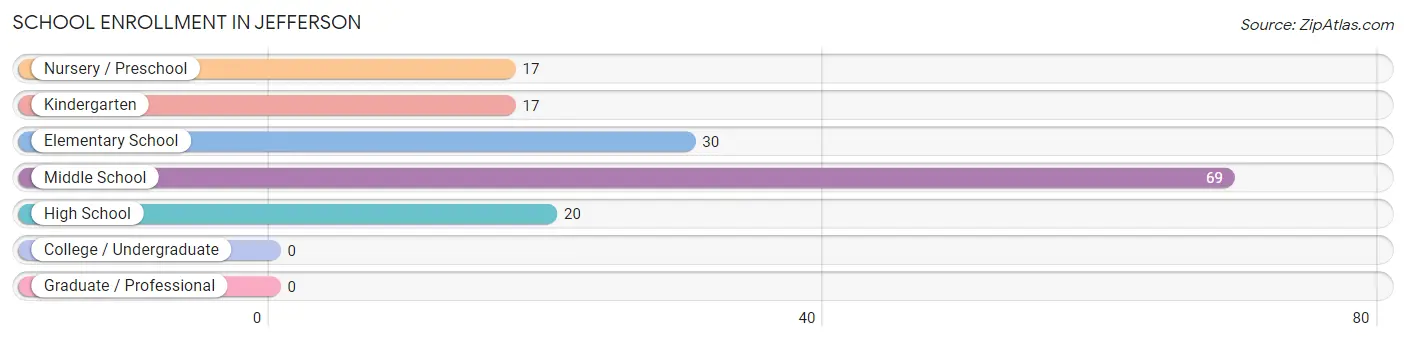
School Enrollment in Jefferson
The most common levels of schooling among the 153 students in Jefferson are middle school (69 | 45.1%), elementary school (30 | 19.6%), and high school (20 | 13.1%).
| School Level | # Students | % Students |
| Nursery / Preschool | 17 | 11.1% |
| Kindergarten | 17 | 11.1% |
| Elementary School | 30 | 19.6% |
| Middle School | 69 | 45.1% |
| High School | 20 | 13.1% |
| College / Undergraduate | 0 | 0.0% |
| Graduate / Professional | 0 | 0.0% |
| Total | 153 | 100.0% |
School Enrollment by Age by Funding Source in Jefferson
Out of a total of 153 students who are enrolled in schools in Jefferson, 11 (7.2%) attend a private institution, while the remaining 142 (92.8%) are enrolled in public schools. The age group of 15 to 17 year olds has the highest likelihood of being enrolled in private schools, with 5 (25.0% in the age bracket) enrolled. Conversely, the age group of 3 to 4 year olds has the lowest likelihood of being enrolled in a private school, with 2 (100.0% in the age bracket) attending a public institution.
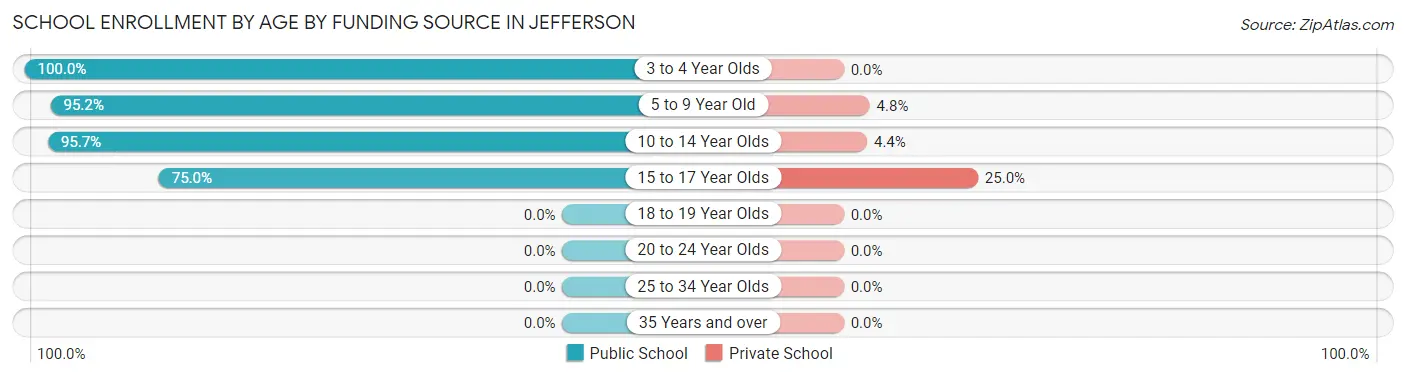
| Age Bracket | Public School | Private School |
| 3 to 4 Year Olds | 2 (100.0%) | 0 (0.0%) |
| 5 to 9 Year Old | 59 (95.2%) | 3 (4.8%) |
| 10 to 14 Year Olds | 66 (95.7%) | 3 (4.3%) |
| 15 to 17 Year Olds | 15 (75.0%) | 5 (25.0%) |
| 18 to 19 Year Olds | 0 (0.0%) | 0 (0.0%) |
| 20 to 24 Year Olds | 0 (0.0%) | 0 (0.0%) |
| 25 to 34 Year Olds | 0 (0.0%) | 0 (0.0%) |
| 35 Years and over | 0 (0.0%) | 0 (0.0%) |
| Total | 142 (92.8%) | 11 (7.2%) |
Educational Attainment by Field of Study in Jefferson
Education (23 | 51.1%), liberal arts & history (12 | 26.7%), business (8 | 17.8%), psychology (1 | 2.2%), and science & technology (1 | 2.2%) are the most common fields of study among 45 individuals in Jefferson who have obtained a bachelor's degree or higher.
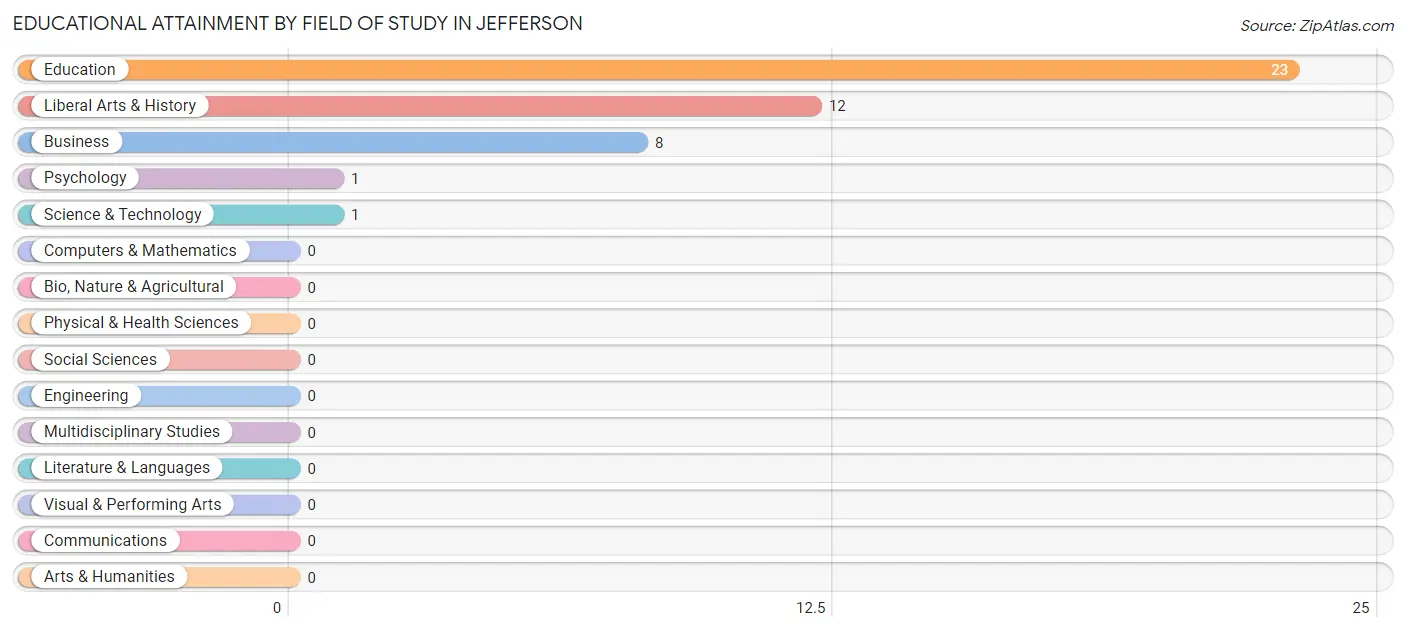
| Field of Study | # Graduates | % Graduates |
| Computers & Mathematics | 0 | 0.0% |
| Bio, Nature & Agricultural | 0 | 0.0% |
| Physical & Health Sciences | 0 | 0.0% |
| Psychology | 1 | 2.2% |
| Social Sciences | 0 | 0.0% |
| Engineering | 0 | 0.0% |
| Multidisciplinary Studies | 0 | 0.0% |
| Science & Technology | 1 | 2.2% |
| Business | 8 | 17.8% |
| Education | 23 | 51.1% |
| Literature & Languages | 0 | 0.0% |
| Liberal Arts & History | 12 | 26.7% |
| Visual & Performing Arts | 0 | 0.0% |
| Communications | 0 | 0.0% |
| Arts & Humanities | 0 | 0.0% |
| Total | 45 | 100.0% |
Transportation & Commute in Jefferson
Vehicle Availability by Sex in Jefferson
The most prevalent vehicle ownership categories in Jefferson are males with 3 vehicles (65, accounting for 38.0%) and females with 3 vehicles (52, making up 36.5%).
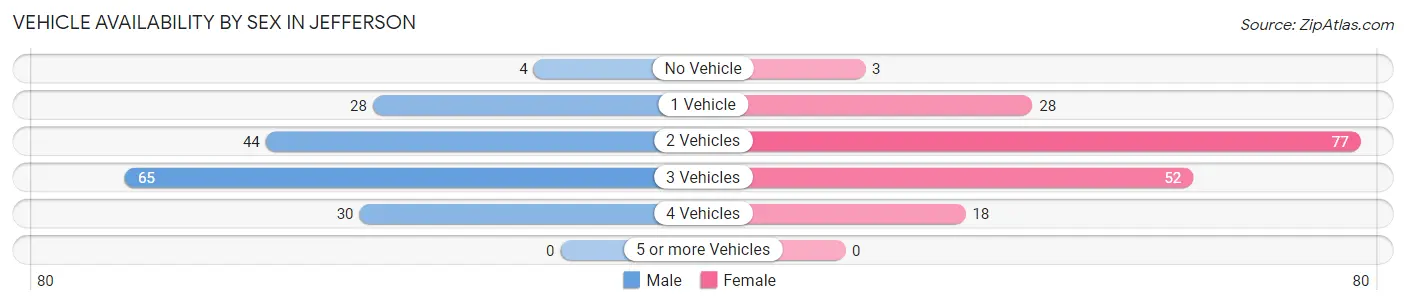
| Vehicles Available | Male | Female |
| No Vehicle | 4 (2.3%) | 3 (1.7%) |
| 1 Vehicle | 28 (16.4%) | 28 (15.7%) |
| 2 Vehicles | 44 (25.7%) | 77 (43.3%) |
| 3 Vehicles | 65 (38.0%) | 52 (29.2%) |
| 4 Vehicles | 30 (17.5%) | 18 (10.1%) |
| 5 or more Vehicles | 0 (0.0%) | 0 (0.0%) |
| Total | 171 (100.0%) | 178 (100.0%) |
Commute Time in Jefferson
The most frequently occuring commute durations in Jefferson are 45 to 59 minutes (73 commuters, 20.7%), 10 to 14 minutes (51 commuters, 14.5%), and 15 to 19 minutes (46 commuters, 13.1%).
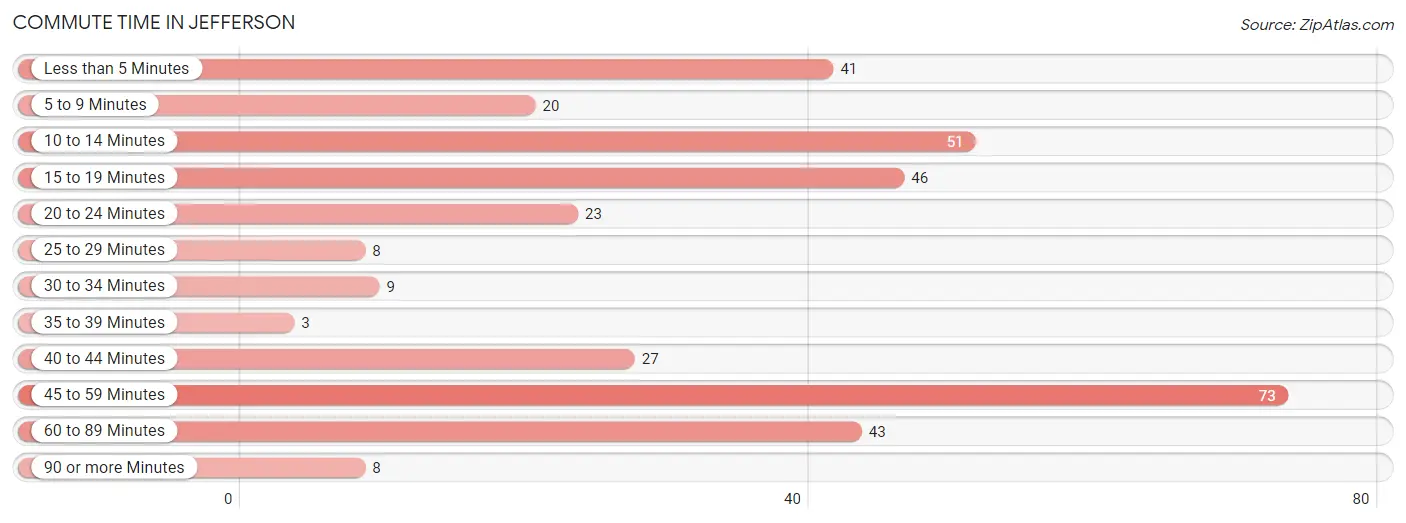
| Commute Time | # Commuters | % Commuters |
| Less than 5 Minutes | 41 | 11.7% |
| 5 to 9 Minutes | 20 | 5.7% |
| 10 to 14 Minutes | 51 | 14.5% |
| 15 to 19 Minutes | 46 | 13.1% |
| 20 to 24 Minutes | 23 | 6.5% |
| 25 to 29 Minutes | 8 | 2.3% |
| 30 to 34 Minutes | 9 | 2.6% |
| 35 to 39 Minutes | 3 | 0.9% |
| 40 to 44 Minutes | 27 | 7.7% |
| 45 to 59 Minutes | 73 | 20.7% |
| 60 to 89 Minutes | 43 | 12.2% |
| 90 or more Minutes | 8 | 2.3% |
Commute Time by Sex in Jefferson
The most common commute times in Jefferson are 10 to 14 minutes (51 commuters, 28.6%) for males and 45 to 59 minutes (62 commuters, 35.6%) for females.
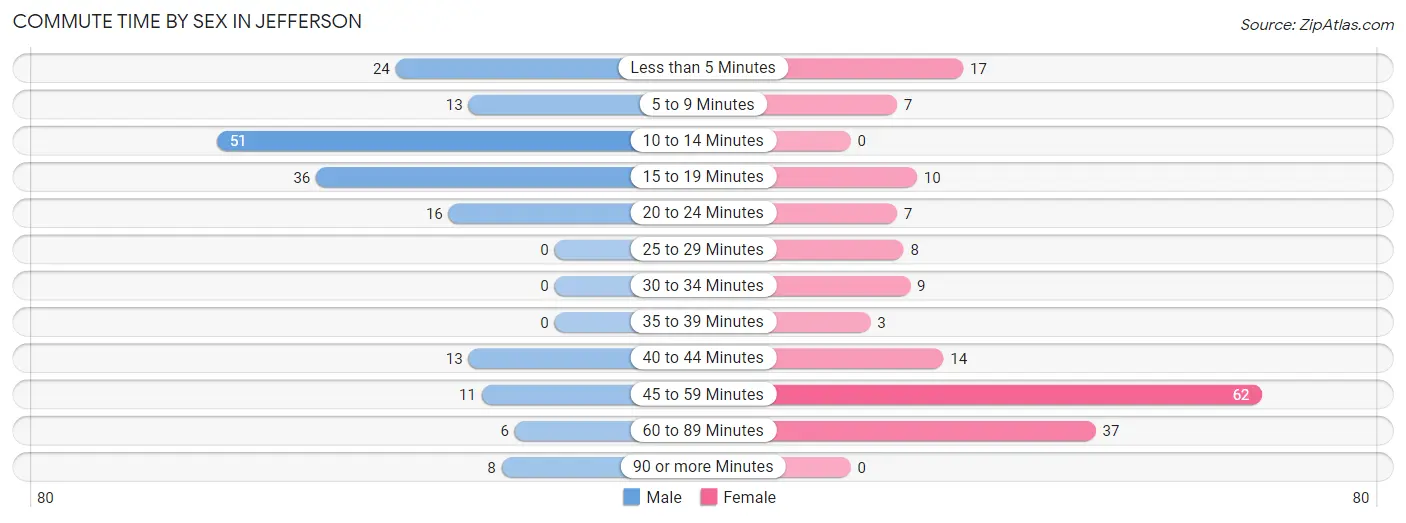
| Commute Time | Male | Female |
| Less than 5 Minutes | 24 (13.5%) | 17 (9.8%) |
| 5 to 9 Minutes | 13 (7.3%) | 7 (4.0%) |
| 10 to 14 Minutes | 51 (28.6%) | 0 (0.0%) |
| 15 to 19 Minutes | 36 (20.2%) | 10 (5.8%) |
| 20 to 24 Minutes | 16 (9.0%) | 7 (4.0%) |
| 25 to 29 Minutes | 0 (0.0%) | 8 (4.6%) |
| 30 to 34 Minutes | 0 (0.0%) | 9 (5.2%) |
| 35 to 39 Minutes | 0 (0.0%) | 3 (1.7%) |
| 40 to 44 Minutes | 13 (7.3%) | 14 (8.1%) |
| 45 to 59 Minutes | 11 (6.2%) | 62 (35.6%) |
| 60 to 89 Minutes | 6 (3.4%) | 37 (21.3%) |
| 90 or more Minutes | 8 (4.5%) | 0 (0.0%) |
Time of Departure to Work by Sex in Jefferson
The most frequent times of departure to work in Jefferson are 7:30 AM to 7:59 AM (37, 20.8%) for males and 7:30 AM to 7:59 AM (38, 21.8%) for females.
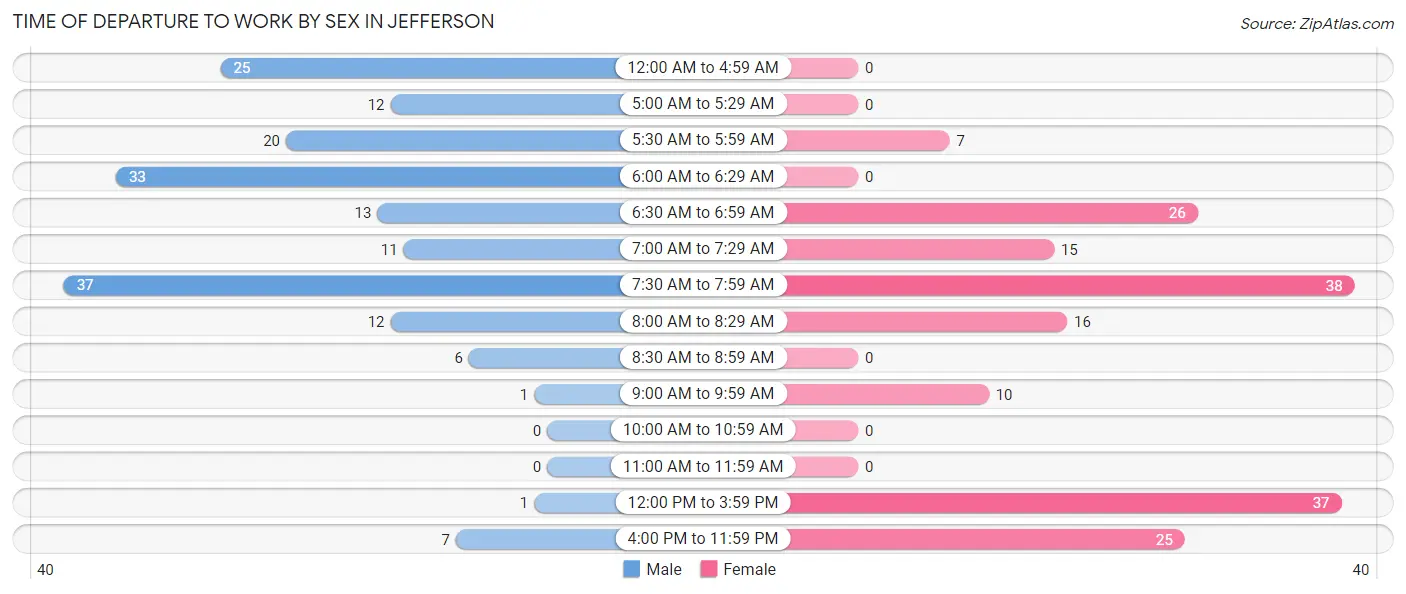
| Time of Departure | Male | Female |
| 12:00 AM to 4:59 AM | 25 (14.0%) | 0 (0.0%) |
| 5:00 AM to 5:29 AM | 12 (6.7%) | 0 (0.0%) |
| 5:30 AM to 5:59 AM | 20 (11.2%) | 7 (4.0%) |
| 6:00 AM to 6:29 AM | 33 (18.5%) | 0 (0.0%) |
| 6:30 AM to 6:59 AM | 13 (7.3%) | 26 (14.9%) |
| 7:00 AM to 7:29 AM | 11 (6.2%) | 15 (8.6%) |
| 7:30 AM to 7:59 AM | 37 (20.8%) | 38 (21.8%) |
| 8:00 AM to 8:29 AM | 12 (6.7%) | 16 (9.2%) |
| 8:30 AM to 8:59 AM | 6 (3.4%) | 0 (0.0%) |
| 9:00 AM to 9:59 AM | 1 (0.6%) | 10 (5.8%) |
| 10:00 AM to 10:59 AM | 0 (0.0%) | 0 (0.0%) |
| 11:00 AM to 11:59 AM | 0 (0.0%) | 0 (0.0%) |
| 12:00 PM to 3:59 PM | 1 (0.6%) | 37 (21.3%) |
| 4:00 PM to 11:59 PM | 7 (3.9%) | 25 (14.4%) |
| Total | 178 (100.0%) | 174 (100.0%) |
Housing Occupancy in Jefferson
Occupancy by Ownership in Jefferson
Of the total 327 dwellings in Jefferson, owner-occupied units account for 224 (68.5%), while renter-occupied units make up 103 (31.5%).
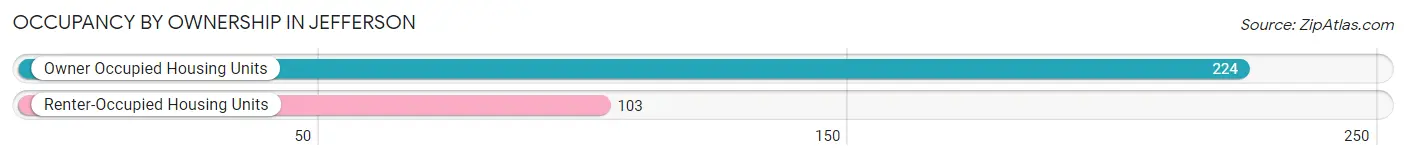
| Occupancy | # Housing Units | % Housing Units |
| Owner Occupied Housing Units | 224 | 68.5% |
| Renter-Occupied Housing Units | 103 | 31.5% |
| Total Occupied Housing Units | 327 | 100.0% |
Occupancy by Household Size in Jefferson
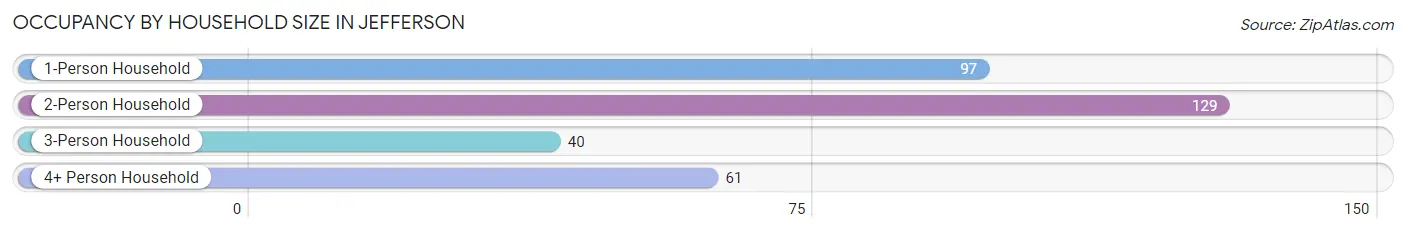
| Household Size | # Housing Units | % Housing Units |
| 1-Person Household | 97 | 29.7% |
| 2-Person Household | 129 | 39.5% |
| 3-Person Household | 40 | 12.2% |
| 4+ Person Household | 61 | 18.6% |
| Total Housing Units | 327 | 100.0% |
Occupancy by Ownership by Household Size in Jefferson
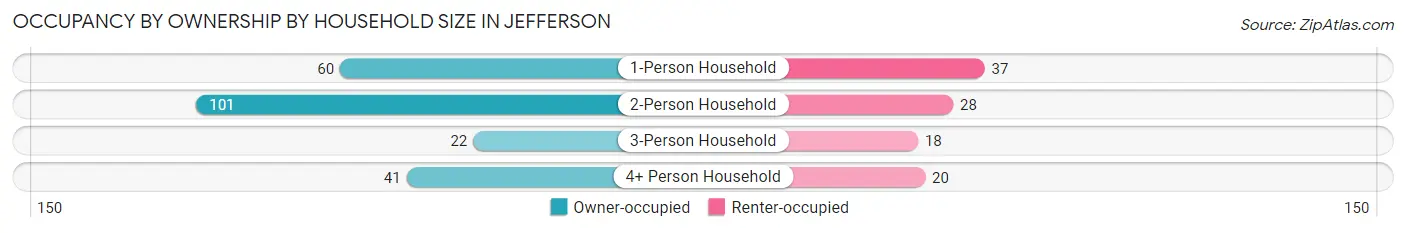
| Household Size | Owner-occupied | Renter-occupied |
| 1-Person Household | 60 (61.9%) | 37 (38.1%) |
| 2-Person Household | 101 (78.3%) | 28 (21.7%) |
| 3-Person Household | 22 (55.0%) | 18 (45.0%) |
| 4+ Person Household | 41 (67.2%) | 20 (32.8%) |
| Total Housing Units | 224 (68.5%) | 103 (31.5%) |
Occupancy by Educational Attainment in Jefferson
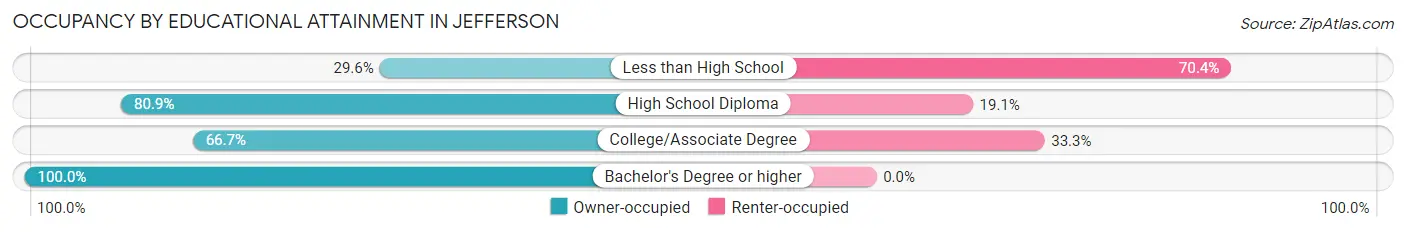
| Household Size | Owner-occupied | Renter-occupied |
| Less than High School | 16 (29.6%) | 38 (70.4%) |
| High School Diploma | 93 (80.9%) | 22 (19.1%) |
| College/Associate Degree | 86 (66.7%) | 43 (33.3%) |
| Bachelor's Degree or higher | 29 (100.0%) | 0 (0.0%) |
Occupancy by Age of Householder in Jefferson
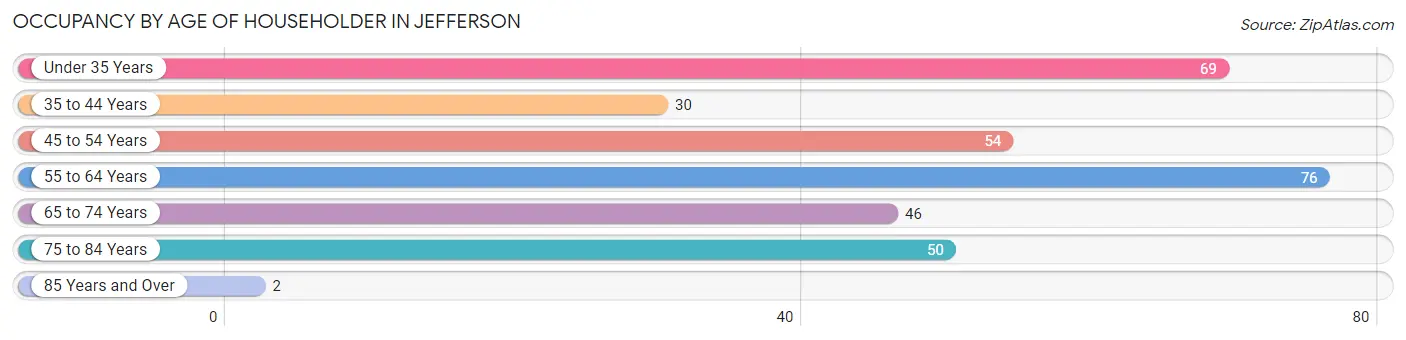
| Age Bracket | # Households | % Households |
| Under 35 Years | 69 | 21.1% |
| 35 to 44 Years | 30 | 9.2% |
| 45 to 54 Years | 54 | 16.5% |
| 55 to 64 Years | 76 | 23.2% |
| 65 to 74 Years | 46 | 14.1% |
| 75 to 84 Years | 50 | 15.3% |
| 85 Years and Over | 2 | 0.6% |
| Total | 327 | 100.0% |
Housing Finances in Jefferson
Median Income by Occupancy in Jefferson
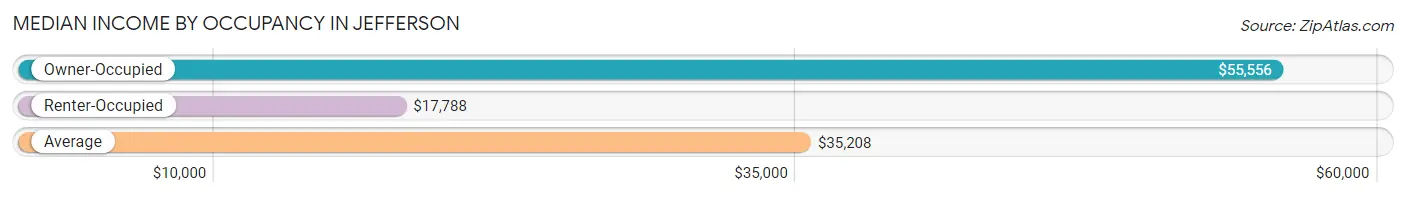
| Occupancy Type | # Households | Median Income |
| Owner-Occupied | 224 (68.5%) | $55,556 |
| Renter-Occupied | 103 (31.5%) | $17,788 |
| Average | 327 (100.0%) | $35,208 |
Occupancy by Householder Income Bracket in Jefferson
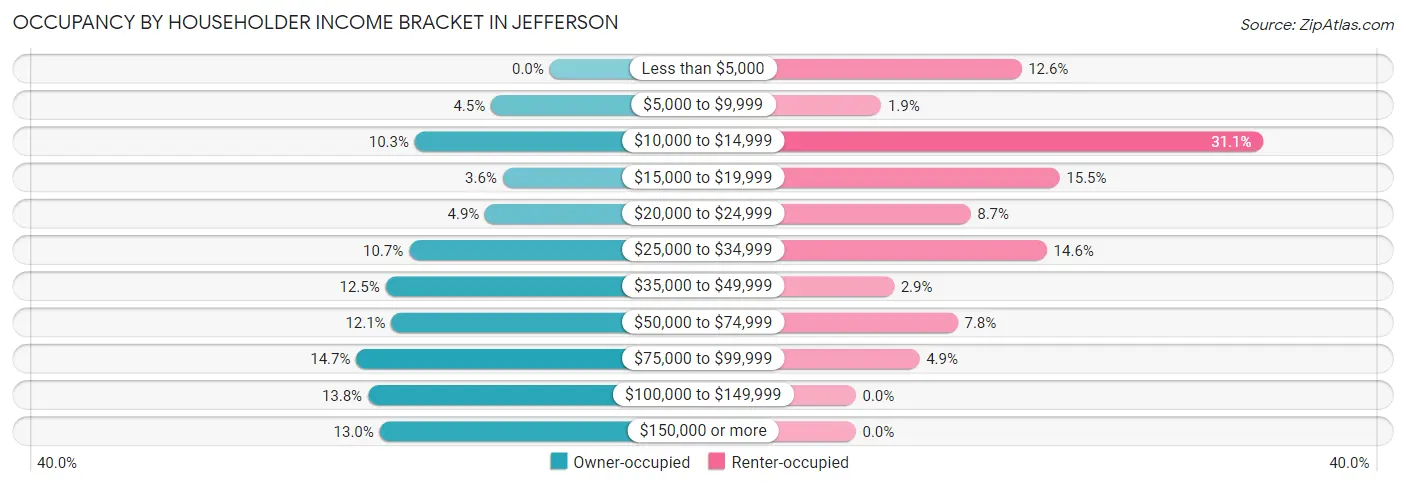
| Income Bracket | Owner-occupied | Renter-occupied |
| Less than $5,000 | 0 (0.0%) | 13 (12.6%) |
| $5,000 to $9,999 | 10 (4.5%) | 2 (1.9%) |
| $10,000 to $14,999 | 23 (10.3%) | 32 (31.1%) |
| $15,000 to $19,999 | 8 (3.6%) | 16 (15.5%) |
| $20,000 to $24,999 | 11 (4.9%) | 9 (8.7%) |
| $25,000 to $34,999 | 24 (10.7%) | 15 (14.6%) |
| $35,000 to $49,999 | 28 (12.5%) | 3 (2.9%) |
| $50,000 to $74,999 | 27 (12.0%) | 8 (7.8%) |
| $75,000 to $99,999 | 33 (14.7%) | 5 (4.9%) |
| $100,000 to $149,999 | 31 (13.8%) | 0 (0.0%) |
| $150,000 or more | 29 (13.0%) | 0 (0.0%) |
| Total | 224 (100.0%) | 103 (100.0%) |
Monthly Housing Cost Tiers in Jefferson
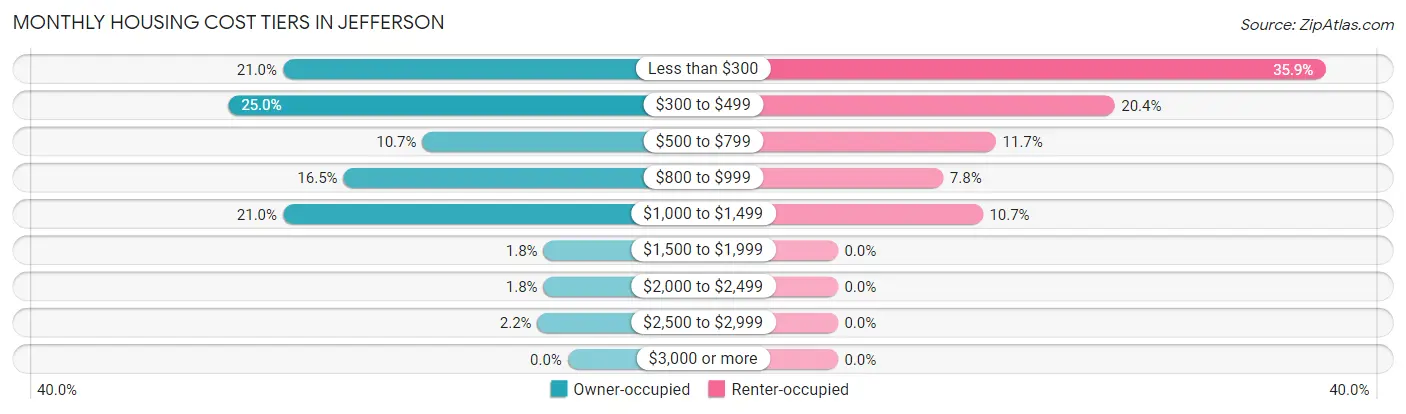
| Monthly Cost | Owner-occupied | Renter-occupied |
| Less than $300 | 47 (21.0%) | 37 (35.9%) |
| $300 to $499 | 56 (25.0%) | 21 (20.4%) |
| $500 to $799 | 24 (10.7%) | 12 (11.7%) |
| $800 to $999 | 37 (16.5%) | 8 (7.8%) |
| $1,000 to $1,499 | 47 (21.0%) | 11 (10.7%) |
| $1,500 to $1,999 | 4 (1.8%) | 0 (0.0%) |
| $2,000 to $2,499 | 4 (1.8%) | 0 (0.0%) |
| $2,500 to $2,999 | 5 (2.2%) | 0 (0.0%) |
| $3,000 or more | 0 (0.0%) | 0 (0.0%) |
| Total | 224 (100.0%) | 103 (100.0%) |
Physical Housing Characteristics in Jefferson
Housing Structures in Jefferson
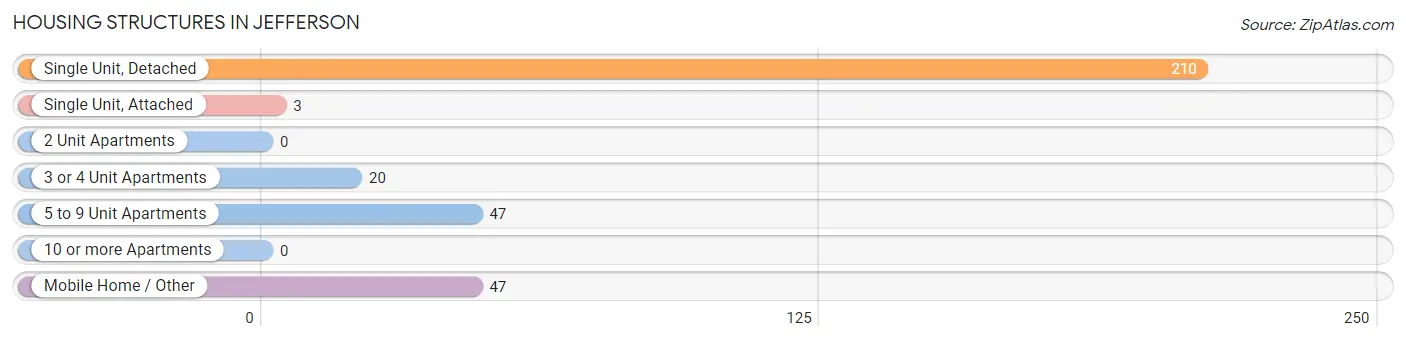
| Structure Type | # Housing Units | % Housing Units |
| Single Unit, Detached | 210 | 64.2% |
| Single Unit, Attached | 3 | 0.9% |
| 2 Unit Apartments | 0 | 0.0% |
| 3 or 4 Unit Apartments | 20 | 6.1% |
| 5 to 9 Unit Apartments | 47 | 14.4% |
| 10 or more Apartments | 0 | 0.0% |
| Mobile Home / Other | 47 | 14.4% |
| Total | 327 | 100.0% |
Housing Structures by Occupancy in Jefferson
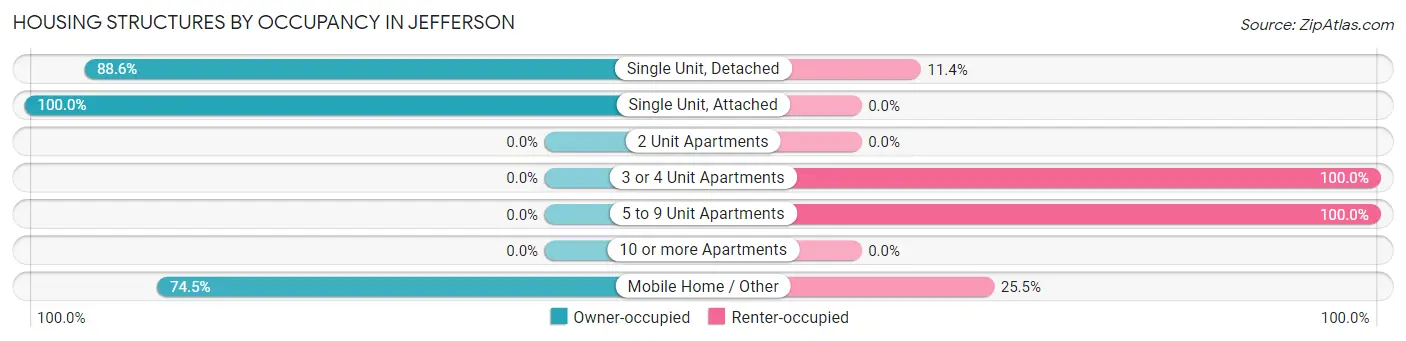
| Structure Type | Owner-occupied | Renter-occupied |
| Single Unit, Detached | 186 (88.6%) | 24 (11.4%) |
| Single Unit, Attached | 3 (100.0%) | 0 (0.0%) |
| 2 Unit Apartments | 0 (0.0%) | 0 (0.0%) |
| 3 or 4 Unit Apartments | 0 (0.0%) | 20 (100.0%) |
| 5 to 9 Unit Apartments | 0 (0.0%) | 47 (100.0%) |
| 10 or more Apartments | 0 (0.0%) | 0 (0.0%) |
| Mobile Home / Other | 35 (74.5%) | 12 (25.5%) |
| Total | 224 (68.5%) | 103 (31.5%) |
Housing Structures by Number of Rooms in Jefferson
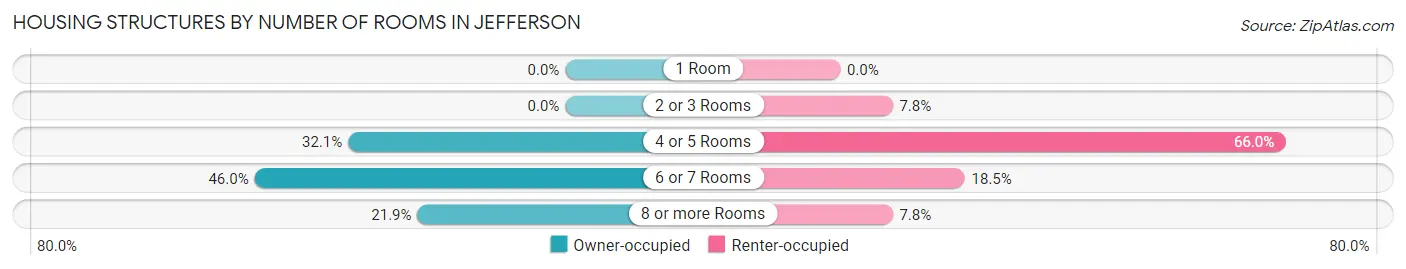
| Number of Rooms | Owner-occupied | Renter-occupied |
| 1 Room | 0 (0.0%) | 0 (0.0%) |
| 2 or 3 Rooms | 0 (0.0%) | 8 (7.8%) |
| 4 or 5 Rooms | 72 (32.1%) | 68 (66.0%) |
| 6 or 7 Rooms | 103 (46.0%) | 19 (18.4%) |
| 8 or more Rooms | 49 (21.9%) | 8 (7.8%) |
| Total | 224 (100.0%) | 103 (100.0%) |
Housing Structure by Heating Type in Jefferson
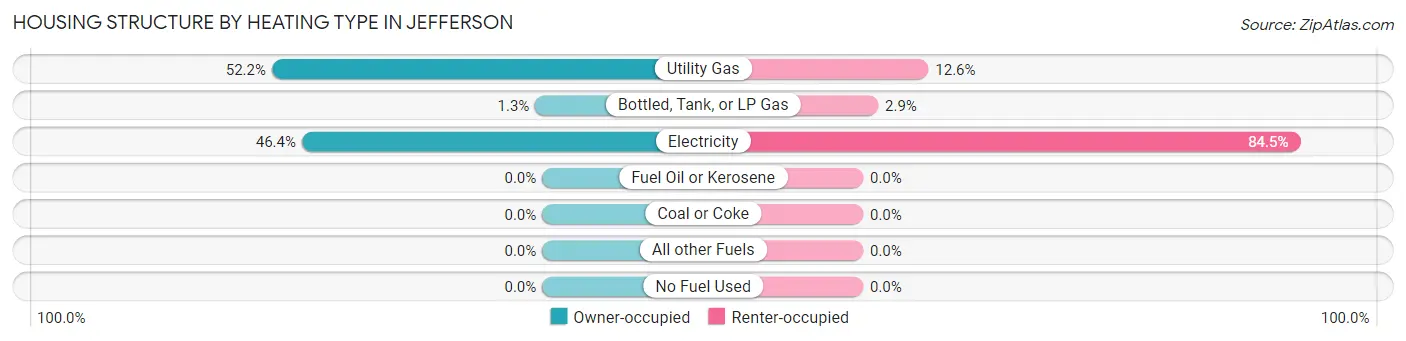
| Heating Type | Owner-occupied | Renter-occupied |
| Utility Gas | 117 (52.2%) | 13 (12.6%) |
| Bottled, Tank, or LP Gas | 3 (1.3%) | 3 (2.9%) |
| Electricity | 104 (46.4%) | 87 (84.5%) |
| Fuel Oil or Kerosene | 0 (0.0%) | 0 (0.0%) |
| Coal or Coke | 0 (0.0%) | 0 (0.0%) |
| All other Fuels | 0 (0.0%) | 0 (0.0%) |
| No Fuel Used | 0 (0.0%) | 0 (0.0%) |
| Total | 224 (100.0%) | 103 (100.0%) |
Household Vehicle Usage in Jefferson
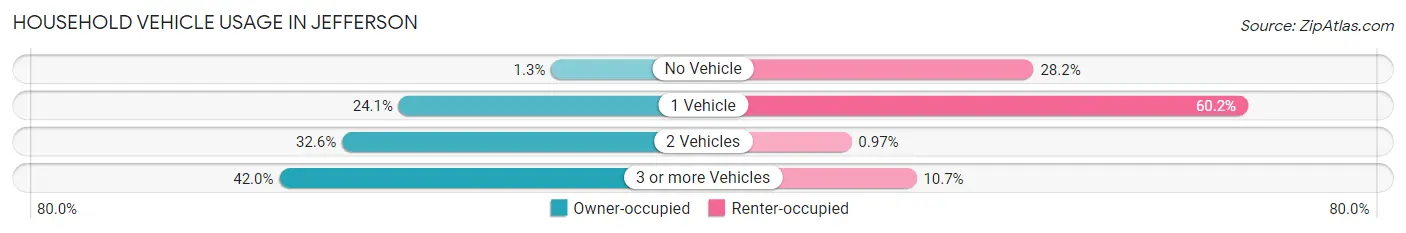
| Vehicles per Household | Owner-occupied | Renter-occupied |
| No Vehicle | 3 (1.3%) | 29 (28.2%) |
| 1 Vehicle | 54 (24.1%) | 62 (60.2%) |
| 2 Vehicles | 73 (32.6%) | 1 (1.0%) |
| 3 or more Vehicles | 94 (42.0%) | 11 (10.7%) |
| Total | 224 (100.0%) | 103 (100.0%) |
Real Estate & Mortgages in Jefferson
Real Estate and Mortgage Overview in Jefferson
| Characteristic | Without Mortgage | With Mortgage |
| Housing Units | 119 | 105 |
| Median Property Value | $112,500 | $132,300 |
| Median Household Income | $32,031 | $16 |
| Monthly Housing Costs | $348 | $0 |
| Real Estate Taxes | $338 | $2 |
Property Value by Mortgage Status in Jefferson
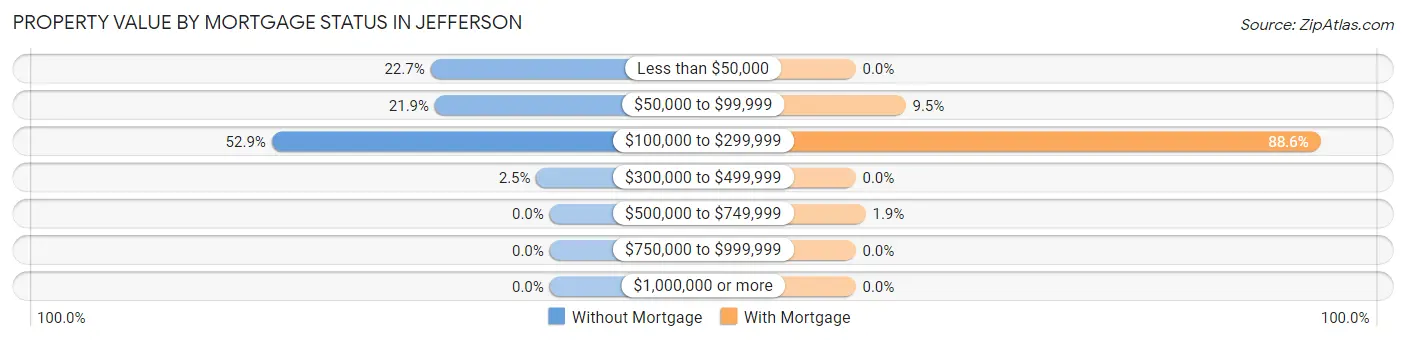
| Property Value | Without Mortgage | With Mortgage |
| Less than $50,000 | 27 (22.7%) | 0 (0.0%) |
| $50,000 to $99,999 | 26 (21.8%) | 10 (9.5%) |
| $100,000 to $299,999 | 63 (52.9%) | 93 (88.6%) |
| $300,000 to $499,999 | 3 (2.5%) | 0 (0.0%) |
| $500,000 to $749,999 | 0 (0.0%) | 2 (1.9%) |
| $750,000 to $999,999 | 0 (0.0%) | 0 (0.0%) |
| $1,000,000 or more | 0 (0.0%) | 0 (0.0%) |
| Total | 119 (100.0%) | 105 (100.0%) |
Household Income by Mortgage Status in Jefferson
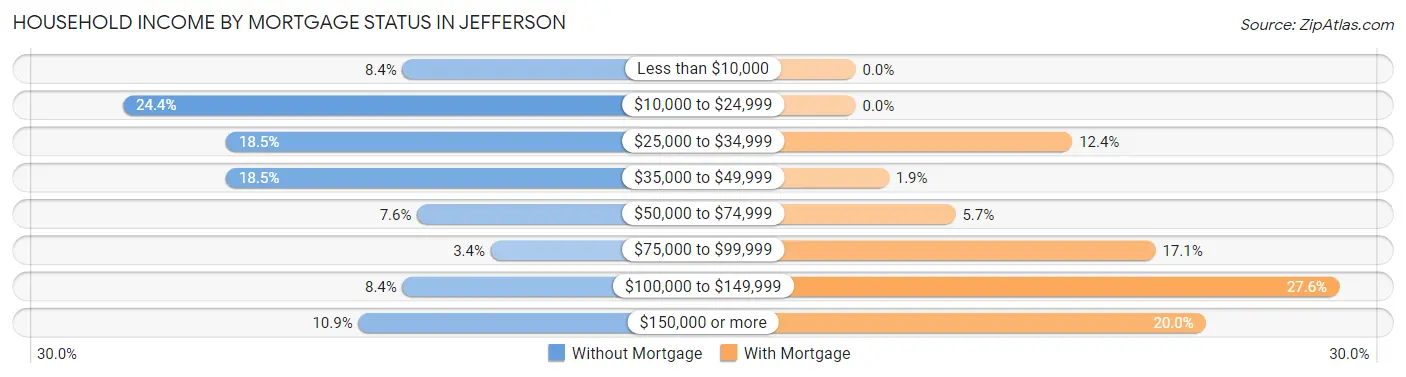
| Household Income | Without Mortgage | With Mortgage |
| Less than $10,000 | 10 (8.4%) | 0 (0.0%) |
| $10,000 to $24,999 | 29 (24.4%) | 0 (0.0%) |
| $25,000 to $34,999 | 22 (18.5%) | 13 (12.4%) |
| $35,000 to $49,999 | 22 (18.5%) | 2 (1.9%) |
| $50,000 to $74,999 | 9 (7.6%) | 6 (5.7%) |
| $75,000 to $99,999 | 4 (3.4%) | 18 (17.1%) |
| $100,000 to $149,999 | 10 (8.4%) | 29 (27.6%) |
| $150,000 or more | 13 (10.9%) | 21 (20.0%) |
| Total | 119 (100.0%) | 105 (100.0%) |
Property Value to Household Income Ratio in Jefferson
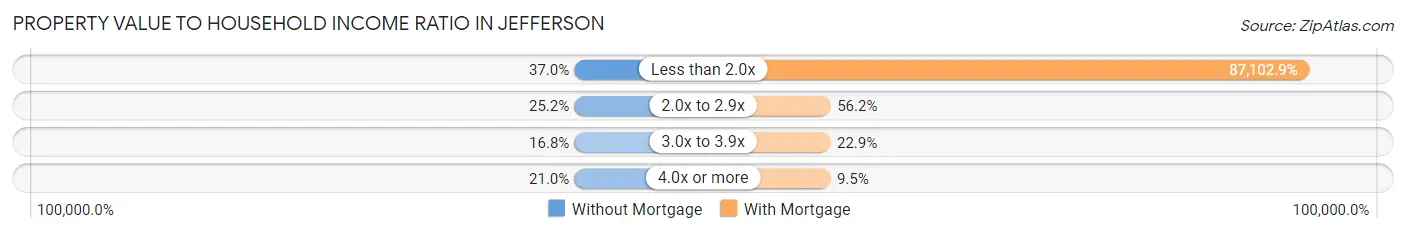
| Value-to-Income Ratio | Without Mortgage | With Mortgage |
| Less than 2.0x | 44 (37.0%) | 91,458 (87,102.9%) |
| 2.0x to 2.9x | 30 (25.2%) | 59 (56.2%) |
| 3.0x to 3.9x | 20 (16.8%) | 24 (22.9%) |
| 4.0x or more | 25 (21.0%) | 10 (9.5%) |
| Total | 119 (100.0%) | 105 (100.0%) |
Real Estate Taxes by Mortgage Status in Jefferson
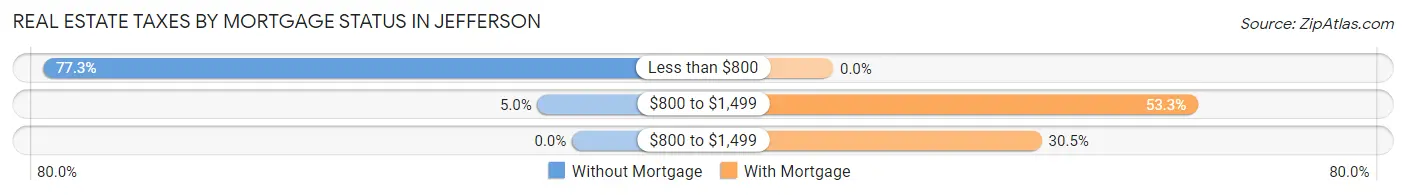
| Property Taxes | Without Mortgage | With Mortgage |
| Less than $800 | 92 (77.3%) | 0 (0.0%) |
| $800 to $1,499 | 6 (5.0%) | 56 (53.3%) |
| $800 to $1,499 | 0 (0.0%) | 32 (30.5%) |
| Total | 119 (100.0%) | 105 (100.0%) |
Health & Disability in Jefferson
Health Insurance Coverage by Age in Jefferson
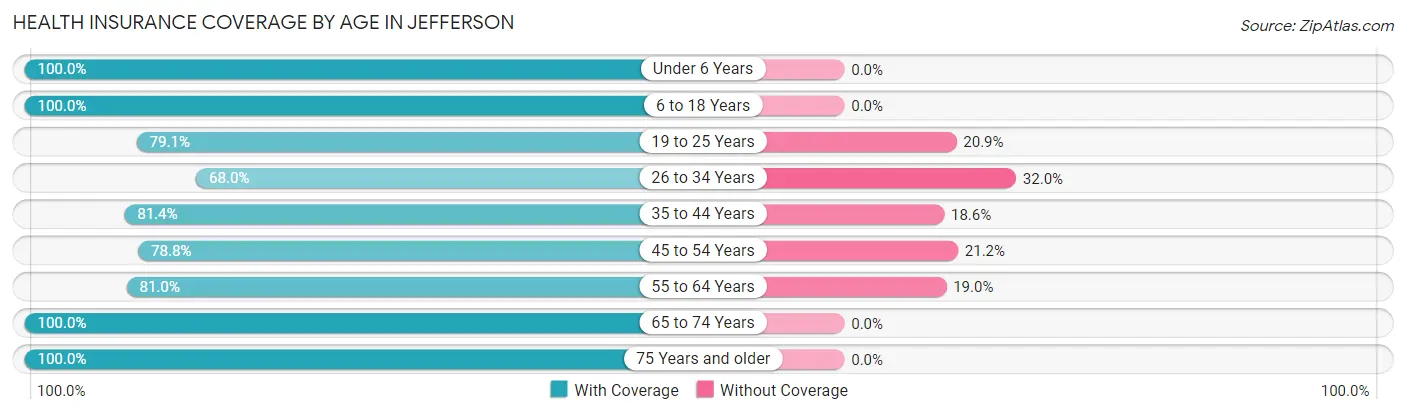
| Age Bracket | With Coverage | Without Coverage |
| Under 6 Years | 82 (100.0%) | 0 (0.0%) |
| 6 to 18 Years | 132 (100.0%) | 0 (0.0%) |
| 19 to 25 Years | 53 (79.1%) | 14 (20.9%) |
| 26 to 34 Years | 102 (68.0%) | 48 (32.0%) |
| 35 to 44 Years | 35 (81.4%) | 8 (18.6%) |
| 45 to 54 Years | 67 (78.8%) | 18 (21.2%) |
| 55 to 64 Years | 98 (81.0%) | 23 (19.0%) |
| 65 to 74 Years | 73 (100.0%) | 0 (0.0%) |
| 75 Years and older | 77 (100.0%) | 0 (0.0%) |
| Total | 719 (86.6%) | 111 (13.4%) |
Health Insurance Coverage by Citizenship Status in Jefferson
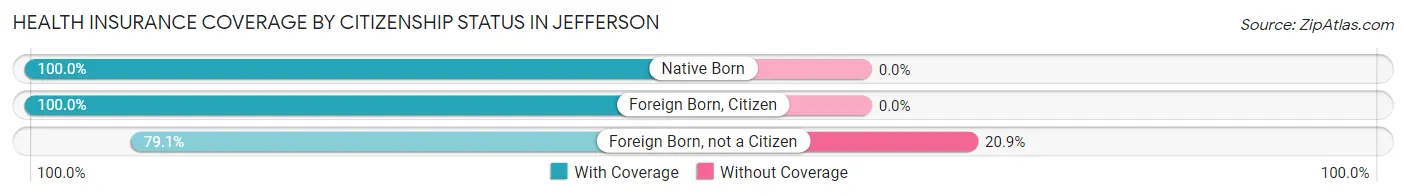
| Citizenship Status | With Coverage | Without Coverage |
| Native Born | 82 (100.0%) | 0 (0.0%) |
| Foreign Born, Citizen | 132 (100.0%) | 0 (0.0%) |
| Foreign Born, not a Citizen | 53 (79.1%) | 14 (20.9%) |
Health Insurance Coverage by Household Income in Jefferson
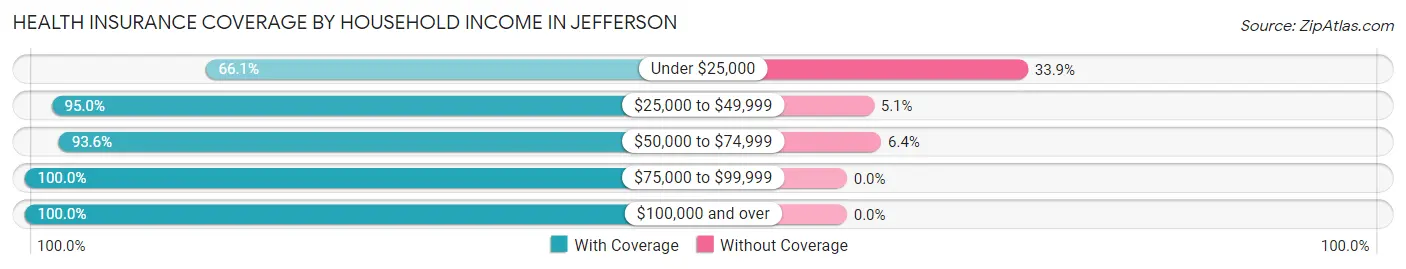
| Household Income | With Coverage | Without Coverage |
| Under $25,000 | 150 (66.1%) | 77 (33.9%) |
| $25,000 to $49,999 | 188 (95.0%) | 10 (5.1%) |
| $50,000 to $74,999 | 102 (93.6%) | 7 (6.4%) |
| $75,000 to $99,999 | 117 (100.0%) | 0 (0.0%) |
| $100,000 and over | 153 (100.0%) | 0 (0.0%) |
Public vs Private Health Insurance Coverage by Age in Jefferson
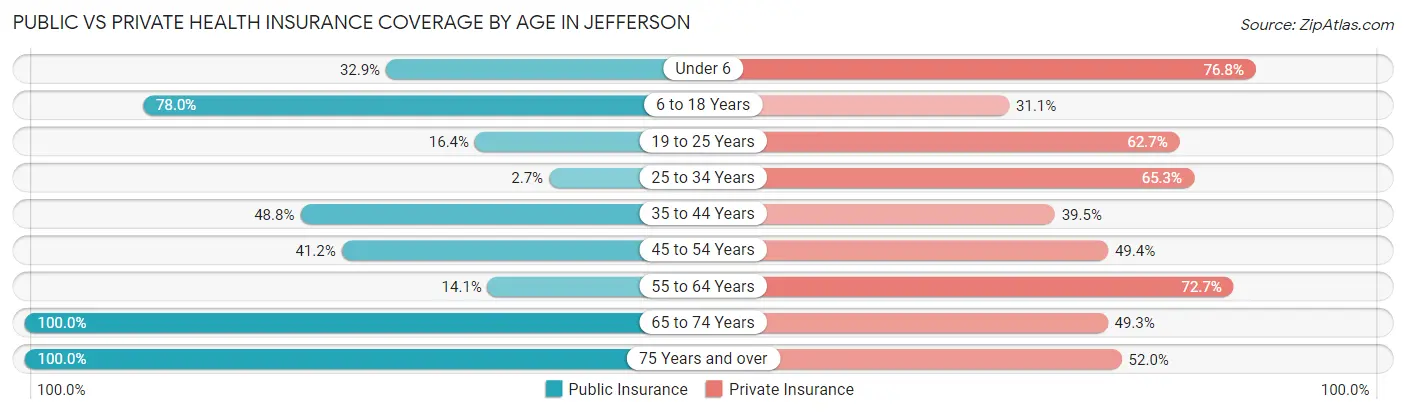
| Age Bracket | Public Insurance | Private Insurance |
| Under 6 | 27 (32.9%) | 63 (76.8%) |
| 6 to 18 Years | 103 (78.0%) | 41 (31.1%) |
| 19 to 25 Years | 11 (16.4%) | 42 (62.7%) |
| 25 to 34 Years | 4 (2.7%) | 98 (65.3%) |
| 35 to 44 Years | 21 (48.8%) | 17 (39.5%) |
| 45 to 54 Years | 35 (41.2%) | 42 (49.4%) |
| 55 to 64 Years | 17 (14.1%) | 88 (72.7%) |
| 65 to 74 Years | 73 (100.0%) | 36 (49.3%) |
| 75 Years and over | 77 (100.0%) | 40 (51.9%) |
| Total | 368 (44.3%) | 467 (56.3%) |
Disability Status by Sex by Age in Jefferson
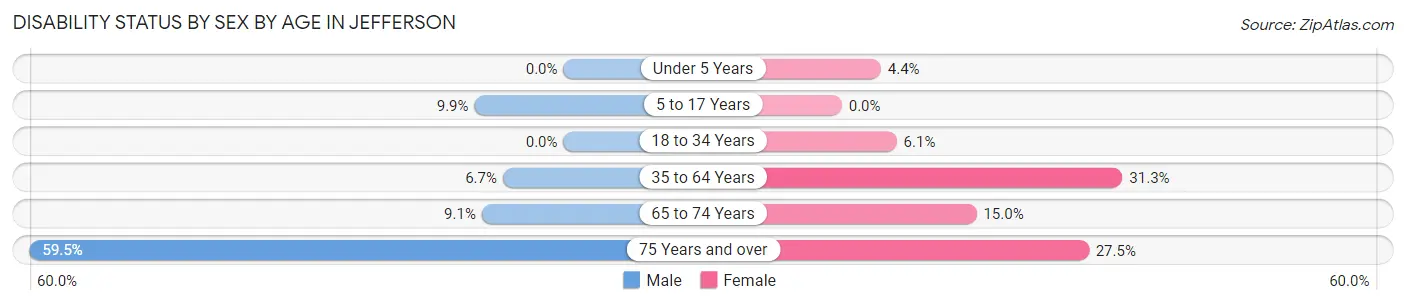
| Age Bracket | Male | Female |
| Under 5 Years | 0 (0.0%) | 1 (4.3%) |
| 5 to 17 Years | 11 (9.9%) | 0 (0.0%) |
| 18 to 34 Years | 0 (0.0%) | 8 (6.1%) |
| 35 to 64 Years | 6 (6.7%) | 50 (31.2%) |
| 65 to 74 Years | 3 (9.1%) | 6 (15.0%) |
| 75 Years and over | 22 (59.5%) | 11 (27.5%) |
Disability Class by Sex by Age in Jefferson
Disability Class: Hearing Difficulty
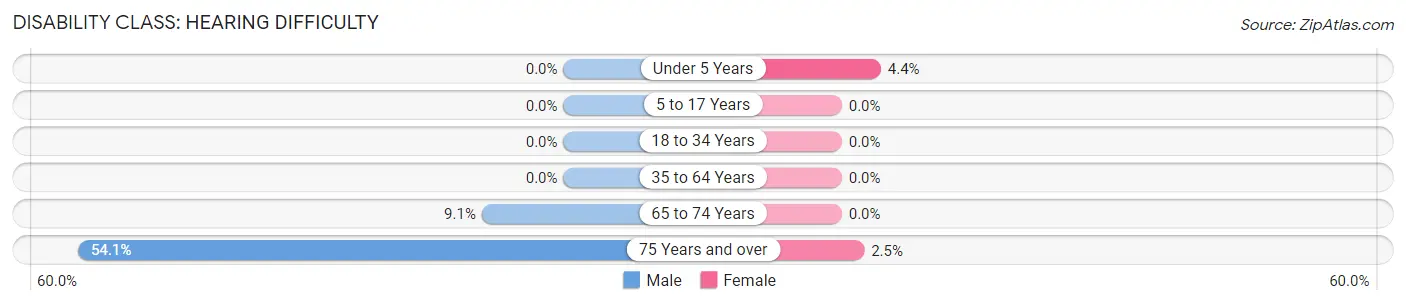
| Age Bracket | Male | Female |
| Under 5 Years | 0 (0.0%) | 1 (4.3%) |
| 5 to 17 Years | 0 (0.0%) | 0 (0.0%) |
| 18 to 34 Years | 0 (0.0%) | 0 (0.0%) |
| 35 to 64 Years | 0 (0.0%) | 0 (0.0%) |
| 65 to 74 Years | 3 (9.1%) | 0 (0.0%) |
| 75 Years and over | 20 (54.0%) | 1 (2.5%) |
Disability Class: Vision Difficulty
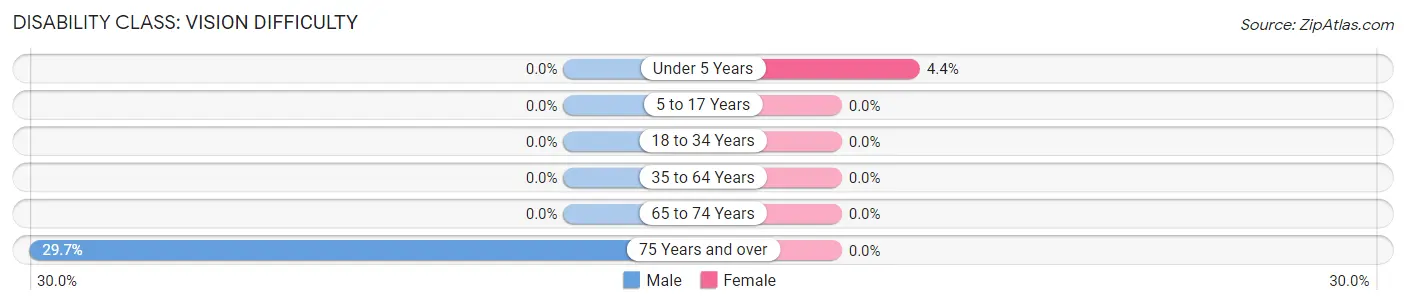
| Age Bracket | Male | Female |
| Under 5 Years | 0 (0.0%) | 1 (4.3%) |
| 5 to 17 Years | 0 (0.0%) | 0 (0.0%) |
| 18 to 34 Years | 0 (0.0%) | 0 (0.0%) |
| 35 to 64 Years | 0 (0.0%) | 0 (0.0%) |
| 65 to 74 Years | 0 (0.0%) | 0 (0.0%) |
| 75 Years and over | 11 (29.7%) | 0 (0.0%) |
Disability Class: Cognitive Difficulty
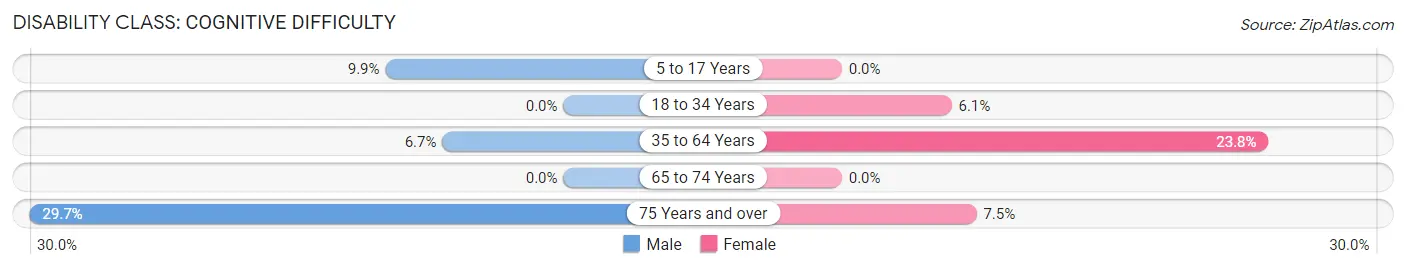
| Age Bracket | Male | Female |
| 5 to 17 Years | 11 (9.9%) | 0 (0.0%) |
| 18 to 34 Years | 0 (0.0%) | 8 (6.1%) |
| 35 to 64 Years | 6 (6.7%) | 38 (23.7%) |
| 65 to 74 Years | 0 (0.0%) | 0 (0.0%) |
| 75 Years and over | 11 (29.7%) | 3 (7.5%) |
Disability Class: Ambulatory Difficulty
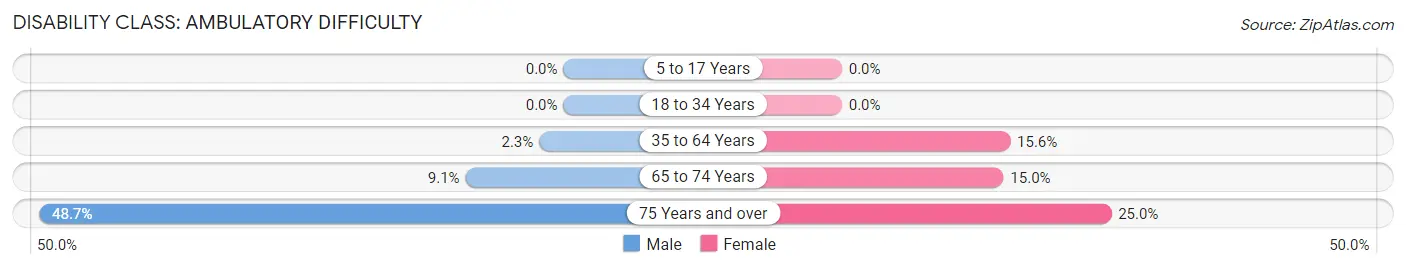
| Age Bracket | Male | Female |
| 5 to 17 Years | 0 (0.0%) | 0 (0.0%) |
| 18 to 34 Years | 0 (0.0%) | 0 (0.0%) |
| 35 to 64 Years | 2 (2.2%) | 25 (15.6%) |
| 65 to 74 Years | 3 (9.1%) | 6 (15.0%) |
| 75 Years and over | 18 (48.6%) | 10 (25.0%) |
Disability Class: Self-Care Difficulty
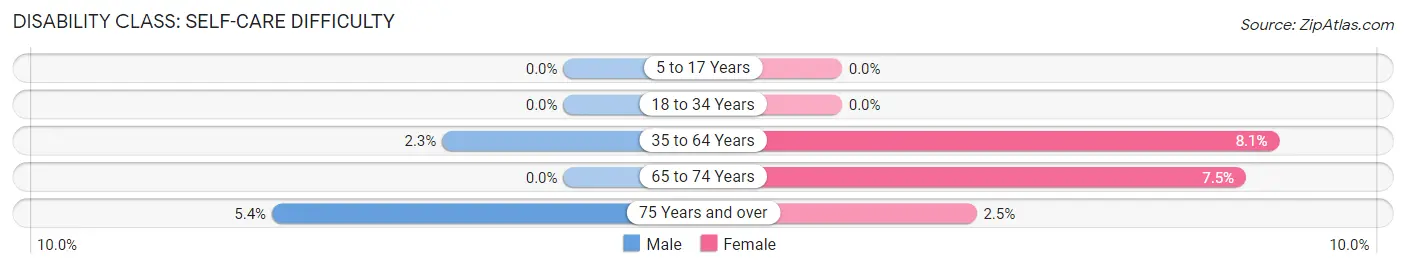
| Age Bracket | Male | Female |
| 5 to 17 Years | 0 (0.0%) | 0 (0.0%) |
| 18 to 34 Years | 0 (0.0%) | 0 (0.0%) |
| 35 to 64 Years | 2 (2.2%) | 13 (8.1%) |
| 65 to 74 Years | 0 (0.0%) | 3 (7.5%) |
| 75 Years and over | 2 (5.4%) | 1 (2.5%) |
Technology Access in Jefferson
Computing Device Access in Jefferson
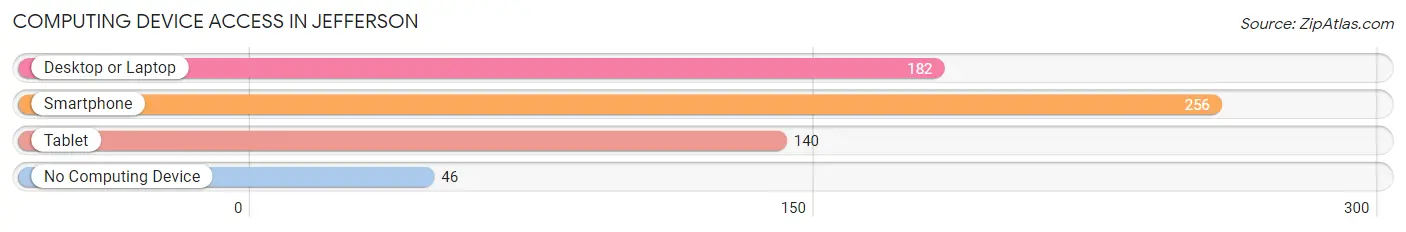
| Device Type | # Households | % Households |
| Desktop or Laptop | 182 | 55.7% |
| Smartphone | 256 | 78.3% |
| Tablet | 140 | 42.8% |
| No Computing Device | 46 | 14.1% |
| Total | 327 | 100.0% |
Internet Access in Jefferson
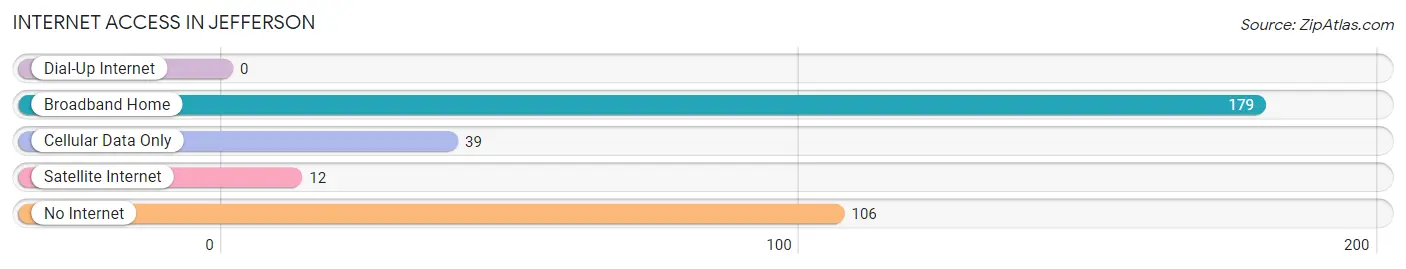
| Internet Type | # Households | % Households |
| Dial-Up Internet | 0 | 0.0% |
| Broadband Home | 179 | 54.7% |
| Cellular Data Only | 39 | 11.9% |
| Satellite Internet | 12 | 3.7% |
| No Internet | 106 | 32.4% |
| Total | 327 | 100.0% |
Jefferson Summary
Jefferson, South Carolina is a small town located in the upstate region of the state. It is situated in the foothills of the Blue Ridge Mountains and is part of the Greenville-Spartanburg-Anderson Combined Statistical Area. The town has a population of approximately 1,500 people and is located in the northwestern corner of Oconee County.
Geography
Jefferson is located in the foothills of the Blue Ridge Mountains, which are part of the Appalachian Mountains. The town is situated in the northwestern corner of Oconee County, and is bordered by the towns of Walhalla, Seneca, and Westminster. The town is located at an elevation of 1,000 feet above sea level, and is situated on the banks of the Chauga River. The town is surrounded by rolling hills and lush forests, and is home to several small lakes and streams.
Economy
The economy of Jefferson is largely based on agriculture and tourism. The town is home to several small farms, which produce a variety of crops, including corn, soybeans, and wheat. The town is also home to several small businesses, including restaurants, retail stores, and service providers. Tourism is also an important part of the local economy, as the town is located near several popular attractions, including the Chattooga River, the Blue Ridge Parkway, and the Oconee State Park.
Demographics
As of the 2010 census, the population of Jefferson was 1,500 people. The racial makeup of the town was 95.3% White, 1.7% African American, 0.3% Native American, 0.7% Asian, 0.3% from other races, and 1.7% from two or more races. Hispanic or Latino of any race were 1.3% of the population. The median income for a household in the town was $37,500, and the median income for a family was $45,000.
History
Jefferson was founded in 1820 by a group of settlers from North Carolina. The town was named after Thomas Jefferson, the third President of the United States. The town was originally a farming community, and the local economy was largely based on the production of cotton and tobacco. In the late 19th century, the town began to experience a period of growth, as the railroad was extended to the town in 1887. The town continued to grow throughout the 20th century, and today it is a small but vibrant community.
Common Questions
What is Per Capita Income in Jefferson?
Per Capita income in Jefferson is $25,763.
What is the Median Family Income in Jefferson?
Median Family Income in Jefferson is $53,958.
What is the Median Household income in Jefferson?
Median Household Income in Jefferson is $35,208.
What is Income or Wage Gap in Jefferson?
Income or Wage Gap in Jefferson is 46.3%.
Women in Jefferson earn 53.7 cents for every dollar earned by a man.
What is Family Income Deficit in Jefferson?
Family Income Deficit in Jefferson is $11,993.
Families that are below poverty line in Jefferson earn $11,993 less on average than the poverty threshold level.
What is Inequality or Gini Index in Jefferson?
Inequality or Gini Index in Jefferson is 0.51.
What is the Total Population of Jefferson?
Total Population of Jefferson is 830.
What is the Total Male Population of Jefferson?
Total Male Population of Jefferson is 392.
What is the Total Female Population of Jefferson?
Total Female Population of Jefferson is 438.
What is the Ratio of Males per 100 Females in Jefferson?
There are 89.50 Males per 100 Females in Jefferson.
What is the Ratio of Females per 100 Males in Jefferson?
There are 111.73 Females per 100 Males in Jefferson.
What is the Median Population Age in Jefferson?
Median Population Age in Jefferson is 32.6 Years.
What is the Average Family Size in Jefferson
Average Family Size in Jefferson is 3.1 People.
What is the Average Household Size in Jefferson
Average Household Size in Jefferson is 2.5 People.
How Large is the Labor Force in Jefferson?
There are 401 People in the Labor Forcein in Jefferson.
What is the Percentage of People in the Labor Force in Jefferson?
63.2% of People are in the Labor Force in Jefferson.
What is the Unemployment Rate in Jefferson?
Unemployment Rate in Jefferson is 9.7%.