Honea Path, SC Map & Demographics
Honea Path Map
Honea Path Overview
$24,026
PER CAPITA INCOME
$53,947
AVG FAMILY INCOME
$50,375
AVG HOUSEHOLD INCOME
12.0%
WAGE / INCOME GAP [ % ]
88.0¢/ $1
WAGE / INCOME GAP [ $ ]
$18,429
FAMILY INCOME DEFICIT
0.43
INEQUALITY / GINI INDEX
3,662
TOTAL POPULATION
1,922
MALE POPULATION
1,740
FEMALE POPULATION
110.46
MALES / 100 FEMALES
90.53
FEMALES / 100 MALES
46.5
MEDIAN AGE
3.1
AVG FAMILY SIZE
2.4
AVG HOUSEHOLD SIZE
1,369
LABOR FORCE [ PEOPLE ]
48.1%
PERCENT IN LABOR FORCE
7.3%
UNEMPLOYMENT RATE
Honea Path Zip Codes
Honea Path Area Codes
Income in Honea Path
Income Overview in Honea Path
Per Capita Income in Honea Path is $24,026, while median incomes of families and households are $53,947 and $50,375 respectively.
| Characteristic | Number | Measure |
| Per Capita Income | 3,662 | $24,026 |
| Median Family Income | 999 | $53,947 |
| Mean Family Income | 999 | $63,317 |
| Median Household Income | 1,509 | $50,375 |
| Mean Household Income | 1,509 | $56,896 |
| Income Deficit | 999 | $18,429 |
| Wage / Income Gap (%) | 3,662 | 12.01% |
| Wage / Income Gap ($) | 3,662 | 87.99¢ per $1 |
| Gini / Inequality Index | 3,662 | 0.43 |
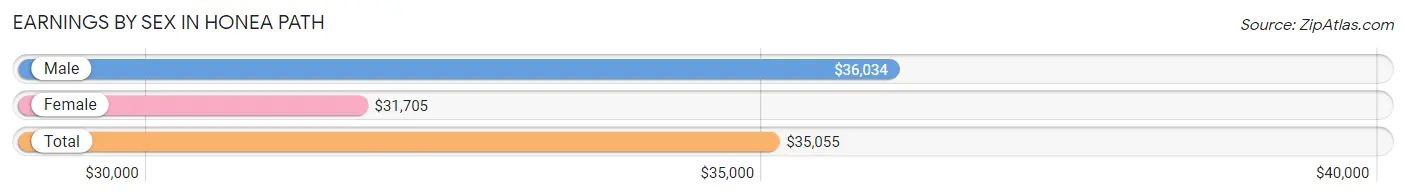
Earnings by Sex in Honea Path
Average Earnings in Honea Path are $35,055, $36,034 for men and $31,705 for women, a difference of 12.0%.
| Sex | Number | Average Earnings |
| Male | 735 (49.0%) | $36,034 |
| Female | 766 (51.0%) | $31,705 |
| Total | 1,501 (100.0%) | $35,055 |
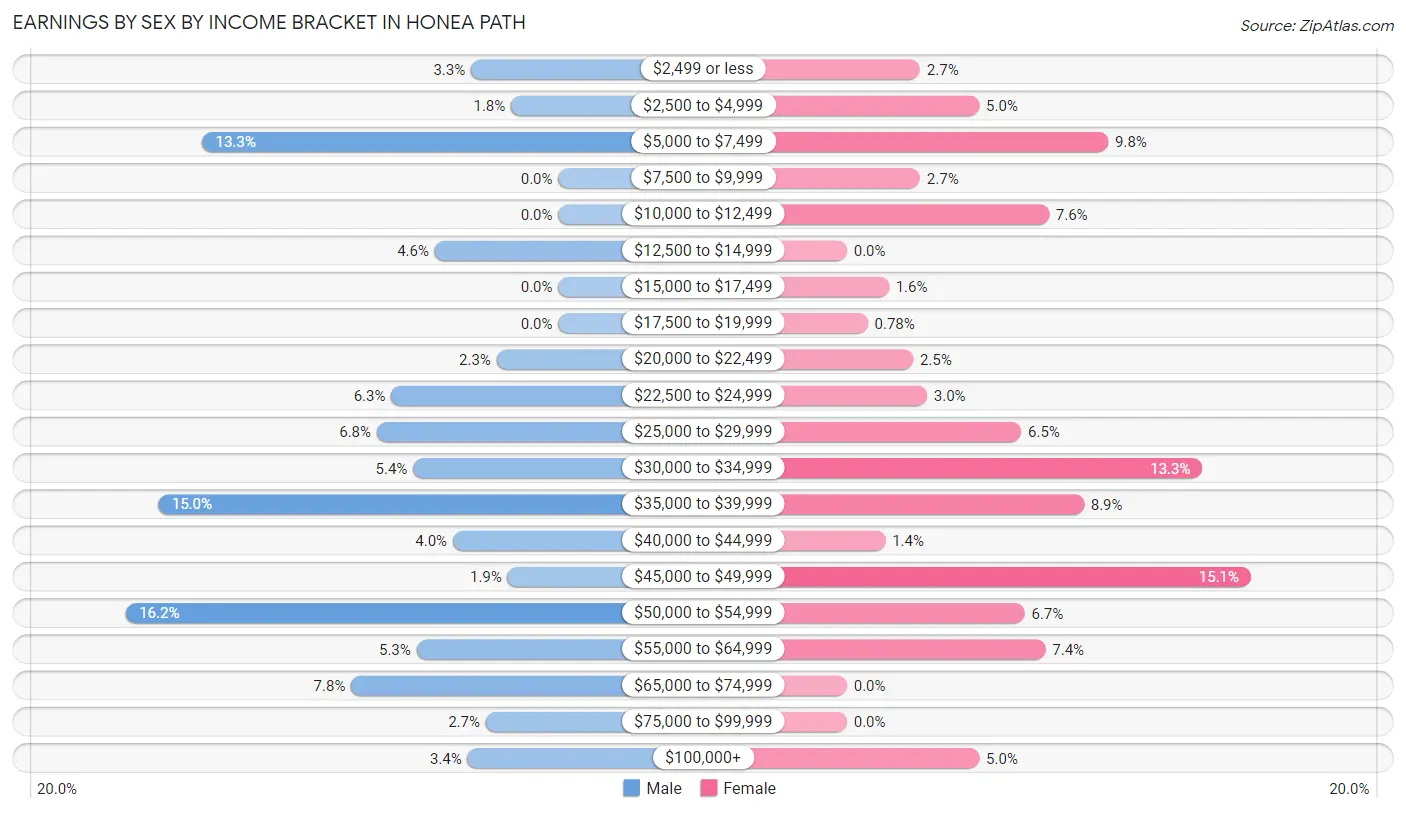
Earnings by Sex by Income Bracket in Honea Path
The most common earnings brackets in Honea Path are $50,000 to $54,999 for men (119 | 16.2%) and $45,000 to $49,999 for women (116 | 15.1%).
| Income | Male | Female |
| $2,499 or less | 24 (3.3%) | 21 (2.7%) |
| $2,500 to $4,999 | 13 (1.8%) | 38 (5.0%) |
| $5,000 to $7,499 | 98 (13.3%) | 75 (9.8%) |
| $7,500 to $9,999 | 0 (0.0%) | 21 (2.7%) |
| $10,000 to $12,499 | 0 (0.0%) | 58 (7.6%) |
| $12,500 to $14,999 | 34 (4.6%) | 0 (0.0%) |
| $15,000 to $17,499 | 0 (0.0%) | 12 (1.6%) |
| $17,500 to $19,999 | 0 (0.0%) | 6 (0.8%) |
| $20,000 to $22,499 | 17 (2.3%) | 19 (2.5%) |
| $22,500 to $24,999 | 46 (6.3%) | 23 (3.0%) |
| $25,000 to $29,999 | 50 (6.8%) | 50 (6.5%) |
| $30,000 to $34,999 | 40 (5.4%) | 102 (13.3%) |
| $35,000 to $39,999 | 110 (15.0%) | 68 (8.9%) |
| $40,000 to $44,999 | 29 (4.0%) | 11 (1.4%) |
| $45,000 to $49,999 | 14 (1.9%) | 116 (15.1%) |
| $50,000 to $54,999 | 119 (16.2%) | 51 (6.7%) |
| $55,000 to $64,999 | 39 (5.3%) | 57 (7.4%) |
| $65,000 to $74,999 | 57 (7.8%) | 0 (0.0%) |
| $75,000 to $99,999 | 20 (2.7%) | 0 (0.0%) |
| $100,000+ | 25 (3.4%) | 38 (5.0%) |
| Total | 735 (100.0%) | 766 (100.0%) |
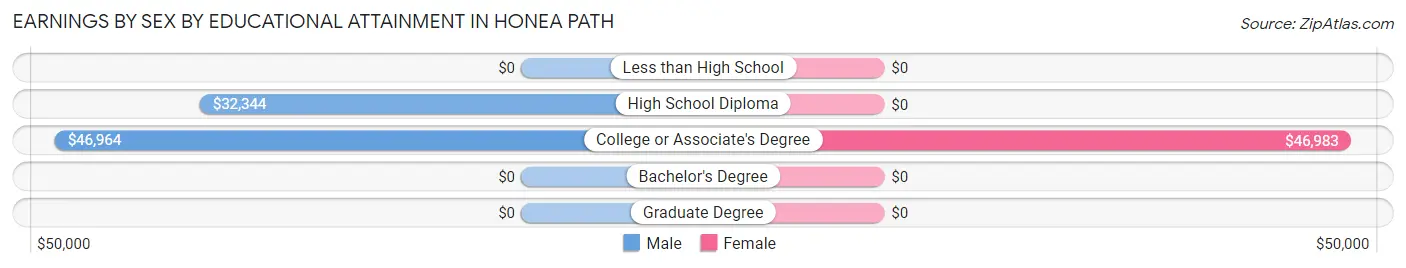
Earnings by Sex by Educational Attainment in Honea Path
Average earnings in Honea Path are $36,613 for men and $33,661 for women, a difference of 8.1%. Men with an educational attainment of college or associate's degree enjoy the highest average annual earnings of $46,964, while those with high school diploma education earn the least with $32,344. Women with an educational attainment of college or associate's degree earn the most with the average annual earnings of $46,983, while those with college or associate's degree education have the smallest earnings of $46,983.
| Educational Attainment | Male Income | Female Income |
| Less than High School | - | - |
| High School Diploma | $32,344 | $0 |
| College or Associate's Degree | $46,964 | $46,983 |
| Bachelor's Degree | - | - |
| Graduate Degree | - | - |
| Total | $36,613 | $33,661 |
Family Income in Honea Path
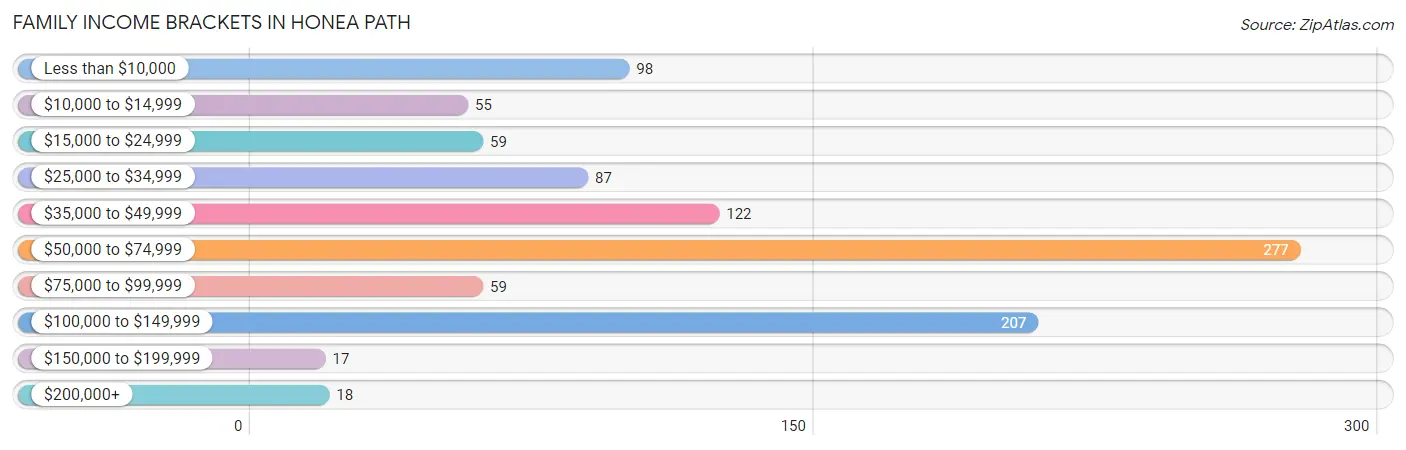
Family Income Brackets in Honea Path
According to the Honea Path family income data, there are 277 families falling into the $50,000 to $74,999 income range, which is the most common income bracket and makes up 27.7% of all families. Conversely, the $150,000 to $199,999 income bracket is the least frequent group with only 17 families (1.7%) belonging to this category.
| Income Bracket | # Families | % Families |
| Less than $10,000 | 98 | 9.8% |
| $10,000 to $14,999 | 55 | 5.5% |
| $15,000 to $24,999 | 59 | 5.9% |
| $25,000 to $34,999 | 87 | 8.7% |
| $35,000 to $49,999 | 122 | 12.2% |
| $50,000 to $74,999 | 277 | 27.7% |
| $75,000 to $99,999 | 59 | 5.9% |
| $100,000 to $149,999 | 207 | 20.7% |
| $150,000 to $199,999 | 17 | 1.7% |
| $200,000+ | 18 | 1.8% |
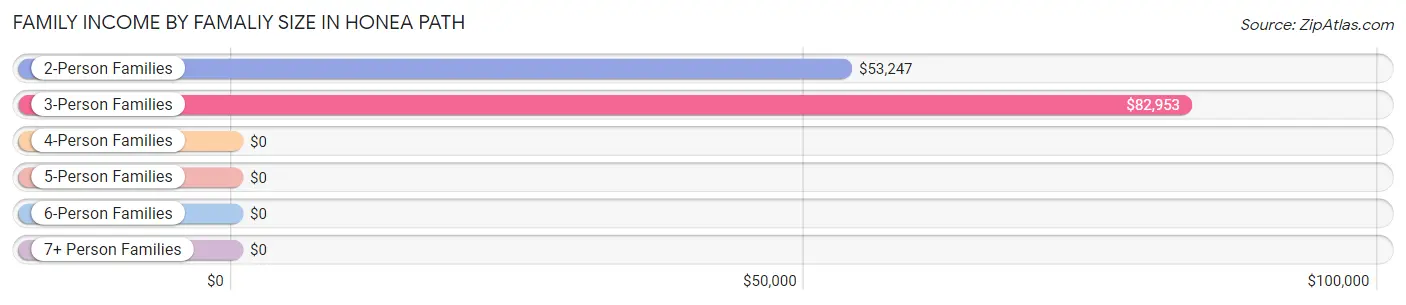
Family Income by Famaliy Size in Honea Path
3-person families (261 | 26.1%) account for the highest median family income in Honea Path with $82,953 per family, while 3-person families (261 | 26.1%) have the highest median income of $27,651 per family member.
| Income Bracket | # Families | Median Income |
| 2-Person Families | 480 (48.0%) | $53,247 |
| 3-Person Families | 261 (26.1%) | $82,953 |
| 4-Person Families | 160 (16.0%) | $0 |
| 5-Person Families | 77 (7.7%) | $0 |
| 6-Person Families | 0 (0.0%) | $0 |
| 7+ Person Families | 21 (2.1%) | $0 |
| Total | 999 (100.0%) | $53,947 |
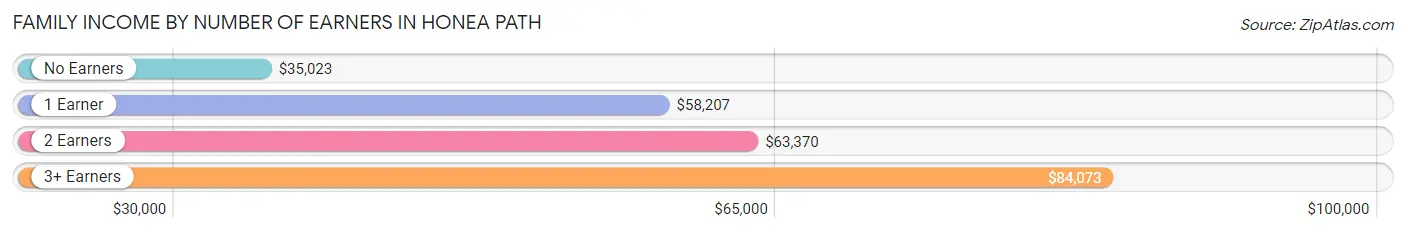
Family Income by Number of Earners in Honea Path
The median family income in Honea Path is $53,947, with families comprising 3+ earners (73) having the highest median family income of $84,073, while families with no earners (383) have the lowest median family income of $35,023, accounting for 7.3% and 38.3% of families, respectively.
| Number of Earners | # Families | Median Income |
| No Earners | 383 (38.3%) | $35,023 |
| 1 Earner | 151 (15.1%) | $58,207 |
| 2 Earners | 392 (39.2%) | $63,370 |
| 3+ Earners | 73 (7.3%) | $84,073 |
| Total | 999 (100.0%) | $53,947 |
Household Income in Honea Path
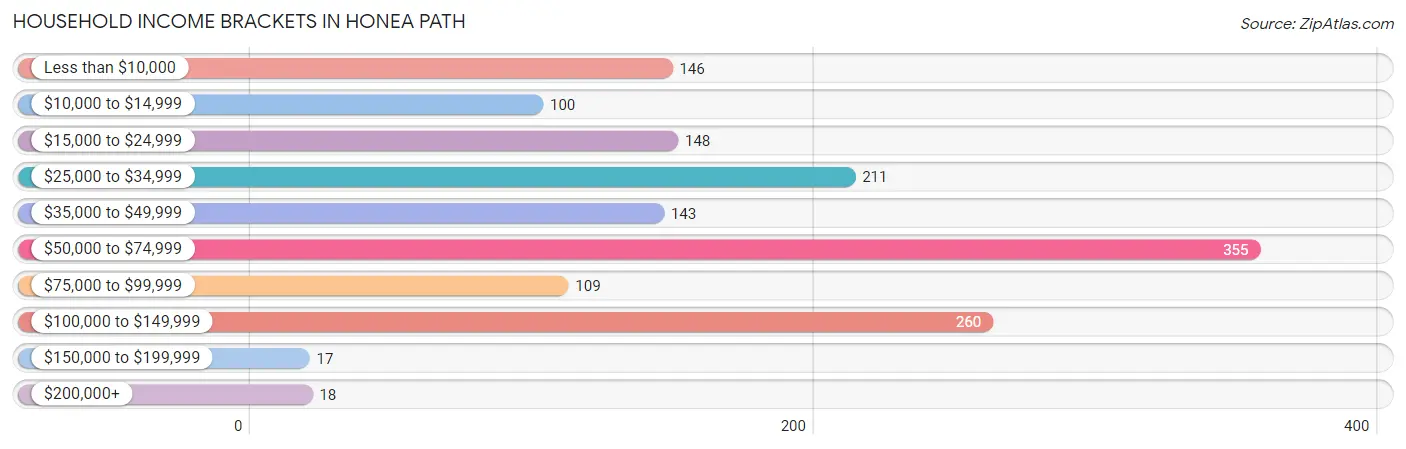
Household Income Brackets in Honea Path
With 355 households falling in the category, the $50,000 to $74,999 income range is the most frequent in Honea Path, accounting for 23.5% of all households. In contrast, only 17 households (1.1%) fall into the $150,000 to $199,999 income bracket, making it the least populous group.
| Income Bracket | # Households | % Households |
| Less than $10,000 | 146 | 9.7% |
| $10,000 to $14,999 | 100 | 6.6% |
| $15,000 to $24,999 | 148 | 9.8% |
| $25,000 to $34,999 | 211 | 14.0% |
| $35,000 to $49,999 | 143 | 9.5% |
| $50,000 to $74,999 | 355 | 23.5% |
| $75,000 to $99,999 | 109 | 7.2% |
| $100,000 to $149,999 | 260 | 17.2% |
| $150,000 to $199,999 | 17 | 1.1% |
| $200,000+ | 18 | 1.2% |
Household Income by Householder Age in Honea Path
The median household income in Honea Path is $50,375, with the highest median household income of $54,611 found in the 45 to 64 years age bracket for the primary householder. A total of 597 households (39.6%) fall into this category. Meanwhile, the 15 to 24 years age bracket for the primary householder has the lowest median household income of $0, with 13 households (0.9%) in this group.
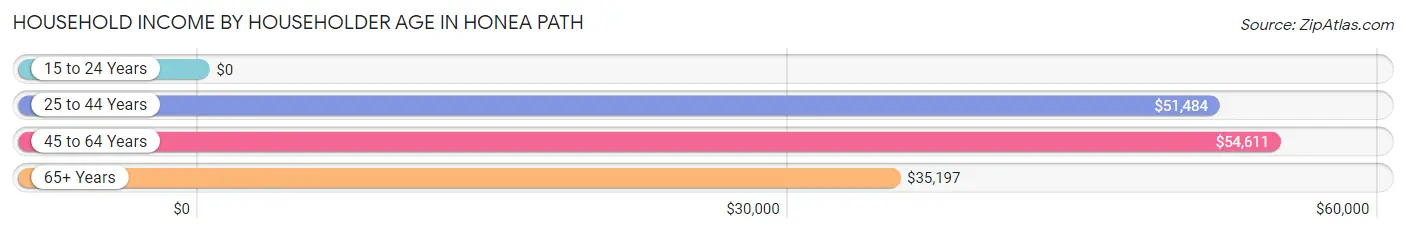
| Income Bracket | # Households | Median Income |
| 15 to 24 Years | 13 (0.9%) | $0 |
| 25 to 44 Years | 437 (29.0%) | $51,484 |
| 45 to 64 Years | 597 (39.6%) | $54,611 |
| 65+ Years | 462 (30.6%) | $35,197 |
| Total | 1,509 (100.0%) | $50,375 |
Poverty in Honea Path
Income Below Poverty by Sex and Age in Honea Path
With 25.7% poverty level for males and 20.1% for females among the residents of Honea Path, 16 and 17 year old males and 12 to 14 year old females are the most vulnerable to poverty, with 12 males (50.0%) and 37 females (48.0%) in their respective age groups living below the poverty level.
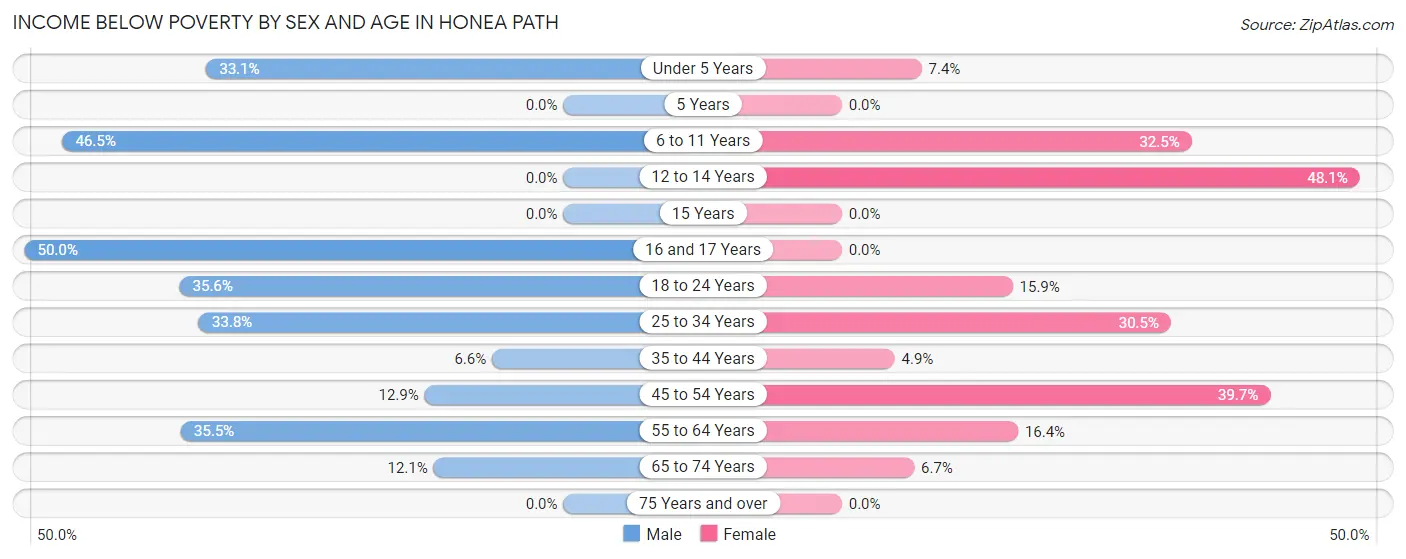
| Age Bracket | Male | Female |
| Under 5 Years | 54 (33.1%) | 6 (7.4%) |
| 5 Years | 0 (0.0%) | 0 (0.0%) |
| 6 to 11 Years | 132 (46.5%) | 61 (32.5%) |
| 12 to 14 Years | 0 (0.0%) | 37 (48.0%) |
| 15 Years | 0 (0.0%) | 0 (0.0%) |
| 16 and 17 Years | 12 (50.0%) | 0 (0.0%) |
| 18 to 24 Years | 47 (35.6%) | 13 (15.9%) |
| 25 to 34 Years | 69 (33.8%) | 58 (30.5%) |
| 35 to 44 Years | 9 (6.6%) | 10 (4.9%) |
| 45 to 54 Years | 38 (12.9%) | 91 (39.7%) |
| 55 to 64 Years | 104 (35.5%) | 60 (16.4%) |
| 65 to 74 Years | 27 (12.0%) | 11 (6.7%) |
| 75 Years and over | 0 (0.0%) | 0 (0.0%) |
| Total | 492 (25.7%) | 347 (20.1%) |
Income Above Poverty by Sex and Age in Honea Path
According to the poverty statistics in Honea Path, males aged 12 to 14 years and females aged 16 and 17 years are the age groups that are most secure financially, with 100.0% of males and 100.0% of females in these age groups living above the poverty line.
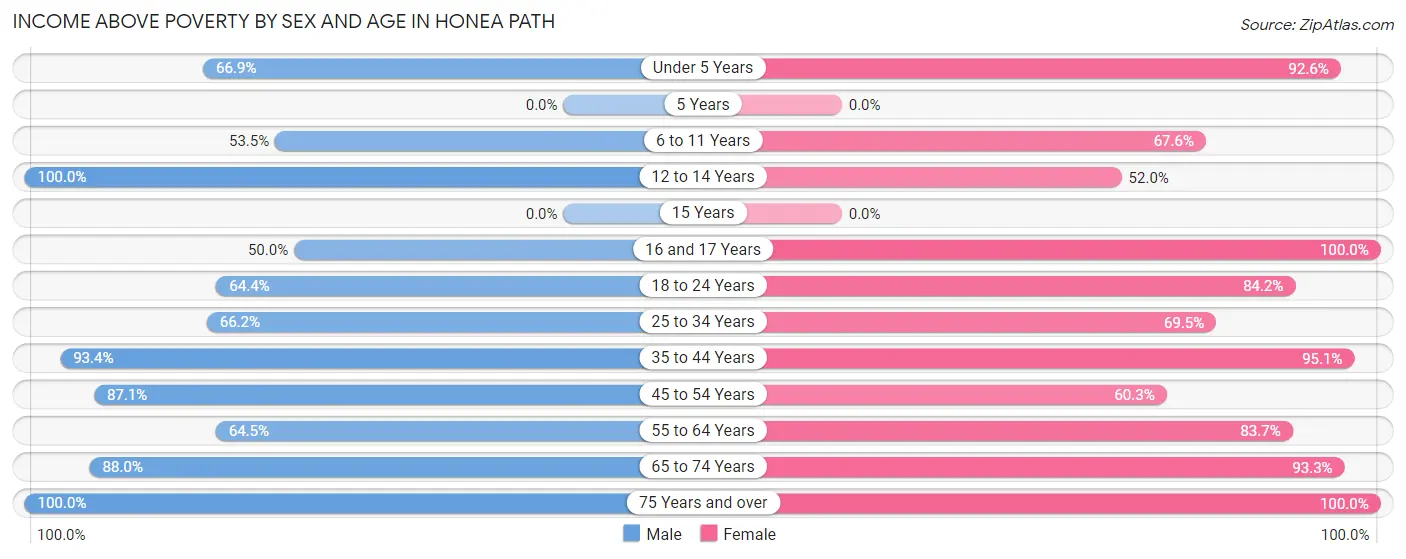
| Age Bracket | Male | Female |
| Under 5 Years | 109 (66.9%) | 75 (92.6%) |
| 5 Years | 0 (0.0%) | 0 (0.0%) |
| 6 to 11 Years | 152 (53.5%) | 127 (67.5%) |
| 12 to 14 Years | 22 (100.0%) | 40 (51.9%) |
| 15 Years | 0 (0.0%) | 0 (0.0%) |
| 16 and 17 Years | 12 (50.0%) | 20 (100.0%) |
| 18 to 24 Years | 85 (64.4%) | 69 (84.2%) |
| 25 to 34 Years | 135 (66.2%) | 132 (69.5%) |
| 35 to 44 Years | 127 (93.4%) | 194 (95.1%) |
| 45 to 54 Years | 257 (87.1%) | 138 (60.3%) |
| 55 to 64 Years | 189 (64.5%) | 307 (83.7%) |
| 65 to 74 Years | 197 (87.9%) | 153 (93.3%) |
| 75 Years and over | 137 (100.0%) | 123 (100.0%) |
| Total | 1,422 (74.3%) | 1,378 (79.9%) |
Income Below Poverty Among Married-Couple Families in Honea Path
The poverty statistics for married-couple families in Honea Path show that 18.6% or 124 of the total 666 families live below the poverty line. Families with 1 or 2 children have the highest poverty rate of 22.5%, comprising of 55 families. On the other hand, families with 3 or 4 children have the lowest poverty rate of 0.0%, which includes 0 families.
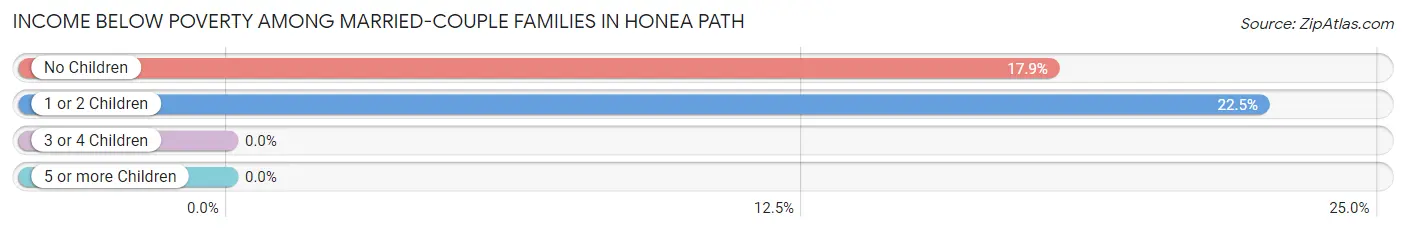
| Children | Above Poverty | Below Poverty |
| No Children | 317 (82.1%) | 69 (17.9%) |
| 1 or 2 Children | 190 (77.5%) | 55 (22.5%) |
| 3 or 4 Children | 14 (100.0%) | 0 (0.0%) |
| 5 or more Children | 21 (100.0%) | 0 (0.0%) |
| Total | 542 (81.4%) | 124 (18.6%) |
Income Below Poverty Among Single-Parent Households in Honea Path
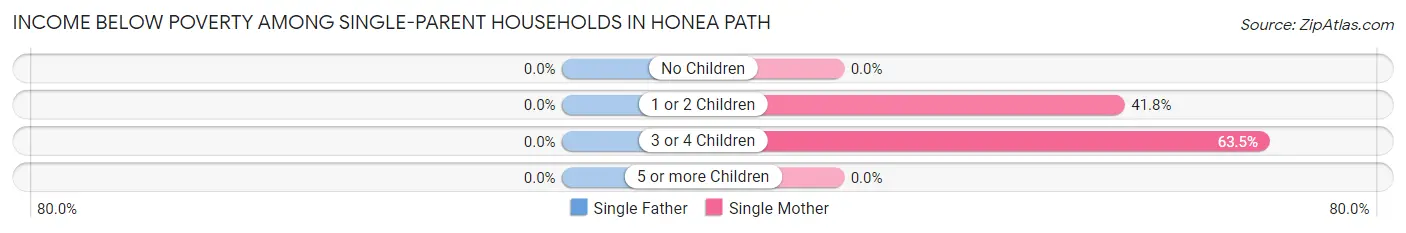
| Children | Single Father | Single Mother |
| No Children | 0 (0.0%) | 0 (0.0%) |
| 1 or 2 Children | 0 (0.0%) | 23 (41.8%) |
| 3 or 4 Children | 0 (0.0%) | 40 (63.5%) |
| 5 or more Children | 0 (0.0%) | 0 (0.0%) |
| Total | 0 (0.0%) | 63 (22.3%) |
Income Below Poverty Among Married-Couple vs Single-Parent Households in Honea Path
The poverty data for Honea Path shows that 124 of the married-couple family households (18.6%) and 63 of the single-parent households (18.9%) are living below the poverty level. Within the married-couple family households, those with 1 or 2 children have the highest poverty rate, with 55 households (22.5%) falling below the poverty line. Among the single-parent households, those with 3 or 4 children have the highest poverty rate, with 40 household (63.5%) living below poverty.
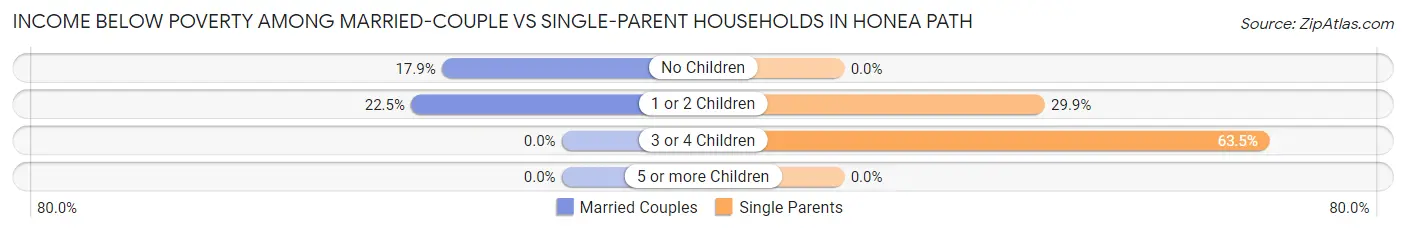
| Children | Married-Couple Families | Single-Parent Households |
| No Children | 69 (17.9%) | 0 (0.0%) |
| 1 or 2 Children | 55 (22.5%) | 23 (29.9%) |
| 3 or 4 Children | 0 (0.0%) | 40 (63.5%) |
| 5 or more Children | 0 (0.0%) | 0 (0.0%) |
| Total | 124 (18.6%) | 63 (18.9%) |
Race in Honea Path
The most populous races in Honea Path are White / Caucasian (3,053 | 83.4%), Black / African American (450 | 12.3%), and Two or more Races (159 | 4.3%).
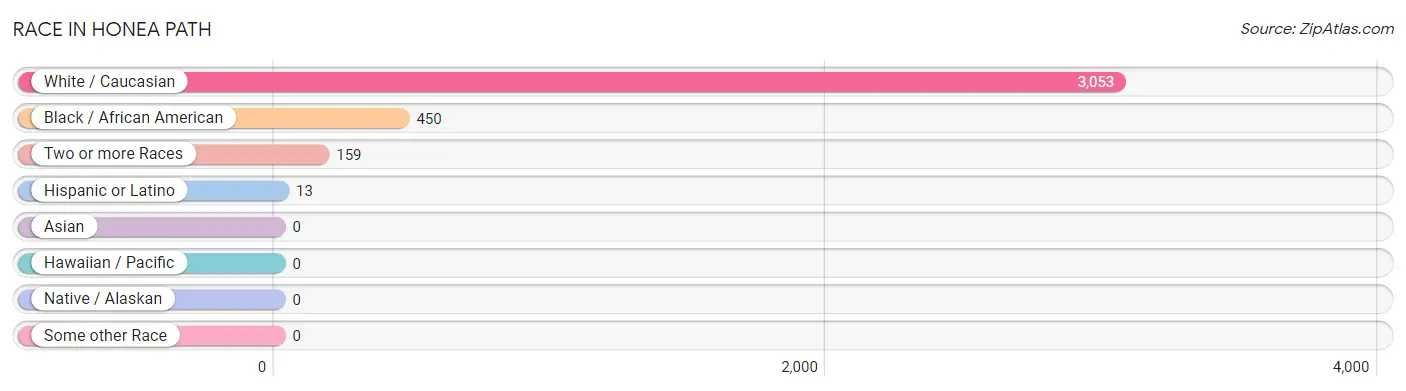
| Race | # Population | % Population |
| Asian | 0 | 0.0% |
| Black / African American | 450 | 12.3% |
| Hawaiian / Pacific | 0 | 0.0% |
| Hispanic or Latino | 13 | 0.4% |
| Native / Alaskan | 0 | 0.0% |
| White / Caucasian | 3,053 | 83.4% |
| Two or more Races | 159 | 4.3% |
| Some other Race | 0 | 0.0% |
| Total | 3,662 | 100.0% |
Ancestry in Honea Path
The most populous ancestries reported in Honea Path are American (881 | 24.1%), Scottish (325 | 8.9%), English (270 | 7.4%), Irish (179 | 4.9%), and French (69 | 1.9%), together accounting for 47.1% of all Honea Path residents.
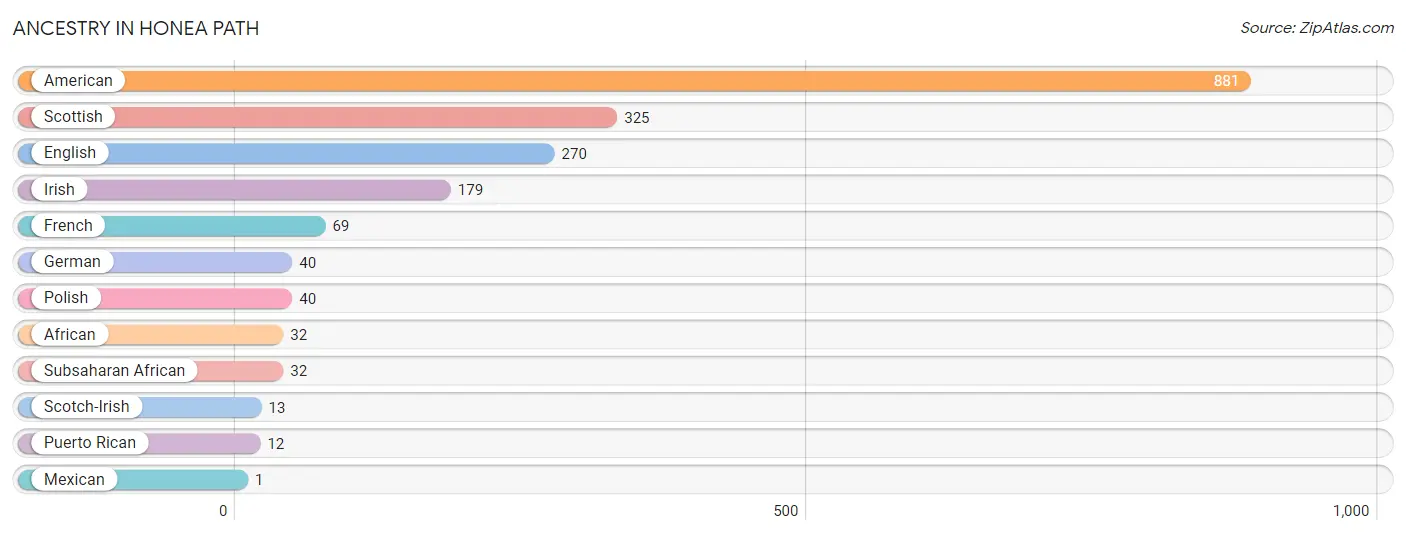
| Ancestry | # Population | % Population |
| African | 32 | 0.9% |
| American | 881 | 24.1% |
| English | 270 | 7.4% |
| French | 69 | 1.9% |
| German | 40 | 1.1% |
| Irish | 179 | 4.9% |
| Mexican | 1 | 0.0% |
| Polish | 40 | 1.1% |
| Puerto Rican | 12 | 0.3% |
| Scotch-Irish | 13 | 0.4% |
| Scottish | 325 | 8.9% |
| Subsaharan African | 32 | 0.9% | View All 12 Rows |
Immigrants in Honea Path

| Immigration Origin | # Population | % Population | View All 0 Rows |
Sex and Age in Honea Path
Sex and Age in Honea Path
The most populous age groups in Honea Path are 50 to 54 Years (279 | 14.5%) for men and 55 to 59 Years (270 | 15.5%) for women.
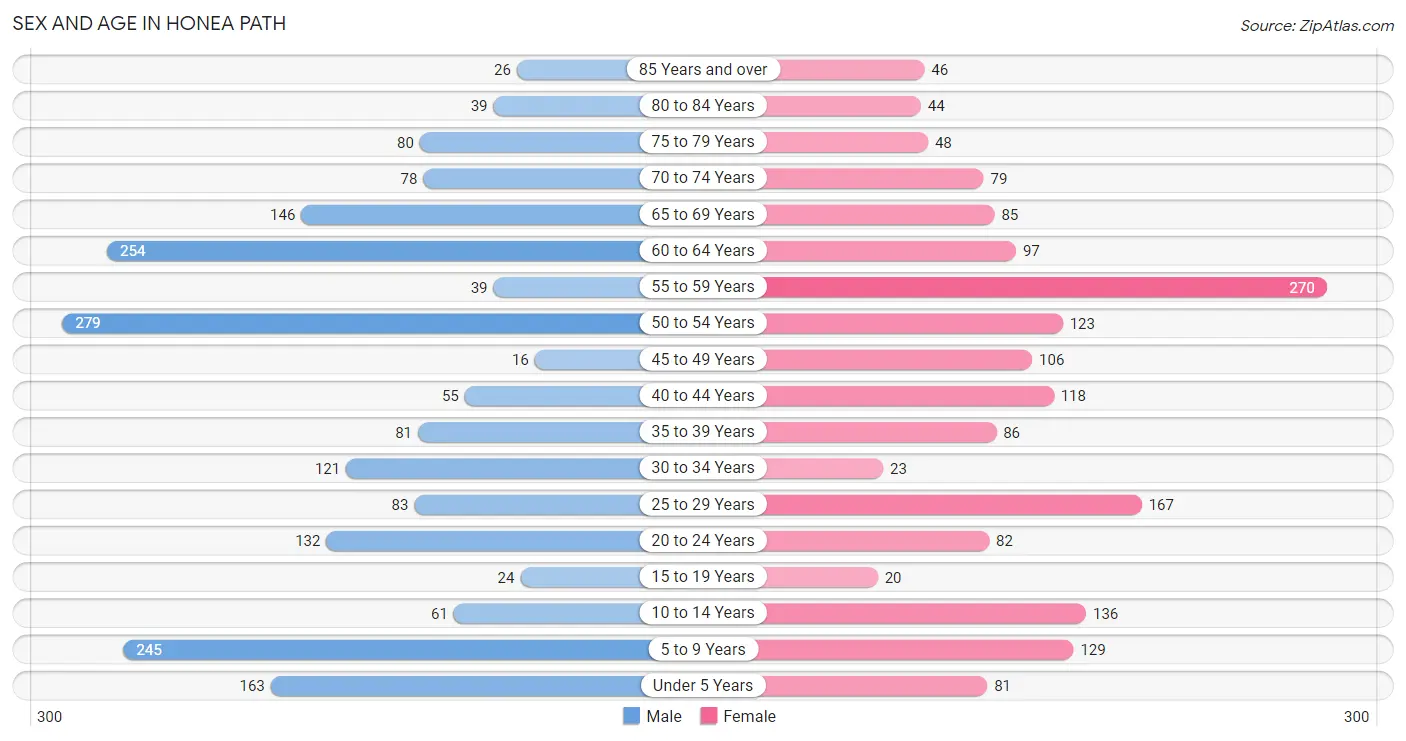
| Age Bracket | Male | Female |
| Under 5 Years | 163 (8.5%) | 81 (4.7%) |
| 5 to 9 Years | 245 (12.8%) | 129 (7.4%) |
| 10 to 14 Years | 61 (3.2%) | 136 (7.8%) |
| 15 to 19 Years | 24 (1.3%) | 20 (1.1%) |
| 20 to 24 Years | 132 (6.9%) | 82 (4.7%) |
| 25 to 29 Years | 83 (4.3%) | 167 (9.6%) |
| 30 to 34 Years | 121 (6.3%) | 23 (1.3%) |
| 35 to 39 Years | 81 (4.2%) | 86 (4.9%) |
| 40 to 44 Years | 55 (2.9%) | 118 (6.8%) |
| 45 to 49 Years | 16 (0.8%) | 106 (6.1%) |
| 50 to 54 Years | 279 (14.5%) | 123 (7.1%) |
| 55 to 59 Years | 39 (2.0%) | 270 (15.5%) |
| 60 to 64 Years | 254 (13.2%) | 97 (5.6%) |
| 65 to 69 Years | 146 (7.6%) | 85 (4.9%) |
| 70 to 74 Years | 78 (4.1%) | 79 (4.5%) |
| 75 to 79 Years | 80 (4.2%) | 48 (2.8%) |
| 80 to 84 Years | 39 (2.0%) | 44 (2.5%) |
| 85 Years and over | 26 (1.3%) | 46 (2.6%) |
| Total | 1,922 (100.0%) | 1,740 (100.0%) |
Families and Households in Honea Path
Median Family Size in Honea Path
The median family size in Honea Path is 3.06 persons per family, with single female/mother families (283 | 28.3%) accounting for the largest median family size of 3.27 persons per family. On the other hand, single male/father families (50 | 5.0%) represent the smallest median family size with 2.36 persons per family.
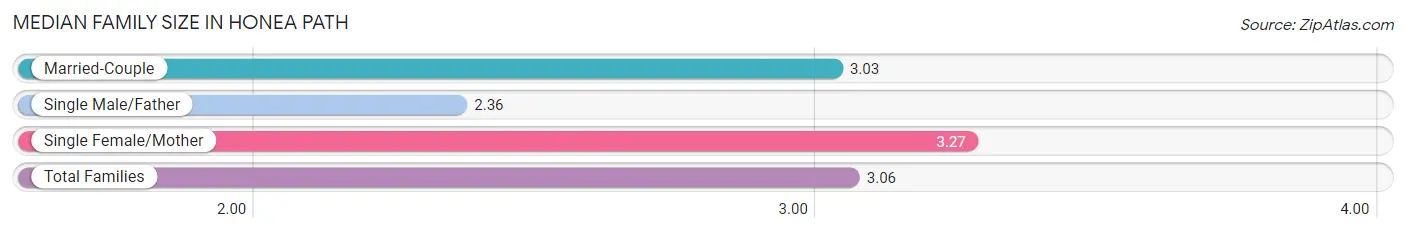
| Family Type | # Families | Family Size |
| Married-Couple | 666 (66.7%) | 3.03 |
| Single Male/Father | 50 (5.0%) | 2.36 |
| Single Female/Mother | 283 (28.3%) | 3.27 |
| Total Families | 999 (100.0%) | 3.06 |
Median Household Size in Honea Path
The median household size in Honea Path is 2.41 persons per household, with single female/mother households (283 | 18.8%) accounting for the largest median household size of 3.32 persons per household. non-family households (510 | 33.8%) represent the smallest median household size with 1.11 persons per household.
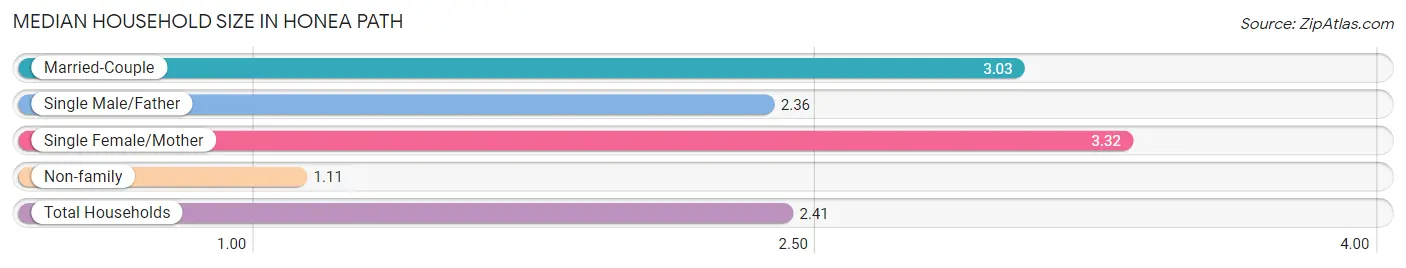
| Household Type | # Households | Household Size |
| Married-Couple | 666 (44.1%) | 3.03 |
| Single Male/Father | 50 (3.3%) | 2.36 |
| Single Female/Mother | 283 (18.8%) | 3.32 |
| Non-family | 510 (33.8%) | 1.11 |
| Total Households | 1,509 (100.0%) | 2.41 |
Household Size by Marriage Status in Honea Path
Out of a total of 1,509 households in Honea Path, 999 (66.2%) are family households, while 510 (33.8%) are nonfamily households. The most numerous type of family households are 2-person households, comprising 457, and the most common type of nonfamily households are 1-person households, comprising 463.
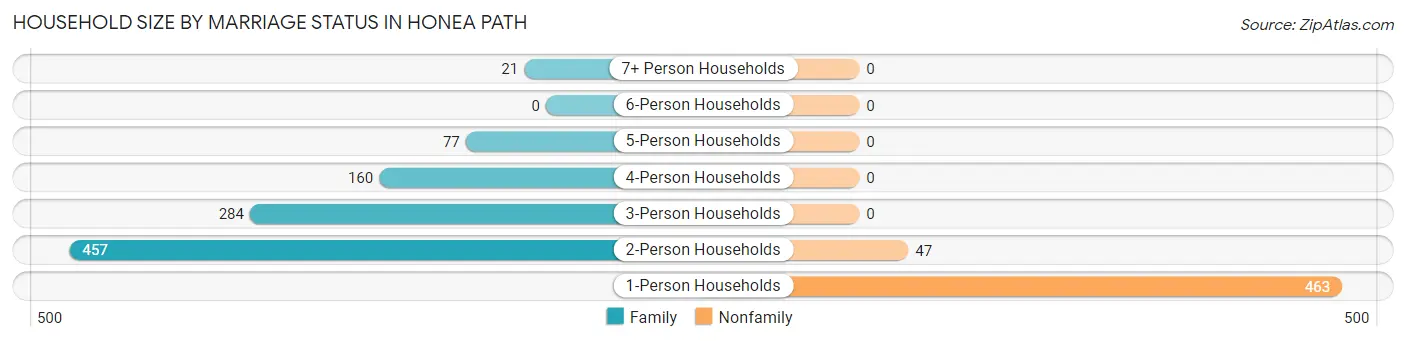
| Household Size | Family Households | Nonfamily Households |
| 1-Person Households | - | 463 (30.7%) |
| 2-Person Households | 457 (30.3%) | 47 (3.1%) |
| 3-Person Households | 284 (18.8%) | 0 (0.0%) |
| 4-Person Households | 160 (10.6%) | 0 (0.0%) |
| 5-Person Households | 77 (5.1%) | 0 (0.0%) |
| 6-Person Households | 0 (0.0%) | 0 (0.0%) |
| 7+ Person Households | 21 (1.4%) | 0 (0.0%) |
| Total | 999 (66.2%) | 510 (33.8%) |
Female Fertility in Honea Path
Fertility by Age in Honea Path
Average fertility rate in Honea Path is 150.0 births per 1,000 women. Women in the age bracket of 20 to 34 years have the highest fertility rate with 254.0 births per 1,000 women. Women in the age bracket of 20 to 34 years acount for 76.7% of all women with births.
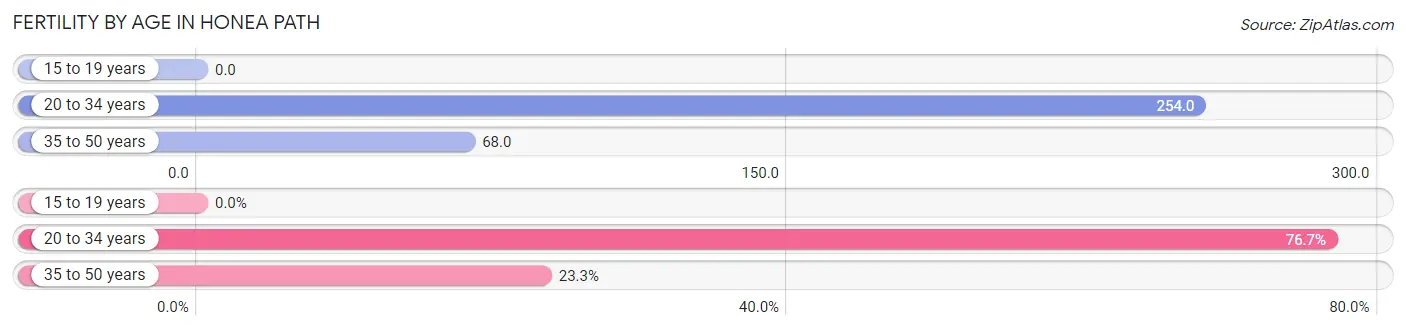
| Age Bracket | Women with Births | Births / 1,000 Women |
| 15 to 19 years | 0 (0.0%) | 0.0 |
| 20 to 34 years | 69 (76.7%) | 254.0 |
| 35 to 50 years | 21 (23.3%) | 68.0 |
| Total | 90 (100.0%) | 150.0 |
Fertility by Age by Marriage Status in Honea Path
23.3% of women with births (90) in Honea Path are married. The highest percentage of unmarried women with births falls into 20 to 34 years age bracket with 100.0% of them unmarried at the time of birth, while the lowest percentage of unmarried women with births belong to 35 to 50 years age bracket with 0.0% of them unmarried.
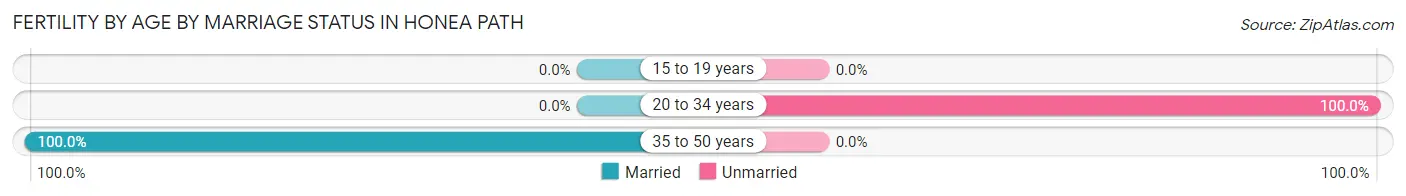
| Age Bracket | Married | Unmarried |
| 15 to 19 years | 0 (0.0%) | 0 (0.0%) |
| 20 to 34 years | 0 (0.0%) | 69 (100.0%) |
| 35 to 50 years | 21 (100.0%) | 0 (0.0%) |
| Total | 21 (23.3%) | 69 (76.7%) |
Fertility by Education in Honea Path
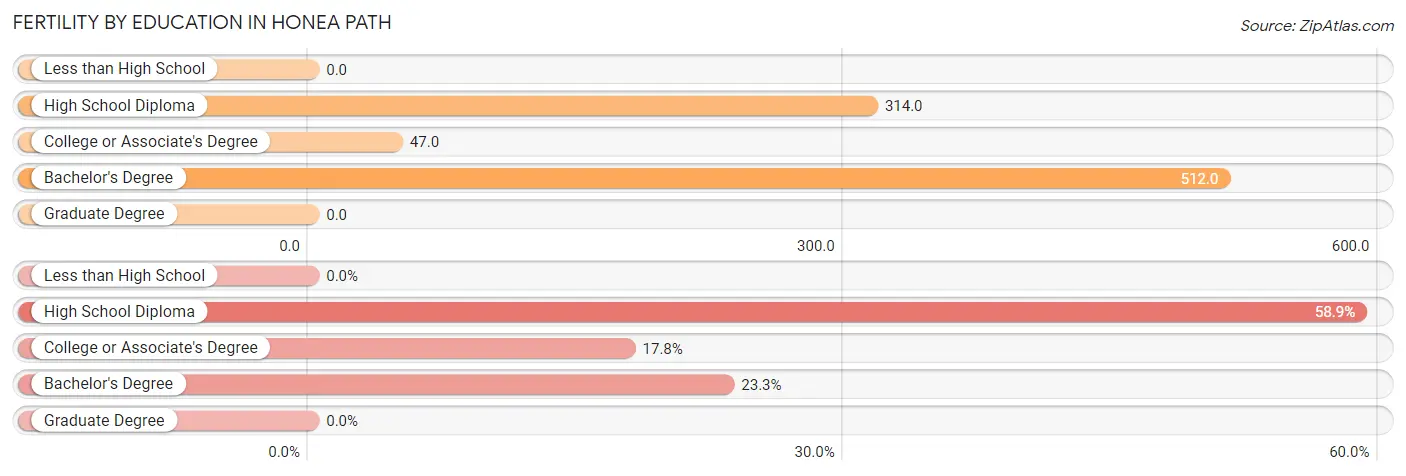
| Educational Attainment | Women with Births | Births / 1,000 Women |
| Less than High School | 0 (0.0%) | 0.0 |
| High School Diploma | 53 (58.9%) | 314.0 |
| College or Associate's Degree | 16 (17.8%) | 47.0 |
| Bachelor's Degree | 21 (23.3%) | 512.0 |
| Graduate Degree | 0 (0.0%) | 0.0 |
| Total | 90 (100.0%) | 150.0 |
Fertility by Education by Marriage Status in Honea Path
76.7% of women with births in Honea Path are unmarried. Women with the educational attainment of bachelor's degree are most likely to be married with 100.0% of them married at childbirth, while women with the educational attainment of high school diploma are least likely to be married with 100.0% of them unmarried at childbirth.
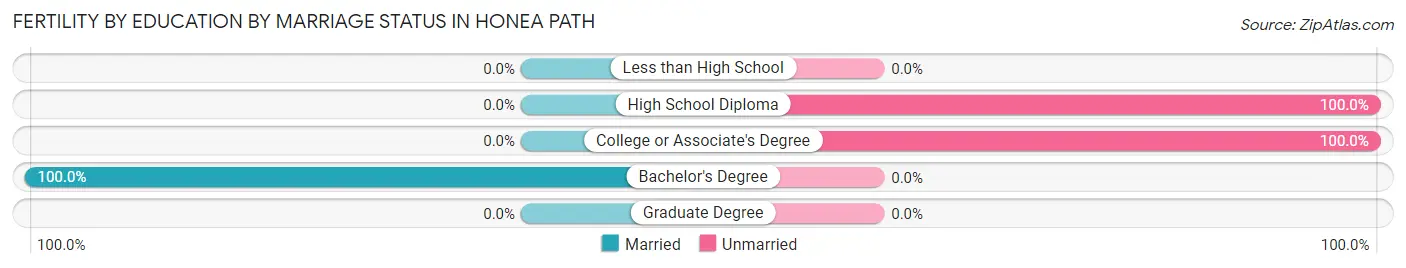
| Educational Attainment | Married | Unmarried |
| Less than High School | 0 (0.0%) | 0 (0.0%) |
| High School Diploma | 0 (0.0%) | 53 (100.0%) |
| College or Associate's Degree | 0 (0.0%) | 16 (100.0%) |
| Bachelor's Degree | 21 (100.0%) | 0 (0.0%) |
| Graduate Degree | 0 (0.0%) | 0 (0.0%) |
| Total | 21 (23.3%) | 69 (76.7%) |
Employment Characteristics in Honea Path
Employment by Class of Employer in Honea Path
Among the 1,139 employed individuals in Honea Path, private company employees (738 | 64.8%), local government employees (189 | 16.6%), and state government employees (130 | 11.4%) make up the most common classes of employment.
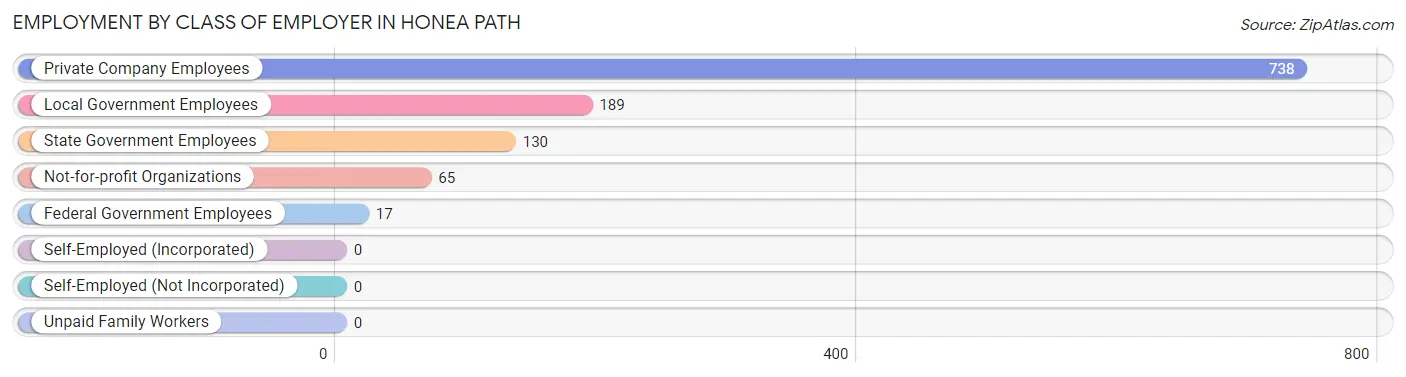
| Employer Class | # Employees | % Employees |
| Private Company Employees | 738 | 64.8% |
| Self-Employed (Incorporated) | 0 | 0.0% |
| Self-Employed (Not Incorporated) | 0 | 0.0% |
| Not-for-profit Organizations | 65 | 5.7% |
| Local Government Employees | 189 | 16.6% |
| State Government Employees | 130 | 11.4% |
| Federal Government Employees | 17 | 1.5% |
| Unpaid Family Workers | 0 | 0.0% |
| Total | 1,139 | 100.0% |
Employment Status by Age in Honea Path
According to the labor force statistics for Honea Path, out of the total population over 16 years of age (2,847), 48.1% or 1,369 individuals are in the labor force, with 7.3% or 100 of them unemployed. The age group with the highest labor force participation rate is 30 to 34 years, with 86.8% or 125 individuals in the labor force. Within the labor force, the 30 to 34 years age range has the highest percentage of unemployed individuals, with 49.6% or 62 of them being unemployed.
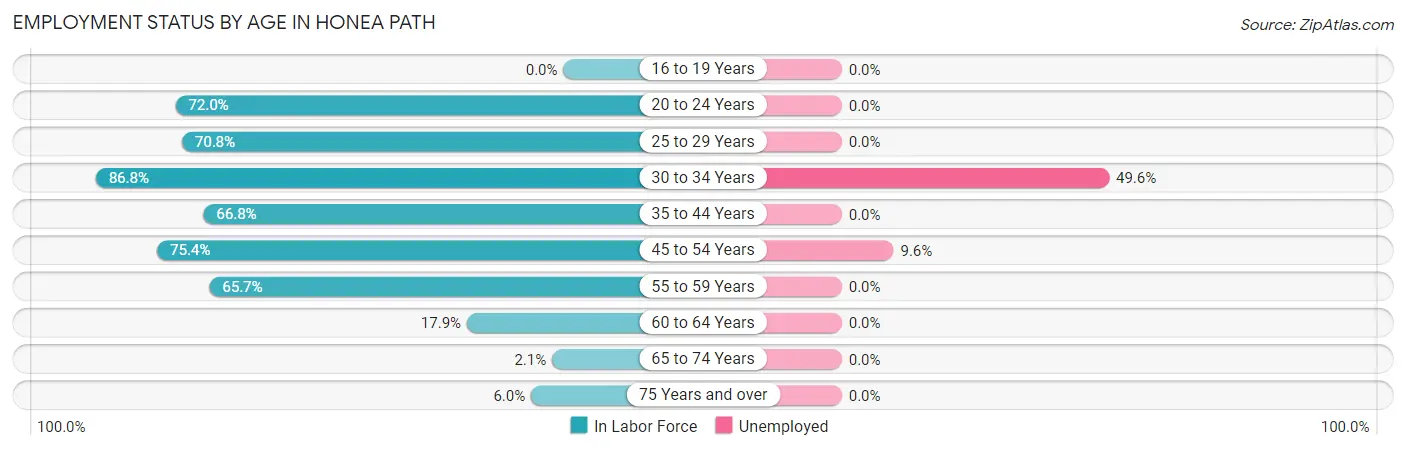
| Age Bracket | In Labor Force | Unemployed |
| 16 to 19 Years | 0 (0.0%) | 0 (0.0%) |
| 20 to 24 Years | 154 (72.0%) | 0 (0.0%) |
| 25 to 29 Years | 177 (70.8%) | 0 (0.0%) |
| 30 to 34 Years | 125 (86.8%) | 62 (49.6%) |
| 35 to 44 Years | 227 (66.8%) | 0 (0.0%) |
| 45 to 54 Years | 395 (75.4%) | 38 (9.6%) |
| 55 to 59 Years | 203 (65.7%) | 0 (0.0%) |
| 60 to 64 Years | 63 (17.9%) | 0 (0.0%) |
| 65 to 74 Years | 8 (2.1%) | 0 (0.0%) |
| 75 Years and over | 17 (6.0%) | 0 (0.0%) |
| Total | 1,369 (48.1%) | 100 (7.3%) |
Employment Status by Educational Attainment in Honea Path
According to labor force statistics for Honea Path, 62.0% of individuals (1,189) out of the total population between 25 and 64 years of age (1,918) are in the labor force, with 8.4% or 100 of them being unemployed. The group with the highest labor force participation rate are those with the educational attainment of bachelor's degree or higher, with 84.9% or 292 individuals in the labor force. Within the labor force, individuals with high school diploma education have the highest percentage of unemployment, with 21.5% or 100 of them being unemployed.
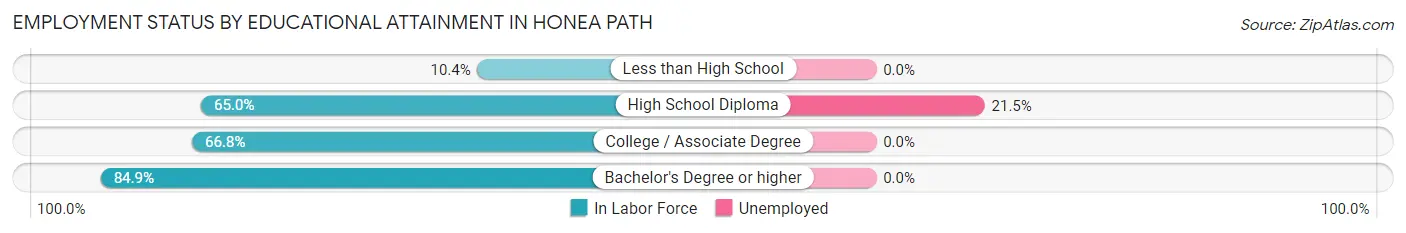
| Educational Attainment | In Labor Force | Unemployed |
| Less than High School | 26 (10.4%) | 0 (0.0%) |
| High School Diploma | 466 (65.0%) | 154 (21.5%) |
| College / Associate Degree | 406 (66.8%) | 0 (0.0%) |
| Bachelor's Degree or higher | 292 (84.9%) | 0 (0.0%) |
| Total | 1,189 (62.0%) | 161 (8.4%) |
Employment Occupations by Sex in Honea Path
Management, Business, Science and Arts Occupations
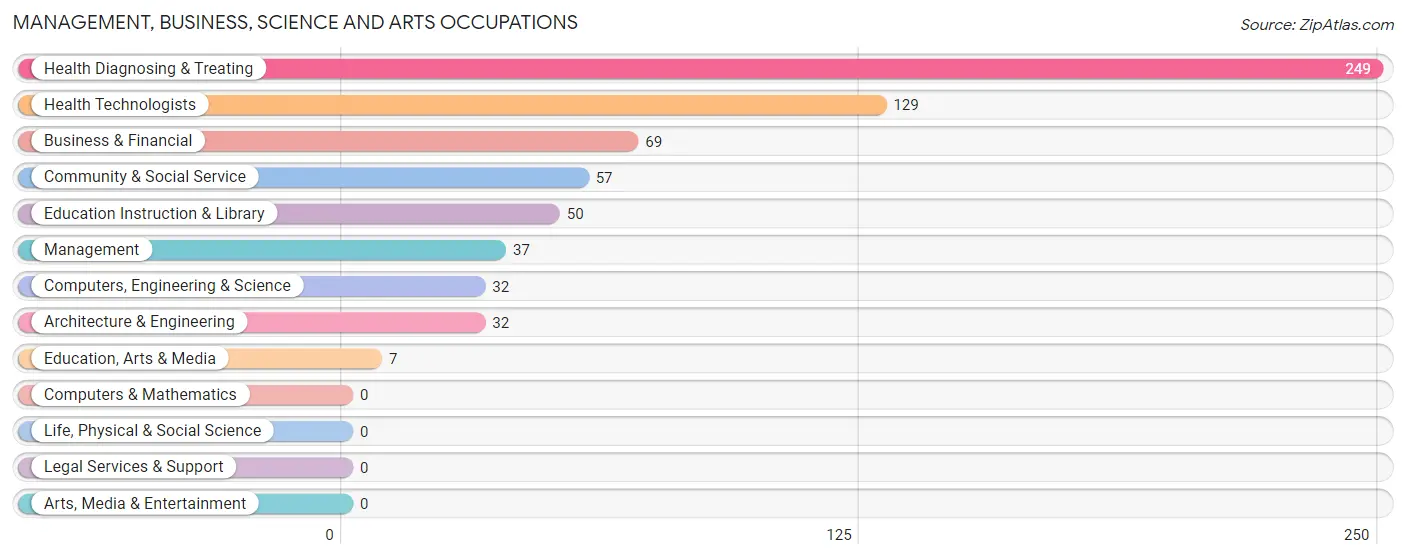
The most common Management, Business, Science and Arts occupations in Honea Path are Health Diagnosing & Treating (249 | 19.6%), Health Technologists (129 | 10.2%), Business & Financial (69 | 5.4%), Community & Social Service (57 | 4.5%), and Education Instruction & Library (50 | 3.9%).
Management, Business, Science and Arts Occupations by Sex
Within the Management, Business, Science and Arts occupations in Honea Path, the most male-oriented occupations are Computers, Engineering & Science (100.0%), Architecture & Engineering (100.0%), and Education, Arts & Media (100.0%), while the most female-oriented occupations are Business & Financial (100.0%), Health Technologists (100.0%), and Health Diagnosing & Treating (94.8%).
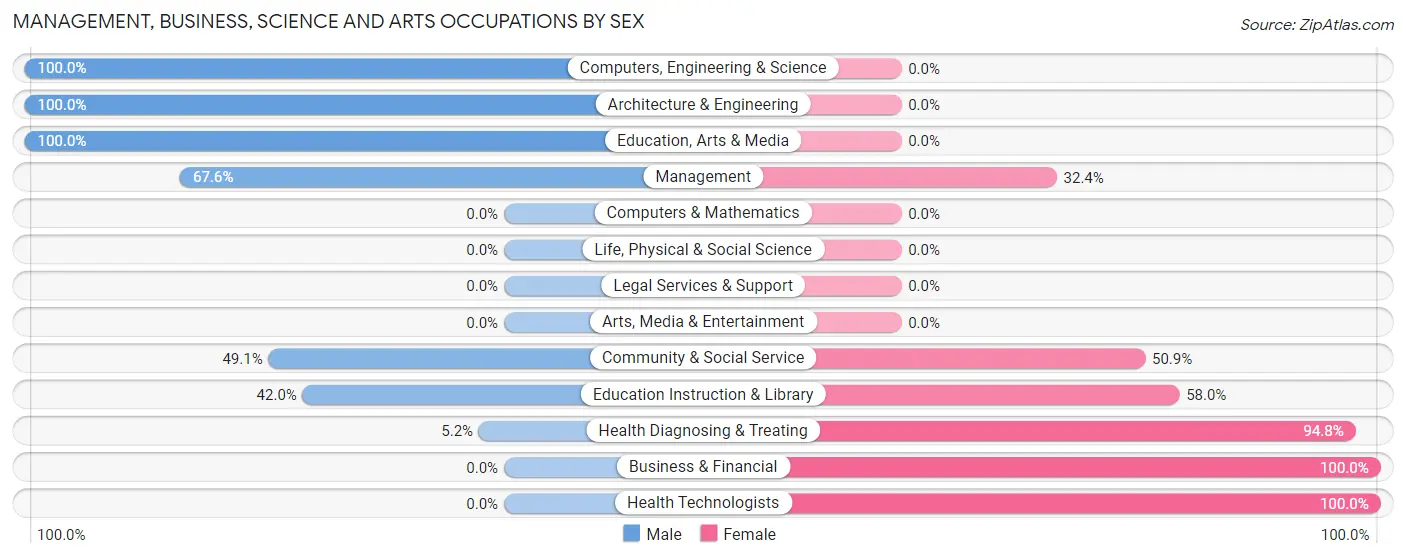
| Occupation | Male | Female |
| Management | 25 (67.6%) | 12 (32.4%) |
| Business & Financial | 0 (0.0%) | 69 (100.0%) |
| Computers, Engineering & Science | 32 (100.0%) | 0 (0.0%) |
| Computers & Mathematics | 0 (0.0%) | 0 (0.0%) |
| Architecture & Engineering | 32 (100.0%) | 0 (0.0%) |
| Life, Physical & Social Science | 0 (0.0%) | 0 (0.0%) |
| Community & Social Service | 28 (49.1%) | 29 (50.9%) |
| Education, Arts & Media | 7 (100.0%) | 0 (0.0%) |
| Legal Services & Support | 0 (0.0%) | 0 (0.0%) |
| Education Instruction & Library | 21 (42.0%) | 29 (58.0%) |
| Arts, Media & Entertainment | 0 (0.0%) | 0 (0.0%) |
| Health Diagnosing & Treating | 13 (5.2%) | 236 (94.8%) |
| Health Technologists | 0 (0.0%) | 129 (100.0%) |
| Total (Category) | 98 (22.1%) | 346 (77.9%) |
| Total (Overall) | 597 (47.0%) | 672 (53.0%) |
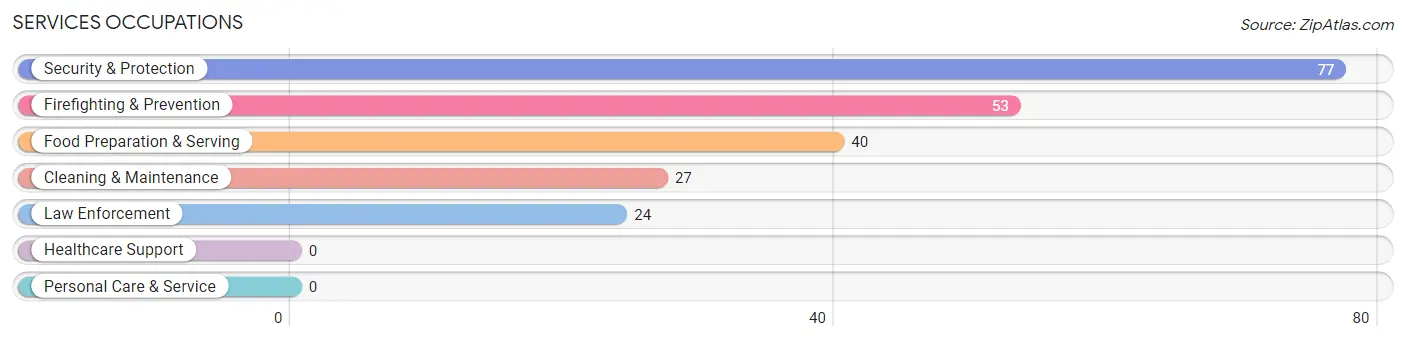
Services Occupations
The most common Services occupations in Honea Path are Security & Protection (77 | 6.1%), Firefighting & Prevention (53 | 4.2%), Food Preparation & Serving (40 | 3.2%), Cleaning & Maintenance (27 | 2.1%), and Law Enforcement (24 | 1.9%).
Services Occupations by Sex
Within the Services occupations in Honea Path, the most male-oriented occupations are Law Enforcement (100.0%), Security & Protection (75.3%), and Firefighting & Prevention (64.1%), while the most female-oriented occupations are Food Preparation & Serving (100.0%), Cleaning & Maintenance (70.4%), and Firefighting & Prevention (35.8%).
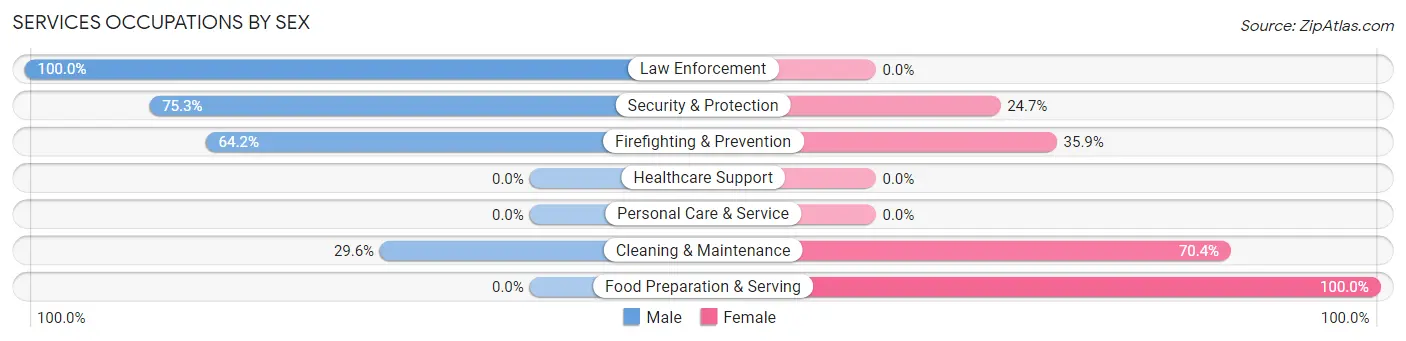
| Occupation | Male | Female |
| Healthcare Support | 0 (0.0%) | 0 (0.0%) |
| Security & Protection | 58 (75.3%) | 19 (24.7%) |
| Firefighting & Prevention | 34 (64.1%) | 19 (35.8%) |
| Law Enforcement | 24 (100.0%) | 0 (0.0%) |
| Food Preparation & Serving | 0 (0.0%) | 40 (100.0%) |
| Cleaning & Maintenance | 8 (29.6%) | 19 (70.4%) |
| Personal Care & Service | 0 (0.0%) | 0 (0.0%) |
| Total (Category) | 66 (45.8%) | 78 (54.2%) |
| Total (Overall) | 597 (47.0%) | 672 (53.0%) |
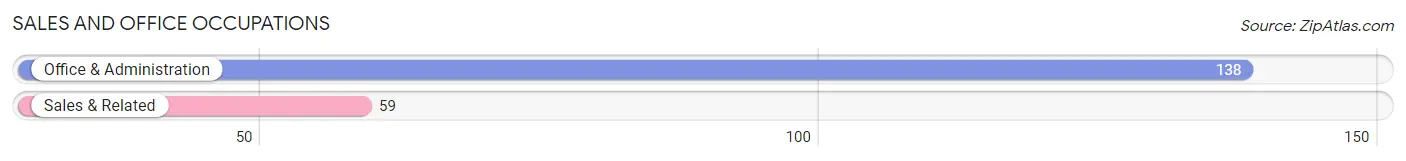
Sales and Office Occupations
The most common Sales and Office occupations in Honea Path are Office & Administration (138 | 10.9%), and Sales & Related (59 | 4.6%).
Sales and Office Occupations by Sex
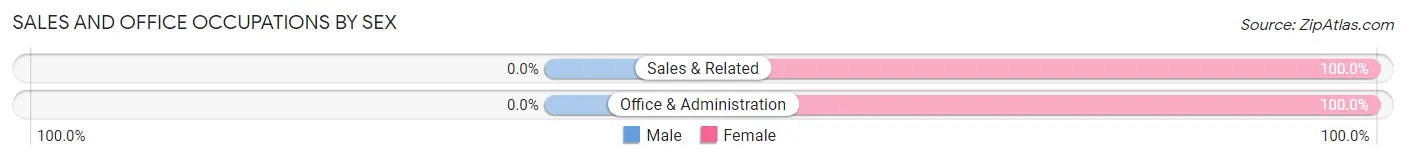
| Occupation | Male | Female |
| Sales & Related | 0 (0.0%) | 59 (100.0%) |
| Office & Administration | 0 (0.0%) | 138 (100.0%) |
| Total (Category) | 0 (0.0%) | 197 (100.0%) |
| Total (Overall) | 597 (47.0%) | 672 (53.0%) |
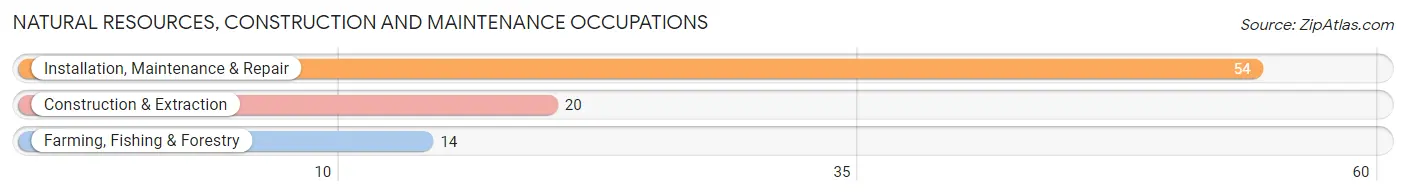
Natural Resources, Construction and Maintenance Occupations
The most common Natural Resources, Construction and Maintenance occupations in Honea Path are Installation, Maintenance & Repair (54 | 4.3%), Construction & Extraction (20 | 1.6%), and Farming, Fishing & Forestry (14 | 1.1%).
Natural Resources, Construction and Maintenance Occupations by Sex
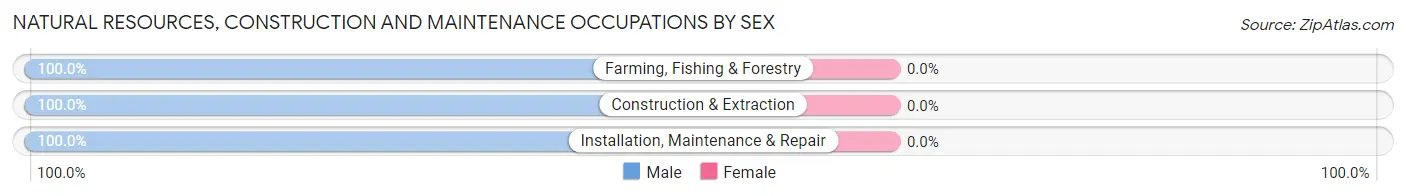
| Occupation | Male | Female |
| Farming, Fishing & Forestry | 14 (100.0%) | 0 (0.0%) |
| Construction & Extraction | 20 (100.0%) | 0 (0.0%) |
| Installation, Maintenance & Repair | 54 (100.0%) | 0 (0.0%) |
| Total (Category) | 88 (100.0%) | 0 (0.0%) |
| Total (Overall) | 597 (47.0%) | 672 (53.0%) |
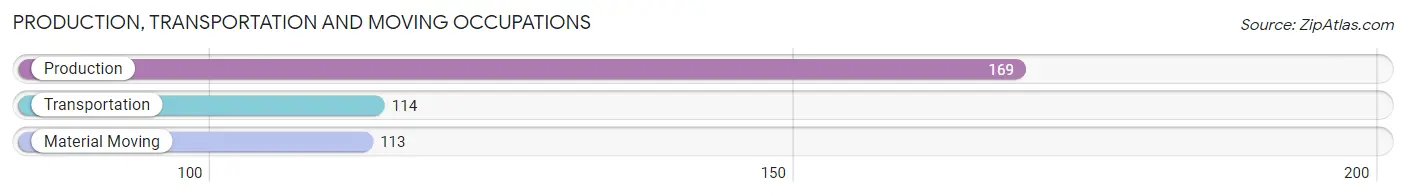
Production, Transportation and Moving Occupations
The most common Production, Transportation and Moving occupations in Honea Path are Production (169 | 13.3%), Transportation (114 | 9.0%), and Material Moving (113 | 8.9%).
Production, Transportation and Moving Occupations by Sex
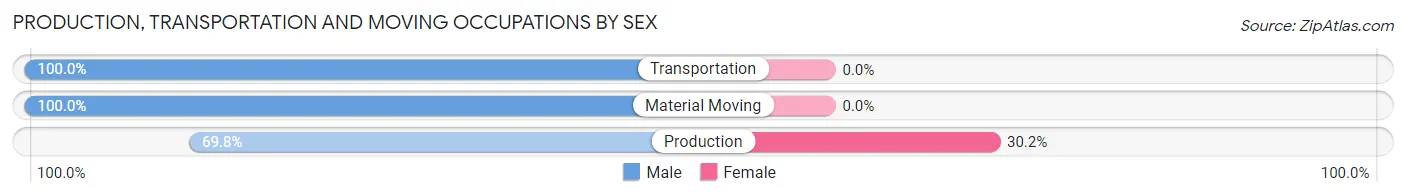
| Occupation | Male | Female |
| Production | 118 (69.8%) | 51 (30.2%) |
| Transportation | 114 (100.0%) | 0 (0.0%) |
| Material Moving | 113 (100.0%) | 0 (0.0%) |
| Total (Category) | 345 (87.1%) | 51 (12.9%) |
| Total (Overall) | 597 (47.0%) | 672 (53.0%) |
Employment Industries by Sex in Honea Path
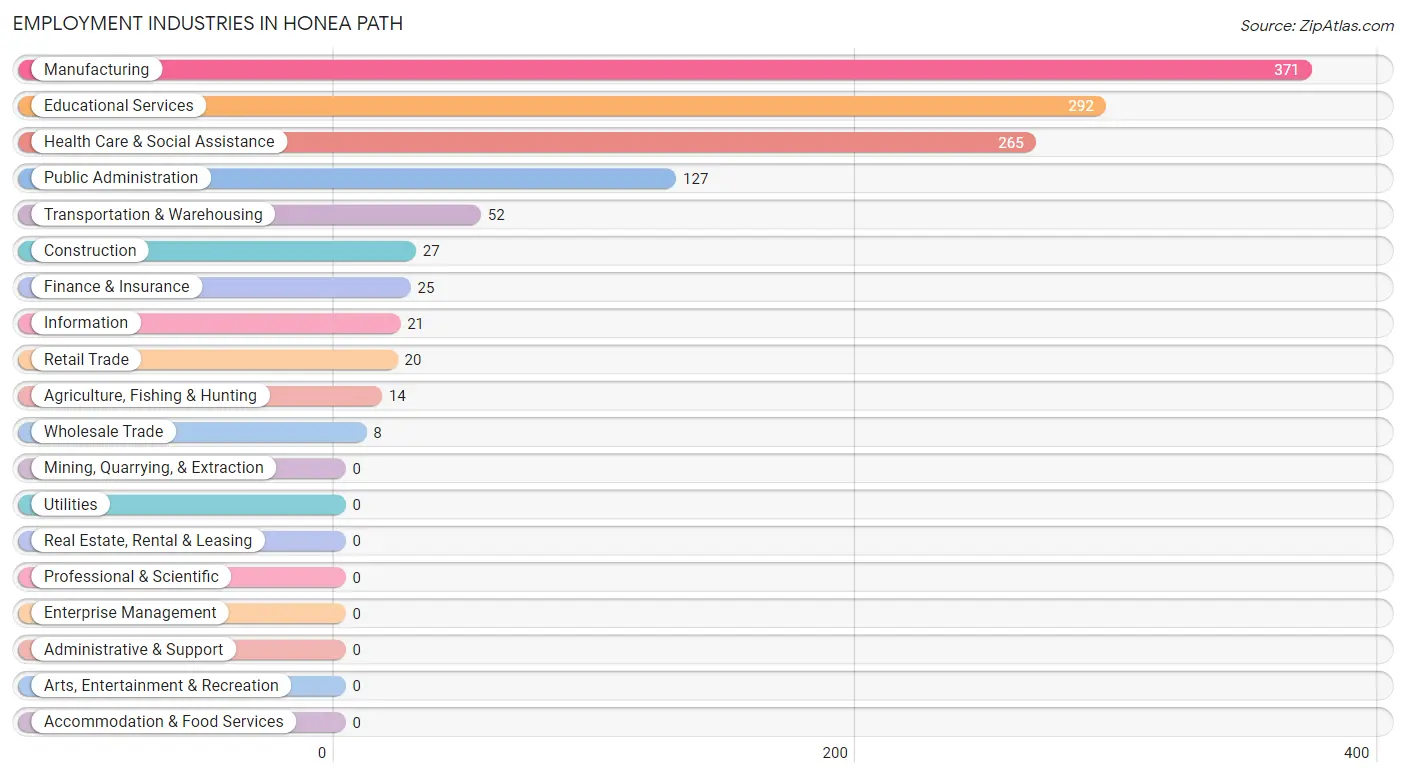
Employment Industries in Honea Path
The major employment industries in Honea Path include Manufacturing (371 | 29.2%), Educational Services (292 | 23.0%), Health Care & Social Assistance (265 | 20.9%), Public Administration (127 | 10.0%), and Transportation & Warehousing (52 | 4.1%).
Employment Industries by Sex in Honea Path
The Honea Path industries that see more men than women are Agriculture, Fishing & Hunting (100.0%), Construction (100.0%), and Retail Trade (100.0%), whereas the industries that tend to have a higher number of women are Wholesale Trade (100.0%), Information (100.0%), and Health Care & Social Assistance (95.1%).
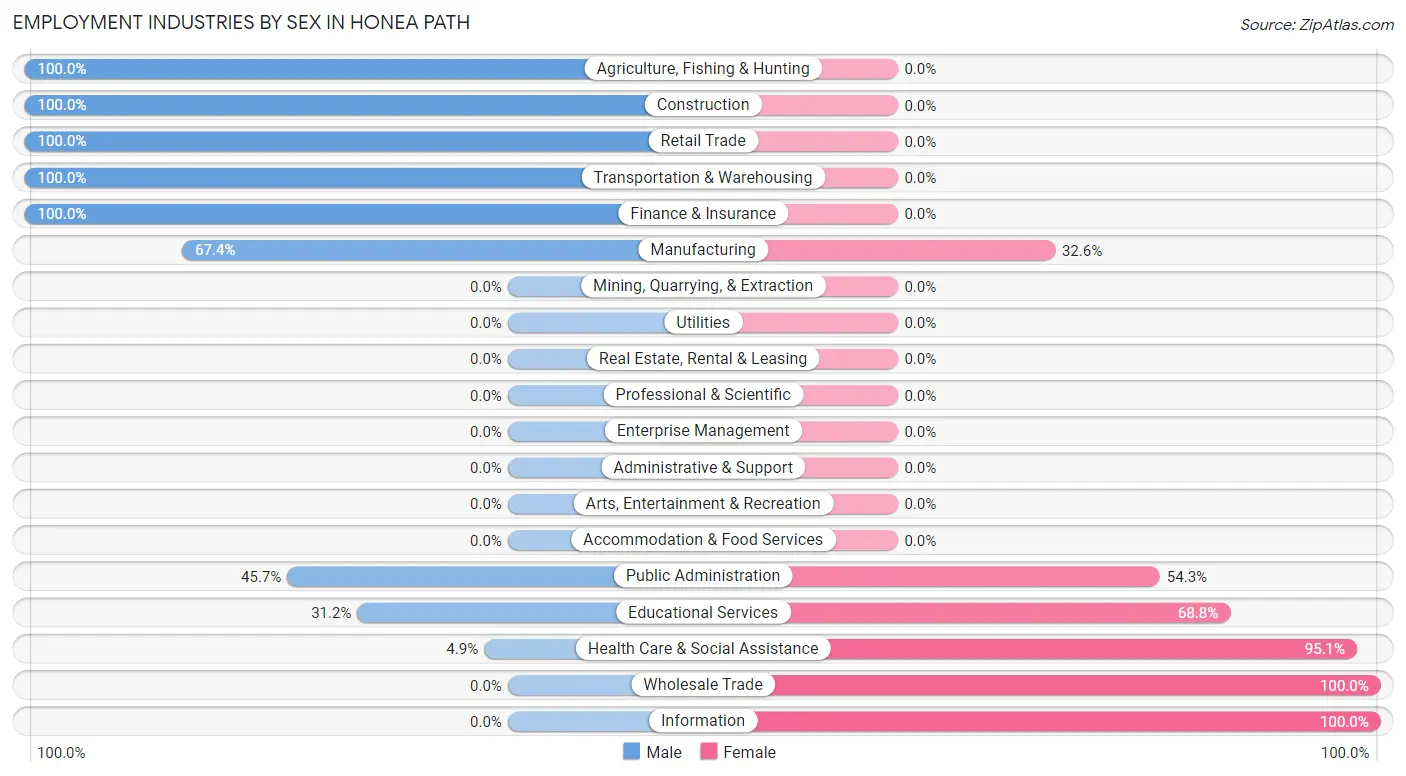
| Industry | Male | Female |
| Agriculture, Fishing & Hunting | 14 (100.0%) | 0 (0.0%) |
| Mining, Quarrying, & Extraction | 0 (0.0%) | 0 (0.0%) |
| Construction | 27 (100.0%) | 0 (0.0%) |
| Manufacturing | 250 (67.4%) | 121 (32.6%) |
| Wholesale Trade | 0 (0.0%) | 8 (100.0%) |
| Retail Trade | 20 (100.0%) | 0 (0.0%) |
| Transportation & Warehousing | 52 (100.0%) | 0 (0.0%) |
| Utilities | 0 (0.0%) | 0 (0.0%) |
| Information | 0 (0.0%) | 21 (100.0%) |
| Finance & Insurance | 25 (100.0%) | 0 (0.0%) |
| Real Estate, Rental & Leasing | 0 (0.0%) | 0 (0.0%) |
| Professional & Scientific | 0 (0.0%) | 0 (0.0%) |
| Enterprise Management | 0 (0.0%) | 0 (0.0%) |
| Administrative & Support | 0 (0.0%) | 0 (0.0%) |
| Educational Services | 91 (31.2%) | 201 (68.8%) |
| Health Care & Social Assistance | 13 (4.9%) | 252 (95.1%) |
| Arts, Entertainment & Recreation | 0 (0.0%) | 0 (0.0%) |
| Accommodation & Food Services | 0 (0.0%) | 0 (0.0%) |
| Public Administration | 58 (45.7%) | 69 (54.3%) |
| Total | 597 (47.0%) | 672 (53.0%) |
Education in Honea Path
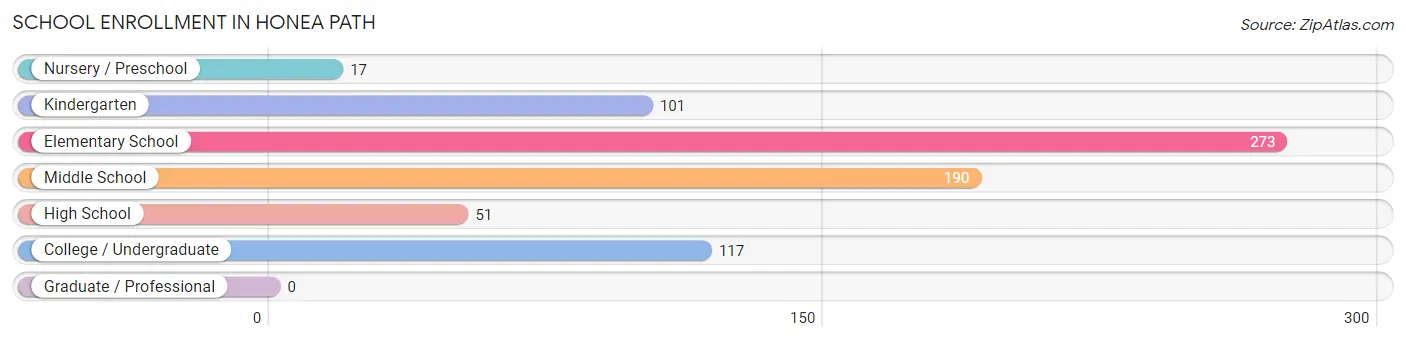
School Enrollment in Honea Path
The most common levels of schooling among the 749 students in Honea Path are elementary school (273 | 36.4%), middle school (190 | 25.4%), and college / undergraduate (117 | 15.6%).
| School Level | # Students | % Students |
| Nursery / Preschool | 17 | 2.3% |
| Kindergarten | 101 | 13.5% |
| Elementary School | 273 | 36.4% |
| Middle School | 190 | 25.4% |
| High School | 51 | 6.8% |
| College / Undergraduate | 117 | 15.6% |
| Graduate / Professional | 0 | 0.0% |
| Total | 749 | 100.0% |
School Enrollment by Age by Funding Source in Honea Path
Out of a total of 749 students who are enrolled in schools in Honea Path, 131 (17.5%) attend a private institution, while the remaining 618 (82.5%) are enrolled in public schools. The age group of 3 to 4 year olds has the highest likelihood of being enrolled in private schools, with 17 (100.0% in the age bracket) enrolled. Conversely, the age group of 15 to 17 year olds has the lowest likelihood of being enrolled in a private school, with 44 (100.0% in the age bracket) attending a public institution.
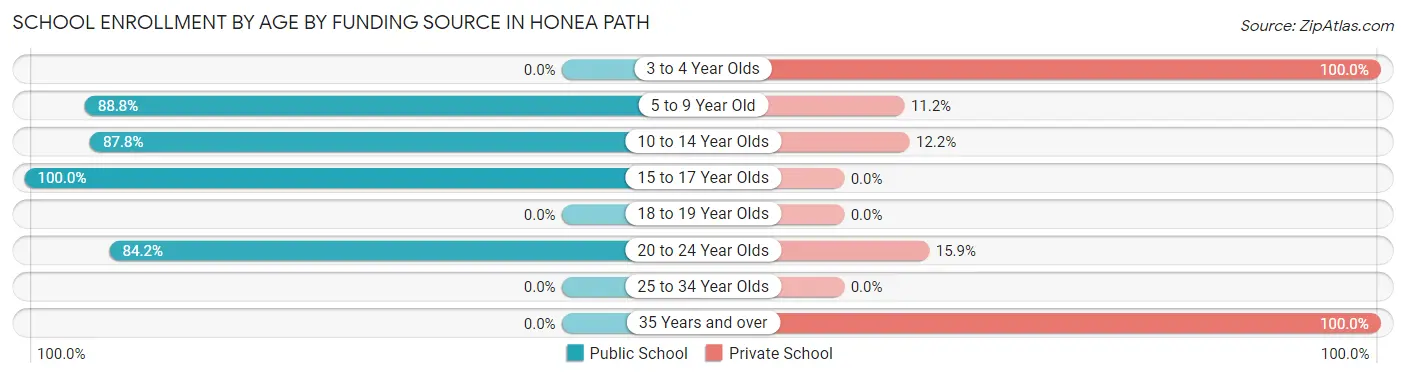
| Age Bracket | Public School | Private School |
| 3 to 4 Year Olds | 0 (0.0%) | 17 (100.0%) |
| 5 to 9 Year Old | 332 (88.8%) | 42 (11.2%) |
| 10 to 14 Year Olds | 173 (87.8%) | 24 (12.2%) |
| 15 to 17 Year Olds | 44 (100.0%) | 0 (0.0%) |
| 18 to 19 Year Olds | 0 (0.0%) | 0 (0.0%) |
| 20 to 24 Year Olds | 69 (84.2%) | 13 (15.9%) |
| 25 to 34 Year Olds | 0 (0.0%) | 0 (0.0%) |
| 35 Years and over | 0 (0.0%) | 35 (100.0%) |
| Total | 618 (82.5%) | 131 (17.5%) |
Educational Attainment by Field of Study in Honea Path
Business (165 | 26.3%), education (163 | 26.0%), liberal arts & history (126 | 20.1%), arts & humanities (58 | 9.2%), and social sciences (30 | 4.8%) are the most common fields of study among 628 individuals in Honea Path who have obtained a bachelor's degree or higher.
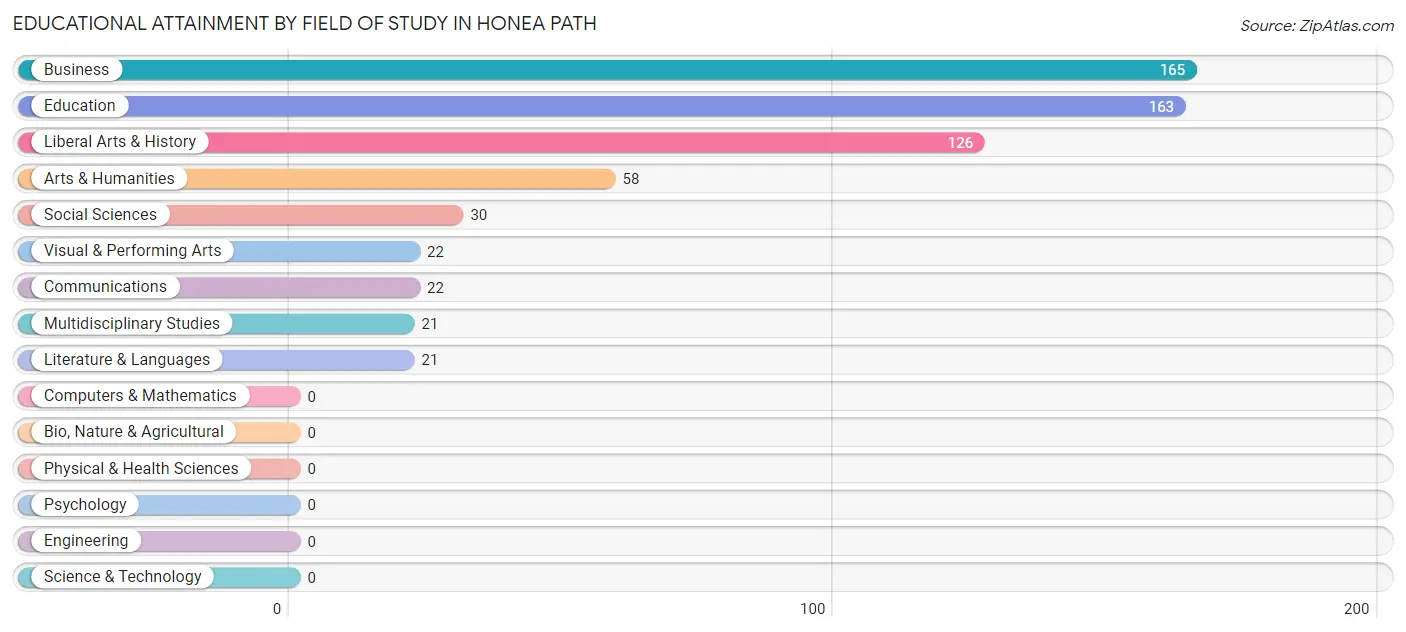
| Field of Study | # Graduates | % Graduates |
| Computers & Mathematics | 0 | 0.0% |
| Bio, Nature & Agricultural | 0 | 0.0% |
| Physical & Health Sciences | 0 | 0.0% |
| Psychology | 0 | 0.0% |
| Social Sciences | 30 | 4.8% |
| Engineering | 0 | 0.0% |
| Multidisciplinary Studies | 21 | 3.3% |
| Science & Technology | 0 | 0.0% |
| Business | 165 | 26.3% |
| Education | 163 | 26.0% |
| Literature & Languages | 21 | 3.3% |
| Liberal Arts & History | 126 | 20.1% |
| Visual & Performing Arts | 22 | 3.5% |
| Communications | 22 | 3.5% |
| Arts & Humanities | 58 | 9.2% |
| Total | 628 | 100.0% |
Transportation & Commute in Honea Path
Vehicle Availability by Sex in Honea Path
The most prevalent vehicle ownership categories in Honea Path are males with 2 vehicles (186, accounting for 36.2%) and females with 2 vehicles (407, making up 29.8%).
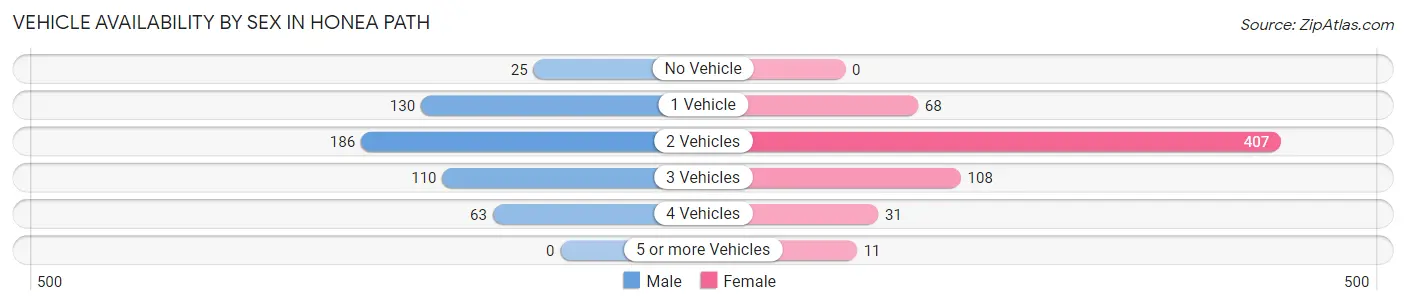
| Vehicles Available | Male | Female |
| No Vehicle | 25 (4.9%) | 0 (0.0%) |
| 1 Vehicle | 130 (25.3%) | 68 (10.9%) |
| 2 Vehicles | 186 (36.2%) | 407 (65.1%) |
| 3 Vehicles | 110 (21.4%) | 108 (17.3%) |
| 4 Vehicles | 63 (12.3%) | 31 (5.0%) |
| 5 or more Vehicles | 0 (0.0%) | 11 (1.8%) |
| Total | 514 (100.0%) | 625 (100.0%) |
Commute Time in Honea Path
The most frequently occuring commute durations in Honea Path are 45 to 59 minutes (218 commuters, 20.7%), 20 to 24 minutes (163 commuters, 15.5%), and 30 to 34 minutes (137 commuters, 13.0%).
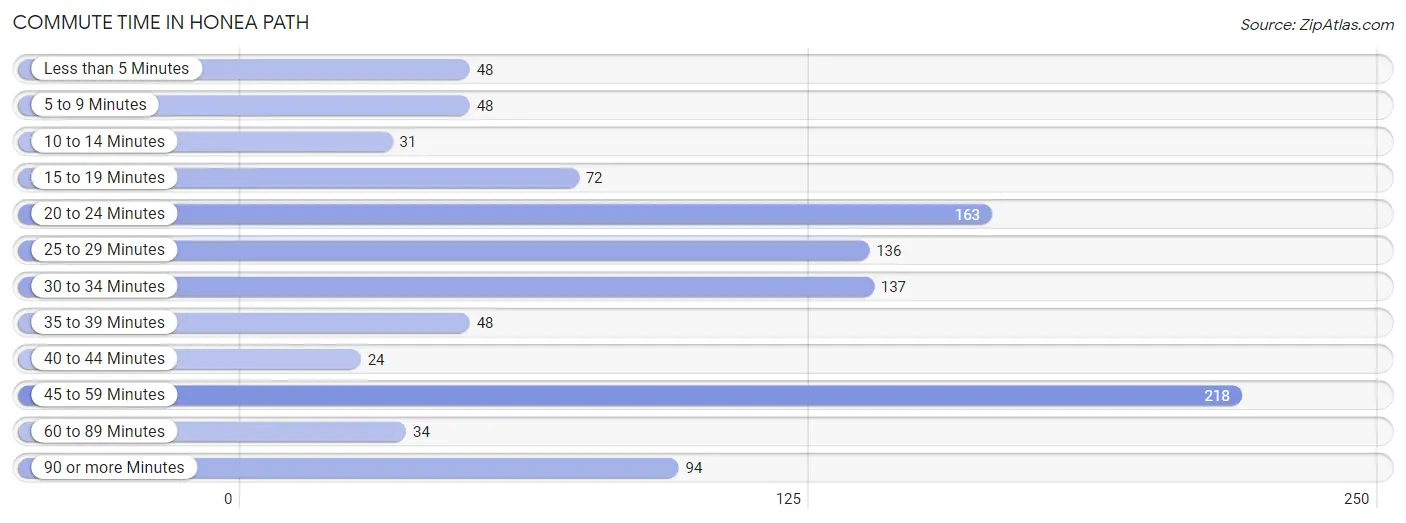
| Commute Time | # Commuters | % Commuters |
| Less than 5 Minutes | 48 | 4.6% |
| 5 to 9 Minutes | 48 | 4.6% |
| 10 to 14 Minutes | 31 | 2.9% |
| 15 to 19 Minutes | 72 | 6.8% |
| 20 to 24 Minutes | 163 | 15.5% |
| 25 to 29 Minutes | 136 | 12.9% |
| 30 to 34 Minutes | 137 | 13.0% |
| 35 to 39 Minutes | 48 | 4.6% |
| 40 to 44 Minutes | 24 | 2.3% |
| 45 to 59 Minutes | 218 | 20.7% |
| 60 to 89 Minutes | 34 | 3.2% |
| 90 or more Minutes | 94 | 8.9% |
Commute Time by Sex in Honea Path
The most common commute times in Honea Path are 45 to 59 minutes (135 commuters, 27.6%) for males and 25 to 29 minutes (136 commuters, 24.1%) for females.
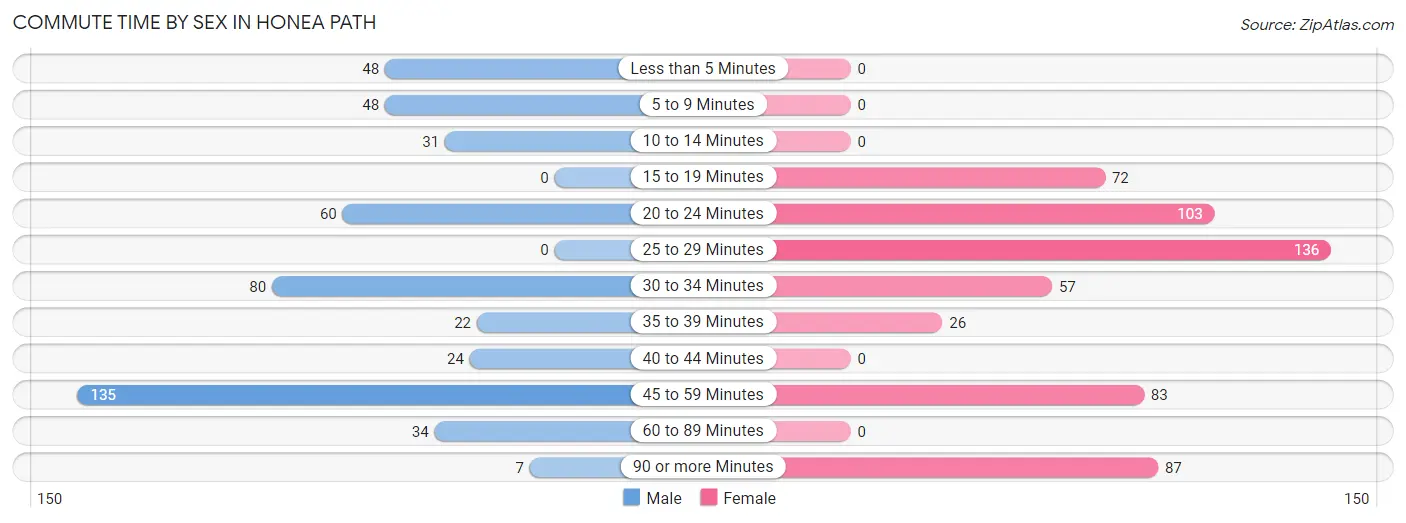
| Commute Time | Male | Female |
| Less than 5 Minutes | 48 (9.8%) | 0 (0.0%) |
| 5 to 9 Minutes | 48 (9.8%) | 0 (0.0%) |
| 10 to 14 Minutes | 31 (6.3%) | 0 (0.0%) |
| 15 to 19 Minutes | 0 (0.0%) | 72 (12.8%) |
| 20 to 24 Minutes | 60 (12.3%) | 103 (18.3%) |
| 25 to 29 Minutes | 0 (0.0%) | 136 (24.1%) |
| 30 to 34 Minutes | 80 (16.4%) | 57 (10.1%) |
| 35 to 39 Minutes | 22 (4.5%) | 26 (4.6%) |
| 40 to 44 Minutes | 24 (4.9%) | 0 (0.0%) |
| 45 to 59 Minutes | 135 (27.6%) | 83 (14.7%) |
| 60 to 89 Minutes | 34 (7.0%) | 0 (0.0%) |
| 90 or more Minutes | 7 (1.4%) | 87 (15.4%) |
Time of Departure to Work by Sex in Honea Path
The most frequent times of departure to work in Honea Path are 12:00 PM to 3:59 PM (116, 23.7%) for males and 7:00 AM to 7:29 AM (137, 24.3%) for females.
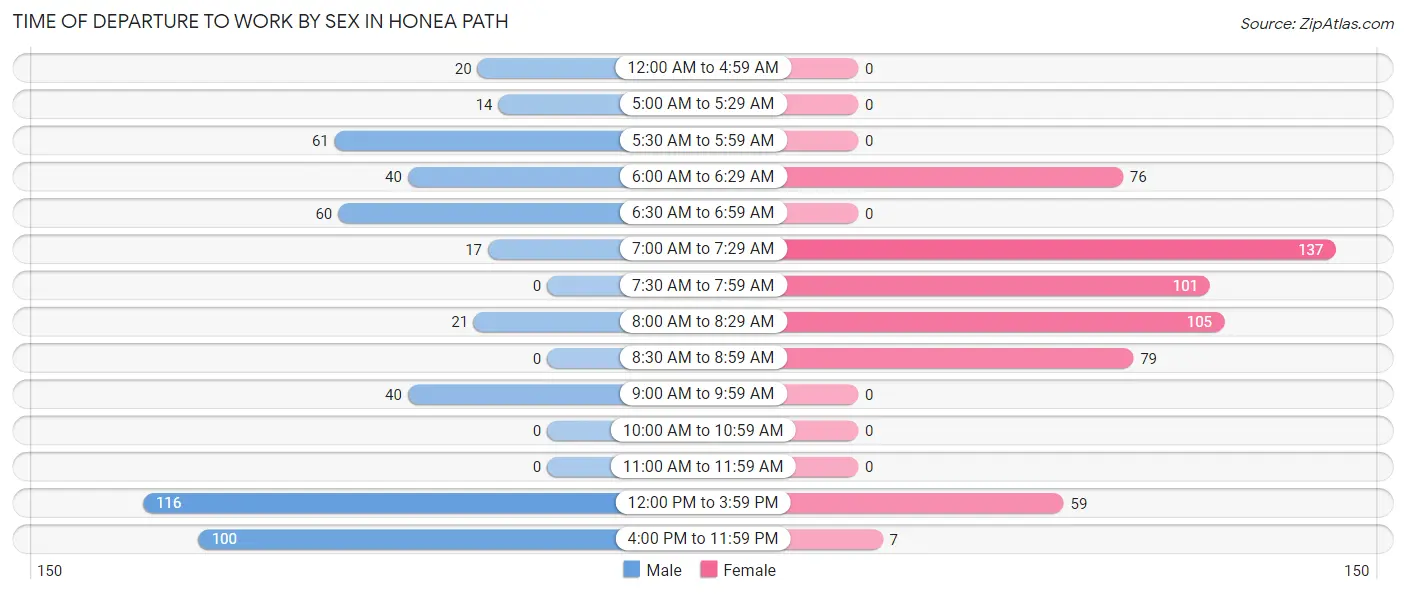
| Time of Departure | Male | Female |
| 12:00 AM to 4:59 AM | 20 (4.1%) | 0 (0.0%) |
| 5:00 AM to 5:29 AM | 14 (2.9%) | 0 (0.0%) |
| 5:30 AM to 5:59 AM | 61 (12.5%) | 0 (0.0%) |
| 6:00 AM to 6:29 AM | 40 (8.2%) | 76 (13.5%) |
| 6:30 AM to 6:59 AM | 60 (12.3%) | 0 (0.0%) |
| 7:00 AM to 7:29 AM | 17 (3.5%) | 137 (24.3%) |
| 7:30 AM to 7:59 AM | 0 (0.0%) | 101 (17.9%) |
| 8:00 AM to 8:29 AM | 21 (4.3%) | 105 (18.6%) |
| 8:30 AM to 8:59 AM | 0 (0.0%) | 79 (14.0%) |
| 9:00 AM to 9:59 AM | 40 (8.2%) | 0 (0.0%) |
| 10:00 AM to 10:59 AM | 0 (0.0%) | 0 (0.0%) |
| 11:00 AM to 11:59 AM | 0 (0.0%) | 0 (0.0%) |
| 12:00 PM to 3:59 PM | 116 (23.7%) | 59 (10.5%) |
| 4:00 PM to 11:59 PM | 100 (20.4%) | 7 (1.2%) |
| Total | 489 (100.0%) | 564 (100.0%) |
Housing Occupancy in Honea Path
Occupancy by Ownership in Honea Path
Of the total 1,509 dwellings in Honea Path, owner-occupied units account for 1,067 (70.7%), while renter-occupied units make up 442 (29.3%).
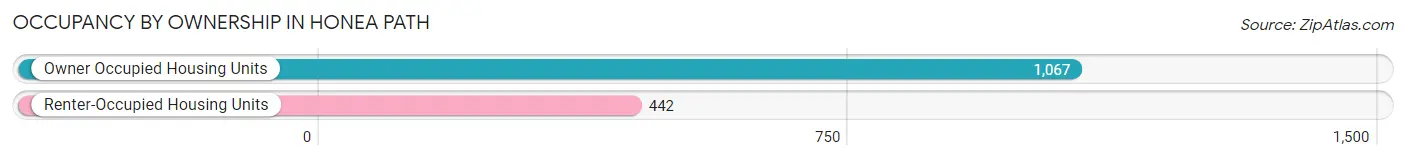
| Occupancy | # Housing Units | % Housing Units |
| Owner Occupied Housing Units | 1,067 | 70.7% |
| Renter-Occupied Housing Units | 442 | 29.3% |
| Total Occupied Housing Units | 1,509 | 100.0% |
Occupancy by Household Size in Honea Path
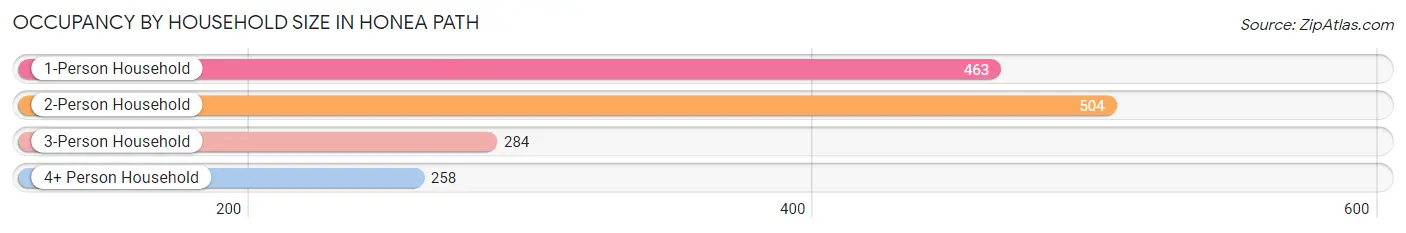
| Household Size | # Housing Units | % Housing Units |
| 1-Person Household | 463 | 30.7% |
| 2-Person Household | 504 | 33.4% |
| 3-Person Household | 284 | 18.8% |
| 4+ Person Household | 258 | 17.1% |
| Total Housing Units | 1,509 | 100.0% |
Occupancy by Ownership by Household Size in Honea Path
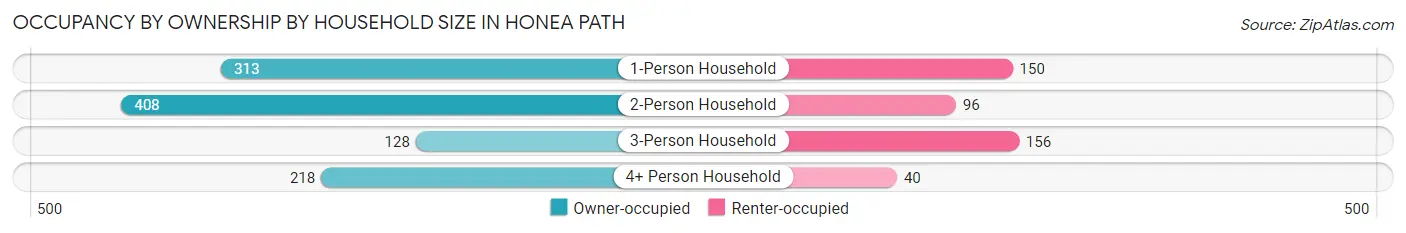
| Household Size | Owner-occupied | Renter-occupied |
| 1-Person Household | 313 (67.6%) | 150 (32.4%) |
| 2-Person Household | 408 (80.9%) | 96 (19.1%) |
| 3-Person Household | 128 (45.1%) | 156 (54.9%) |
| 4+ Person Household | 218 (84.5%) | 40 (15.5%) |
| Total Housing Units | 1,067 (70.7%) | 442 (29.3%) |
Occupancy by Educational Attainment in Honea Path
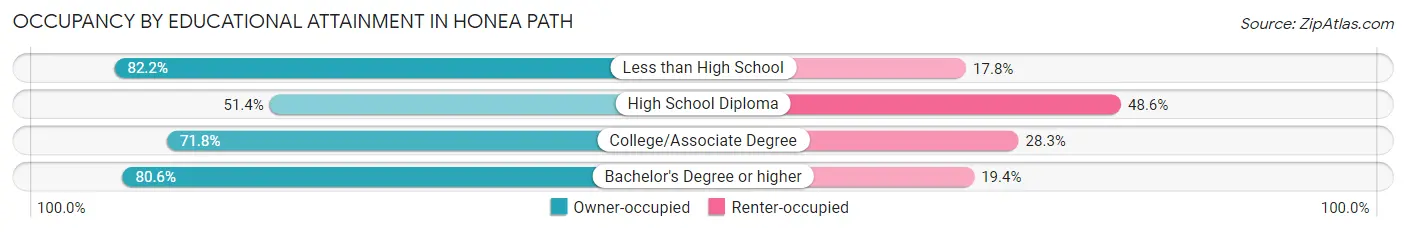
| Household Size | Owner-occupied | Renter-occupied |
| Less than High School | 221 (82.2%) | 48 (17.8%) |
| High School Diploma | 214 (51.4%) | 202 (48.6%) |
| College/Associate Degree | 259 (71.8%) | 102 (28.2%) |
| Bachelor's Degree or higher | 373 (80.6%) | 90 (19.4%) |
Occupancy by Age of Householder in Honea Path
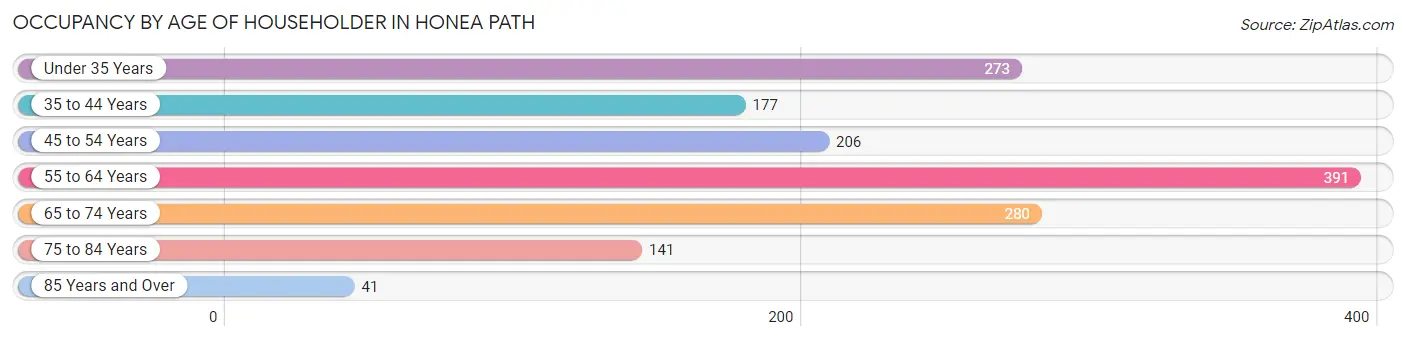
| Age Bracket | # Households | % Households |
| Under 35 Years | 273 | 18.1% |
| 35 to 44 Years | 177 | 11.7% |
| 45 to 54 Years | 206 | 13.7% |
| 55 to 64 Years | 391 | 25.9% |
| 65 to 74 Years | 280 | 18.6% |
| 75 to 84 Years | 141 | 9.3% |
| 85 Years and Over | 41 | 2.7% |
| Total | 1,509 | 100.0% |
Housing Finances in Honea Path
Median Income by Occupancy in Honea Path
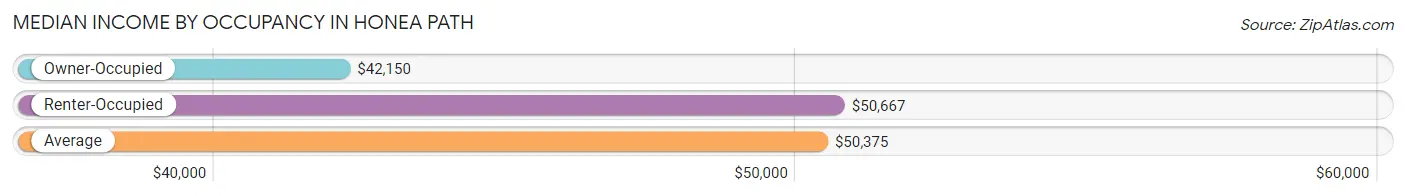
| Occupancy Type | # Households | Median Income |
| Owner-Occupied | 1,067 (70.7%) | $42,150 |
| Renter-Occupied | 442 (29.3%) | $50,667 |
| Average | 1,509 (100.0%) | $50,375 |
Occupancy by Householder Income Bracket in Honea Path
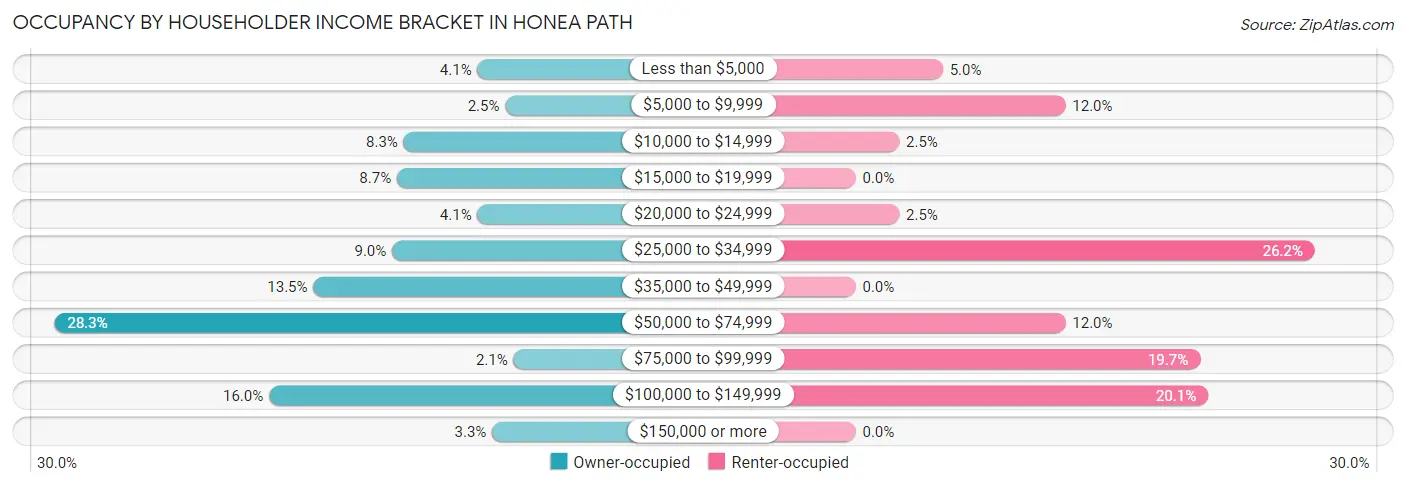
| Income Bracket | Owner-occupied | Renter-occupied |
| Less than $5,000 | 44 (4.1%) | 22 (5.0%) |
| $5,000 to $9,999 | 27 (2.5%) | 53 (12.0%) |
| $10,000 to $14,999 | 89 (8.3%) | 11 (2.5%) |
| $15,000 to $19,999 | 93 (8.7%) | 0 (0.0%) |
| $20,000 to $24,999 | 44 (4.1%) | 11 (2.5%) |
| $25,000 to $34,999 | 96 (9.0%) | 116 (26.2%) |
| $35,000 to $49,999 | 144 (13.5%) | 0 (0.0%) |
| $50,000 to $74,999 | 302 (28.3%) | 53 (12.0%) |
| $75,000 to $99,999 | 22 (2.1%) | 87 (19.7%) |
| $100,000 to $149,999 | 171 (16.0%) | 89 (20.1%) |
| $150,000 or more | 35 (3.3%) | 0 (0.0%) |
| Total | 1,067 (100.0%) | 442 (100.0%) |
Monthly Housing Cost Tiers in Honea Path
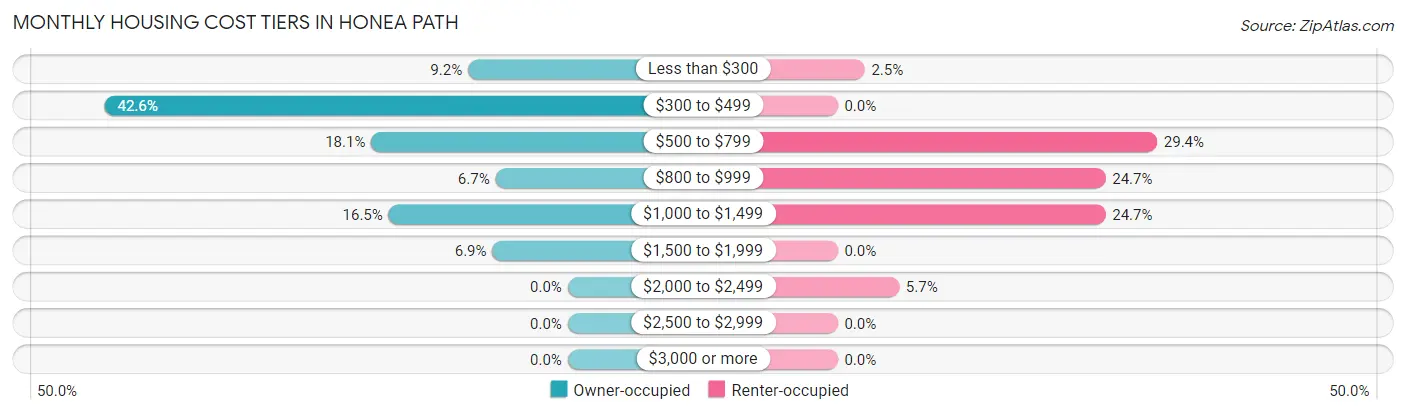
| Monthly Cost | Owner-occupied | Renter-occupied |
| Less than $300 | 98 (9.2%) | 11 (2.5%) |
| $300 to $499 | 455 (42.6%) | 0 (0.0%) |
| $500 to $799 | 193 (18.1%) | 130 (29.4%) |
| $800 to $999 | 71 (6.7%) | 109 (24.7%) |
| $1,000 to $1,499 | 176 (16.5%) | 109 (24.7%) |
| $1,500 to $1,999 | 74 (6.9%) | 0 (0.0%) |
| $2,000 to $2,499 | 0 (0.0%) | 25 (5.7%) |
| $2,500 to $2,999 | 0 (0.0%) | 0 (0.0%) |
| $3,000 or more | 0 (0.0%) | 0 (0.0%) |
| Total | 1,067 (100.0%) | 442 (100.0%) |
Physical Housing Characteristics in Honea Path
Housing Structures in Honea Path

| Structure Type | # Housing Units | % Housing Units |
| Single Unit, Detached | 1,344 | 89.1% |
| Single Unit, Attached | 12 | 0.8% |
| 2 Unit Apartments | 50 | 3.3% |
| 3 or 4 Unit Apartments | 0 | 0.0% |
| 5 to 9 Unit Apartments | 12 | 0.8% |
| 10 or more Apartments | 8 | 0.5% |
| Mobile Home / Other | 83 | 5.5% |
| Total | 1,509 | 100.0% |
Housing Structures by Occupancy in Honea Path
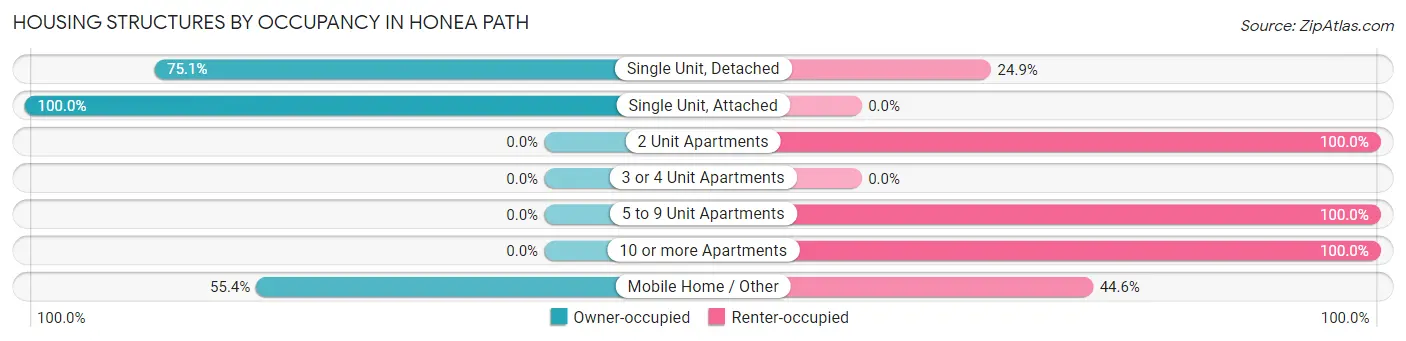
| Structure Type | Owner-occupied | Renter-occupied |
| Single Unit, Detached | 1,009 (75.1%) | 335 (24.9%) |
| Single Unit, Attached | 12 (100.0%) | 0 (0.0%) |
| 2 Unit Apartments | 0 (0.0%) | 50 (100.0%) |
| 3 or 4 Unit Apartments | 0 (0.0%) | 0 (0.0%) |
| 5 to 9 Unit Apartments | 0 (0.0%) | 12 (100.0%) |
| 10 or more Apartments | 0 (0.0%) | 8 (100.0%) |
| Mobile Home / Other | 46 (55.4%) | 37 (44.6%) |
| Total | 1,067 (70.7%) | 442 (29.3%) |
Housing Structures by Number of Rooms in Honea Path
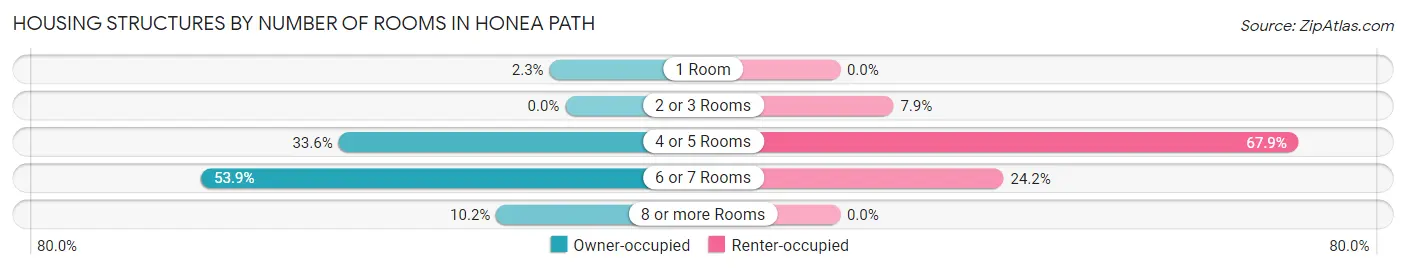
| Number of Rooms | Owner-occupied | Renter-occupied |
| 1 Room | 25 (2.3%) | 0 (0.0%) |
| 2 or 3 Rooms | 0 (0.0%) | 35 (7.9%) |
| 4 or 5 Rooms | 358 (33.6%) | 300 (67.9%) |
| 6 or 7 Rooms | 575 (53.9%) | 107 (24.2%) |
| 8 or more Rooms | 109 (10.2%) | 0 (0.0%) |
| Total | 1,067 (100.0%) | 442 (100.0%) |
Housing Structure by Heating Type in Honea Path
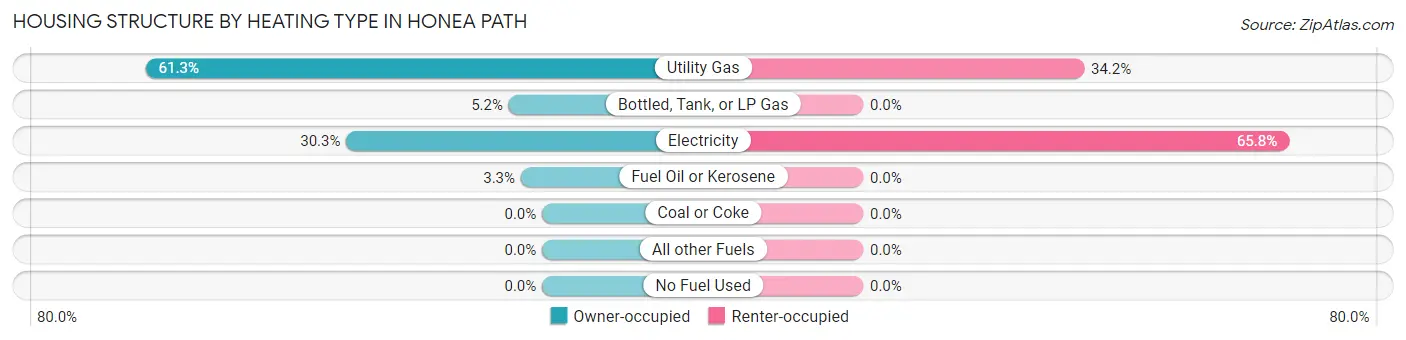
| Heating Type | Owner-occupied | Renter-occupied |
| Utility Gas | 654 (61.3%) | 151 (34.2%) |
| Bottled, Tank, or LP Gas | 55 (5.1%) | 0 (0.0%) |
| Electricity | 323 (30.3%) | 291 (65.8%) |
| Fuel Oil or Kerosene | 35 (3.3%) | 0 (0.0%) |
| Coal or Coke | 0 (0.0%) | 0 (0.0%) |
| All other Fuels | 0 (0.0%) | 0 (0.0%) |
| No Fuel Used | 0 (0.0%) | 0 (0.0%) |
| Total | 1,067 (100.0%) | 442 (100.0%) |
Household Vehicle Usage in Honea Path
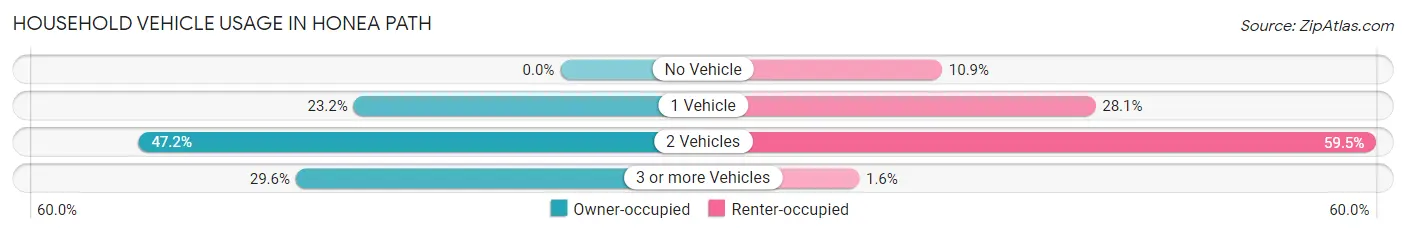
| Vehicles per Household | Owner-occupied | Renter-occupied |
| No Vehicle | 0 (0.0%) | 48 (10.9%) |
| 1 Vehicle | 247 (23.2%) | 124 (28.1%) |
| 2 Vehicles | 504 (47.2%) | 263 (59.5%) |
| 3 or more Vehicles | 316 (29.6%) | 7 (1.6%) |
| Total | 1,067 (100.0%) | 442 (100.0%) |
Real Estate & Mortgages in Honea Path
Real Estate and Mortgage Overview in Honea Path
| Characteristic | Without Mortgage | With Mortgage |
| Housing Units | 617 | 450 |
| Median Property Value | $99,000 | $137,700 |
| Median Household Income | $33,068 | $17 |
| Monthly Housing Costs | $365 | $0 |
| Real Estate Taxes | $637 | $0 |
Property Value by Mortgage Status in Honea Path
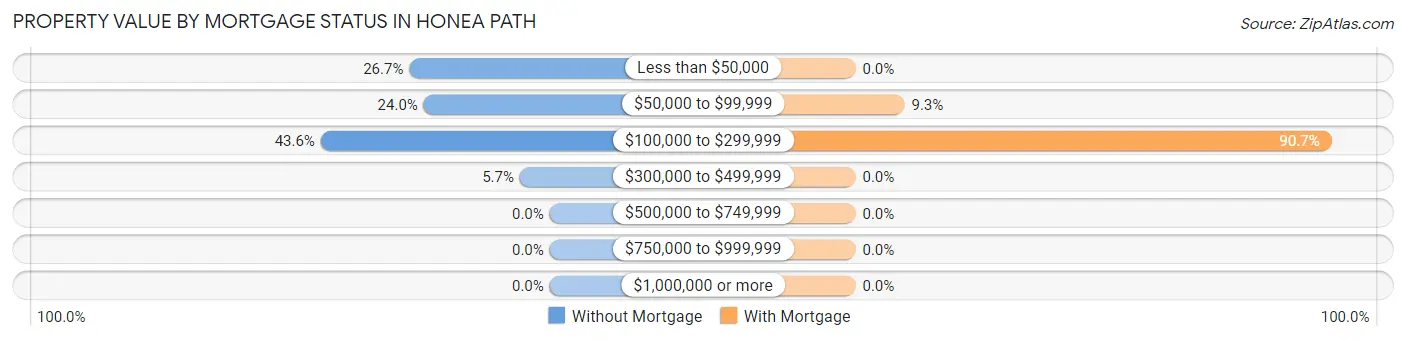
| Property Value | Without Mortgage | With Mortgage |
| Less than $50,000 | 165 (26.7%) | 0 (0.0%) |
| $50,000 to $99,999 | 148 (24.0%) | 42 (9.3%) |
| $100,000 to $299,999 | 269 (43.6%) | 408 (90.7%) |
| $300,000 to $499,999 | 35 (5.7%) | 0 (0.0%) |
| $500,000 to $749,999 | 0 (0.0%) | 0 (0.0%) |
| $750,000 to $999,999 | 0 (0.0%) | 0 (0.0%) |
| $1,000,000 or more | 0 (0.0%) | 0 (0.0%) |
| Total | 617 (100.0%) | 450 (100.0%) |
Household Income by Mortgage Status in Honea Path
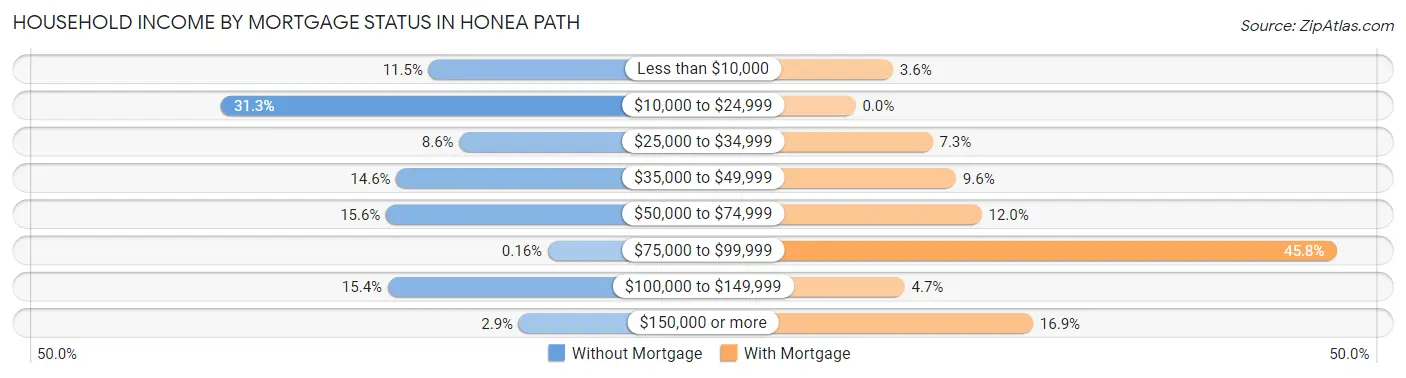
| Household Income | Without Mortgage | With Mortgage |
| Less than $10,000 | 71 (11.5%) | 16 (3.6%) |
| $10,000 to $24,999 | 193 (31.3%) | 0 (0.0%) |
| $25,000 to $34,999 | 53 (8.6%) | 33 (7.3%) |
| $35,000 to $49,999 | 90 (14.6%) | 43 (9.6%) |
| $50,000 to $74,999 | 96 (15.6%) | 54 (12.0%) |
| $75,000 to $99,999 | 1 (0.2%) | 206 (45.8%) |
| $100,000 to $149,999 | 95 (15.4%) | 21 (4.7%) |
| $150,000 or more | 18 (2.9%) | 76 (16.9%) |
| Total | 617 (100.0%) | 450 (100.0%) |
Property Value to Household Income Ratio in Honea Path
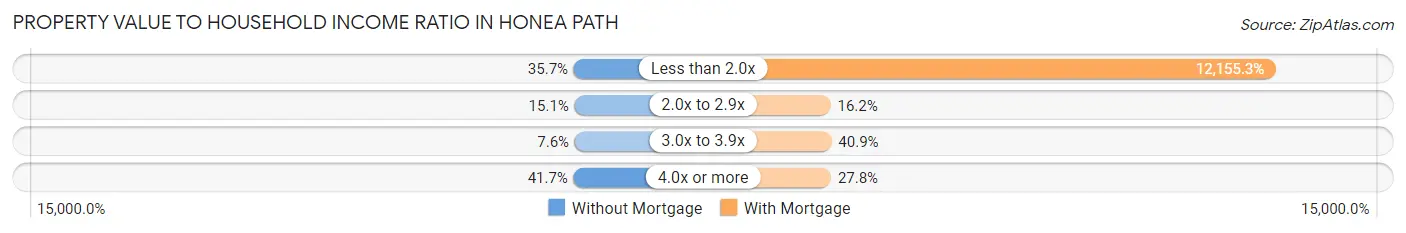
| Value-to-Income Ratio | Without Mortgage | With Mortgage |
| Less than 2.0x | 220 (35.7%) | 54,699 (12,155.3%) |
| 2.0x to 2.9x | 93 (15.1%) | 73 (16.2%) |
| 3.0x to 3.9x | 47 (7.6%) | 184 (40.9%) |
| 4.0x or more | 257 (41.6%) | 125 (27.8%) |
| Total | 617 (100.0%) | 450 (100.0%) |
Real Estate Taxes by Mortgage Status in Honea Path
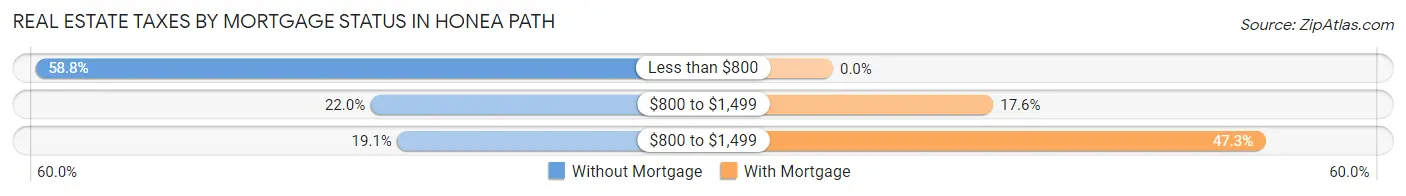
| Property Taxes | Without Mortgage | With Mortgage |
| Less than $800 | 363 (58.8%) | 0 (0.0%) |
| $800 to $1,499 | 136 (22.0%) | 79 (17.6%) |
| $800 to $1,499 | 118 (19.1%) | 213 (47.3%) |
| Total | 617 (100.0%) | 450 (100.0%) |
Health & Disability in Honea Path
Health Insurance Coverage by Age in Honea Path
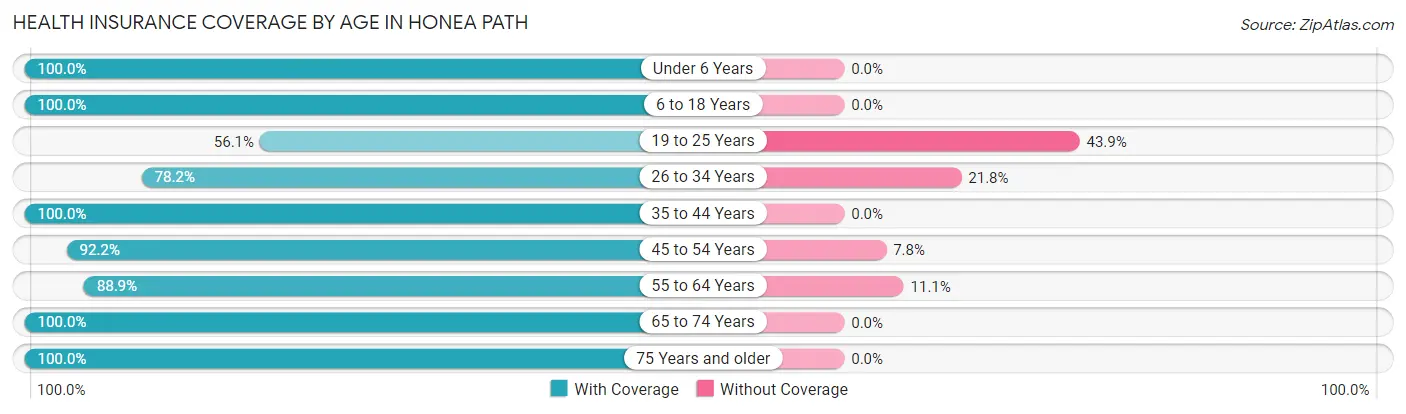
| Age Bracket | With Coverage | Without Coverage |
| Under 6 Years | 244 (100.0%) | 0 (0.0%) |
| 6 to 18 Years | 615 (100.0%) | 0 (0.0%) |
| 19 to 25 Years | 151 (56.1%) | 118 (43.9%) |
| 26 to 34 Years | 265 (78.2%) | 74 (21.8%) |
| 35 to 44 Years | 340 (100.0%) | 0 (0.0%) |
| 45 to 54 Years | 483 (92.2%) | 41 (7.8%) |
| 55 to 64 Years | 587 (88.9%) | 73 (11.1%) |
| 65 to 74 Years | 388 (100.0%) | 0 (0.0%) |
| 75 Years and older | 260 (100.0%) | 0 (0.0%) |
| Total | 3,333 (91.6%) | 306 (8.4%) |
Health Insurance Coverage by Citizenship Status in Honea Path
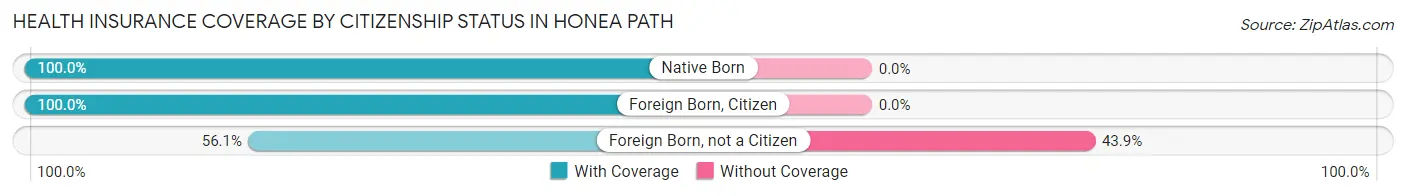
| Citizenship Status | With Coverage | Without Coverage |
| Native Born | 244 (100.0%) | 0 (0.0%) |
| Foreign Born, Citizen | 615 (100.0%) | 0 (0.0%) |
| Foreign Born, not a Citizen | 151 (56.1%) | 118 (43.9%) |
Health Insurance Coverage by Household Income in Honea Path
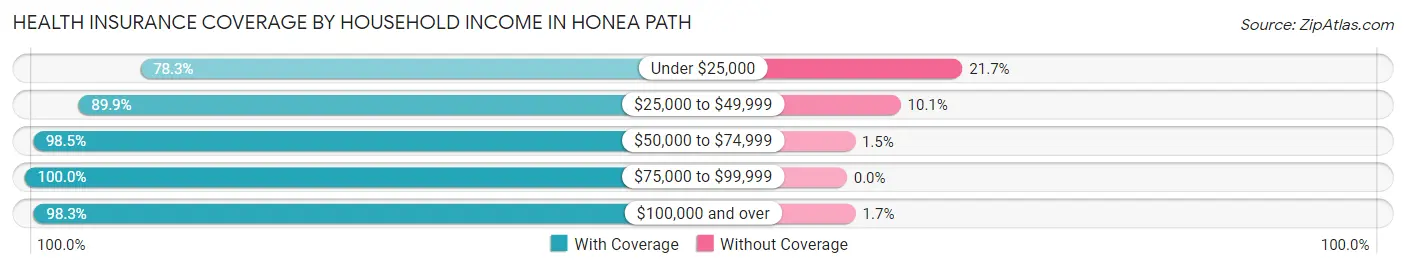
| Household Income | With Coverage | Without Coverage |
| Under $25,000 | 774 (78.3%) | 214 (21.7%) |
| $25,000 to $49,999 | 571 (89.9%) | 64 (10.1%) |
| $50,000 to $74,999 | 966 (98.5%) | 15 (1.5%) |
| $75,000 to $99,999 | 251 (100.0%) | 0 (0.0%) |
| $100,000 and over | 770 (98.3%) | 13 (1.7%) |
Public vs Private Health Insurance Coverage by Age in Honea Path
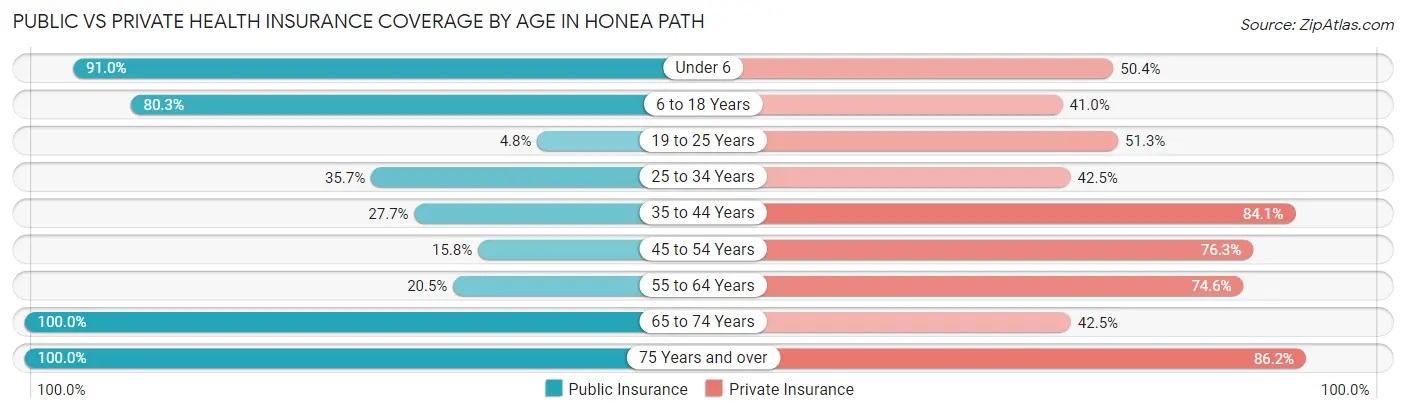
| Age Bracket | Public Insurance | Private Insurance |
| Under 6 | 222 (91.0%) | 123 (50.4%) |
| 6 to 18 Years | 494 (80.3%) | 252 (41.0%) |
| 19 to 25 Years | 13 (4.8%) | 138 (51.3%) |
| 25 to 34 Years | 121 (35.7%) | 144 (42.5%) |
| 35 to 44 Years | 94 (27.7%) | 286 (84.1%) |
| 45 to 54 Years | 83 (15.8%) | 400 (76.3%) |
| 55 to 64 Years | 135 (20.4%) | 492 (74.6%) |
| 65 to 74 Years | 388 (100.0%) | 165 (42.5%) |
| 75 Years and over | 260 (100.0%) | 224 (86.2%) |
| Total | 1,810 (49.7%) | 2,224 (61.1%) |
Disability Status by Sex by Age in Honea Path
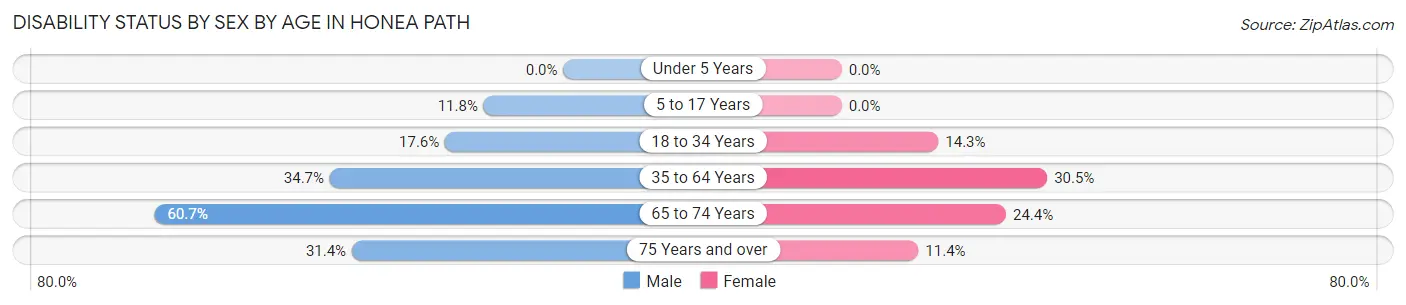
| Age Bracket | Male | Female |
| Under 5 Years | 0 (0.0%) | 0 (0.0%) |
| 5 to 17 Years | 39 (11.8%) | 0 (0.0%) |
| 18 to 34 Years | 59 (17.6%) | 39 (14.3%) |
| 35 to 64 Years | 251 (34.7%) | 244 (30.5%) |
| 65 to 74 Years | 136 (60.7%) | 40 (24.4%) |
| 75 Years and over | 43 (31.4%) | 14 (11.4%) |
Disability Class by Sex by Age in Honea Path
Disability Class: Hearing Difficulty
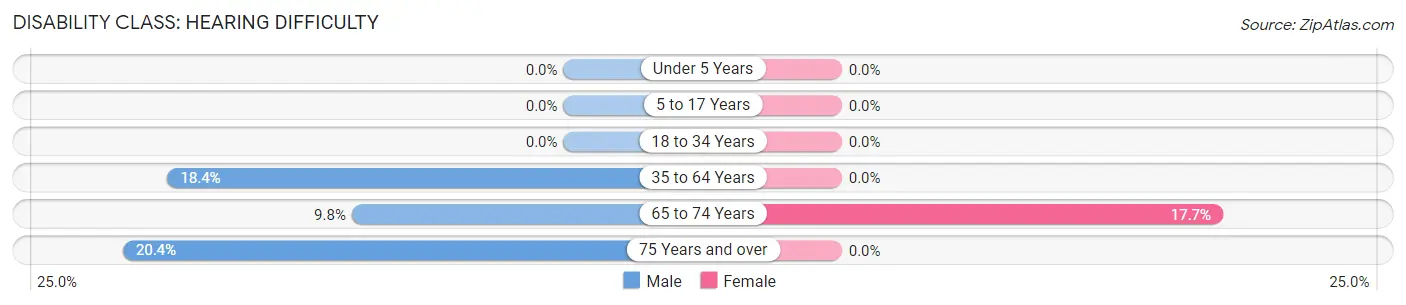
| Age Bracket | Male | Female |
| Under 5 Years | 0 (0.0%) | 0 (0.0%) |
| 5 to 17 Years | 0 (0.0%) | 0 (0.0%) |
| 18 to 34 Years | 0 (0.0%) | 0 (0.0%) |
| 35 to 64 Years | 133 (18.4%) | 0 (0.0%) |
| 65 to 74 Years | 22 (9.8%) | 29 (17.7%) |
| 75 Years and over | 28 (20.4%) | 0 (0.0%) |
Disability Class: Vision Difficulty
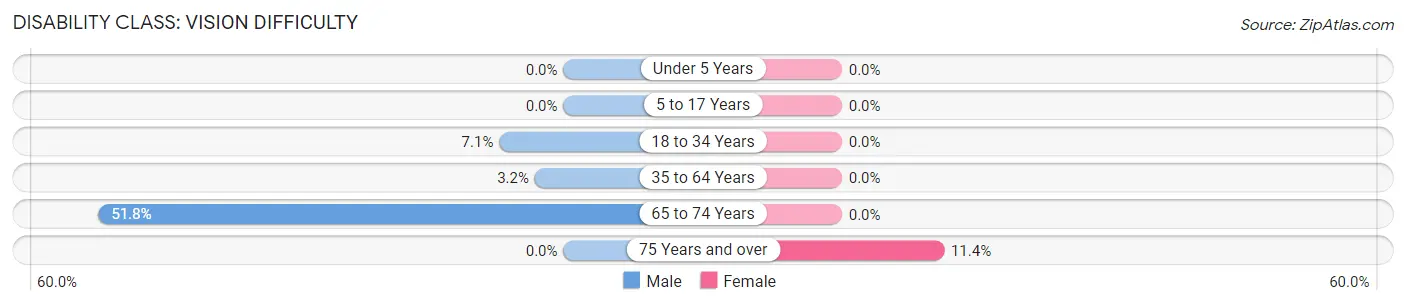
| Age Bracket | Male | Female |
| Under 5 Years | 0 (0.0%) | 0 (0.0%) |
| 5 to 17 Years | 0 (0.0%) | 0 (0.0%) |
| 18 to 34 Years | 24 (7.1%) | 0 (0.0%) |
| 35 to 64 Years | 23 (3.2%) | 0 (0.0%) |
| 65 to 74 Years | 116 (51.8%) | 0 (0.0%) |
| 75 Years and over | 0 (0.0%) | 14 (11.4%) |
Disability Class: Cognitive Difficulty
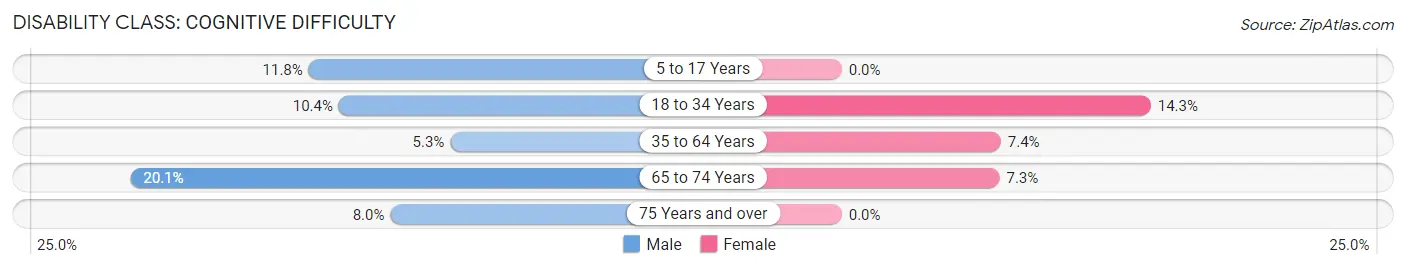
| Age Bracket | Male | Female |
| 5 to 17 Years | 39 (11.8%) | 0 (0.0%) |
| 18 to 34 Years | 35 (10.4%) | 39 (14.3%) |
| 35 to 64 Years | 38 (5.2%) | 59 (7.4%) |
| 65 to 74 Years | 45 (20.1%) | 12 (7.3%) |
| 75 Years and over | 11 (8.0%) | 0 (0.0%) |
Disability Class: Ambulatory Difficulty
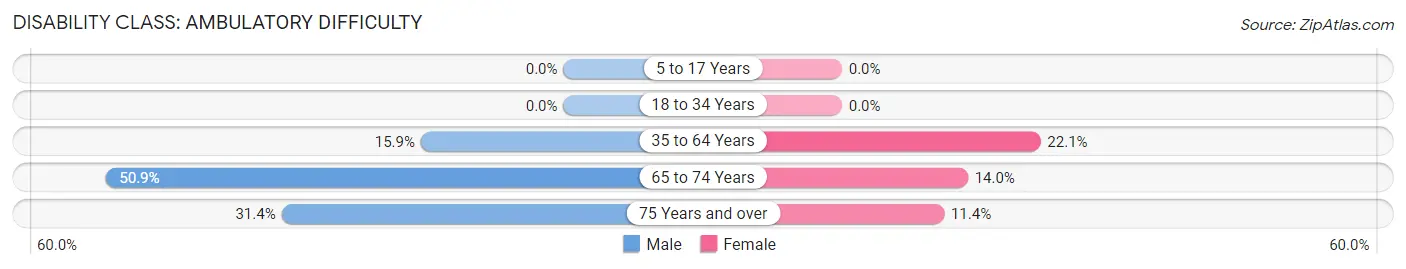
| Age Bracket | Male | Female |
| 5 to 17 Years | 0 (0.0%) | 0 (0.0%) |
| 18 to 34 Years | 0 (0.0%) | 0 (0.0%) |
| 35 to 64 Years | 115 (15.9%) | 177 (22.1%) |
| 65 to 74 Years | 114 (50.9%) | 23 (14.0%) |
| 75 Years and over | 43 (31.4%) | 14 (11.4%) |
Disability Class: Self-Care Difficulty
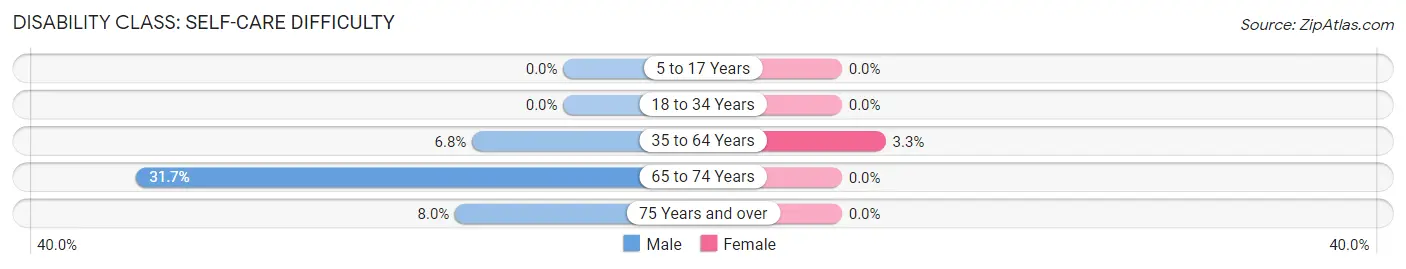
| Age Bracket | Male | Female |
| 5 to 17 Years | 0 (0.0%) | 0 (0.0%) |
| 18 to 34 Years | 0 (0.0%) | 0 (0.0%) |
| 35 to 64 Years | 49 (6.8%) | 26 (3.3%) |
| 65 to 74 Years | 71 (31.7%) | 0 (0.0%) |
| 75 Years and over | 11 (8.0%) | 0 (0.0%) |
Technology Access in Honea Path
Computing Device Access in Honea Path
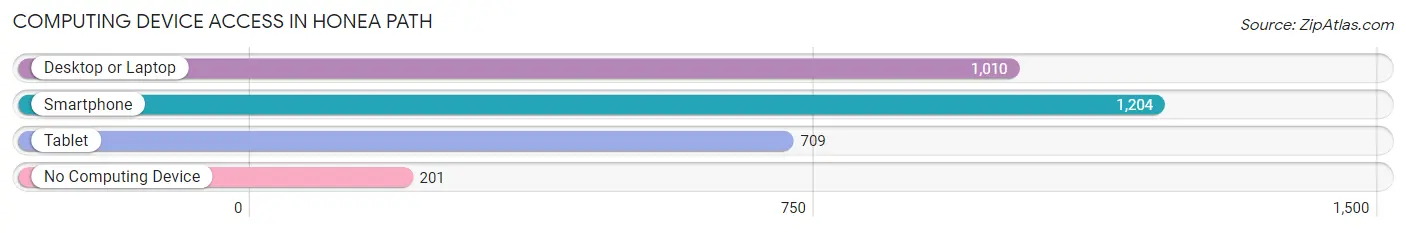
| Device Type | # Households | % Households |
| Desktop or Laptop | 1,010 | 66.9% |
| Smartphone | 1,204 | 79.8% |
| Tablet | 709 | 47.0% |
| No Computing Device | 201 | 13.3% |
| Total | 1,509 | 100.0% |
Internet Access in Honea Path
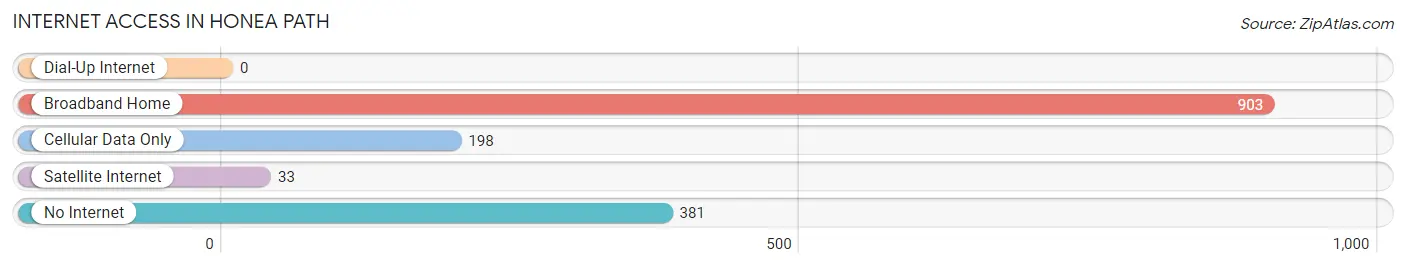
| Internet Type | # Households | % Households |
| Dial-Up Internet | 0 | 0.0% |
| Broadband Home | 903 | 59.8% |
| Cellular Data Only | 198 | 13.1% |
| Satellite Internet | 33 | 2.2% |
| No Internet | 381 | 25.3% |
| Total | 1,509 | 100.0% |
Honea Path Summary
Honea Path is a small town located in Anderson County, South Carolina. It is situated in the foothills of the Blue Ridge Mountains, about 25 miles south of Greenville. The town was founded in 1872 and has a population of approximately 3,000 people.
Geography
Honea Path is located in the foothills of the Blue Ridge Mountains, about 25 miles south of Greenville. The town is situated on the banks of the Chauga River, which flows through the town and provides a source of recreation for the locals. The town is surrounded by rolling hills and forests, providing a picturesque backdrop for the town.
The town is located in the Piedmont region of South Carolina, which is characterized by rolling hills and forests. The climate in the area is mild, with temperatures ranging from the mid-50s in the winter to the mid-80s in the summer.
Economy
Honea Path is a small town with a limited economy. The town is home to several small businesses, including a few restaurants, a grocery store, and a few retail stores. The town also has a few manufacturing plants, including a textile mill and a furniture factory.
The town is also home to several farms, which produce a variety of crops, including corn, soybeans, and cotton. The town is also home to several small businesses, including a few restaurants, a grocery store, and a few retail stores.
Demographics
As of the 2010 census, the population of Honea Path was 3,097. The racial makeup of the town was 79.3% White, 17.2% African American, 0.3% Native American, 0.5% Asian, 0.1% Pacific Islander, and 2.6% from other races. The median household income was $30,938, and the median family income was $37,813.
Conclusion
Honea Path is a small town located in Anderson County, South Carolina. It is situated in the foothills of the Blue Ridge Mountains, about 25 miles south of Greenville. The town was founded in 1872 and has a population of approximately 3,000 people. The town is home to several small businesses, including a few restaurants, a grocery store, and a few retail stores. The town is also home to several farms, which produce a variety of crops, including corn, soybeans, and cotton. The racial makeup of the town is 79.3% White, 17.2% African American, 0.3% Native American, 0.5% Asian, 0.1% Pacific Islander, and 2.6% from other races. The median household income was $30,938, and the median family income was $37,813. Honea Path is a small town with a limited economy, but it is a great place to live and work.
Common Questions
What is Per Capita Income in Honea Path?
Per Capita income in Honea Path is $24,026.
What is the Median Family Income in Honea Path?
Median Family Income in Honea Path is $53,947.
What is the Median Household income in Honea Path?
Median Household Income in Honea Path is $50,375.
What is Income or Wage Gap in Honea Path?
Income or Wage Gap in Honea Path is 12.0%.
Women in Honea Path earn 88.0 cents for every dollar earned by a man.
What is Family Income Deficit in Honea Path?
Family Income Deficit in Honea Path is $18,429.
Families that are below poverty line in Honea Path earn $18,429 less on average than the poverty threshold level.
What is Inequality or Gini Index in Honea Path?
Inequality or Gini Index in Honea Path is 0.43.
What is the Total Population of Honea Path?
Total Population of Honea Path is 3,662.
What is the Total Male Population of Honea Path?
Total Male Population of Honea Path is 1,922.
What is the Total Female Population of Honea Path?
Total Female Population of Honea Path is 1,740.
What is the Ratio of Males per 100 Females in Honea Path?
There are 110.46 Males per 100 Females in Honea Path.
What is the Ratio of Females per 100 Males in Honea Path?
There are 90.53 Females per 100 Males in Honea Path.
What is the Median Population Age in Honea Path?
Median Population Age in Honea Path is 46.5 Years.
What is the Average Family Size in Honea Path
Average Family Size in Honea Path is 3.1 People.
What is the Average Household Size in Honea Path
Average Household Size in Honea Path is 2.4 People.
How Large is the Labor Force in Honea Path?
There are 1,369 People in the Labor Forcein in Honea Path.
What is the Percentage of People in the Labor Force in Honea Path?
48.1% of People are in the Labor Force in Honea Path.
What is the Unemployment Rate in Honea Path?
Unemployment Rate in Honea Path is 7.3%.