Duncan, SC Map & Demographics
Duncan Map
Duncan Overview
$26,367
PER CAPITA INCOME
$67,202
AVG FAMILY INCOME
$58,112
AVG HOUSEHOLD INCOME
4.7%
WAGE / INCOME GAP [ % ]
95.3¢/ $1
WAGE / INCOME GAP [ $ ]
0.39
INEQUALITY / GINI INDEX
4,053
TOTAL POPULATION
1,893
MALE POPULATION
2,160
FEMALE POPULATION
87.64
MALES / 100 FEMALES
114.10
FEMALES / 100 MALES
30.3
MEDIAN AGE
3.0
AVG FAMILY SIZE
2.6
AVG HOUSEHOLD SIZE
2,026
LABOR FORCE [ PEOPLE ]
67.8%
PERCENT IN LABOR FORCE
3.1%
UNEMPLOYMENT RATE
Duncan Zip Codes
Duncan Area Codes
Income in Duncan
Income Overview in Duncan
Per Capita Income in Duncan is $26,367, while median incomes of families and households are $67,202 and $58,112 respectively.
| Characteristic | Number | Measure |
| Per Capita Income | 4,053 | $26,367 |
| Median Family Income | 1,037 | $67,202 |
| Mean Family Income | 1,037 | $67,535 |
| Median Household Income | 1,574 | $58,112 |
| Mean Household Income | 1,574 | $66,920 |
| Income Deficit | 1,037 | $0 |
| Wage / Income Gap (%) | 4,053 | 4.70% |
| Wage / Income Gap ($) | 4,053 | 95.30¢ per $1 |
| Gini / Inequality Index | 4,053 | 0.39 |
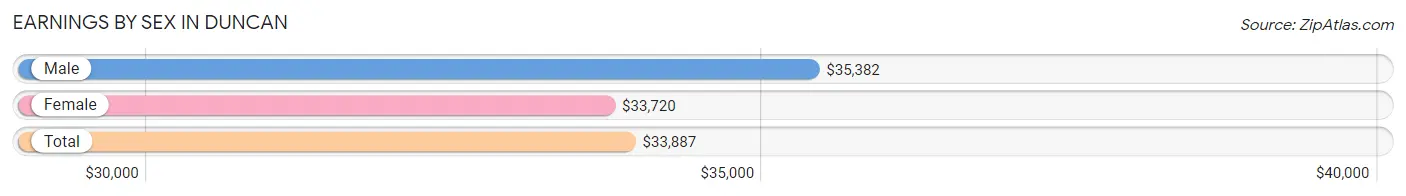
Earnings by Sex in Duncan
Average Earnings in Duncan are $33,887, $35,382 for men and $33,720 for women, a difference of 4.7%.
| Sex | Number | Average Earnings |
| Male | 897 (41.0%) | $35,382 |
| Female | 1,290 (59.0%) | $33,720 |
| Total | 2,187 (100.0%) | $33,887 |
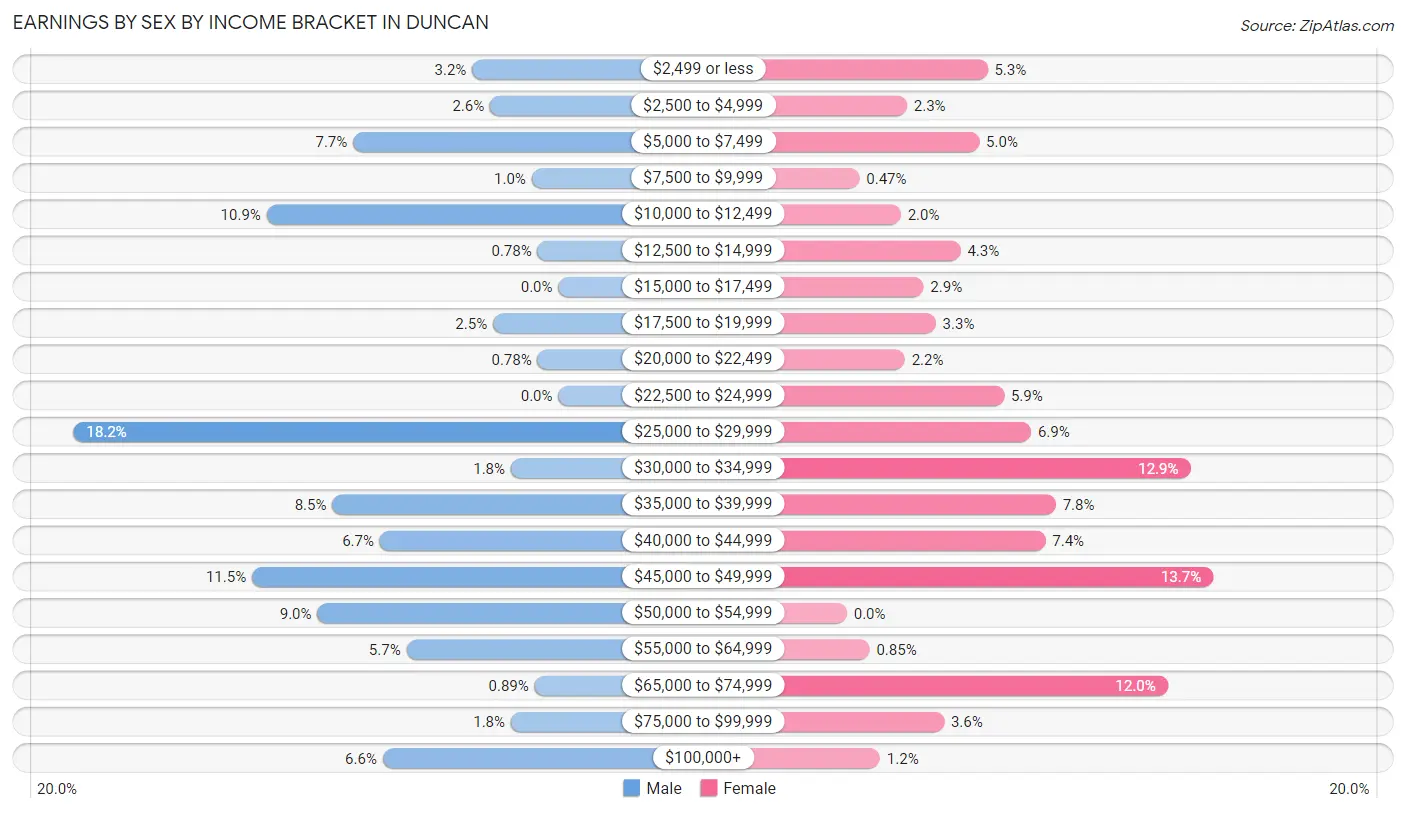
Earnings by Sex by Income Bracket in Duncan
The most common earnings brackets in Duncan are $25,000 to $29,999 for men (163 | 18.2%) and $45,000 to $49,999 for women (177 | 13.7%).
| Income | Male | Female |
| $2,499 or less | 29 (3.2%) | 68 (5.3%) |
| $2,500 to $4,999 | 23 (2.6%) | 29 (2.2%) |
| $5,000 to $7,499 | 69 (7.7%) | 64 (5.0%) |
| $7,500 to $9,999 | 9 (1.0%) | 6 (0.5%) |
| $10,000 to $12,499 | 98 (10.9%) | 26 (2.0%) |
| $12,500 to $14,999 | 7 (0.8%) | 55 (4.3%) |
| $15,000 to $17,499 | 0 (0.0%) | 37 (2.9%) |
| $17,500 to $19,999 | 22 (2.5%) | 43 (3.3%) |
| $20,000 to $22,499 | 7 (0.8%) | 28 (2.2%) |
| $22,500 to $24,999 | 0 (0.0%) | 76 (5.9%) |
| $25,000 to $29,999 | 163 (18.2%) | 89 (6.9%) |
| $30,000 to $34,999 | 16 (1.8%) | 166 (12.9%) |
| $35,000 to $39,999 | 76 (8.5%) | 101 (7.8%) |
| $40,000 to $44,999 | 60 (6.7%) | 96 (7.4%) |
| $45,000 to $49,999 | 103 (11.5%) | 177 (13.7%) |
| $50,000 to $54,999 | 81 (9.0%) | 0 (0.0%) |
| $55,000 to $64,999 | 51 (5.7%) | 11 (0.9%) |
| $65,000 to $74,999 | 8 (0.9%) | 155 (12.0%) |
| $75,000 to $99,999 | 16 (1.8%) | 47 (3.6%) |
| $100,000+ | 59 (6.6%) | 16 (1.2%) |
| Total | 897 (100.0%) | 1,290 (100.0%) |
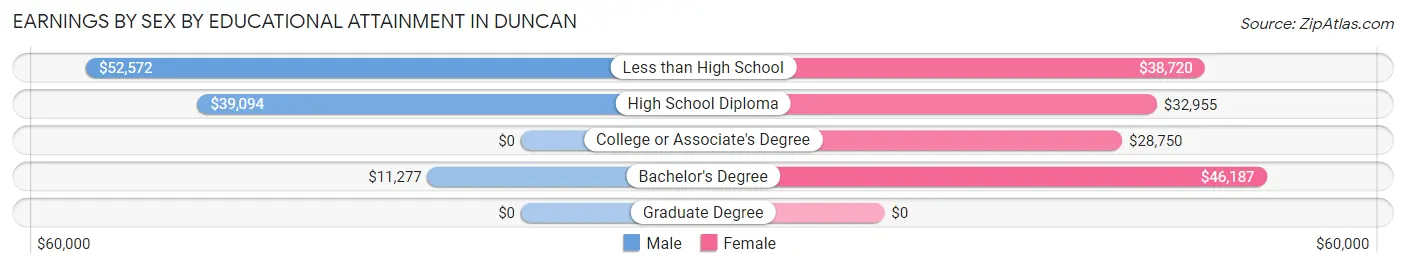
Earnings by Sex by Educational Attainment in Duncan
Average earnings in Duncan are $39,563 for men and $33,979 for women, a difference of 14.1%. Men with an educational attainment of less than high school enjoy the highest average annual earnings of $52,572, while those with bachelor's degree education earn the least with $11,277. Women with an educational attainment of bachelor's degree earn the most with the average annual earnings of $46,187, while those with college or associate's degree education have the smallest earnings of $28,750.
| Educational Attainment | Male Income | Female Income |
| Less than High School | $52,572 | $38,720 |
| High School Diploma | $39,094 | $32,955 |
| College or Associate's Degree | - | - |
| Bachelor's Degree | $11,277 | $46,187 |
| Graduate Degree | - | - |
| Total | $39,563 | $33,979 |
Family Income in Duncan
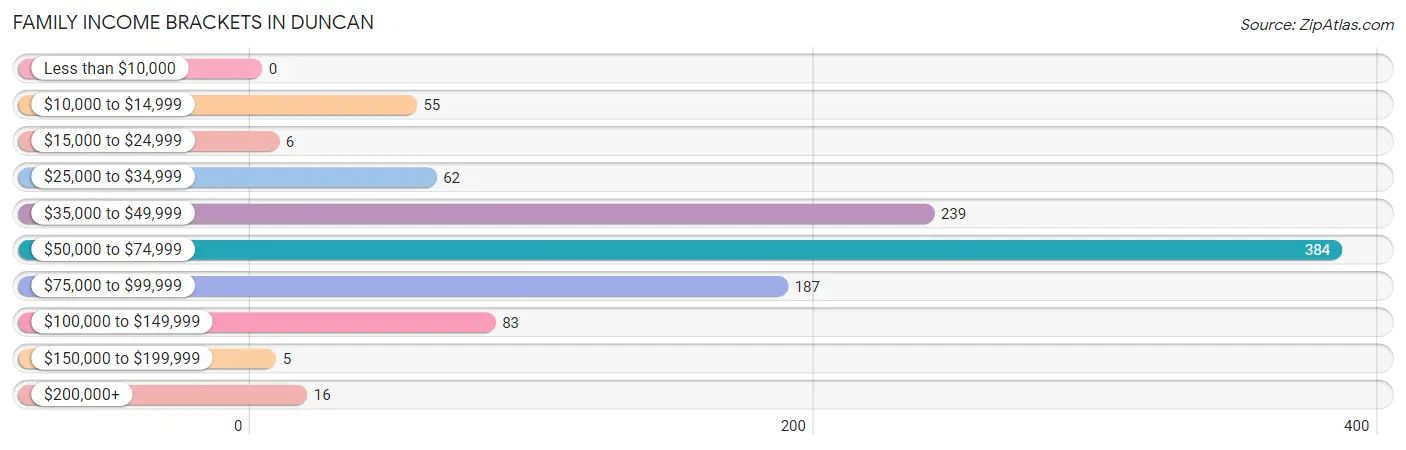
Family Income Brackets in Duncan
According to the Duncan family income data, there are 384 families falling into the $50,000 to $74,999 income range, which is the most common income bracket and makes up 37.0% of all families.
| Income Bracket | # Families | % Families |
| Less than $10,000 | 0 | 0.0% |
| $10,000 to $14,999 | 55 | 5.3% |
| $15,000 to $24,999 | 6 | 0.6% |
| $25,000 to $34,999 | 62 | 6.0% |
| $35,000 to $49,999 | 239 | 23.0% |
| $50,000 to $74,999 | 384 | 37.0% |
| $75,000 to $99,999 | 187 | 18.0% |
| $100,000 to $149,999 | 83 | 8.0% |
| $150,000 to $199,999 | 5 | 0.5% |
| $200,000+ | 16 | 1.5% |
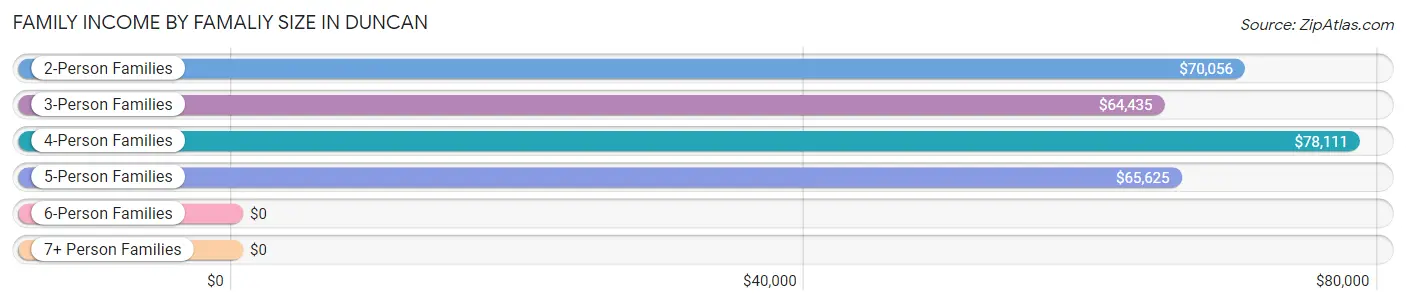
Family Income by Famaliy Size in Duncan
4-person families (274 | 26.4%) account for the highest median family income in Duncan with $78,111 per family, while 2-person families (530 | 51.1%) have the highest median income of $35,028 per family member.
| Income Bracket | # Families | Median Income |
| 2-Person Families | 530 (51.1%) | $70,056 |
| 3-Person Families | 175 (16.9%) | $64,435 |
| 4-Person Families | 274 (26.4%) | $78,111 |
| 5-Person Families | 58 (5.6%) | $65,625 |
| 6-Person Families | 0 (0.0%) | $0 |
| 7+ Person Families | 0 (0.0%) | $0 |
| Total | 1,037 (100.0%) | $67,202 |
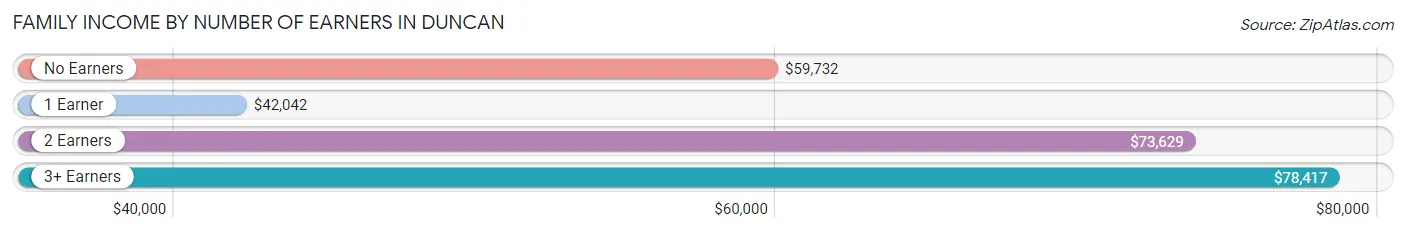
Family Income by Number of Earners in Duncan
The median family income in Duncan is $67,202, with families comprising 3+ earners (91) having the highest median family income of $78,417, while families with 1 earner (417) have the lowest median family income of $42,042, accounting for 8.8% and 40.2% of families, respectively.
| Number of Earners | # Families | Median Income |
| No Earners | 35 (3.4%) | $59,732 |
| 1 Earner | 417 (40.2%) | $42,042 |
| 2 Earners | 494 (47.6%) | $73,629 |
| 3+ Earners | 91 (8.8%) | $78,417 |
| Total | 1,037 (100.0%) | $67,202 |
Household Income in Duncan
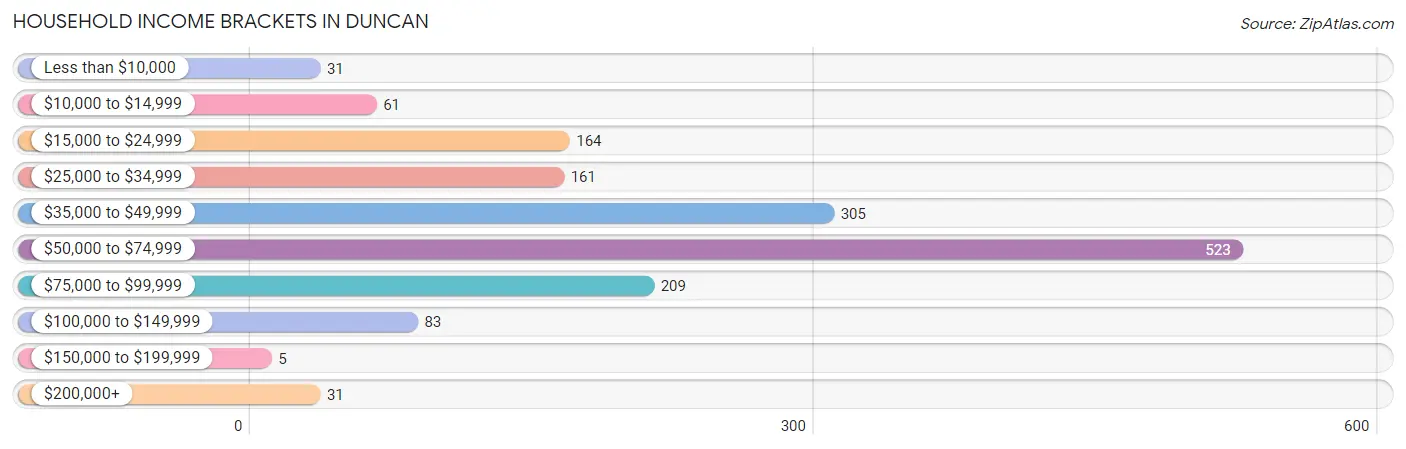
Household Income Brackets in Duncan
With 523 households falling in the category, the $50,000 to $74,999 income range is the most frequent in Duncan, accounting for 33.2% of all households. In contrast, only 5 households (0.3%) fall into the $150,000 to $199,999 income bracket, making it the least populous group.
| Income Bracket | # Households | % Households |
| Less than $10,000 | 31 | 2.0% |
| $10,000 to $14,999 | 61 | 3.9% |
| $15,000 to $24,999 | 164 | 10.4% |
| $25,000 to $34,999 | 161 | 10.2% |
| $35,000 to $49,999 | 305 | 19.4% |
| $50,000 to $74,999 | 523 | 33.2% |
| $75,000 to $99,999 | 209 | 13.3% |
| $100,000 to $149,999 | 83 | 5.3% |
| $150,000 to $199,999 | 5 | 0.3% |
| $200,000+ | 31 | 2.0% |
Household Income by Householder Age in Duncan
The median household income in Duncan is $58,112, with the highest median household income of $67,401 found in the 25 to 44 years age bracket for the primary householder. A total of 869 households (55.2%) fall into this category. Meanwhile, the 15 to 24 years age bracket for the primary householder has the lowest median household income of $0, with 16 households (1.0%) in this group.
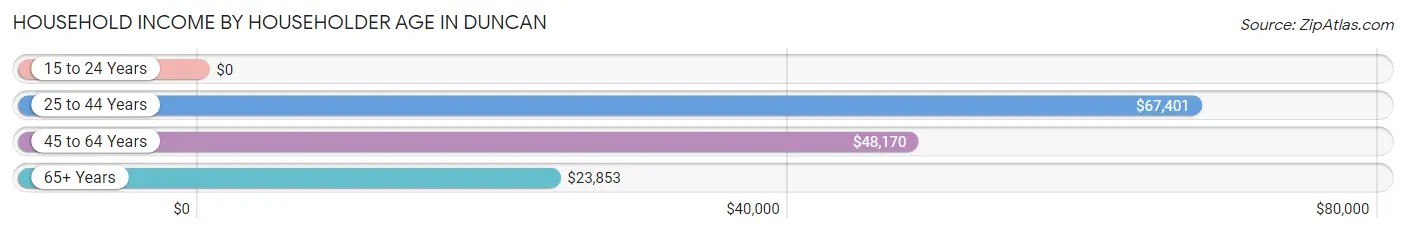
| Income Bracket | # Households | Median Income |
| 15 to 24 Years | 16 (1.0%) | $0 |
| 25 to 44 Years | 869 (55.2%) | $67,401 |
| 45 to 64 Years | 428 (27.2%) | $48,170 |
| 65+ Years | 261 (16.6%) | $23,853 |
| Total | 1,574 (100.0%) | $58,112 |
Poverty in Duncan
Income Below Poverty by Sex and Age in Duncan
With 23.6% poverty level for males and 14.0% for females among the residents of Duncan, 6 to 11 year old males and 12 to 14 year old females are the most vulnerable to poverty, with 160 males (51.1%) and 7 females (100.0%) in their respective age groups living below the poverty level.
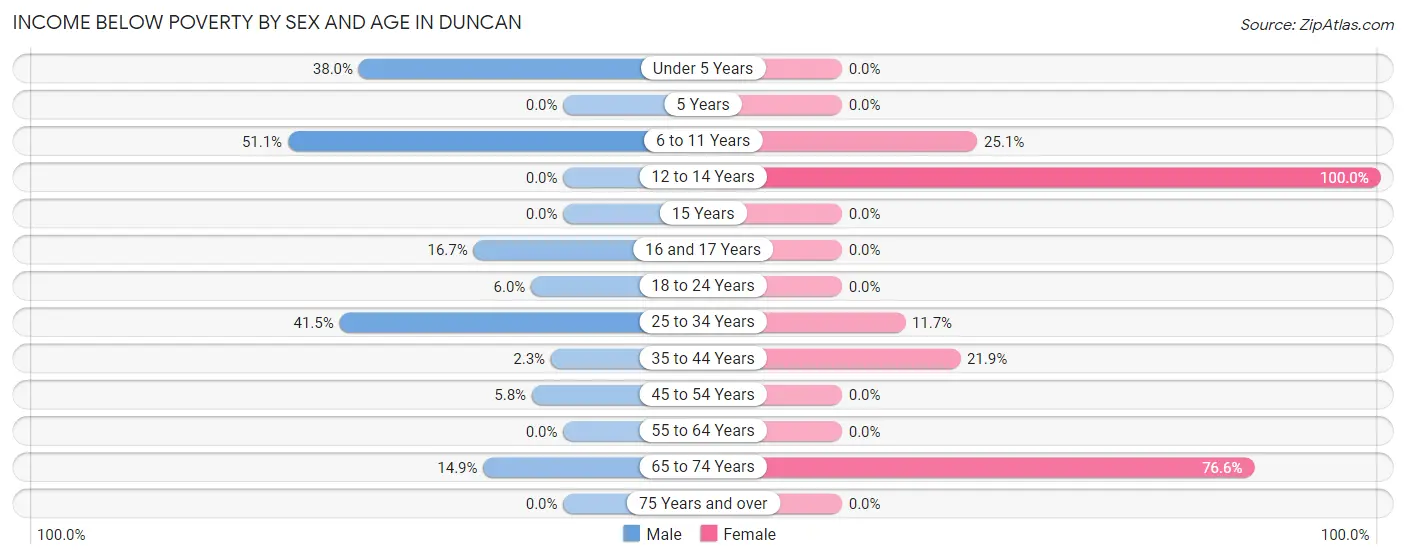
| Age Bracket | Male | Female |
| Under 5 Years | 41 (38.0%) | 0 (0.0%) |
| 5 Years | 0 (0.0%) | 0 (0.0%) |
| 6 to 11 Years | 160 (51.1%) | 49 (25.1%) |
| 12 to 14 Years | 0 (0.0%) | 7 (100.0%) |
| 15 Years | 0 (0.0%) | 0 (0.0%) |
| 16 and 17 Years | 8 (16.7%) | 0 (0.0%) |
| 18 to 24 Years | 8 (6.0%) | 0 (0.0%) |
| 25 to 34 Years | 189 (41.5%) | 73 (11.7%) |
| 35 to 44 Years | 6 (2.3%) | 61 (21.9%) |
| 45 to 54 Years | 7 (5.8%) | 0 (0.0%) |
| 55 to 64 Years | 0 (0.0%) | 0 (0.0%) |
| 65 to 74 Years | 15 (14.8%) | 111 (76.5%) |
| 75 Years and over | 0 (0.0%) | 0 (0.0%) |
| Total | 434 (23.6%) | 301 (14.0%) |
Income Above Poverty by Sex and Age in Duncan
According to the poverty statistics in Duncan, males aged 12 to 14 years and females aged under 5 years are the age groups that are most secure financially, with 100.0% of males and 100.0% of females in these age groups living above the poverty line.
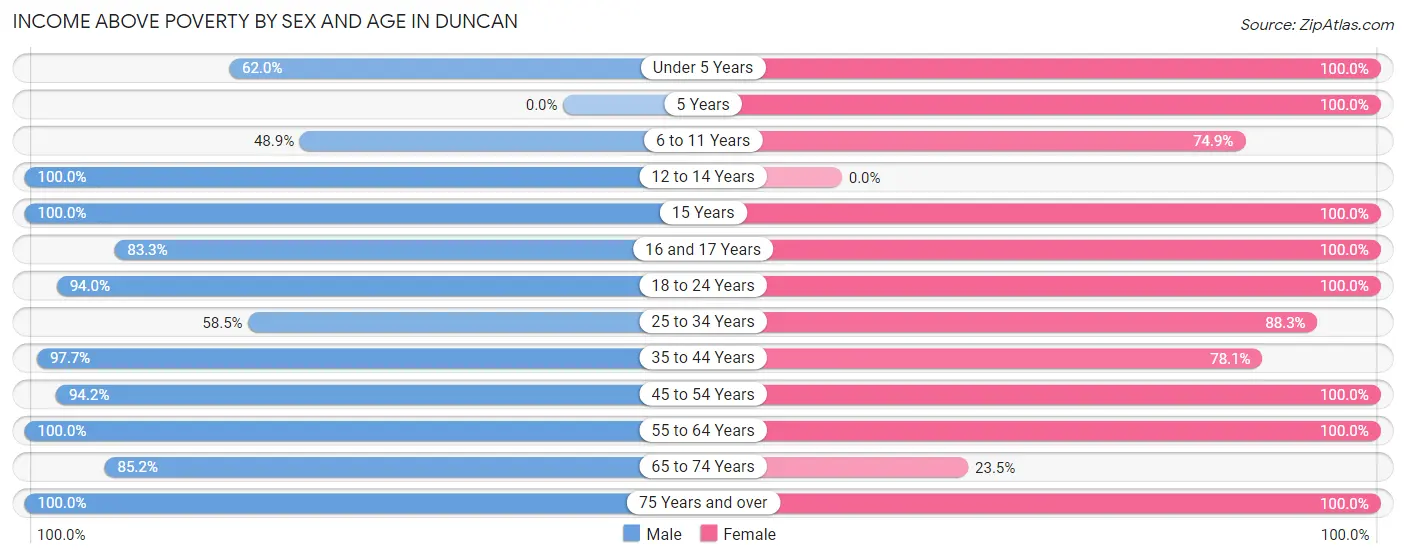
| Age Bracket | Male | Female |
| Under 5 Years | 67 (62.0%) | 167 (100.0%) |
| 5 Years | 0 (0.0%) | 69 (100.0%) |
| 6 to 11 Years | 153 (48.9%) | 146 (74.9%) |
| 12 to 14 Years | 121 (100.0%) | 0 (0.0%) |
| 15 Years | 27 (100.0%) | 6 (100.0%) |
| 16 and 17 Years | 40 (83.3%) | 13 (100.0%) |
| 18 to 24 Years | 126 (94.0%) | 104 (100.0%) |
| 25 to 34 Years | 266 (58.5%) | 550 (88.3%) |
| 35 to 44 Years | 255 (97.7%) | 217 (78.1%) |
| 45 to 54 Years | 113 (94.2%) | 107 (100.0%) |
| 55 to 64 Years | 133 (100.0%) | 293 (100.0%) |
| 65 to 74 Years | 86 (85.2%) | 34 (23.4%) |
| 75 Years and over | 19 (100.0%) | 146 (100.0%) |
| Total | 1,406 (76.4%) | 1,852 (86.0%) |
Income Below Poverty Among Married-Couple Families in Duncan
The poverty statistics for married-couple families in Duncan show that 1.1% or 6 of the total 550 families live below the poverty line. Families with 1 or 2 children have the highest poverty rate of 2.0%, comprising of 6 families. On the other hand, families with no children have the lowest poverty rate of 0.0%, which includes 0 families.
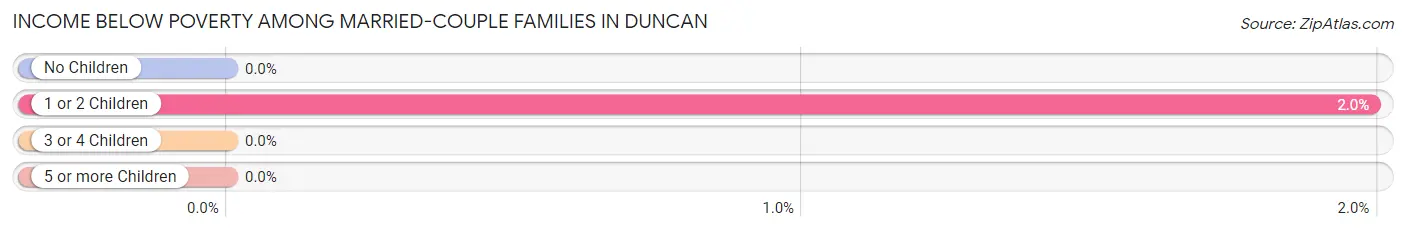
| Children | Above Poverty | Below Poverty |
| No Children | 229 (100.0%) | 0 (0.0%) |
| 1 or 2 Children | 295 (98.0%) | 6 (2.0%) |
| 3 or 4 Children | 20 (100.0%) | 0 (0.0%) |
| 5 or more Children | 0 (0.0%) | 0 (0.0%) |
| Total | 544 (98.9%) | 6 (1.1%) |
Income Below Poverty Among Single-Parent Households in Duncan
According to the poverty data in Duncan, 37.4% or 52 single-father households and 15.8% or 55 single-mother households are living below the poverty line. Among single-father households, those with 3 or 4 children have the highest poverty rate, with 52 households (98.1%) experiencing poverty. Likewise, among single-mother households, those with 1 or 2 children have the highest poverty rate, with 55 households (20.5%) falling below the poverty line.
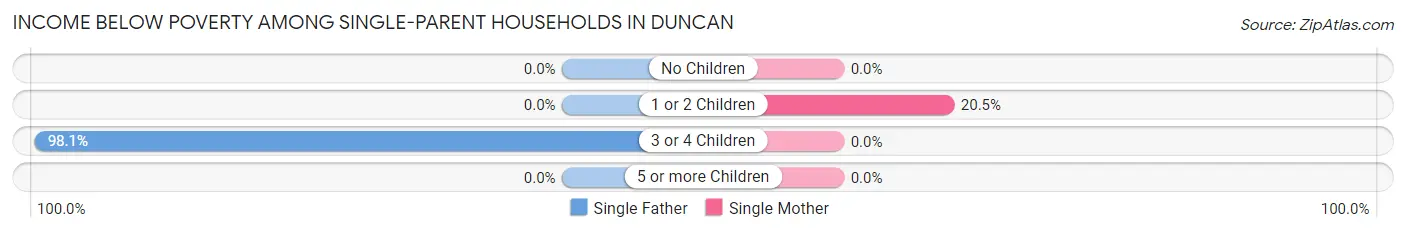
| Children | Single Father | Single Mother |
| No Children | 0 (0.0%) | 0 (0.0%) |
| 1 or 2 Children | 0 (0.0%) | 55 (20.5%) |
| 3 or 4 Children | 52 (98.1%) | 0 (0.0%) |
| 5 or more Children | 0 (0.0%) | 0 (0.0%) |
| Total | 52 (37.4%) | 55 (15.8%) |
Income Below Poverty Among Married-Couple vs Single-Parent Households in Duncan
The poverty data for Duncan shows that 6 of the married-couple family households (1.1%) and 107 of the single-parent households (22.0%) are living below the poverty level. Within the married-couple family households, those with 1 or 2 children have the highest poverty rate, with 6 households (2.0%) falling below the poverty line. Among the single-parent households, those with 3 or 4 children have the highest poverty rate, with 52 household (98.1%) living below poverty.
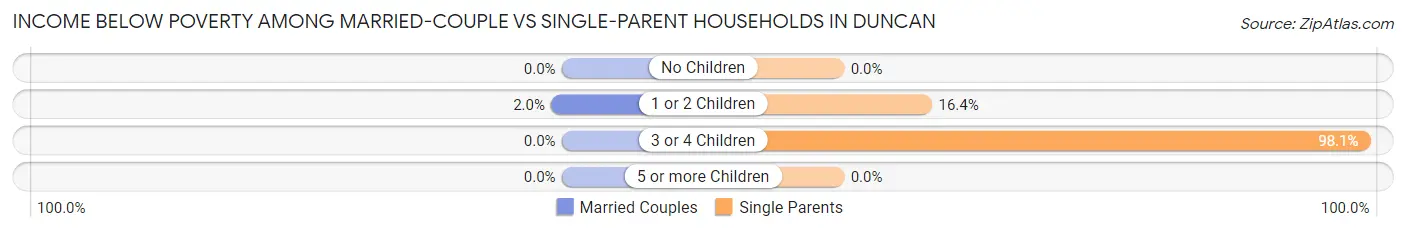
| Children | Married-Couple Families | Single-Parent Households |
| No Children | 0 (0.0%) | 0 (0.0%) |
| 1 or 2 Children | 6 (2.0%) | 55 (16.4%) |
| 3 or 4 Children | 0 (0.0%) | 52 (98.1%) |
| 5 or more Children | 0 (0.0%) | 0 (0.0%) |
| Total | 6 (1.1%) | 107 (22.0%) |
Race in Duncan
The most populous races in Duncan are White / Caucasian (2,419 | 59.7%), Black / African American (1,566 | 38.6%), and Hispanic or Latino (367 | 9.1%).
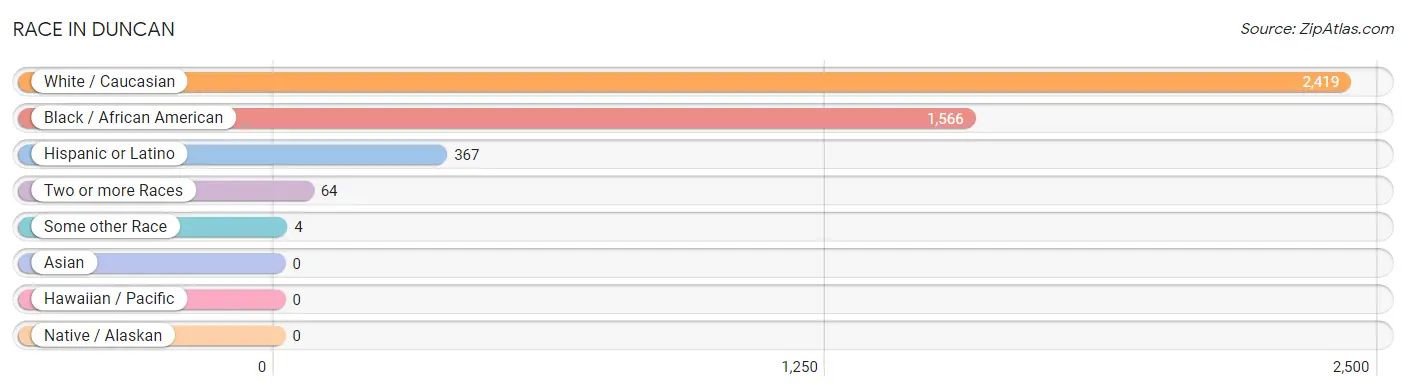
| Race | # Population | % Population |
| Asian | 0 | 0.0% |
| Black / African American | 1,566 | 38.6% |
| Hawaiian / Pacific | 0 | 0.0% |
| Hispanic or Latino | 367 | 9.1% |
| Native / Alaskan | 0 | 0.0% |
| White / Caucasian | 2,419 | 59.7% |
| Two or more Races | 64 | 1.6% |
| Some other Race | 4 | 0.1% |
| Total | 4,053 | 100.0% |
Ancestry in Duncan
The most populous ancestries reported in Duncan are English (331 | 8.2%), German (300 | 7.4%), Mexican (269 | 6.6%), Irish (216 | 5.3%), and African (182 | 4.5%), together accounting for 32.0% of all Duncan residents.
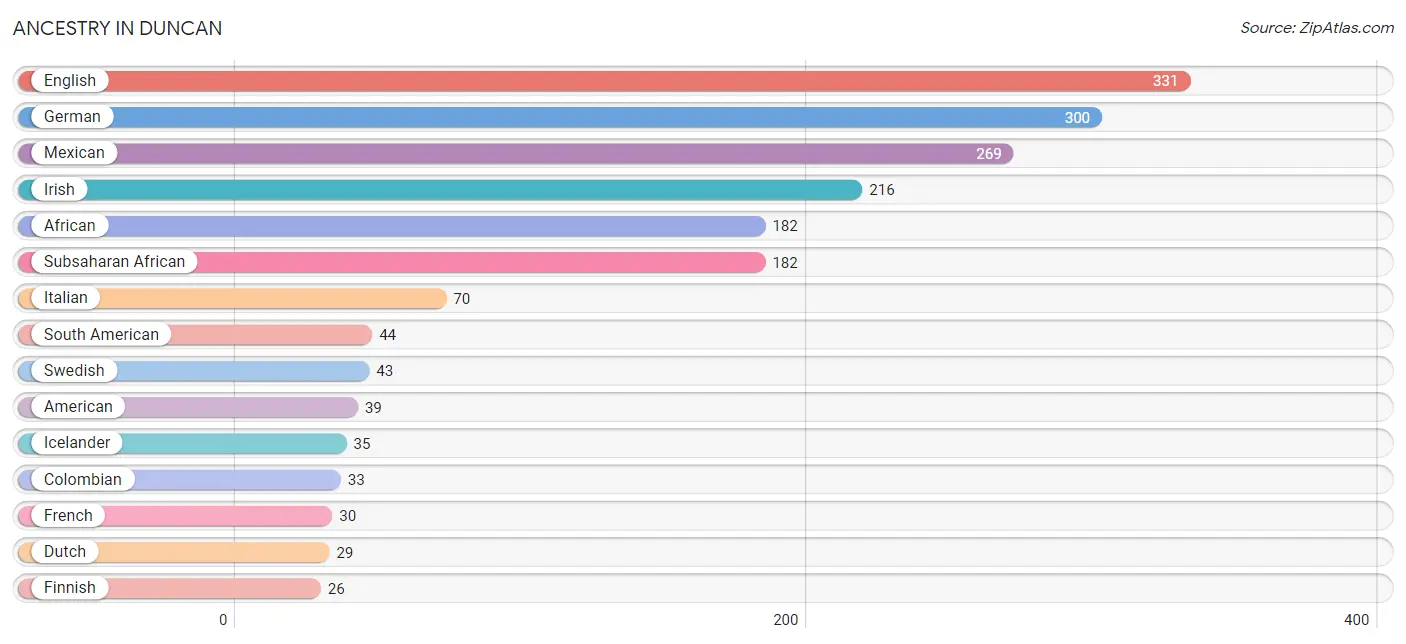
| Ancestry | # Population | % Population |
| African | 182 | 4.5% |
| American | 39 | 1.0% |
| Central American | 1 | 0.0% |
| Colombian | 33 | 0.8% |
| Cuban | 1 | 0.0% |
| Dutch | 29 | 0.7% |
| Ecuadorian | 11 | 0.3% |
| English | 331 | 8.2% |
| Finnish | 26 | 0.6% |
| French | 30 | 0.7% |
| German | 300 | 7.4% |
| Greek | 22 | 0.5% |
| Guatemalan | 1 | 0.0% |
| Icelander | 35 | 0.9% |
| Irish | 216 | 5.3% |
| Italian | 70 | 1.7% |
| Mexican | 269 | 6.6% |
| Russian | 1 | 0.0% |
| Scottish | 17 | 0.4% |
| South American | 44 | 1.1% |
| Subsaharan African | 182 | 4.5% |
| Swedish | 43 | 1.1% |
| Welsh | 26 | 0.6% | View All 23 Rows |
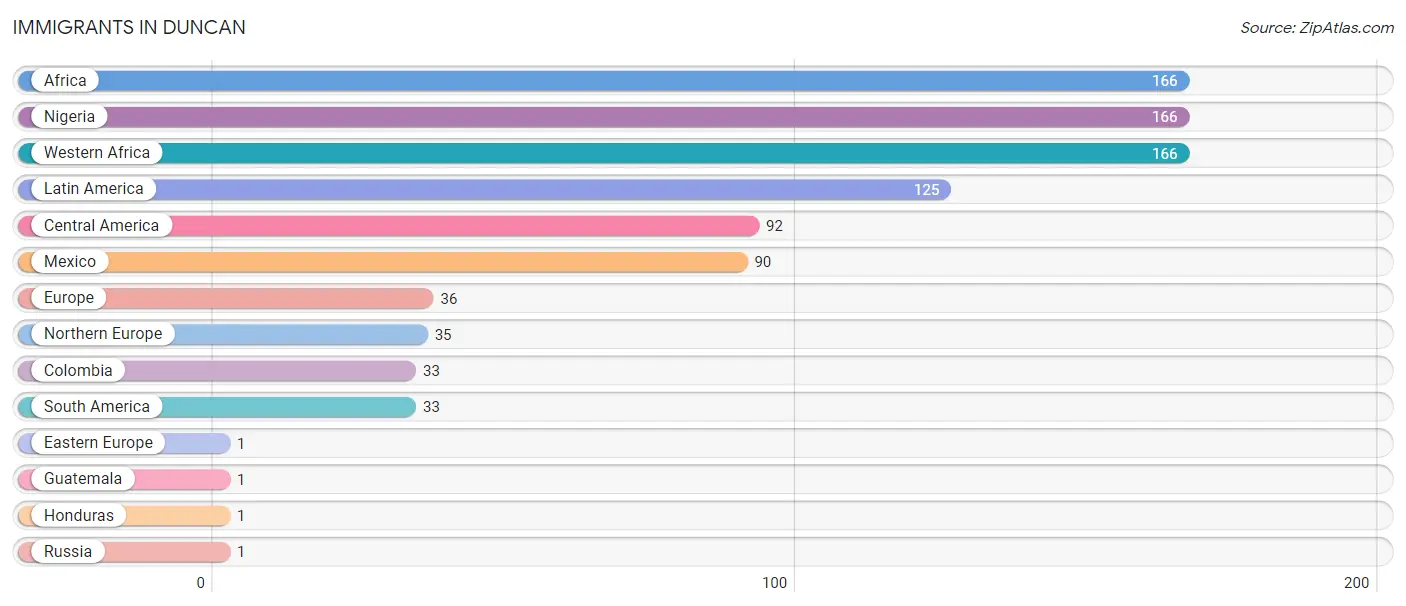
Immigrants in Duncan
The most numerous immigrant groups reported in Duncan came from Africa (166 | 4.1%), Nigeria (166 | 4.1%), Western Africa (166 | 4.1%), Latin America (125 | 3.1%), and Central America (92 | 2.3%), together accounting for 17.6% of all Duncan residents.
| Immigration Origin | # Population | % Population |
| Africa | 166 | 4.1% |
| Central America | 92 | 2.3% |
| Colombia | 33 | 0.8% |
| Eastern Europe | 1 | 0.0% |
| Europe | 36 | 0.9% |
| Guatemala | 1 | 0.0% |
| Honduras | 1 | 0.0% |
| Latin America | 125 | 3.1% |
| Mexico | 90 | 2.2% |
| Nigeria | 166 | 4.1% |
| Northern Europe | 35 | 0.9% |
| Russia | 1 | 0.0% |
| South America | 33 | 0.8% |
| Western Africa | 166 | 4.1% | View All 14 Rows |
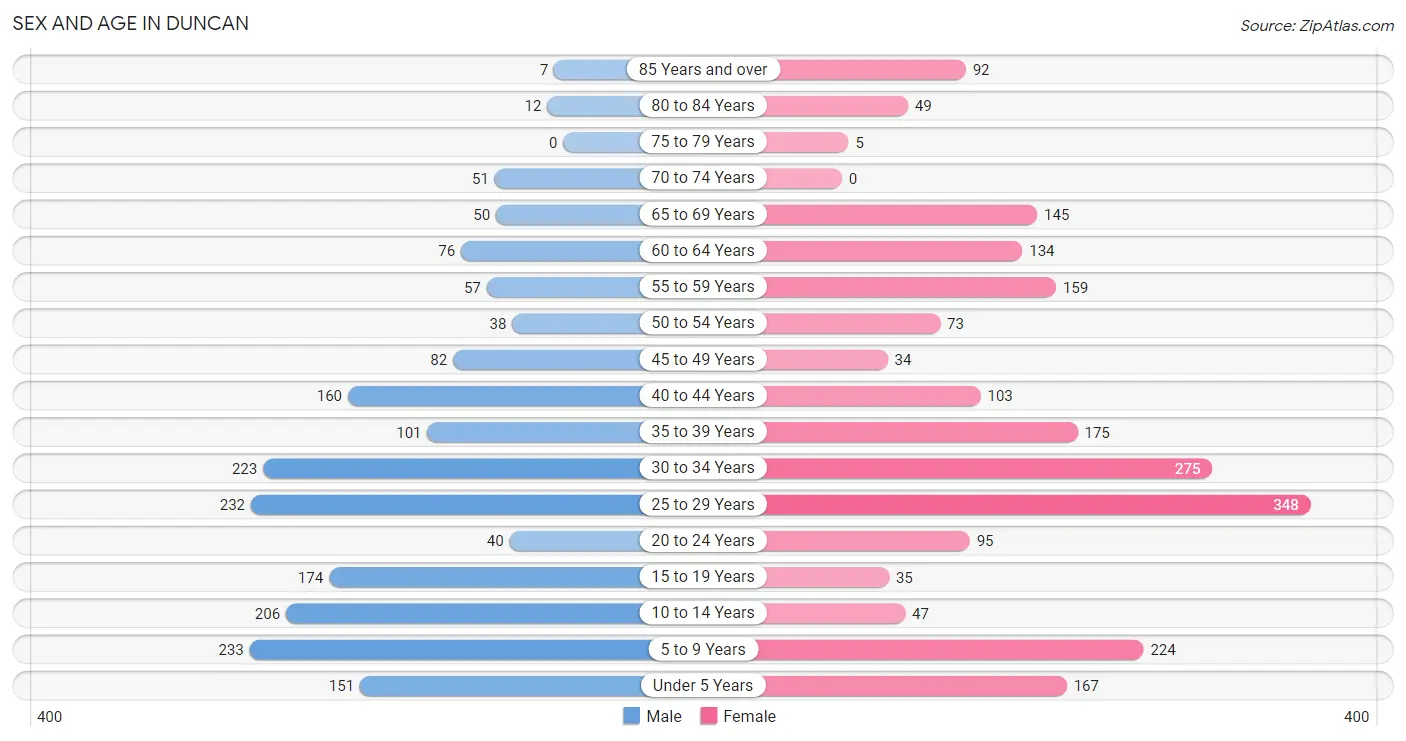
Sex and Age in Duncan
Sex and Age in Duncan
The most populous age groups in Duncan are 5 to 9 Years (233 | 12.3%) for men and 25 to 29 Years (348 | 16.1%) for women.
| Age Bracket | Male | Female |
| Under 5 Years | 151 (8.0%) | 167 (7.7%) |
| 5 to 9 Years | 233 (12.3%) | 224 (10.4%) |
| 10 to 14 Years | 206 (10.9%) | 47 (2.2%) |
| 15 to 19 Years | 174 (9.2%) | 35 (1.6%) |
| 20 to 24 Years | 40 (2.1%) | 95 (4.4%) |
| 25 to 29 Years | 232 (12.3%) | 348 (16.1%) |
| 30 to 34 Years | 223 (11.8%) | 275 (12.7%) |
| 35 to 39 Years | 101 (5.3%) | 175 (8.1%) |
| 40 to 44 Years | 160 (8.5%) | 103 (4.8%) |
| 45 to 49 Years | 82 (4.3%) | 34 (1.6%) |
| 50 to 54 Years | 38 (2.0%) | 73 (3.4%) |
| 55 to 59 Years | 57 (3.0%) | 159 (7.4%) |
| 60 to 64 Years | 76 (4.0%) | 134 (6.2%) |
| 65 to 69 Years | 50 (2.6%) | 145 (6.7%) |
| 70 to 74 Years | 51 (2.7%) | 0 (0.0%) |
| 75 to 79 Years | 0 (0.0%) | 5 (0.2%) |
| 80 to 84 Years | 12 (0.6%) | 49 (2.3%) |
| 85 Years and over | 7 (0.4%) | 92 (4.3%) |
| Total | 1,893 (100.0%) | 2,160 (100.0%) |
Families and Households in Duncan
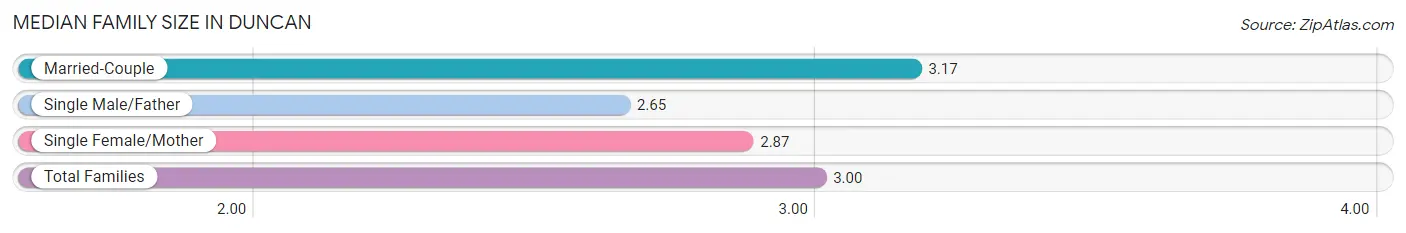
Median Family Size in Duncan
The median family size in Duncan is 3.00 persons per family, with married-couple families (550 | 53.0%) accounting for the largest median family size of 3.17 persons per family. On the other hand, single male/father families (139 | 13.4%) represent the smallest median family size with 2.65 persons per family.
| Family Type | # Families | Family Size |
| Married-Couple | 550 (53.0%) | 3.17 |
| Single Male/Father | 139 (13.4%) | 2.65 |
| Single Female/Mother | 348 (33.6%) | 2.87 |
| Total Families | 1,037 (100.0%) | 3.00 |
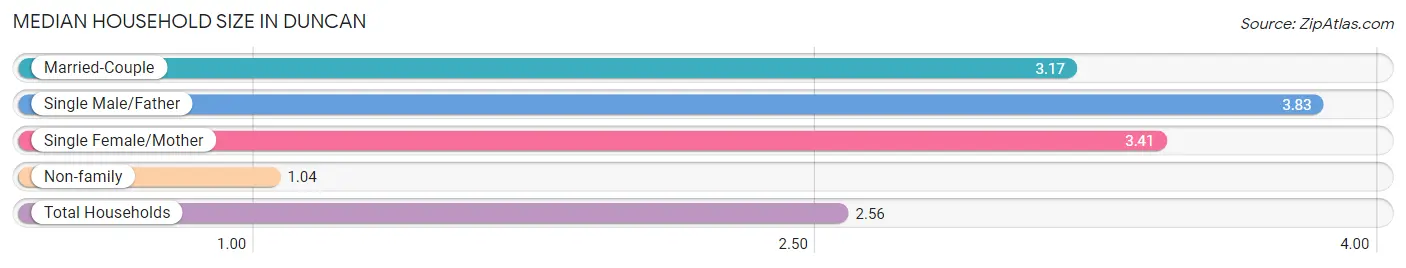
Median Household Size in Duncan
The median household size in Duncan is 2.56 persons per household, with single male/father households (139 | 8.8%) accounting for the largest median household size of 3.83 persons per household. non-family households (537 | 34.1%) represent the smallest median household size with 1.04 persons per household.
| Household Type | # Households | Household Size |
| Married-Couple | 550 (34.9%) | 3.17 |
| Single Male/Father | 139 (8.8%) | 3.83 |
| Single Female/Mother | 348 (22.1%) | 3.41 |
| Non-family | 537 (34.1%) | 1.04 |
| Total Households | 1,574 (100.0%) | 2.56 |
Household Size by Marriage Status in Duncan
Out of a total of 1,574 households in Duncan, 1,037 (65.9%) are family households, while 537 (34.1%) are nonfamily households. The most numerous type of family households are 3-person households, comprising 380, and the most common type of nonfamily households are 1-person households, comprising 520.
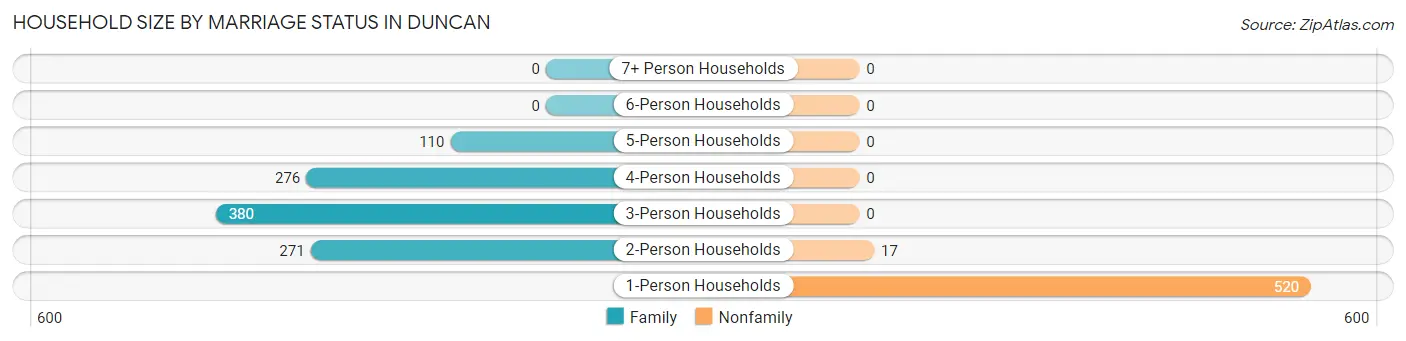
| Household Size | Family Households | Nonfamily Households |
| 1-Person Households | - | 520 (33.0%) |
| 2-Person Households | 271 (17.2%) | 17 (1.1%) |
| 3-Person Households | 380 (24.1%) | 0 (0.0%) |
| 4-Person Households | 276 (17.5%) | 0 (0.0%) |
| 5-Person Households | 110 (7.0%) | 0 (0.0%) |
| 6-Person Households | 0 (0.0%) | 0 (0.0%) |
| 7+ Person Households | 0 (0.0%) | 0 (0.0%) |
| Total | 1,037 (65.9%) | 537 (34.1%) |
Female Fertility in Duncan
Fertility by Age in Duncan
Average fertility rate in Duncan is 137.0 births per 1,000 women. Women in the age bracket of 20 to 34 years have the highest fertility rate with 208.0 births per 1,000 women. Women in the age bracket of 20 to 34 years acount for 100.0% of all women with births.
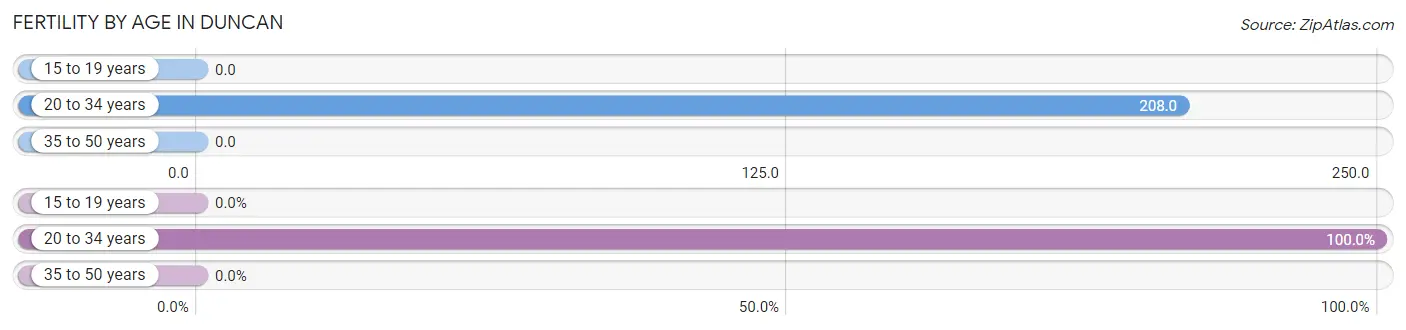
| Age Bracket | Women with Births | Births / 1,000 Women |
| 15 to 19 years | 0 (0.0%) | 0.0 |
| 20 to 34 years | 149 (100.0%) | 208.0 |
| 35 to 50 years | 0 (0.0%) | 0.0 |
| Total | 149 (100.0%) | 137.0 |
Fertility by Age by Marriage Status in Duncan
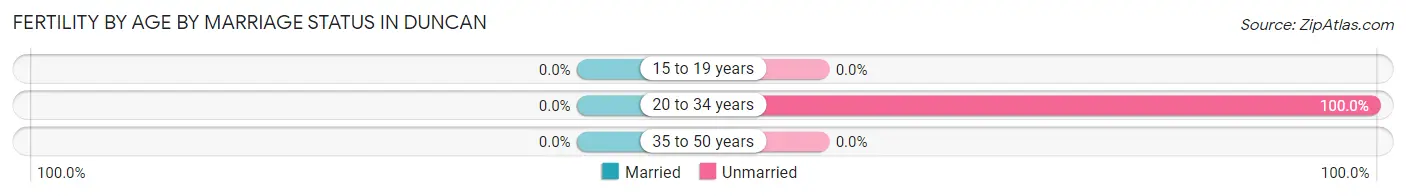
| Age Bracket | Married | Unmarried |
| 15 to 19 years | 0 (0.0%) | 0 (0.0%) |
| 20 to 34 years | 0 (0.0%) | 149 (100.0%) |
| 35 to 50 years | 0 (0.0%) | 0 (0.0%) |
| Total | 0 (0.0%) | 149 (100.0%) |
Fertility by Education in Duncan
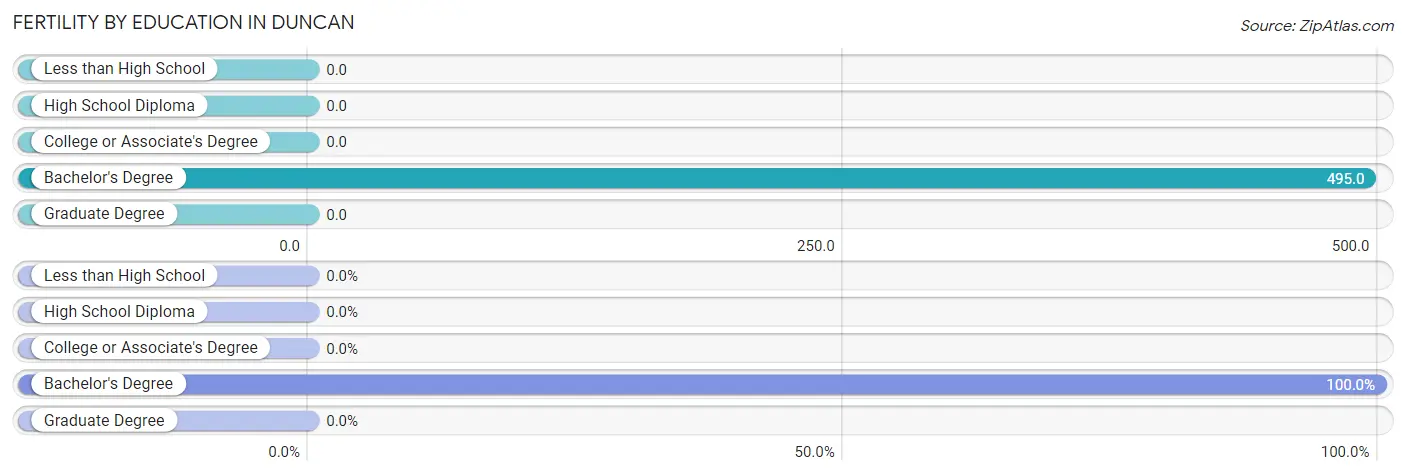
| Educational Attainment | Women with Births | Births / 1,000 Women |
| Less than High School | 0 (0.0%) | 0.0 |
| High School Diploma | 0 (0.0%) | 0.0 |
| College or Associate's Degree | 0 (0.0%) | 0.0 |
| Bachelor's Degree | 149 (100.0%) | 495.0 |
| Graduate Degree | 0 (0.0%) | 0.0 |
| Total | 149 (100.0%) | 137.0 |
Fertility by Education by Marriage Status in Duncan
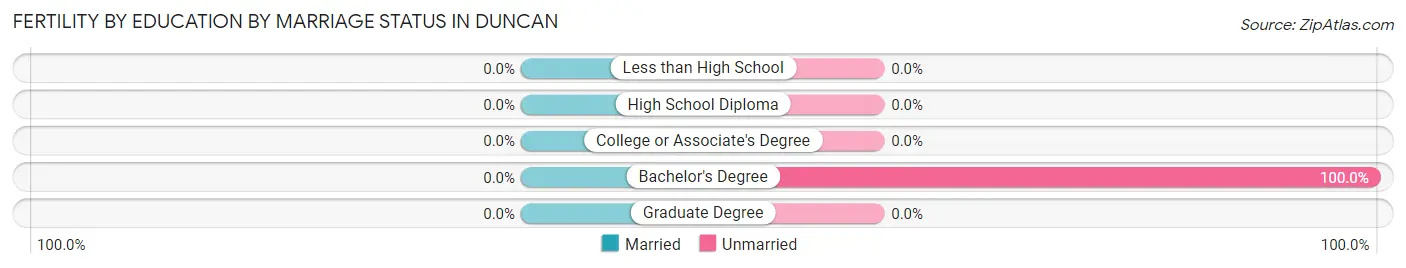
| Educational Attainment | Married | Unmarried |
| Less than High School | 0 (0.0%) | 0 (0.0%) |
| High School Diploma | 0 (0.0%) | 0 (0.0%) |
| College or Associate's Degree | 0 (0.0%) | 0 (0.0%) |
| Bachelor's Degree | 0 (0.0%) | 149 (100.0%) |
| Graduate Degree | 0 (0.0%) | 0 (0.0%) |
| Total | 0 (0.0%) | 149 (100.0%) |
Employment Characteristics in Duncan
Employment by Class of Employer in Duncan
Among the 1,918 employed individuals in Duncan, private company employees (1,508 | 78.6%), local government employees (145 | 7.6%), and not-for-profit organizations (126 | 6.6%) make up the most common classes of employment.
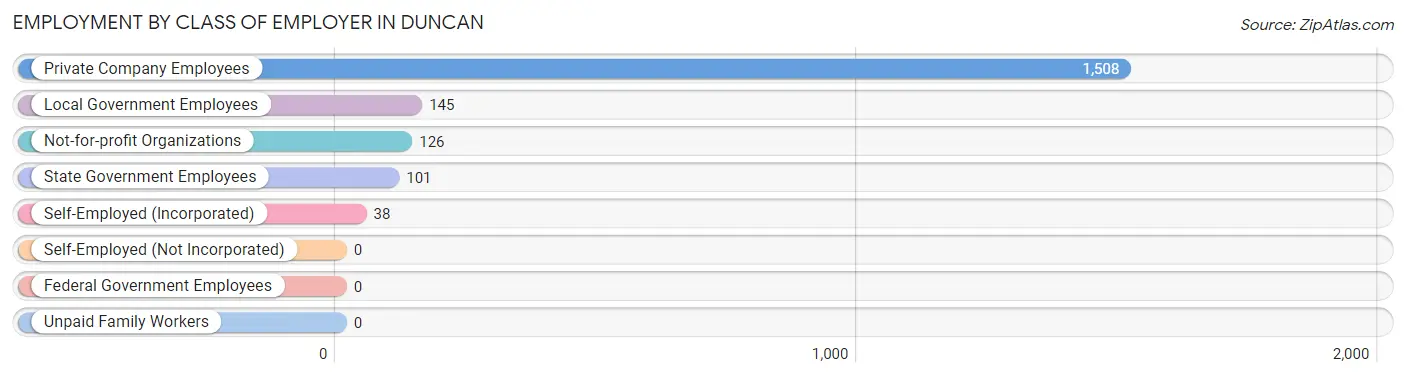
| Employer Class | # Employees | % Employees |
| Private Company Employees | 1,508 | 78.6% |
| Self-Employed (Incorporated) | 38 | 2.0% |
| Self-Employed (Not Incorporated) | 0 | 0.0% |
| Not-for-profit Organizations | 126 | 6.6% |
| Local Government Employees | 145 | 7.6% |
| State Government Employees | 101 | 5.3% |
| Federal Government Employees | 0 | 0.0% |
| Unpaid Family Workers | 0 | 0.0% |
| Total | 1,918 | 100.0% |
Employment Status by Age in Duncan
According to the labor force statistics for Duncan, out of the total population over 16 years of age (2,988), 67.8% or 2,026 individuals are in the labor force, with 3.1% or 63 of them unemployed. The age group with the highest labor force participation rate is 20 to 24 years, with 94.1% or 127 individuals in the labor force. Within the labor force, the 45 to 54 years age range has the highest percentage of unemployed individuals, with 23.0% or 41 of them being unemployed.
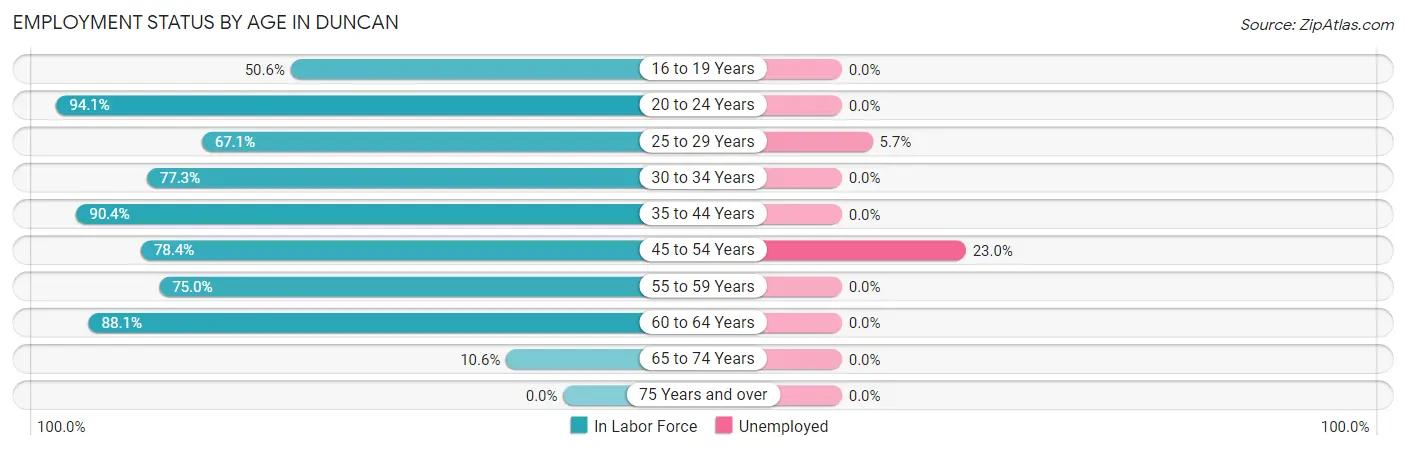
| Age Bracket | In Labor Force | Unemployed |
| 16 to 19 Years | 87 (50.6%) | 0 (0.0%) |
| 20 to 24 Years | 127 (94.1%) | 0 (0.0%) |
| 25 to 29 Years | 389 (67.1%) | 22 (5.7%) |
| 30 to 34 Years | 385 (77.3%) | 0 (0.0%) |
| 35 to 44 Years | 487 (90.4%) | 0 (0.0%) |
| 45 to 54 Years | 178 (78.4%) | 41 (23.0%) |
| 55 to 59 Years | 162 (75.0%) | 0 (0.0%) |
| 60 to 64 Years | 185 (88.1%) | 0 (0.0%) |
| 65 to 74 Years | 26 (10.6%) | 0 (0.0%) |
| 75 Years and over | 0 (0.0%) | 0 (0.0%) |
| Total | 2,026 (67.8%) | 63 (3.1%) |
Employment Status by Educational Attainment in Duncan
According to labor force statistics for Duncan, 78.7% of individuals (1,786) out of the total population between 25 and 64 years of age (2,270) are in the labor force, with 3.5% or 63 of them being unemployed. The group with the highest labor force participation rate are those with the educational attainment of high school diploma, with 87.7% or 457 individuals in the labor force. Within the labor force, individuals with high school diploma education have the highest percentage of unemployment, with 9.0% or 41 of them being unemployed.
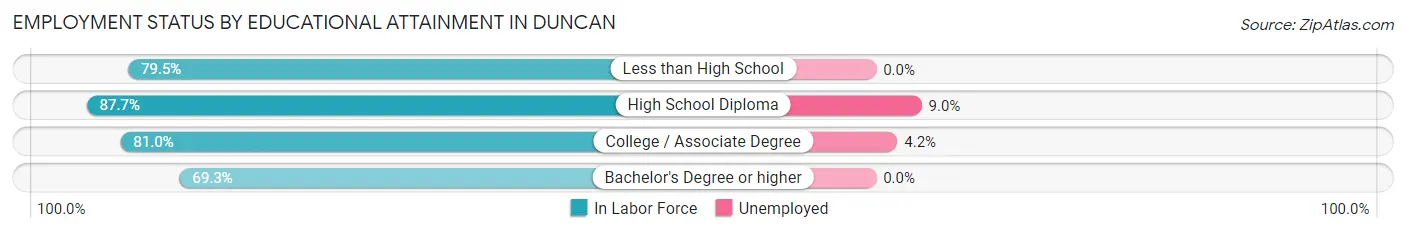
| Educational Attainment | In Labor Force | Unemployed |
| Less than High School | 321 (79.5%) | 0 (0.0%) |
| High School Diploma | 457 (87.7%) | 47 (9.0%) |
| College / Associate Degree | 528 (81.0%) | 27 (4.2%) |
| Bachelor's Degree or higher | 480 (69.3%) | 0 (0.0%) |
| Total | 1,786 (78.7%) | 79 (3.5%) |
Employment Occupations by Sex in Duncan
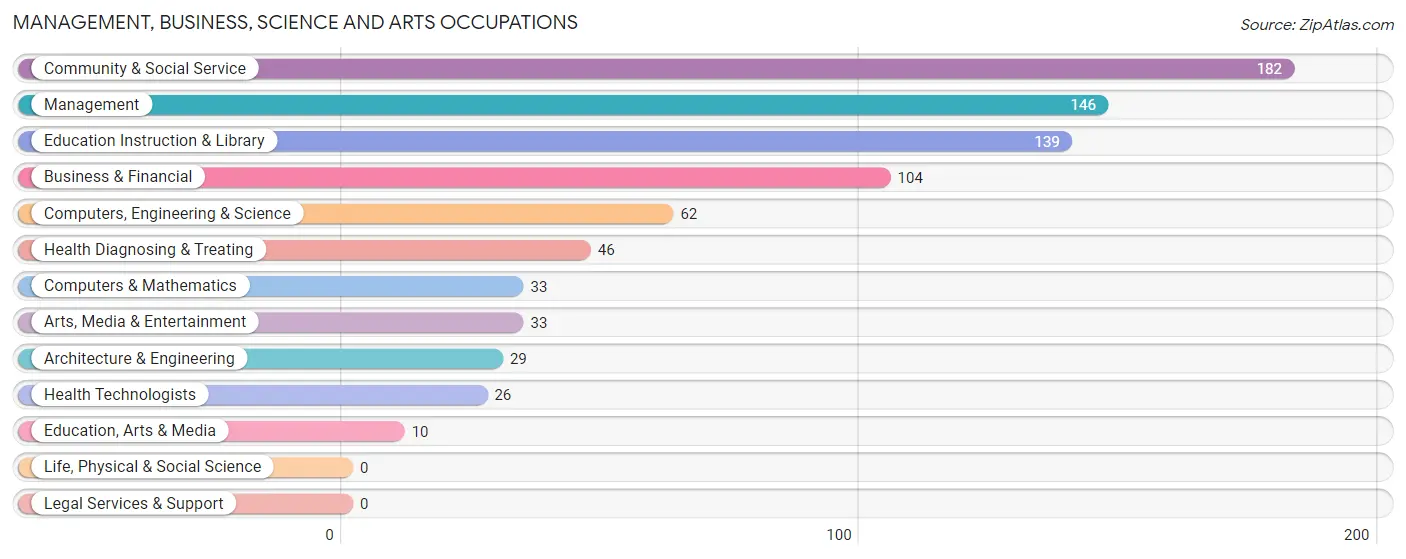
Management, Business, Science and Arts Occupations
The most common Management, Business, Science and Arts occupations in Duncan are Community & Social Service (182 | 9.3%), Management (146 | 7.4%), Education Instruction & Library (139 | 7.1%), Business & Financial (104 | 5.3%), and Computers, Engineering & Science (62 | 3.2%).
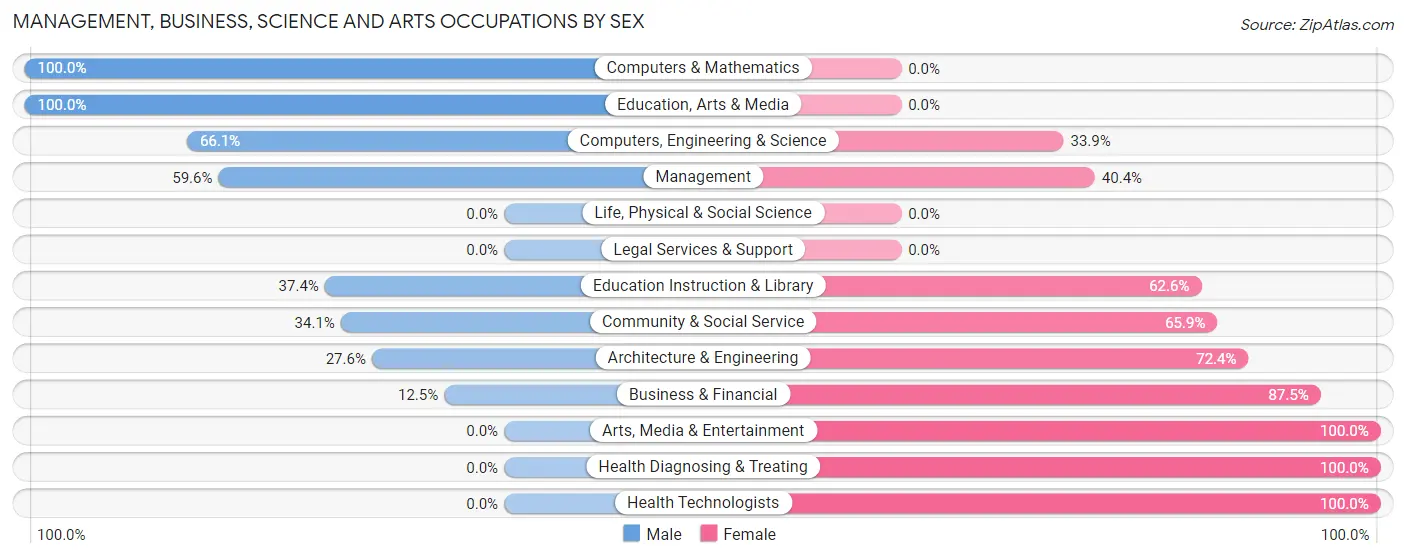
Management, Business, Science and Arts Occupations by Sex
Within the Management, Business, Science and Arts occupations in Duncan, the most male-oriented occupations are Computers & Mathematics (100.0%), Education, Arts & Media (100.0%), and Computers, Engineering & Science (66.1%), while the most female-oriented occupations are Arts, Media & Entertainment (100.0%), Health Diagnosing & Treating (100.0%), and Health Technologists (100.0%).
| Occupation | Male | Female |
| Management | 87 (59.6%) | 59 (40.4%) |
| Business & Financial | 13 (12.5%) | 91 (87.5%) |
| Computers, Engineering & Science | 41 (66.1%) | 21 (33.9%) |
| Computers & Mathematics | 33 (100.0%) | 0 (0.0%) |
| Architecture & Engineering | 8 (27.6%) | 21 (72.4%) |
| Life, Physical & Social Science | 0 (0.0%) | 0 (0.0%) |
| Community & Social Service | 62 (34.1%) | 120 (65.9%) |
| Education, Arts & Media | 10 (100.0%) | 0 (0.0%) |
| Legal Services & Support | 0 (0.0%) | 0 (0.0%) |
| Education Instruction & Library | 52 (37.4%) | 87 (62.6%) |
| Arts, Media & Entertainment | 0 (0.0%) | 33 (100.0%) |
| Health Diagnosing & Treating | 0 (0.0%) | 46 (100.0%) |
| Health Technologists | 0 (0.0%) | 26 (100.0%) |
| Total (Category) | 203 (37.6%) | 337 (62.4%) |
| Total (Overall) | 811 (41.3%) | 1,152 (58.7%) |
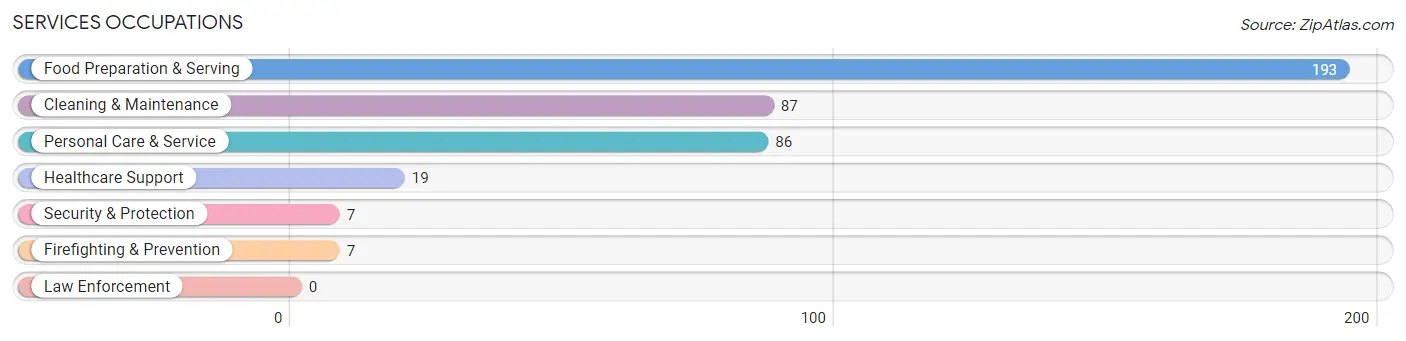
Services Occupations
The most common Services occupations in Duncan are Food Preparation & Serving (193 | 9.8%), Cleaning & Maintenance (87 | 4.4%), Personal Care & Service (86 | 4.4%), Healthcare Support (19 | 1.0%), and Security & Protection (7 | 0.4%).
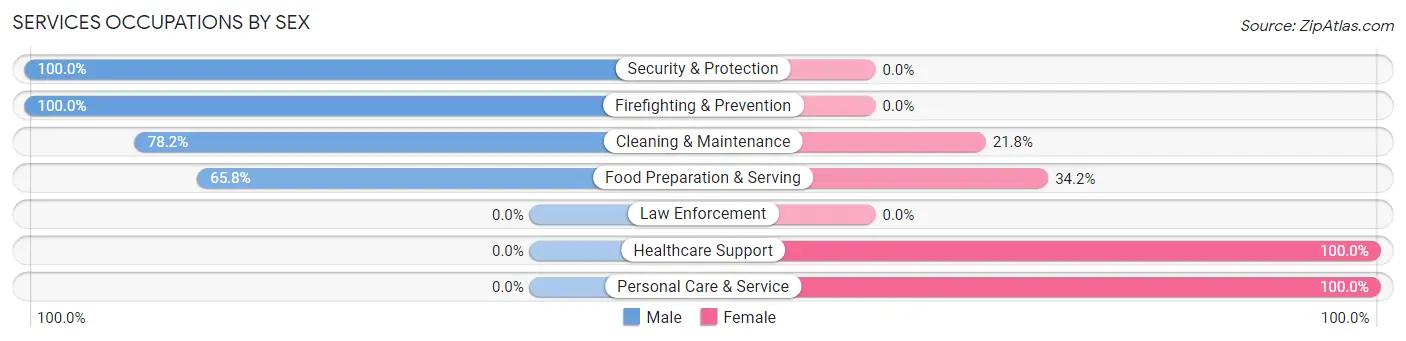
Services Occupations by Sex
Within the Services occupations in Duncan, the most male-oriented occupations are Security & Protection (100.0%), Firefighting & Prevention (100.0%), and Cleaning & Maintenance (78.2%), while the most female-oriented occupations are Healthcare Support (100.0%), Personal Care & Service (100.0%), and Food Preparation & Serving (34.2%).
| Occupation | Male | Female |
| Healthcare Support | 0 (0.0%) | 19 (100.0%) |
| Security & Protection | 7 (100.0%) | 0 (0.0%) |
| Firefighting & Prevention | 7 (100.0%) | 0 (0.0%) |
| Law Enforcement | 0 (0.0%) | 0 (0.0%) |
| Food Preparation & Serving | 127 (65.8%) | 66 (34.2%) |
| Cleaning & Maintenance | 68 (78.2%) | 19 (21.8%) |
| Personal Care & Service | 0 (0.0%) | 86 (100.0%) |
| Total (Category) | 202 (51.5%) | 190 (48.5%) |
| Total (Overall) | 811 (41.3%) | 1,152 (58.7%) |
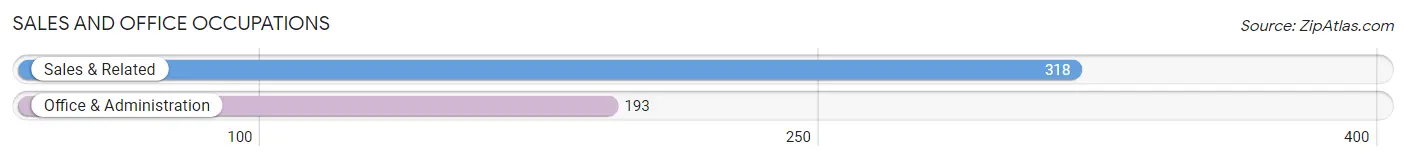
Sales and Office Occupations
The most common Sales and Office occupations in Duncan are Sales & Related (318 | 16.2%), and Office & Administration (193 | 9.8%).
Sales and Office Occupations by Sex
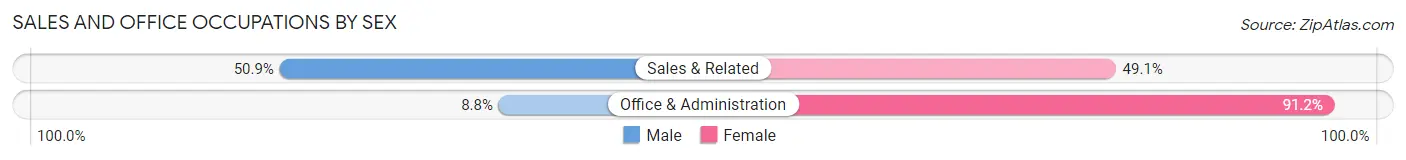
| Occupation | Male | Female |
| Sales & Related | 162 (50.9%) | 156 (49.1%) |
| Office & Administration | 17 (8.8%) | 176 (91.2%) |
| Total (Category) | 179 (35.0%) | 332 (65.0%) |
| Total (Overall) | 811 (41.3%) | 1,152 (58.7%) |
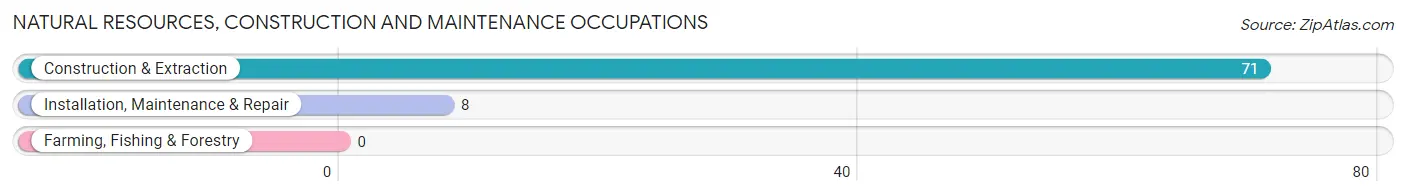
Natural Resources, Construction and Maintenance Occupations
The most common Natural Resources, Construction and Maintenance occupations in Duncan are Construction & Extraction (71 | 3.6%), and Installation, Maintenance & Repair (8 | 0.4%).
Natural Resources, Construction and Maintenance Occupations by Sex
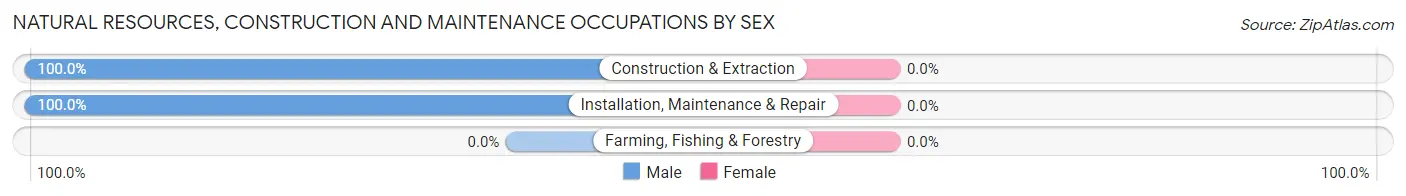
| Occupation | Male | Female |
| Farming, Fishing & Forestry | 0 (0.0%) | 0 (0.0%) |
| Construction & Extraction | 71 (100.0%) | 0 (0.0%) |
| Installation, Maintenance & Repair | 8 (100.0%) | 0 (0.0%) |
| Total (Category) | 79 (100.0%) | 0 (0.0%) |
| Total (Overall) | 811 (41.3%) | 1,152 (58.7%) |
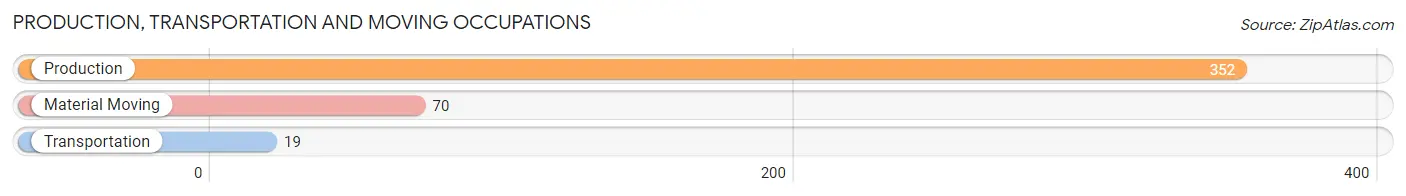
Production, Transportation and Moving Occupations
The most common Production, Transportation and Moving occupations in Duncan are Production (352 | 17.9%), Material Moving (70 | 3.6%), and Transportation (19 | 1.0%).
Production, Transportation and Moving Occupations by Sex
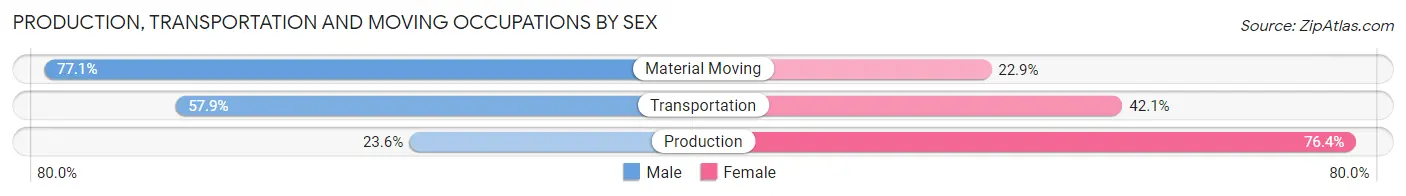
| Occupation | Male | Female |
| Production | 83 (23.6%) | 269 (76.4%) |
| Transportation | 11 (57.9%) | 8 (42.1%) |
| Material Moving | 54 (77.1%) | 16 (22.9%) |
| Total (Category) | 148 (33.6%) | 293 (66.4%) |
| Total (Overall) | 811 (41.3%) | 1,152 (58.7%) |
Employment Industries by Sex in Duncan
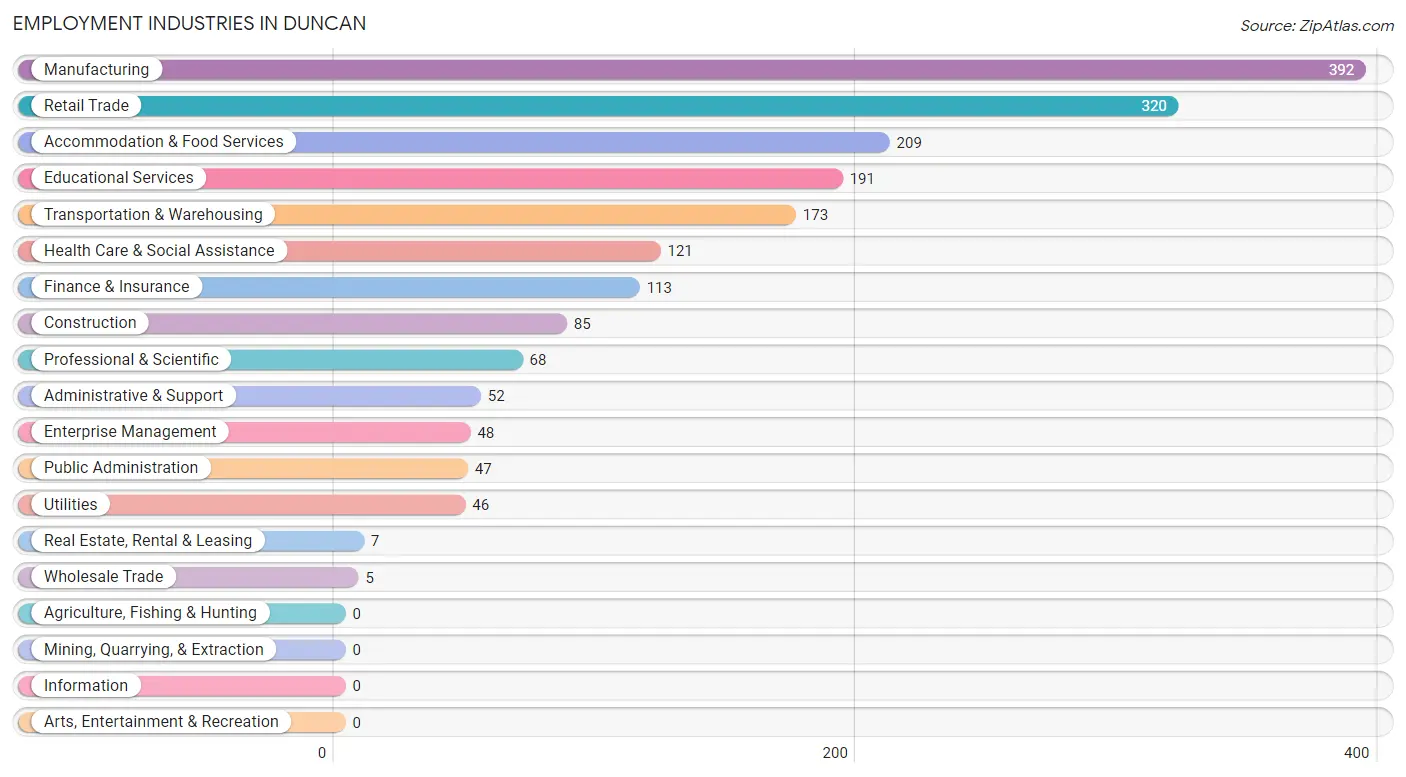
Employment Industries in Duncan
The major employment industries in Duncan include Manufacturing (392 | 20.0%), Retail Trade (320 | 16.3%), Accommodation & Food Services (209 | 10.6%), Educational Services (191 | 9.7%), and Transportation & Warehousing (173 | 8.8%).
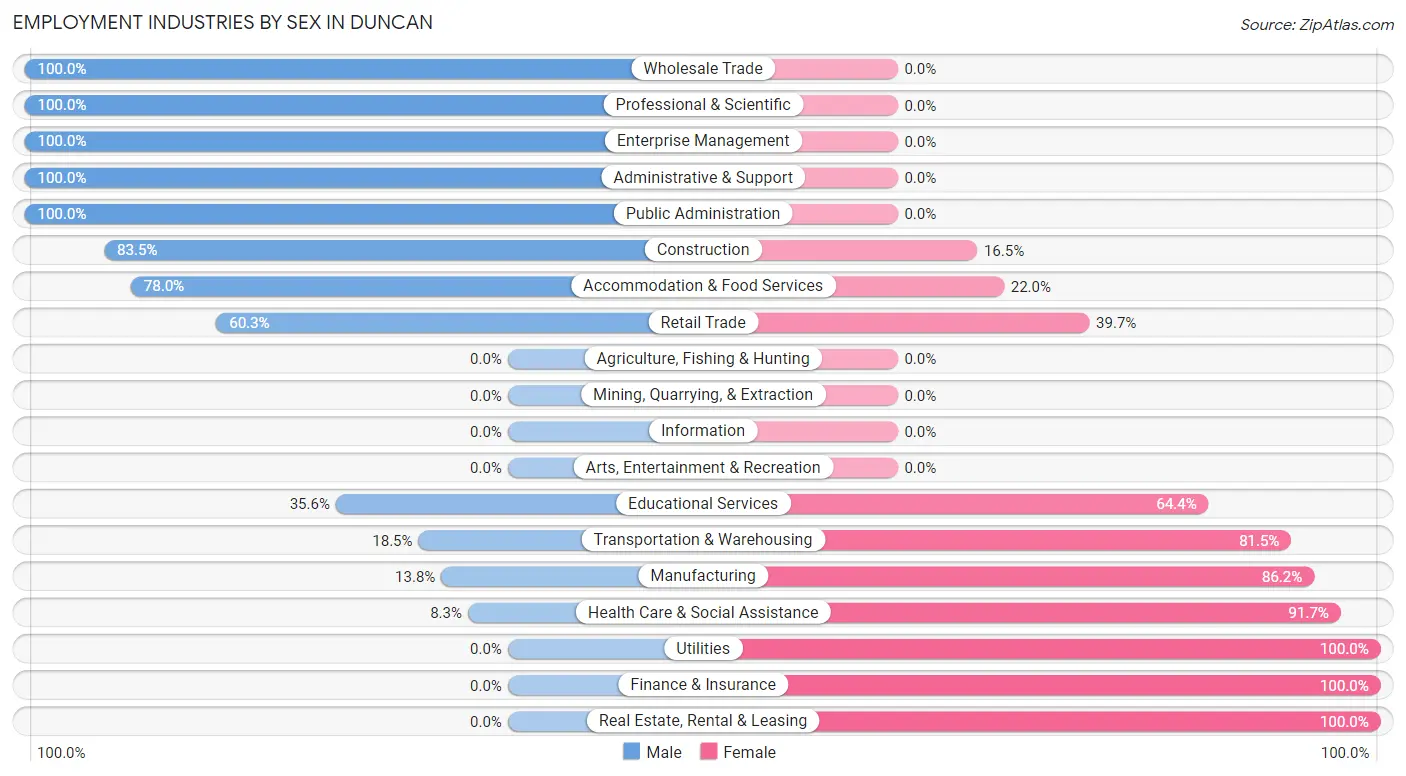
Employment Industries by Sex in Duncan
The Duncan industries that see more men than women are Wholesale Trade (100.0%), Professional & Scientific (100.0%), and Enterprise Management (100.0%), whereas the industries that tend to have a higher number of women are Utilities (100.0%), Finance & Insurance (100.0%), and Real Estate, Rental & Leasing (100.0%).
| Industry | Male | Female |
| Agriculture, Fishing & Hunting | 0 (0.0%) | 0 (0.0%) |
| Mining, Quarrying, & Extraction | 0 (0.0%) | 0 (0.0%) |
| Construction | 71 (83.5%) | 14 (16.5%) |
| Manufacturing | 54 (13.8%) | 338 (86.2%) |
| Wholesale Trade | 5 (100.0%) | 0 (0.0%) |
| Retail Trade | 193 (60.3%) | 127 (39.7%) |
| Transportation & Warehousing | 32 (18.5%) | 141 (81.5%) |
| Utilities | 0 (0.0%) | 46 (100.0%) |
| Information | 0 (0.0%) | 0 (0.0%) |
| Finance & Insurance | 0 (0.0%) | 113 (100.0%) |
| Real Estate, Rental & Leasing | 0 (0.0%) | 7 (100.0%) |
| Professional & Scientific | 68 (100.0%) | 0 (0.0%) |
| Enterprise Management | 48 (100.0%) | 0 (0.0%) |
| Administrative & Support | 52 (100.0%) | 0 (0.0%) |
| Educational Services | 68 (35.6%) | 123 (64.4%) |
| Health Care & Social Assistance | 10 (8.3%) | 111 (91.7%) |
| Arts, Entertainment & Recreation | 0 (0.0%) | 0 (0.0%) |
| Accommodation & Food Services | 163 (78.0%) | 46 (22.0%) |
| Public Administration | 47 (100.0%) | 0 (0.0%) |
| Total | 811 (41.3%) | 1,152 (58.7%) |
Education in Duncan
School Enrollment in Duncan
The most common levels of schooling among the 1,234 students in Duncan are elementary school (351 | 28.4%), graduate / professional (300 | 24.3%), and high school (227 | 18.4%).
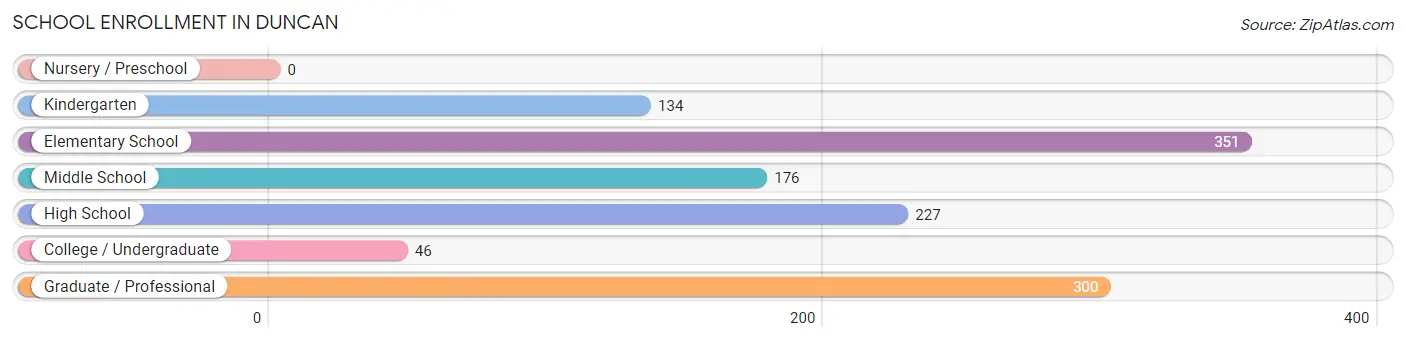
| School Level | # Students | % Students |
| Nursery / Preschool | 0 | 0.0% |
| Kindergarten | 134 | 10.9% |
| Elementary School | 351 | 28.4% |
| Middle School | 176 | 14.3% |
| High School | 227 | 18.4% |
| College / Undergraduate | 46 | 3.7% |
| Graduate / Professional | 300 | 24.3% |
| Total | 1,234 | 100.0% |
School Enrollment by Age by Funding Source in Duncan
Out of a total of 1,234 students who are enrolled in schools in Duncan, 325 (26.3%) attend a private institution, while the remaining 909 (73.7%) are enrolled in public schools. The age group of 25 to 34 year olds has the highest likelihood of being enrolled in private schools, with 283 (87.9% in the age bracket) enrolled. Conversely, the age group of 5 to 9 year old has the lowest likelihood of being enrolled in a private school, with 457 (100.0% in the age bracket) attending a public institution.
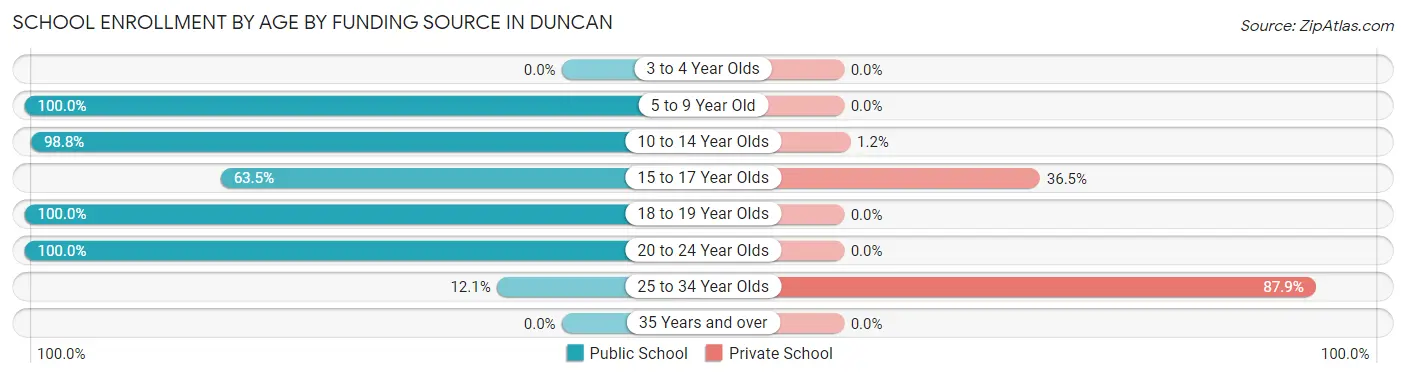
| Age Bracket | Public School | Private School |
| 3 to 4 Year Olds | 0 (0.0%) | 0 (0.0%) |
| 5 to 9 Year Old | 457 (100.0%) | 0 (0.0%) |
| 10 to 14 Year Olds | 250 (98.8%) | 3 (1.2%) |
| 15 to 17 Year Olds | 66 (63.5%) | 38 (36.5%) |
| 18 to 19 Year Olds | 74 (100.0%) | 0 (0.0%) |
| 20 to 24 Year Olds | 24 (100.0%) | 0 (0.0%) |
| 25 to 34 Year Olds | 39 (12.1%) | 283 (87.9%) |
| 35 Years and over | 0 (0.0%) | 0 (0.0%) |
| Total | 909 (73.7%) | 325 (26.3%) |
Educational Attainment by Field of Study in Duncan
Business (380 | 41.2%), arts & humanities (231 | 25.0%), psychology (77 | 8.3%), education (57 | 6.2%), and communications (56 | 6.1%) are the most common fields of study among 923 individuals in Duncan who have obtained a bachelor's degree or higher.
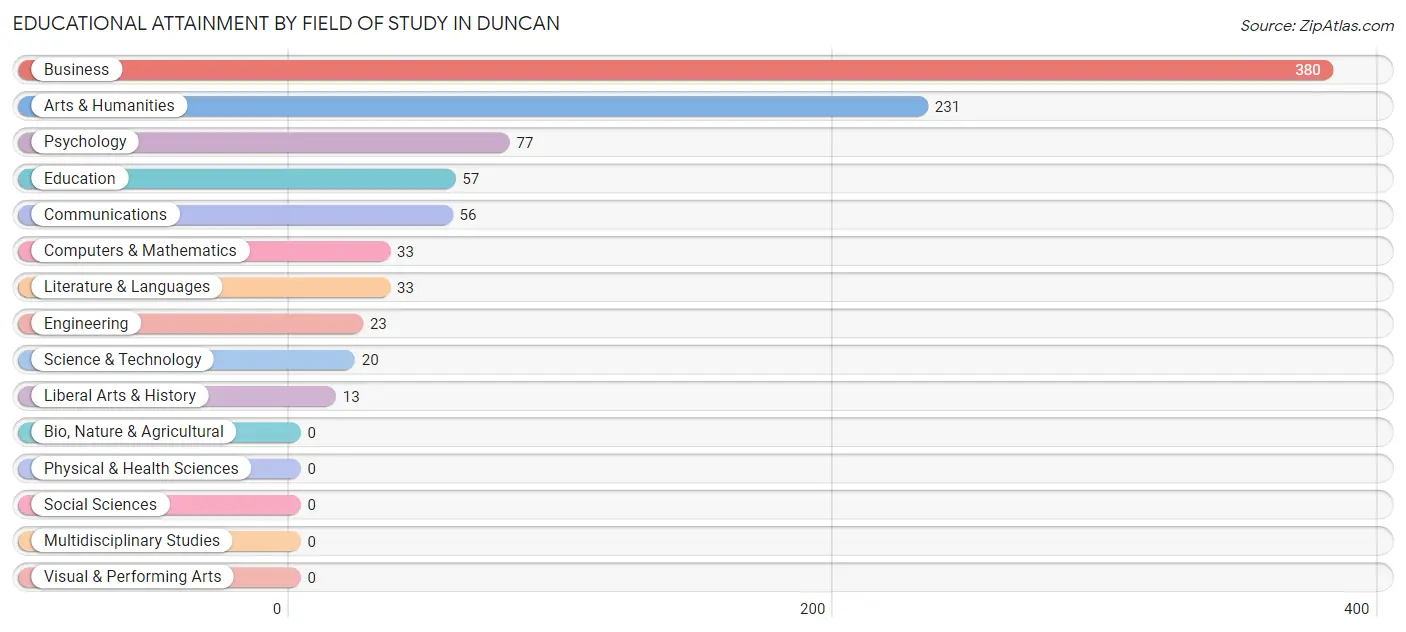
| Field of Study | # Graduates | % Graduates |
| Computers & Mathematics | 33 | 3.6% |
| Bio, Nature & Agricultural | 0 | 0.0% |
| Physical & Health Sciences | 0 | 0.0% |
| Psychology | 77 | 8.3% |
| Social Sciences | 0 | 0.0% |
| Engineering | 23 | 2.5% |
| Multidisciplinary Studies | 0 | 0.0% |
| Science & Technology | 20 | 2.2% |
| Business | 380 | 41.2% |
| Education | 57 | 6.2% |
| Literature & Languages | 33 | 3.6% |
| Liberal Arts & History | 13 | 1.4% |
| Visual & Performing Arts | 0 | 0.0% |
| Communications | 56 | 6.1% |
| Arts & Humanities | 231 | 25.0% |
| Total | 923 | 100.0% |
Transportation & Commute in Duncan
Vehicle Availability by Sex in Duncan
The most prevalent vehicle ownership categories in Duncan are males with 2 vehicles (496, accounting for 62.2%) and females with 2 vehicles (613, making up 44.3%).
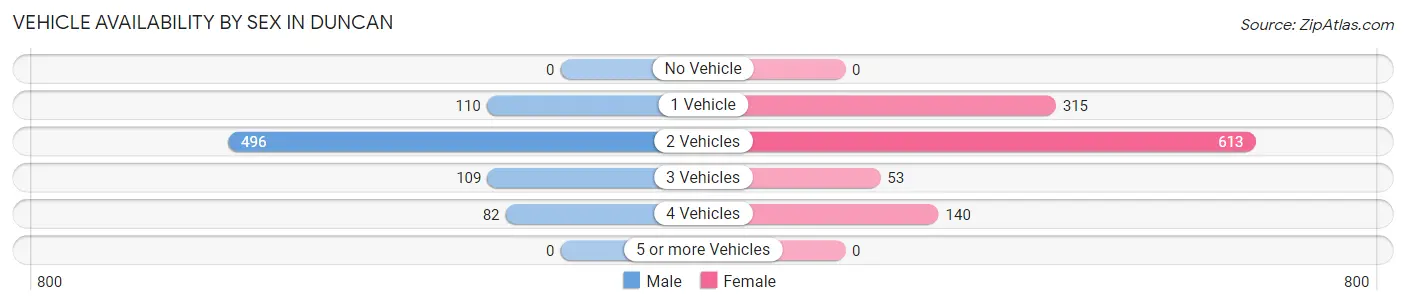
| Vehicles Available | Male | Female |
| No Vehicle | 0 (0.0%) | 0 (0.0%) |
| 1 Vehicle | 110 (13.8%) | 315 (28.1%) |
| 2 Vehicles | 496 (62.2%) | 613 (54.7%) |
| 3 Vehicles | 109 (13.7%) | 53 (4.7%) |
| 4 Vehicles | 82 (10.3%) | 140 (12.5%) |
| 5 or more Vehicles | 0 (0.0%) | 0 (0.0%) |
| Total | 797 (100.0%) | 1,121 (100.0%) |
Commute Time in Duncan
The most frequently occuring commute durations in Duncan are 10 to 14 minutes (376 commuters, 19.7%), 15 to 19 minutes (297 commuters, 15.6%), and 5 to 9 minutes (272 commuters, 14.2%).
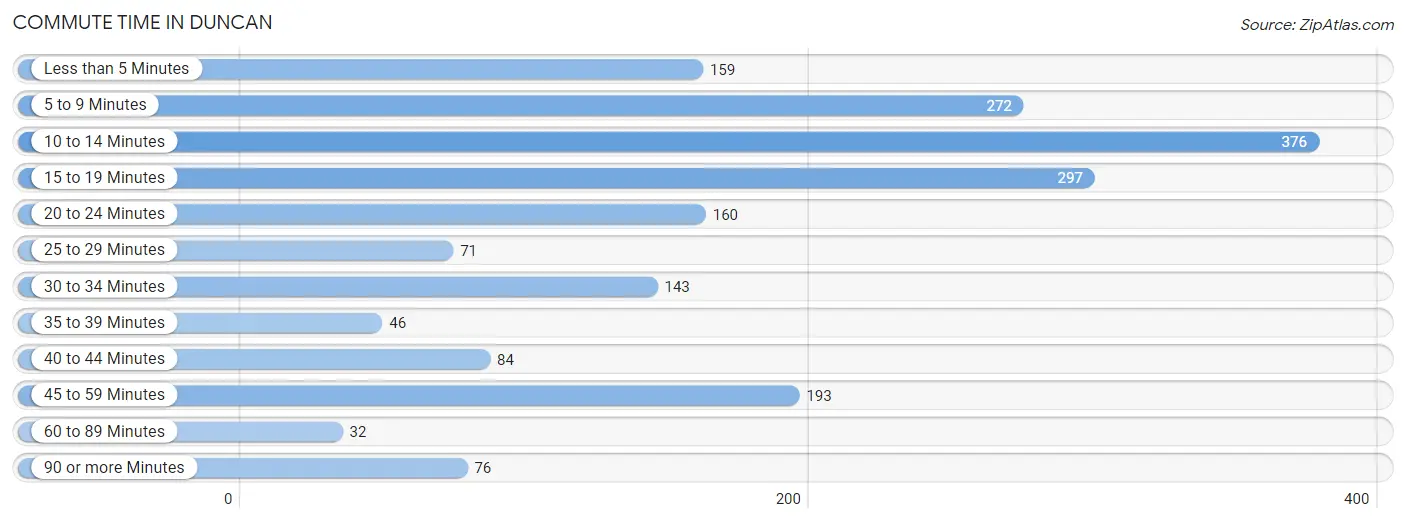
| Commute Time | # Commuters | % Commuters |
| Less than 5 Minutes | 159 | 8.3% |
| 5 to 9 Minutes | 272 | 14.2% |
| 10 to 14 Minutes | 376 | 19.7% |
| 15 to 19 Minutes | 297 | 15.6% |
| 20 to 24 Minutes | 160 | 8.4% |
| 25 to 29 Minutes | 71 | 3.7% |
| 30 to 34 Minutes | 143 | 7.5% |
| 35 to 39 Minutes | 46 | 2.4% |
| 40 to 44 Minutes | 84 | 4.4% |
| 45 to 59 Minutes | 193 | 10.1% |
| 60 to 89 Minutes | 32 | 1.7% |
| 90 or more Minutes | 76 | 4.0% |
Commute Time by Sex in Duncan
The most common commute times in Duncan are 10 to 14 minutes (165 commuters, 20.7%) for males and 10 to 14 minutes (211 commuters, 19.0%) for females.
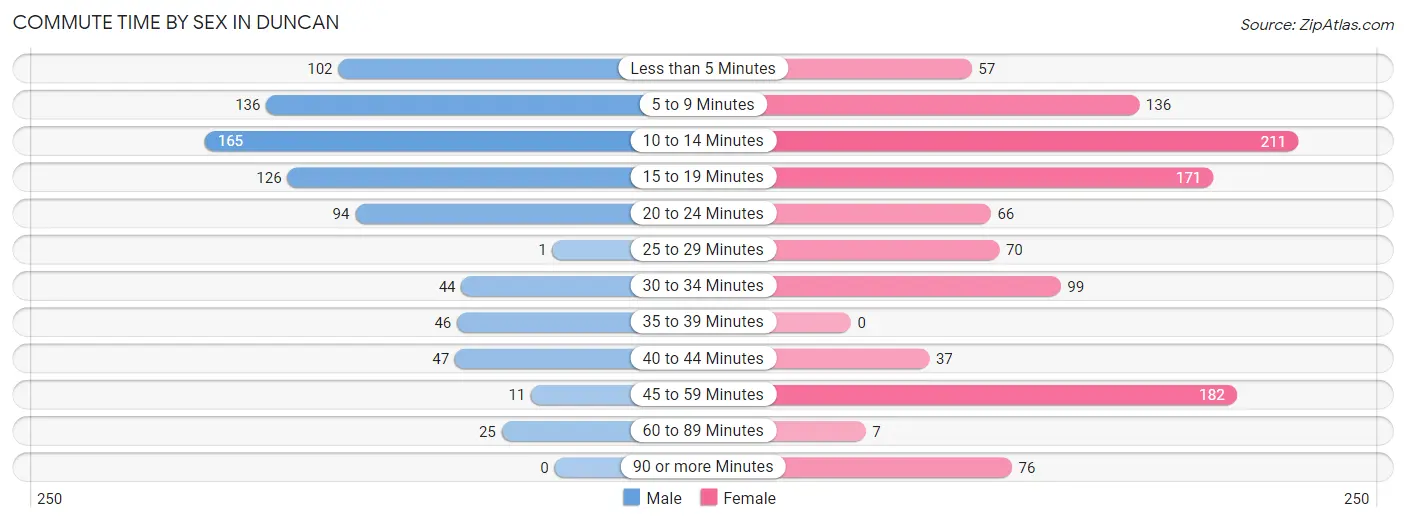
| Commute Time | Male | Female |
| Less than 5 Minutes | 102 (12.8%) | 57 (5.1%) |
| 5 to 9 Minutes | 136 (17.1%) | 136 (12.2%) |
| 10 to 14 Minutes | 165 (20.7%) | 211 (19.0%) |
| 15 to 19 Minutes | 126 (15.8%) | 171 (15.4%) |
| 20 to 24 Minutes | 94 (11.8%) | 66 (5.9%) |
| 25 to 29 Minutes | 1 (0.1%) | 70 (6.3%) |
| 30 to 34 Minutes | 44 (5.5%) | 99 (8.9%) |
| 35 to 39 Minutes | 46 (5.8%) | 0 (0.0%) |
| 40 to 44 Minutes | 47 (5.9%) | 37 (3.3%) |
| 45 to 59 Minutes | 11 (1.4%) | 182 (16.4%) |
| 60 to 89 Minutes | 25 (3.1%) | 7 (0.6%) |
| 90 or more Minutes | 0 (0.0%) | 76 (6.8%) |
Time of Departure to Work by Sex in Duncan
The most frequent times of departure to work in Duncan are 7:30 AM to 7:59 AM (149, 18.7%) for males and 6:30 AM to 6:59 AM (220, 19.8%) for females.
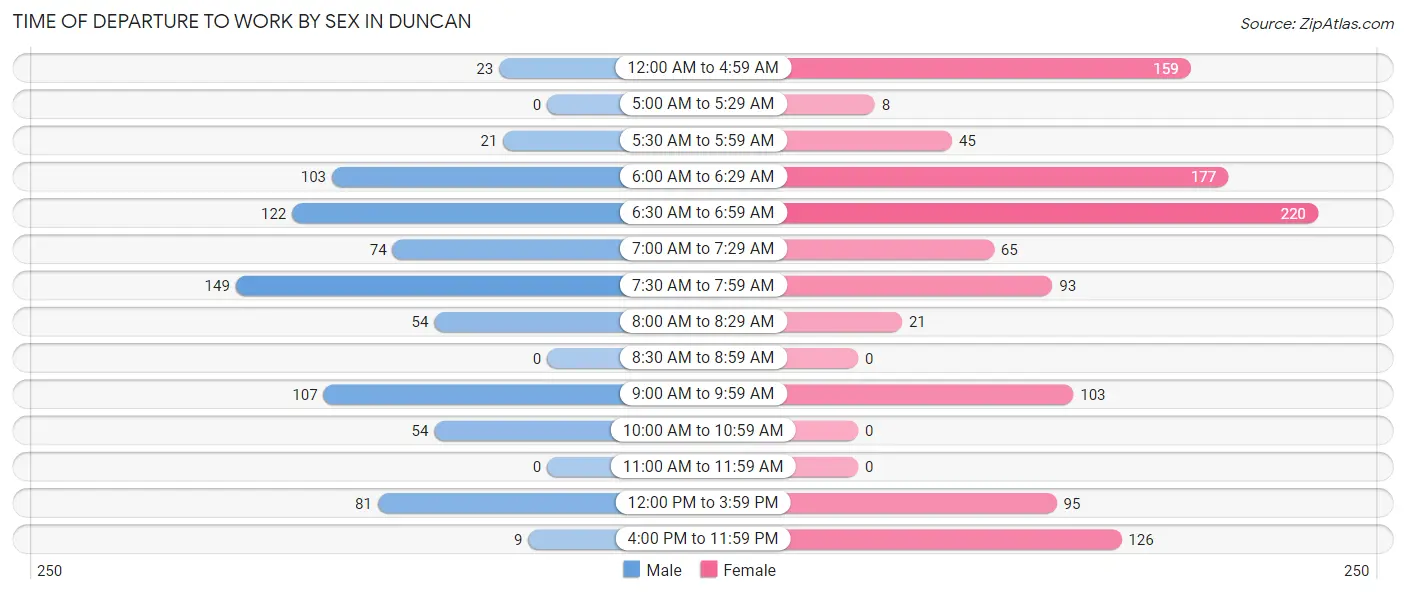
| Time of Departure | Male | Female |
| 12:00 AM to 4:59 AM | 23 (2.9%) | 159 (14.3%) |
| 5:00 AM to 5:29 AM | 0 (0.0%) | 8 (0.7%) |
| 5:30 AM to 5:59 AM | 21 (2.6%) | 45 (4.1%) |
| 6:00 AM to 6:29 AM | 103 (12.9%) | 177 (15.9%) |
| 6:30 AM to 6:59 AM | 122 (15.3%) | 220 (19.8%) |
| 7:00 AM to 7:29 AM | 74 (9.3%) | 65 (5.9%) |
| 7:30 AM to 7:59 AM | 149 (18.7%) | 93 (8.4%) |
| 8:00 AM to 8:29 AM | 54 (6.8%) | 21 (1.9%) |
| 8:30 AM to 8:59 AM | 0 (0.0%) | 0 (0.0%) |
| 9:00 AM to 9:59 AM | 107 (13.4%) | 103 (9.3%) |
| 10:00 AM to 10:59 AM | 54 (6.8%) | 0 (0.0%) |
| 11:00 AM to 11:59 AM | 0 (0.0%) | 0 (0.0%) |
| 12:00 PM to 3:59 PM | 81 (10.2%) | 95 (8.5%) |
| 4:00 PM to 11:59 PM | 9 (1.1%) | 126 (11.3%) |
| Total | 797 (100.0%) | 1,112 (100.0%) |
Housing Occupancy in Duncan
Occupancy by Ownership in Duncan
Of the total 1,574 dwellings in Duncan, owner-occupied units account for 843 (53.6%), while renter-occupied units make up 731 (46.4%).
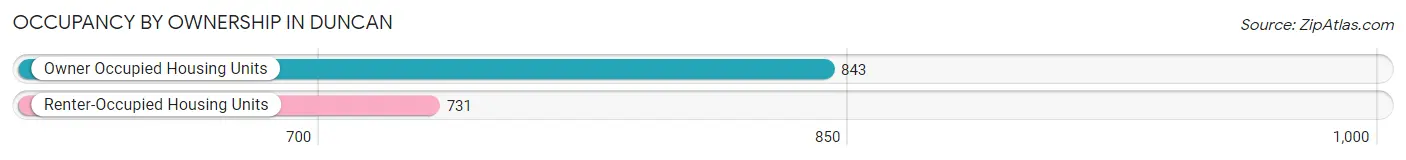
| Occupancy | # Housing Units | % Housing Units |
| Owner Occupied Housing Units | 843 | 53.6% |
| Renter-Occupied Housing Units | 731 | 46.4% |
| Total Occupied Housing Units | 1,574 | 100.0% |
Occupancy by Household Size in Duncan
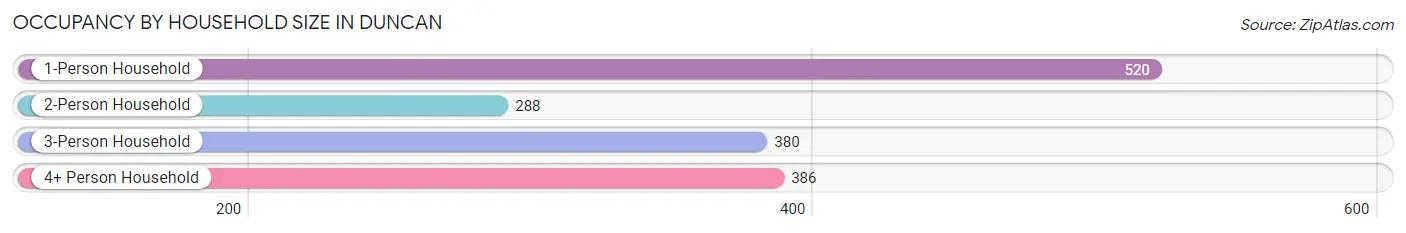
| Household Size | # Housing Units | % Housing Units |
| 1-Person Household | 520 | 33.0% |
| 2-Person Household | 288 | 18.3% |
| 3-Person Household | 380 | 24.1% |
| 4+ Person Household | 386 | 24.5% |
| Total Housing Units | 1,574 | 100.0% |
Occupancy by Ownership by Household Size in Duncan
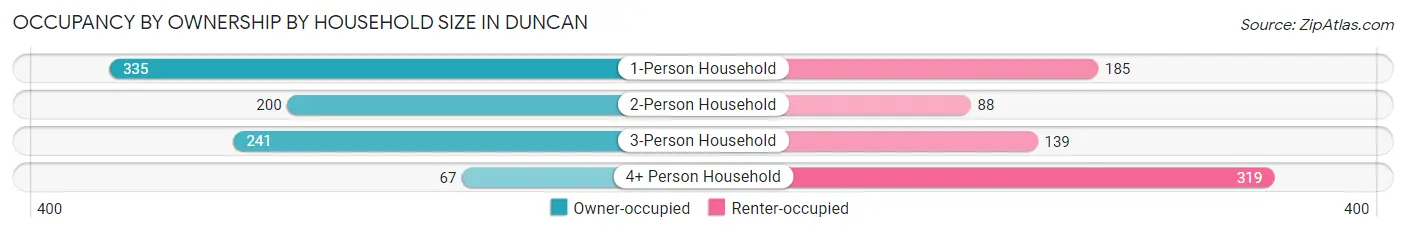
| Household Size | Owner-occupied | Renter-occupied |
| 1-Person Household | 335 (64.4%) | 185 (35.6%) |
| 2-Person Household | 200 (69.4%) | 88 (30.6%) |
| 3-Person Household | 241 (63.4%) | 139 (36.6%) |
| 4+ Person Household | 67 (17.4%) | 319 (82.6%) |
| Total Housing Units | 843 (53.6%) | 731 (46.4%) |
Occupancy by Educational Attainment in Duncan
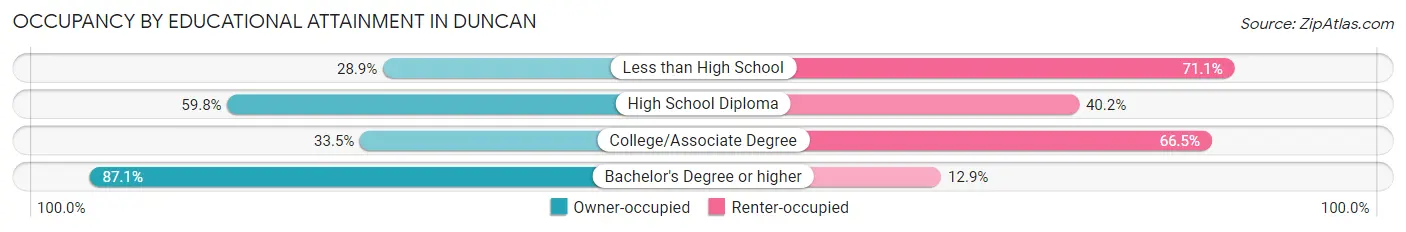
| Household Size | Owner-occupied | Renter-occupied |
| Less than High School | 79 (28.9%) | 194 (71.1%) |
| High School Diploma | 226 (59.8%) | 152 (40.2%) |
| College/Associate Degree | 166 (33.5%) | 330 (66.5%) |
| Bachelor's Degree or higher | 372 (87.1%) | 55 (12.9%) |
Occupancy by Age of Householder in Duncan
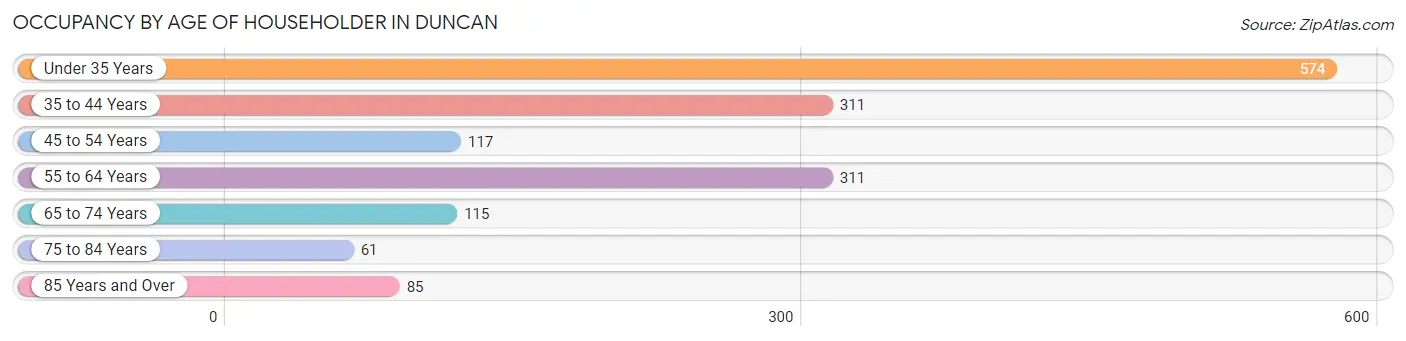
| Age Bracket | # Households | % Households |
| Under 35 Years | 574 | 36.5% |
| 35 to 44 Years | 311 | 19.8% |
| 45 to 54 Years | 117 | 7.4% |
| 55 to 64 Years | 311 | 19.8% |
| 65 to 74 Years | 115 | 7.3% |
| 75 to 84 Years | 61 | 3.9% |
| 85 Years and Over | 85 | 5.4% |
| Total | 1,574 | 100.0% |
Housing Finances in Duncan
Median Income by Occupancy in Duncan
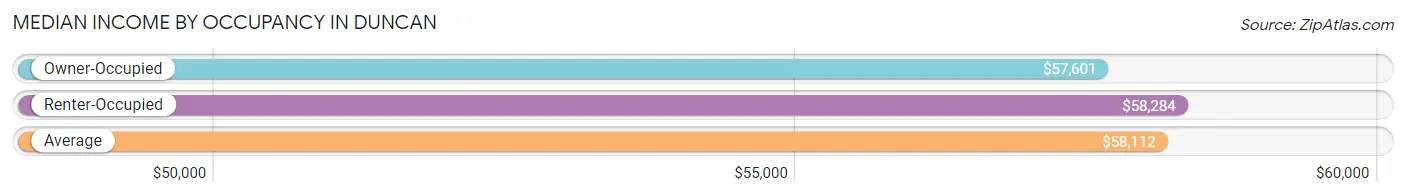
| Occupancy Type | # Households | Median Income |
| Owner-Occupied | 843 (53.6%) | $57,601 |
| Renter-Occupied | 731 (46.4%) | $58,284 |
| Average | 1,574 (100.0%) | $58,112 |
Occupancy by Householder Income Bracket in Duncan
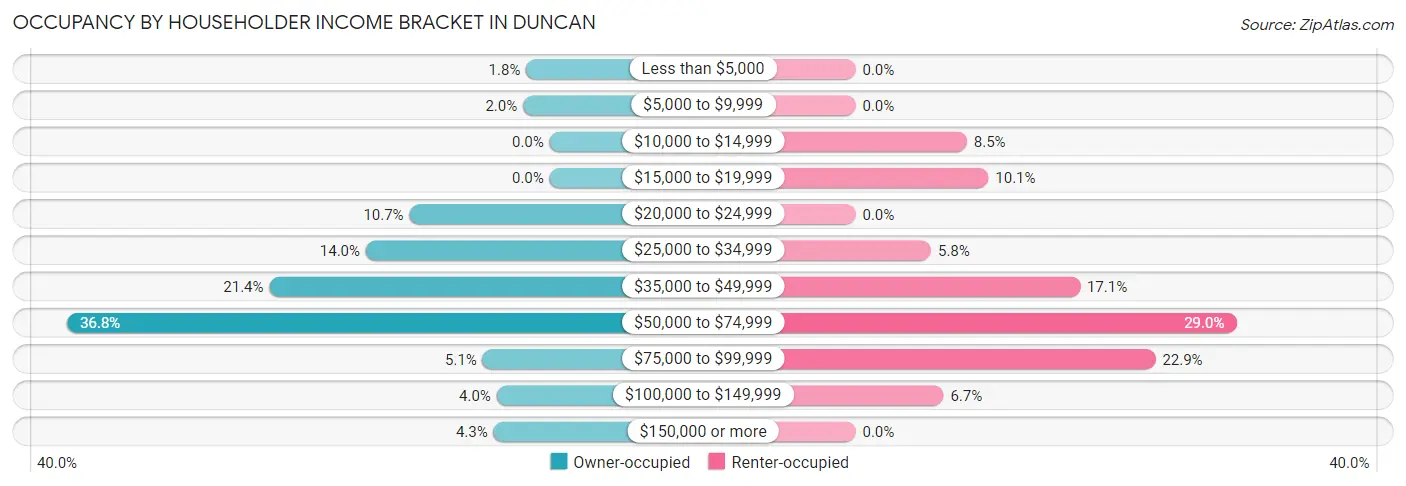
| Income Bracket | Owner-occupied | Renter-occupied |
| Less than $5,000 | 15 (1.8%) | 0 (0.0%) |
| $5,000 to $9,999 | 17 (2.0%) | 0 (0.0%) |
| $10,000 to $14,999 | 0 (0.0%) | 62 (8.5%) |
| $15,000 to $19,999 | 0 (0.0%) | 74 (10.1%) |
| $20,000 to $24,999 | 90 (10.7%) | 0 (0.0%) |
| $25,000 to $34,999 | 118 (14.0%) | 42 (5.8%) |
| $35,000 to $49,999 | 180 (21.3%) | 125 (17.1%) |
| $50,000 to $74,999 | 310 (36.8%) | 212 (29.0%) |
| $75,000 to $99,999 | 43 (5.1%) | 167 (22.9%) |
| $100,000 to $149,999 | 34 (4.0%) | 49 (6.7%) |
| $150,000 or more | 36 (4.3%) | 0 (0.0%) |
| Total | 843 (100.0%) | 731 (100.0%) |
Monthly Housing Cost Tiers in Duncan
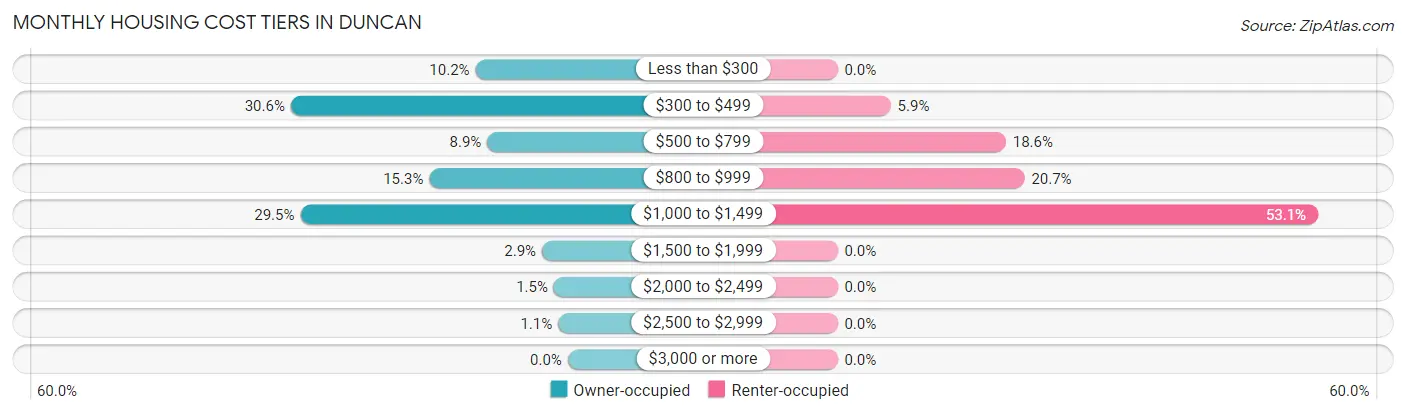
| Monthly Cost | Owner-occupied | Renter-occupied |
| Less than $300 | 86 (10.2%) | 0 (0.0%) |
| $300 to $499 | 258 (30.6%) | 43 (5.9%) |
| $500 to $799 | 75 (8.9%) | 136 (18.6%) |
| $800 to $999 | 129 (15.3%) | 151 (20.7%) |
| $1,000 to $1,499 | 249 (29.5%) | 388 (53.1%) |
| $1,500 to $1,999 | 24 (2.9%) | 0 (0.0%) |
| $2,000 to $2,499 | 13 (1.5%) | 0 (0.0%) |
| $2,500 to $2,999 | 9 (1.1%) | 0 (0.0%) |
| $3,000 or more | 0 (0.0%) | 0 (0.0%) |
| Total | 843 (100.0%) | 731 (100.0%) |
Physical Housing Characteristics in Duncan
Housing Structures in Duncan
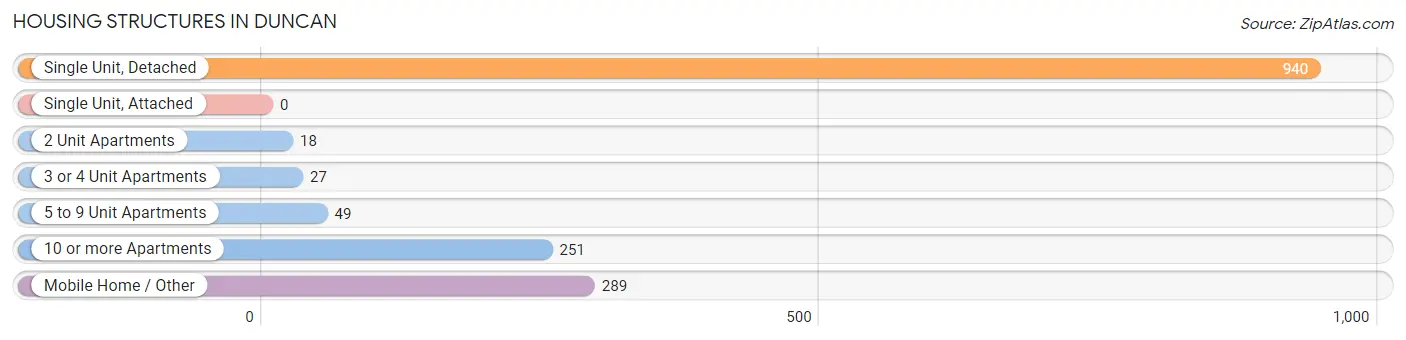
| Structure Type | # Housing Units | % Housing Units |
| Single Unit, Detached | 940 | 59.7% |
| Single Unit, Attached | 0 | 0.0% |
| 2 Unit Apartments | 18 | 1.1% |
| 3 or 4 Unit Apartments | 27 | 1.7% |
| 5 to 9 Unit Apartments | 49 | 3.1% |
| 10 or more Apartments | 251 | 16.0% |
| Mobile Home / Other | 289 | 18.4% |
| Total | 1,574 | 100.0% |
Housing Structures by Occupancy in Duncan
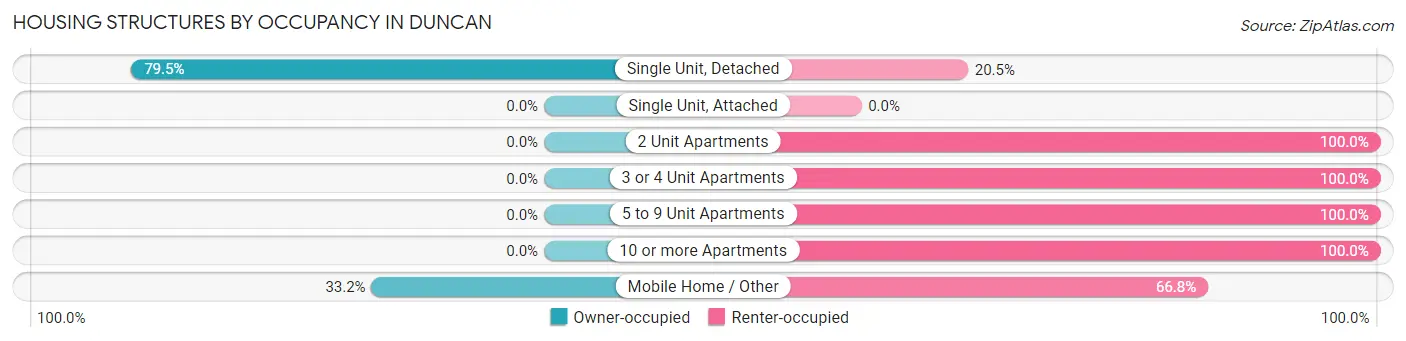
| Structure Type | Owner-occupied | Renter-occupied |
| Single Unit, Detached | 747 (79.5%) | 193 (20.5%) |
| Single Unit, Attached | 0 (0.0%) | 0 (0.0%) |
| 2 Unit Apartments | 0 (0.0%) | 18 (100.0%) |
| 3 or 4 Unit Apartments | 0 (0.0%) | 27 (100.0%) |
| 5 to 9 Unit Apartments | 0 (0.0%) | 49 (100.0%) |
| 10 or more Apartments | 0 (0.0%) | 251 (100.0%) |
| Mobile Home / Other | 96 (33.2%) | 193 (66.8%) |
| Total | 843 (53.6%) | 731 (46.4%) |
Housing Structures by Number of Rooms in Duncan
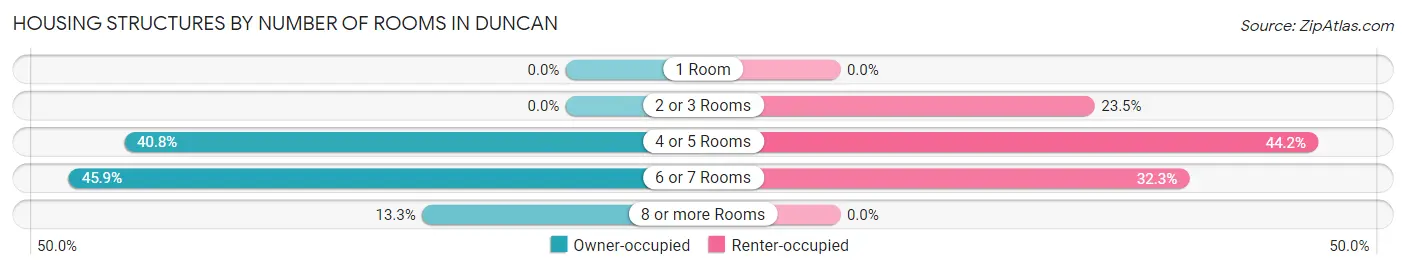
| Number of Rooms | Owner-occupied | Renter-occupied |
| 1 Room | 0 (0.0%) | 0 (0.0%) |
| 2 or 3 Rooms | 0 (0.0%) | 172 (23.5%) |
| 4 or 5 Rooms | 344 (40.8%) | 323 (44.2%) |
| 6 or 7 Rooms | 387 (45.9%) | 236 (32.3%) |
| 8 or more Rooms | 112 (13.3%) | 0 (0.0%) |
| Total | 843 (100.0%) | 731 (100.0%) |
Housing Structure by Heating Type in Duncan
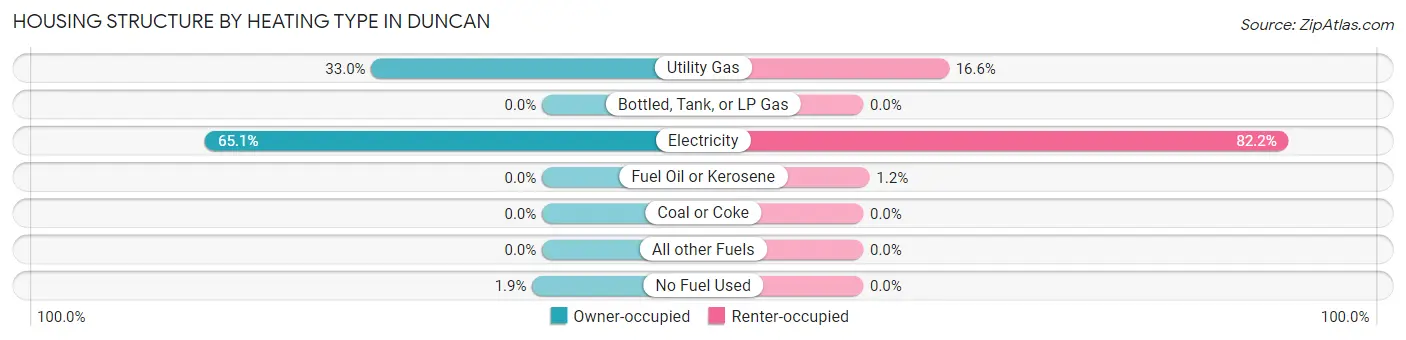
| Heating Type | Owner-occupied | Renter-occupied |
| Utility Gas | 278 (33.0%) | 121 (16.6%) |
| Bottled, Tank, or LP Gas | 0 (0.0%) | 0 (0.0%) |
| Electricity | 549 (65.1%) | 601 (82.2%) |
| Fuel Oil or Kerosene | 0 (0.0%) | 9 (1.2%) |
| Coal or Coke | 0 (0.0%) | 0 (0.0%) |
| All other Fuels | 0 (0.0%) | 0 (0.0%) |
| No Fuel Used | 16 (1.9%) | 0 (0.0%) |
| Total | 843 (100.0%) | 731 (100.0%) |
Household Vehicle Usage in Duncan
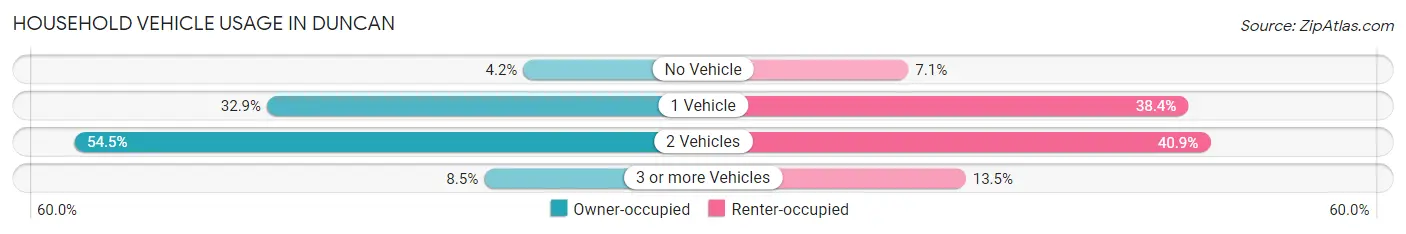
| Vehicles per Household | Owner-occupied | Renter-occupied |
| No Vehicle | 35 (4.2%) | 52 (7.1%) |
| 1 Vehicle | 277 (32.9%) | 281 (38.4%) |
| 2 Vehicles | 459 (54.4%) | 299 (40.9%) |
| 3 or more Vehicles | 72 (8.5%) | 99 (13.5%) |
| Total | 843 (100.0%) | 731 (100.0%) |
Real Estate & Mortgages in Duncan
Real Estate and Mortgage Overview in Duncan
| Characteristic | Without Mortgage | With Mortgage |
| Housing Units | 420 | 423 |
| Median Property Value | $159,100 | $169,300 |
| Median Household Income | $49,342 | $18 |
| Monthly Housing Costs | $447 | $0 |
| Real Estate Taxes | $919 | $13 |
Property Value by Mortgage Status in Duncan
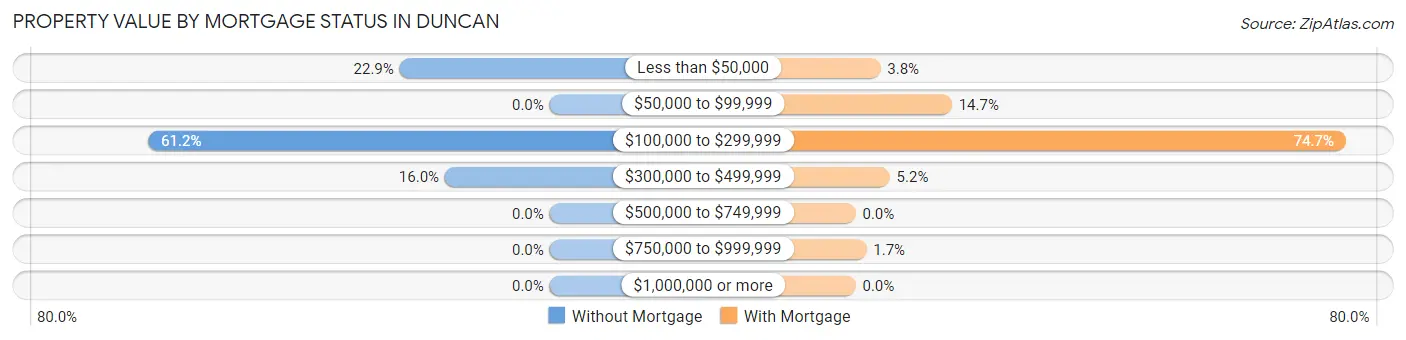
| Property Value | Without Mortgage | With Mortgage |
| Less than $50,000 | 96 (22.9%) | 16 (3.8%) |
| $50,000 to $99,999 | 0 (0.0%) | 62 (14.7%) |
| $100,000 to $299,999 | 257 (61.2%) | 316 (74.7%) |
| $300,000 to $499,999 | 67 (16.0%) | 22 (5.2%) |
| $500,000 to $749,999 | 0 (0.0%) | 0 (0.0%) |
| $750,000 to $999,999 | 0 (0.0%) | 7 (1.7%) |
| $1,000,000 or more | 0 (0.0%) | 0 (0.0%) |
| Total | 420 (100.0%) | 423 (100.0%) |
Household Income by Mortgage Status in Duncan
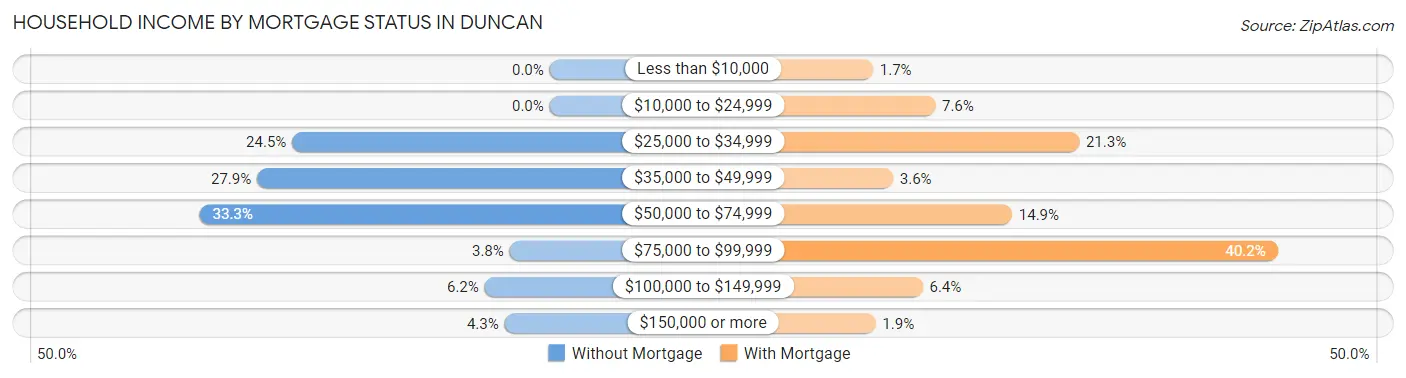
| Household Income | Without Mortgage | With Mortgage |
| Less than $10,000 | 0 (0.0%) | 7 (1.7%) |
| $10,000 to $24,999 | 0 (0.0%) | 32 (7.6%) |
| $25,000 to $34,999 | 103 (24.5%) | 90 (21.3%) |
| $35,000 to $49,999 | 117 (27.9%) | 15 (3.5%) |
| $50,000 to $74,999 | 140 (33.3%) | 63 (14.9%) |
| $75,000 to $99,999 | 16 (3.8%) | 170 (40.2%) |
| $100,000 to $149,999 | 26 (6.2%) | 27 (6.4%) |
| $150,000 or more | 18 (4.3%) | 8 (1.9%) |
| Total | 420 (100.0%) | 423 (100.0%) |
Property Value to Household Income Ratio in Duncan
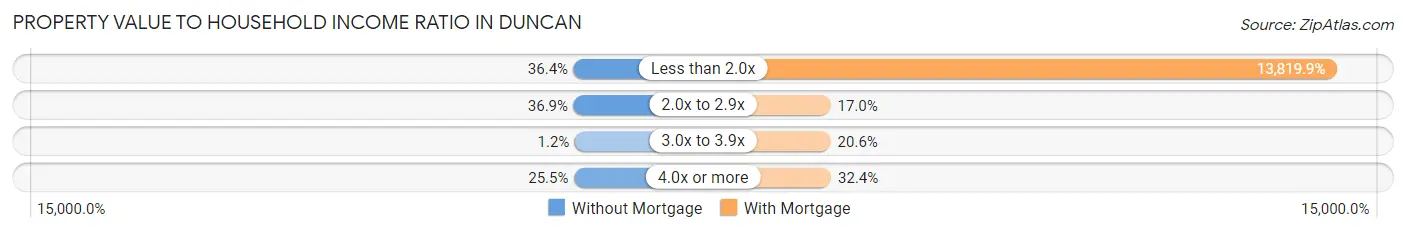
| Value-to-Income Ratio | Without Mortgage | With Mortgage |
| Less than 2.0x | 153 (36.4%) | 58,458 (13,819.9%) |
| 2.0x to 2.9x | 155 (36.9%) | 72 (17.0%) |
| 3.0x to 3.9x | 5 (1.2%) | 87 (20.6%) |
| 4.0x or more | 107 (25.5%) | 137 (32.4%) |
| Total | 420 (100.0%) | 423 (100.0%) |
Real Estate Taxes by Mortgage Status in Duncan
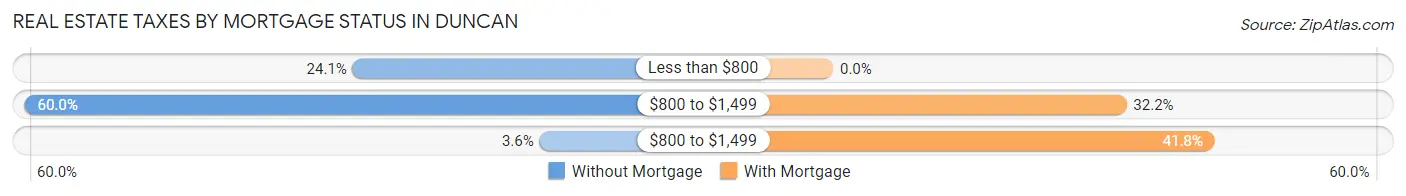
| Property Taxes | Without Mortgage | With Mortgage |
| Less than $800 | 101 (24.0%) | 0 (0.0%) |
| $800 to $1,499 | 252 (60.0%) | 136 (32.2%) |
| $800 to $1,499 | 15 (3.6%) | 177 (41.8%) |
| Total | 420 (100.0%) | 423 (100.0%) |
Health & Disability in Duncan
Health Insurance Coverage by Age in Duncan
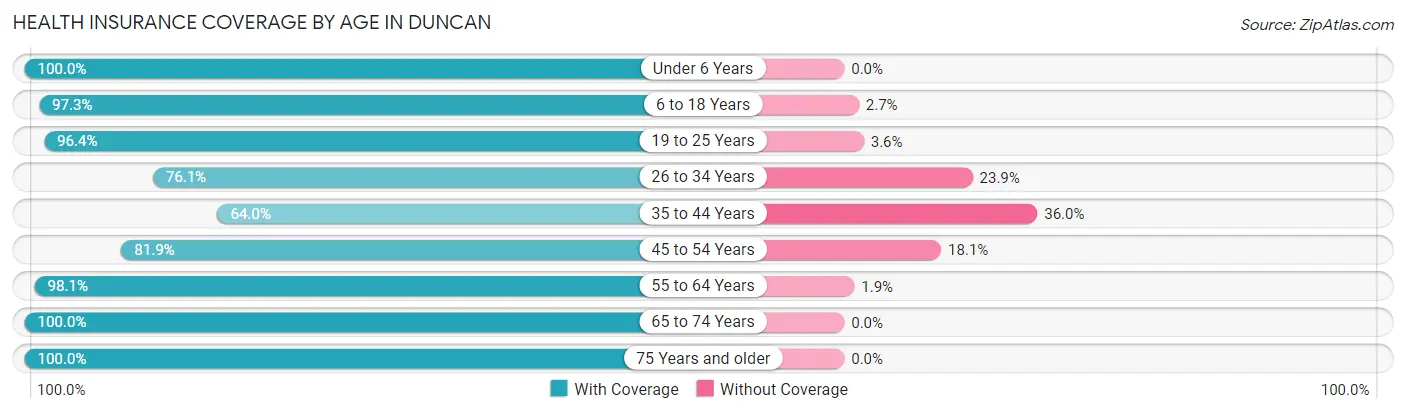
| Age Bracket | With Coverage | Without Coverage |
| Under 6 Years | 387 (100.0%) | 0 (0.0%) |
| 6 to 18 Years | 754 (97.3%) | 21 (2.7%) |
| 19 to 25 Years | 186 (96.4%) | 7 (3.6%) |
| 26 to 34 Years | 820 (76.1%) | 258 (23.9%) |
| 35 to 44 Years | 345 (64.0%) | 194 (36.0%) |
| 45 to 54 Years | 186 (81.9%) | 41 (18.1%) |
| 55 to 64 Years | 418 (98.1%) | 8 (1.9%) |
| 65 to 74 Years | 246 (100.0%) | 0 (0.0%) |
| 75 Years and older | 165 (100.0%) | 0 (0.0%) |
| Total | 3,507 (86.9%) | 529 (13.1%) |
Health Insurance Coverage by Citizenship Status in Duncan
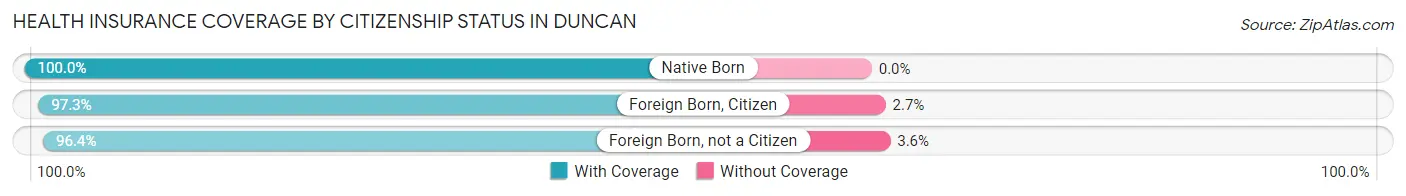
| Citizenship Status | With Coverage | Without Coverage |
| Native Born | 387 (100.0%) | 0 (0.0%) |
| Foreign Born, Citizen | 754 (97.3%) | 21 (2.7%) |
| Foreign Born, not a Citizen | 186 (96.4%) | 7 (3.6%) |
Health Insurance Coverage by Household Income in Duncan
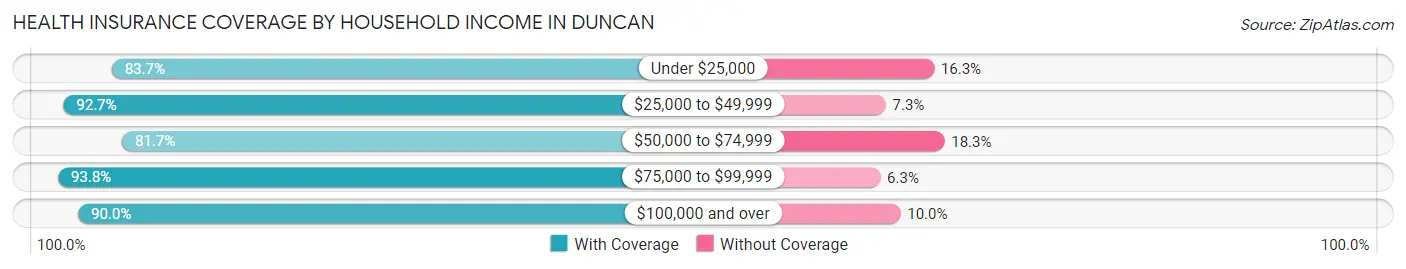
| Household Income | With Coverage | Without Coverage |
| Under $25,000 | 420 (83.7%) | 82 (16.3%) |
| $25,000 to $49,999 | 689 (92.7%) | 54 (7.3%) |
| $50,000 to $74,999 | 1,406 (81.7%) | 314 (18.3%) |
| $75,000 to $99,999 | 675 (93.8%) | 45 (6.2%) |
| $100,000 and over | 305 (90.0%) | 34 (10.0%) |
Public vs Private Health Insurance Coverage by Age in Duncan
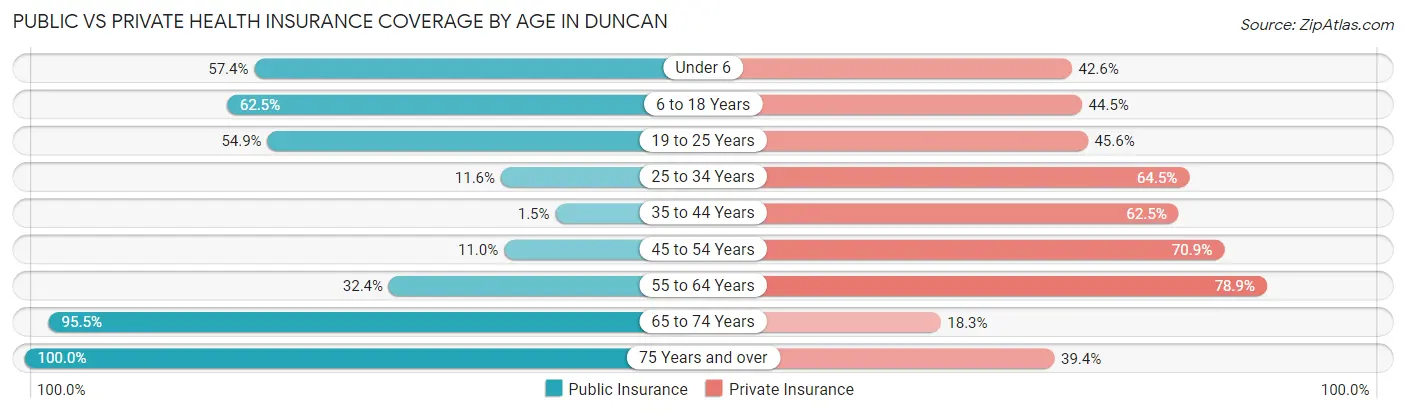
| Age Bracket | Public Insurance | Private Insurance |
| Under 6 | 222 (57.4%) | 165 (42.6%) |
| 6 to 18 Years | 484 (62.5%) | 345 (44.5%) |
| 19 to 25 Years | 106 (54.9%) | 88 (45.6%) |
| 25 to 34 Years | 125 (11.6%) | 695 (64.5%) |
| 35 to 44 Years | 8 (1.5%) | 337 (62.5%) |
| 45 to 54 Years | 25 (11.0%) | 161 (70.9%) |
| 55 to 64 Years | 138 (32.4%) | 336 (78.9%) |
| 65 to 74 Years | 235 (95.5%) | 45 (18.3%) |
| 75 Years and over | 165 (100.0%) | 65 (39.4%) |
| Total | 1,508 (37.4%) | 2,237 (55.4%) |
Disability Status by Sex by Age in Duncan
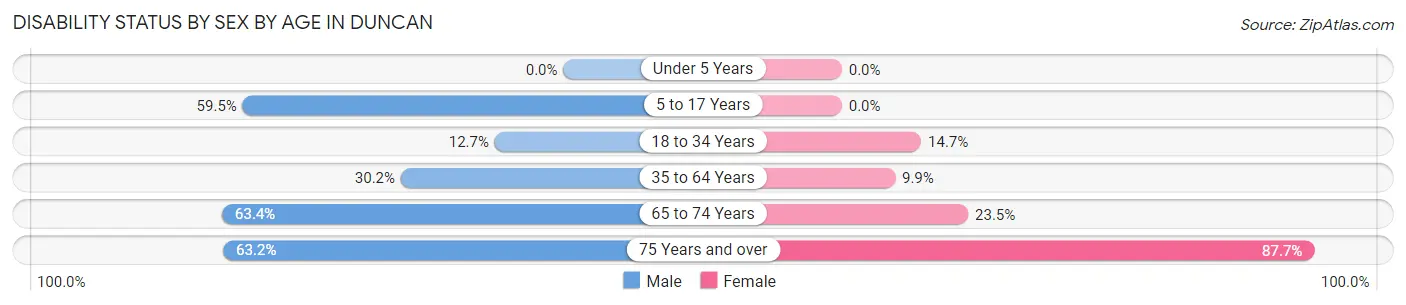
| Age Bracket | Male | Female |
| Under 5 Years | 0 (0.0%) | 0 (0.0%) |
| 5 to 17 Years | 303 (59.5%) | 0 (0.0%) |
| 18 to 34 Years | 75 (12.7%) | 107 (14.7%) |
| 35 to 64 Years | 155 (30.2%) | 67 (9.9%) |
| 65 to 74 Years | 64 (63.4%) | 34 (23.4%) |
| 75 Years and over | 12 (63.2%) | 128 (87.7%) |
Disability Class by Sex by Age in Duncan
Disability Class: Hearing Difficulty
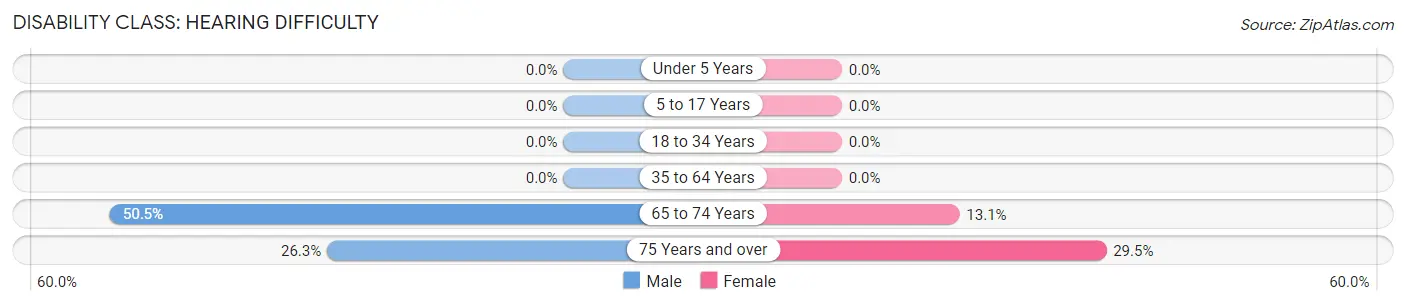
| Age Bracket | Male | Female |
| Under 5 Years | 0 (0.0%) | 0 (0.0%) |
| 5 to 17 Years | 0 (0.0%) | 0 (0.0%) |
| 18 to 34 Years | 0 (0.0%) | 0 (0.0%) |
| 35 to 64 Years | 0 (0.0%) | 0 (0.0%) |
| 65 to 74 Years | 51 (50.5%) | 19 (13.1%) |
| 75 Years and over | 5 (26.3%) | 43 (29.4%) |
Disability Class: Vision Difficulty
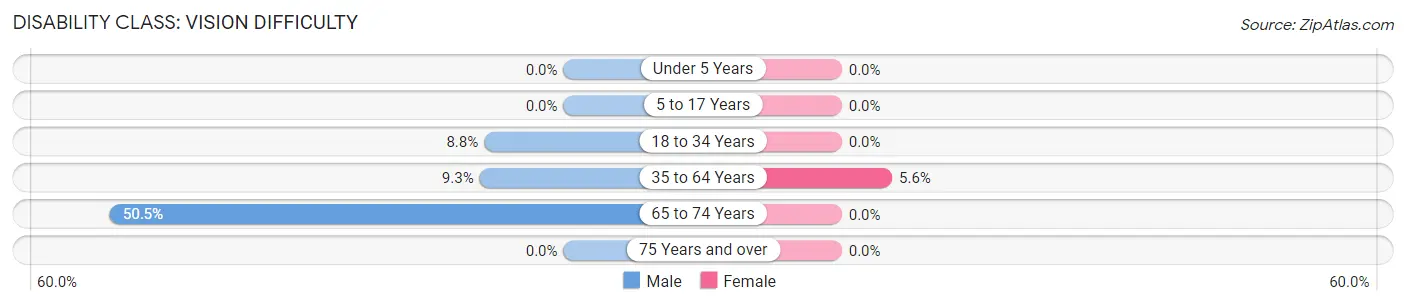
| Age Bracket | Male | Female |
| Under 5 Years | 0 (0.0%) | 0 (0.0%) |
| 5 to 17 Years | 0 (0.0%) | 0 (0.0%) |
| 18 to 34 Years | 52 (8.8%) | 0 (0.0%) |
| 35 to 64 Years | 48 (9.3%) | 38 (5.6%) |
| 65 to 74 Years | 51 (50.5%) | 0 (0.0%) |
| 75 Years and over | 0 (0.0%) | 0 (0.0%) |
Disability Class: Cognitive Difficulty
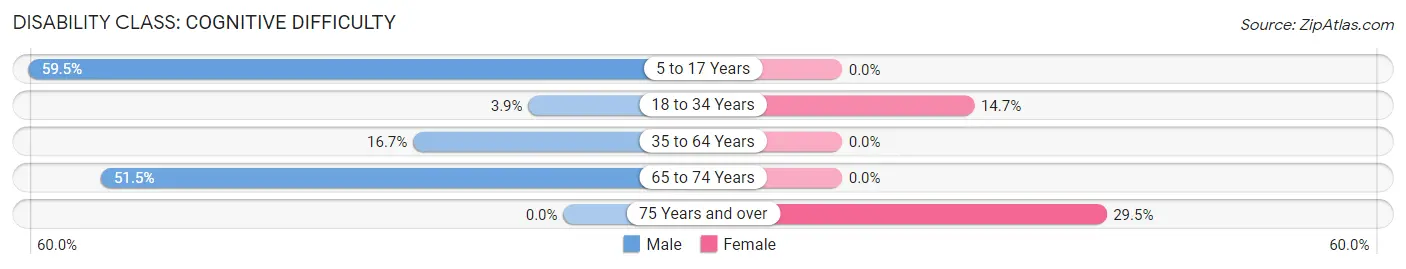
| Age Bracket | Male | Female |
| 5 to 17 Years | 303 (59.5%) | 0 (0.0%) |
| 18 to 34 Years | 23 (3.9%) | 107 (14.7%) |
| 35 to 64 Years | 86 (16.7%) | 0 (0.0%) |
| 65 to 74 Years | 52 (51.5%) | 0 (0.0%) |
| 75 Years and over | 0 (0.0%) | 43 (29.4%) |
Disability Class: Ambulatory Difficulty
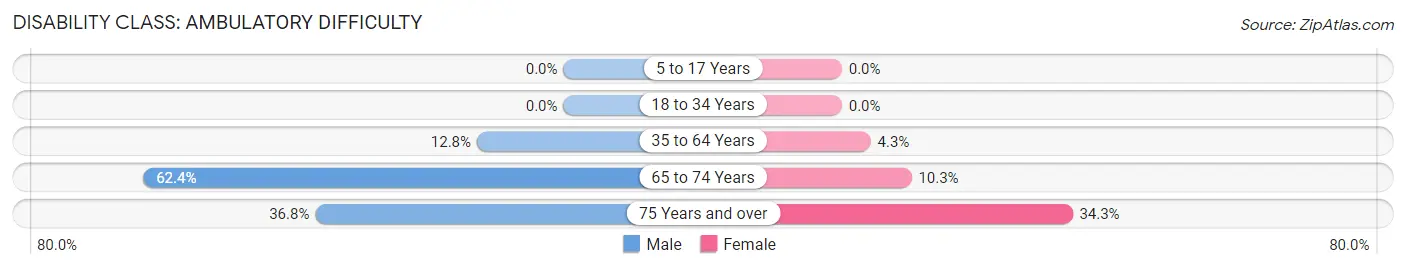
| Age Bracket | Male | Female |
| 5 to 17 Years | 0 (0.0%) | 0 (0.0%) |
| 18 to 34 Years | 0 (0.0%) | 0 (0.0%) |
| 35 to 64 Years | 66 (12.8%) | 29 (4.3%) |
| 65 to 74 Years | 63 (62.4%) | 15 (10.3%) |
| 75 Years and over | 7 (36.8%) | 50 (34.3%) |
Disability Class: Self-Care Difficulty
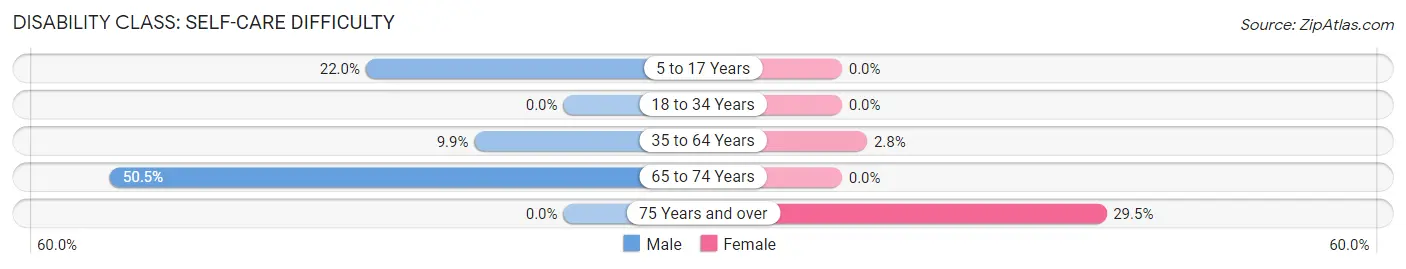
| Age Bracket | Male | Female |
| 5 to 17 Years | 112 (22.0%) | 0 (0.0%) |
| 18 to 34 Years | 0 (0.0%) | 0 (0.0%) |
| 35 to 64 Years | 51 (9.9%) | 19 (2.8%) |
| 65 to 74 Years | 51 (50.5%) | 0 (0.0%) |
| 75 Years and over | 0 (0.0%) | 43 (29.4%) |
Technology Access in Duncan
Computing Device Access in Duncan
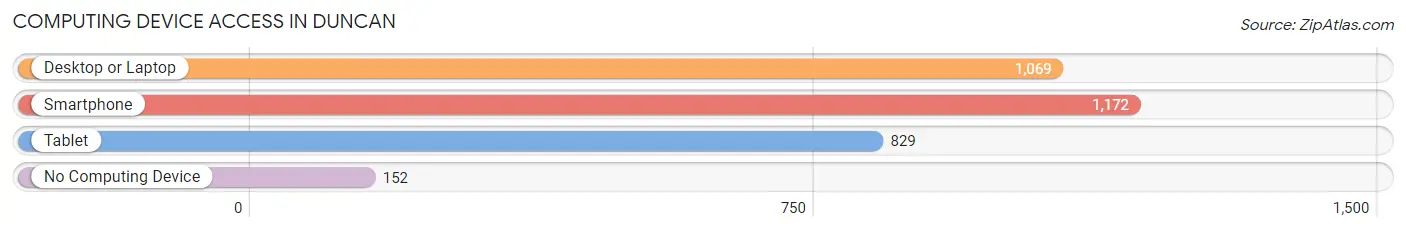
| Device Type | # Households | % Households |
| Desktop or Laptop | 1,069 | 67.9% |
| Smartphone | 1,172 | 74.5% |
| Tablet | 829 | 52.7% |
| No Computing Device | 152 | 9.7% |
| Total | 1,574 | 100.0% |
Internet Access in Duncan
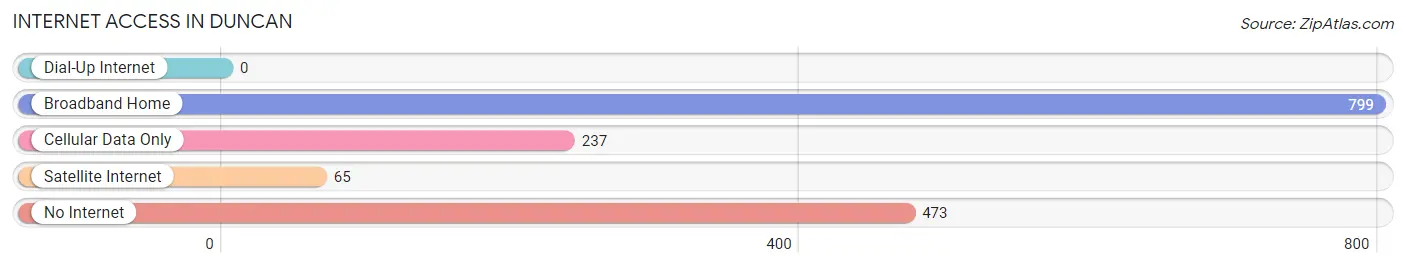
| Internet Type | # Households | % Households |
| Dial-Up Internet | 0 | 0.0% |
| Broadband Home | 799 | 50.8% |
| Cellular Data Only | 237 | 15.1% |
| Satellite Internet | 65 | 4.1% |
| No Internet | 473 | 30.0% |
| Total | 1,574 | 100.0% |
Duncan Summary
Duncan, South Carolina is a small town located in Spartanburg County, in the Upstate region of the state. The town is situated along the I-85 corridor, approximately 20 miles south of Greenville and 25 miles northwest of Spartanburg. The town is home to approximately 2,500 people, and is part of the larger Spartanburg metropolitan area.
History
The area that is now Duncan was first settled in the late 1700s by Scots-Irish immigrants. The town was originally known as “Cross Keys”, and was renamed in 1839 after William Duncan, a local landowner. The town was officially incorporated in 1891.
In the late 19th century, Duncan was a thriving agricultural community, with cotton and tobacco being the primary crops. The town was also home to several mills, including a cotton mill, a grist mill, and a saw mill.
In the early 20th century, Duncan began to experience a period of growth and development. The town was connected to the railroad in 1910, and the first bank opened in 1912. The town also saw the construction of several new buildings, including a post office, a school, and a library.
Geography
Duncan is located in the foothills of the Blue Ridge Mountains, and is part of the larger Piedmont region of South Carolina. The town is situated along the I-85 corridor, approximately 20 miles south of Greenville and 25 miles northwest of Spartanburg.
The town is located in a hilly area, with elevations ranging from 600 to 900 feet above sea level. The town is located in a humid subtropical climate zone, with hot, humid summers and mild winters.
Economy
The economy of Duncan is largely based on manufacturing and agriculture. The town is home to several manufacturing companies, including a plastics manufacturer, a textile manufacturer, and a furniture manufacturer.
Agriculture is also an important part of the local economy. The town is home to several farms, which produce a variety of crops, including cotton, tobacco, corn, soybeans, and wheat.
Demographics
As of the 2010 census, the population of Duncan was 2,521. The racial makeup of the town was 79.3% White, 16.2% African American, 0.7% Native American, 0.7% Asian, 0.1% Pacific Islander, and 2.9% from other races. Hispanic or Latino of any race were 3.2% of the population.
The median household income in Duncan was $37,917, and the median family income was $45,938. The per capita income was $19,945. About 15.2% of families and 18.2% of the population were below the poverty line, including 25.2% of those under age 18 and 11.2% of those age 65 or over.
Common Questions
What is Per Capita Income in Duncan?
Per Capita income in Duncan is $26,367.
What is the Median Family Income in Duncan?
Median Family Income in Duncan is $67,202.
What is the Median Household income in Duncan?
Median Household Income in Duncan is $58,112.
What is Income or Wage Gap in Duncan?
Income or Wage Gap in Duncan is 4.7%.
Women in Duncan earn 95.3 cents for every dollar earned by a man.
What is Inequality or Gini Index in Duncan?
Inequality or Gini Index in Duncan is 0.39.
What is the Total Population of Duncan?
Total Population of Duncan is 4,053.
What is the Total Male Population of Duncan?
Total Male Population of Duncan is 1,893.
What is the Total Female Population of Duncan?
Total Female Population of Duncan is 2,160.
What is the Ratio of Males per 100 Females in Duncan?
There are 87.64 Males per 100 Females in Duncan.
What is the Ratio of Females per 100 Males in Duncan?
There are 114.10 Females per 100 Males in Duncan.
What is the Median Population Age in Duncan?
Median Population Age in Duncan is 30.3 Years.
What is the Average Family Size in Duncan
Average Family Size in Duncan is 3.0 People.
What is the Average Household Size in Duncan
Average Household Size in Duncan is 2.6 People.
How Large is the Labor Force in Duncan?
There are 2,026 People in the Labor Forcein in Duncan.
What is the Percentage of People in the Labor Force in Duncan?
67.8% of People are in the Labor Force in Duncan.
What is the Unemployment Rate in Duncan?
Unemployment Rate in Duncan is 3.1%.