Dalzell, SC Map & Demographics
Dalzell Map
Dalzell Overview
$27,107
PER CAPITA INCOME
$63,972
AVG FAMILY INCOME
$62,159
AVG HOUSEHOLD INCOME
26.7%
WAGE / INCOME GAP [ % ]
73.3¢/ $1
WAGE / INCOME GAP [ $ ]
0.42
INEQUALITY / GINI INDEX
3,417
TOTAL POPULATION
1,429
MALE POPULATION
1,988
FEMALE POPULATION
71.88
MALES / 100 FEMALES
139.12
FEMALES / 100 MALES
30.3
MEDIAN AGE
3.2
AVG FAMILY SIZE
2.7
AVG HOUSEHOLD SIZE
1,691
LABOR FORCE [ PEOPLE ]
68.6%
PERCENT IN LABOR FORCE
9.3%
UNEMPLOYMENT RATE
Dalzell Zip Codes
Dalzell Area Codes
Income in Dalzell
Income Overview in Dalzell
Per Capita Income in Dalzell is $27,107, while median incomes of families and households are $63,972 and $62,159 respectively.
| Characteristic | Number | Measure |
| Per Capita Income | 3,417 | $27,107 |
| Median Family Income | 847 | $63,972 |
| Mean Family Income | 847 | $80,212 |
| Median Household Income | 1,254 | $62,159 |
| Mean Household Income | 1,254 | $73,024 |
| Income Deficit | 847 | $0 |
| Wage / Income Gap (%) | 3,417 | 26.67% |
| Wage / Income Gap ($) | 3,417 | 73.33¢ per $1 |
| Gini / Inequality Index | 3,417 | 0.42 |
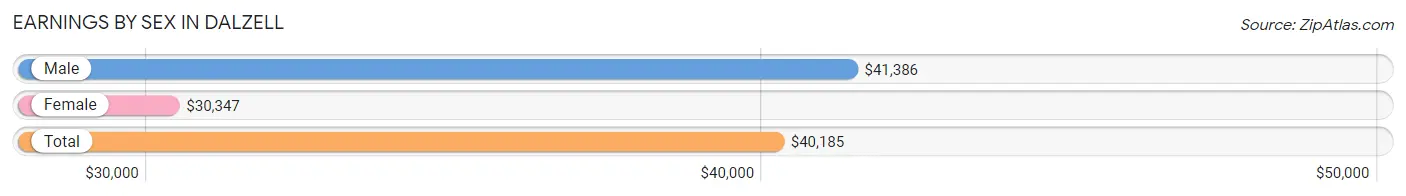
Earnings by Sex in Dalzell
Average Earnings in Dalzell are $40,185, $41,386 for men and $30,347 for women, a difference of 26.7%.
| Sex | Number | Average Earnings |
| Male | 843 (48.1%) | $41,386 |
| Female | 910 (51.9%) | $30,347 |
| Total | 1,753 (100.0%) | $40,185 |
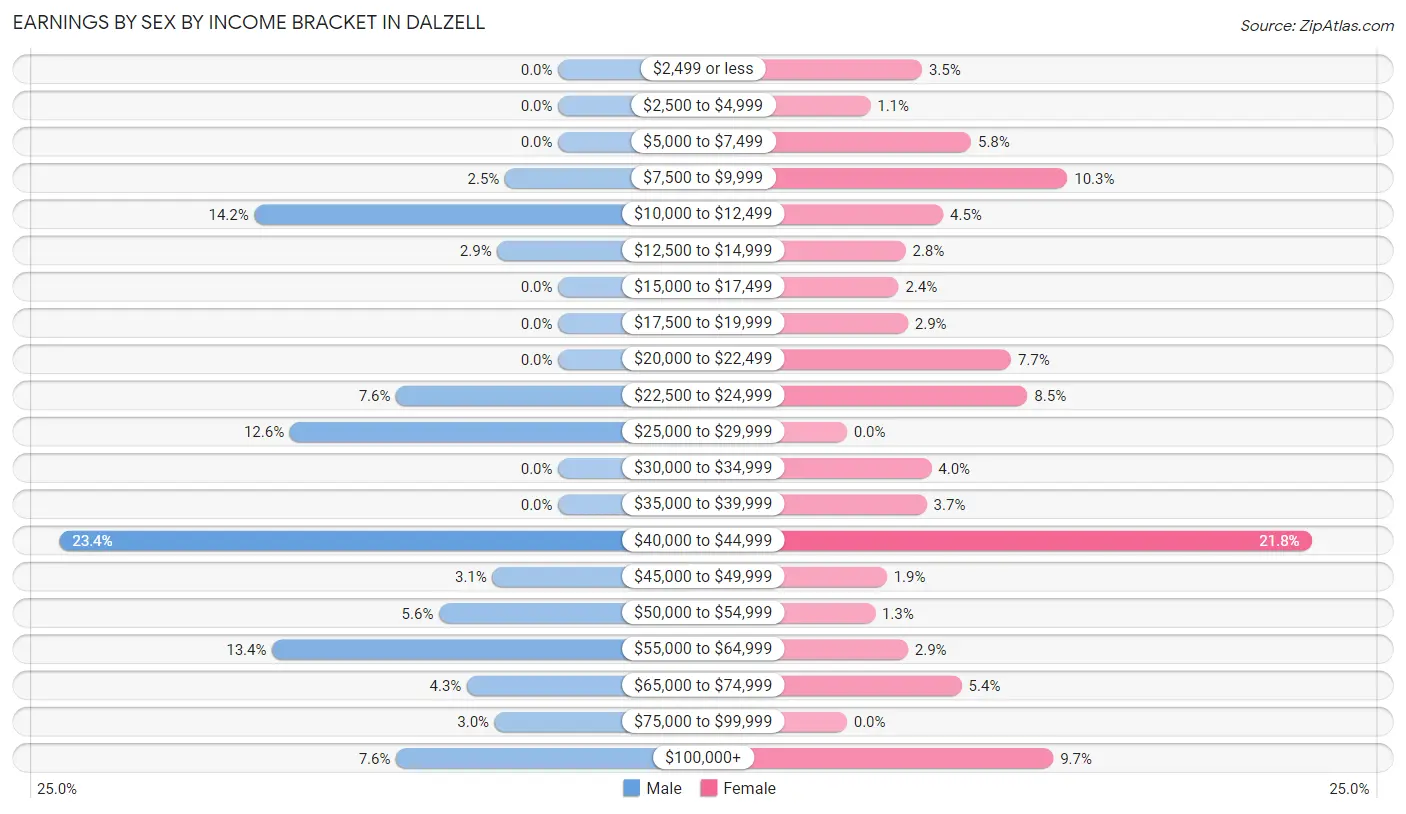
Earnings by Sex by Income Bracket in Dalzell
The most common earnings brackets in Dalzell are $40,000 to $44,999 for men (197 | 23.4%) and $40,000 to $44,999 for women (198 | 21.8%).
| Income | Male | Female |
| $2,499 or less | 0 (0.0%) | 32 (3.5%) |
| $2,500 to $4,999 | 0 (0.0%) | 10 (1.1%) |
| $5,000 to $7,499 | 0 (0.0%) | 53 (5.8%) |
| $7,500 to $9,999 | 21 (2.5%) | 94 (10.3%) |
| $10,000 to $12,499 | 120 (14.2%) | 41 (4.5%) |
| $12,500 to $14,999 | 24 (2.9%) | 25 (2.8%) |
| $15,000 to $17,499 | 0 (0.0%) | 22 (2.4%) |
| $17,500 to $19,999 | 0 (0.0%) | 26 (2.9%) |
| $20,000 to $22,499 | 0 (0.0%) | 70 (7.7%) |
| $22,500 to $24,999 | 64 (7.6%) | 77 (8.5%) |
| $25,000 to $29,999 | 106 (12.6%) | 0 (0.0%) |
| $30,000 to $34,999 | 0 (0.0%) | 36 (4.0%) |
| $35,000 to $39,999 | 0 (0.0%) | 34 (3.7%) |
| $40,000 to $44,999 | 197 (23.4%) | 198 (21.8%) |
| $45,000 to $49,999 | 26 (3.1%) | 17 (1.9%) |
| $50,000 to $54,999 | 47 (5.6%) | 12 (1.3%) |
| $55,000 to $64,999 | 113 (13.4%) | 26 (2.9%) |
| $65,000 to $74,999 | 36 (4.3%) | 49 (5.4%) |
| $75,000 to $99,999 | 25 (3.0%) | 0 (0.0%) |
| $100,000+ | 64 (7.6%) | 88 (9.7%) |
| Total | 843 (100.0%) | 910 (100.0%) |
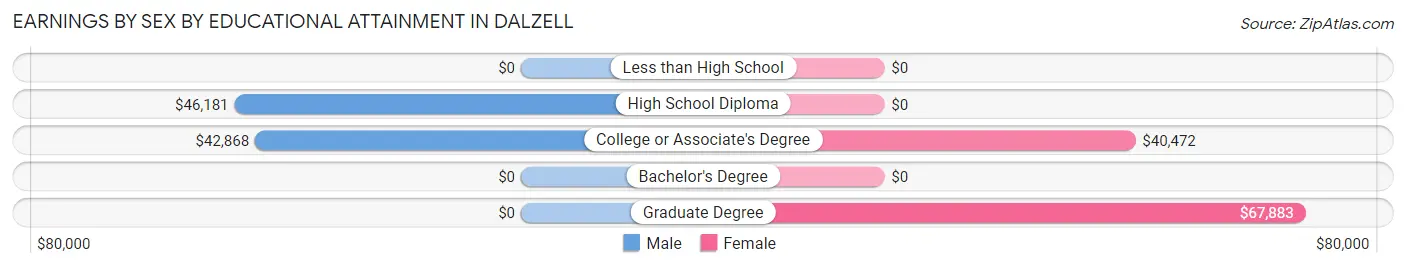
Earnings by Sex by Educational Attainment in Dalzell
Average earnings in Dalzell are $43,933 for men and $35,588 for women, a difference of 19.0%. Men with an educational attainment of high school diploma enjoy the highest average annual earnings of $46,181, while those with college or associate's degree education earn the least with $42,868. Women with an educational attainment of graduate degree earn the most with the average annual earnings of $67,883, while those with college or associate's degree education have the smallest earnings of $40,472.
| Educational Attainment | Male Income | Female Income |
| Less than High School | - | - |
| High School Diploma | $46,181 | $0 |
| College or Associate's Degree | $42,868 | $40,472 |
| Bachelor's Degree | - | - |
| Graduate Degree | - | - |
| Total | $43,933 | $35,588 |
Family Income in Dalzell
Family Income Brackets in Dalzell
According to the Dalzell family income data, there are 284 families falling into the $50,000 to $74,999 income range, which is the most common income bracket and makes up 33.5% of all families.
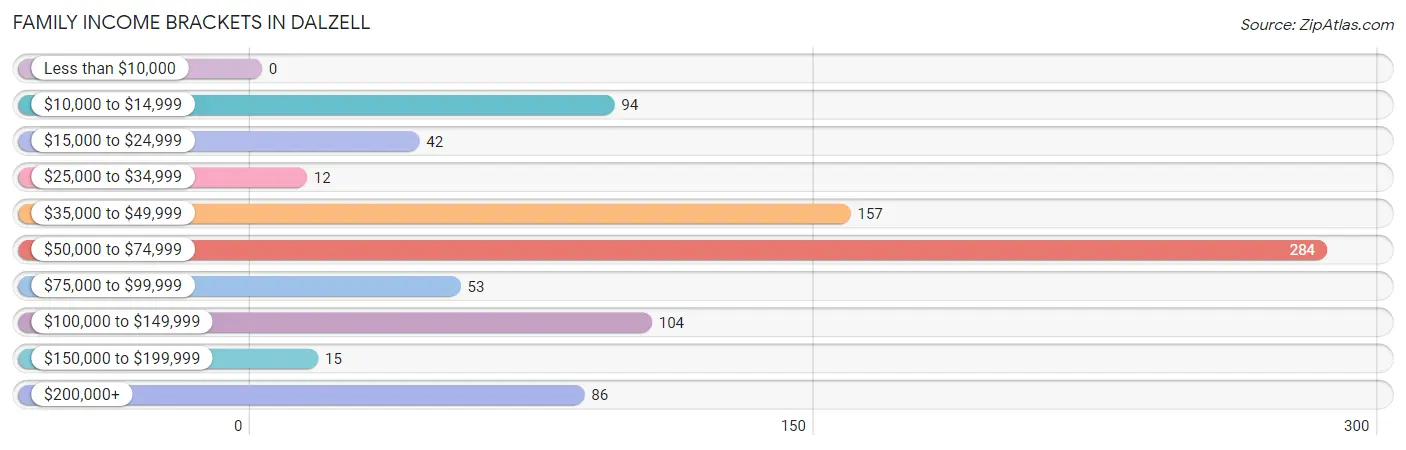
| Income Bracket | # Families | % Families |
| Less than $10,000 | 0 | 0.0% |
| $10,000 to $14,999 | 94 | 11.1% |
| $15,000 to $24,999 | 42 | 5.0% |
| $25,000 to $34,999 | 12 | 1.4% |
| $35,000 to $49,999 | 157 | 18.5% |
| $50,000 to $74,999 | 284 | 33.5% |
| $75,000 to $99,999 | 53 | 6.3% |
| $100,000 to $149,999 | 104 | 12.3% |
| $150,000 to $199,999 | 15 | 1.8% |
| $200,000+ | 86 | 10.2% |
Family Income by Famaliy Size in Dalzell
5-person families (71 | 8.4%) account for the highest median family income in Dalzell with $72,550 per family, while 2-person families (306 | 36.1%) have the highest median income of $21,146 per family member.
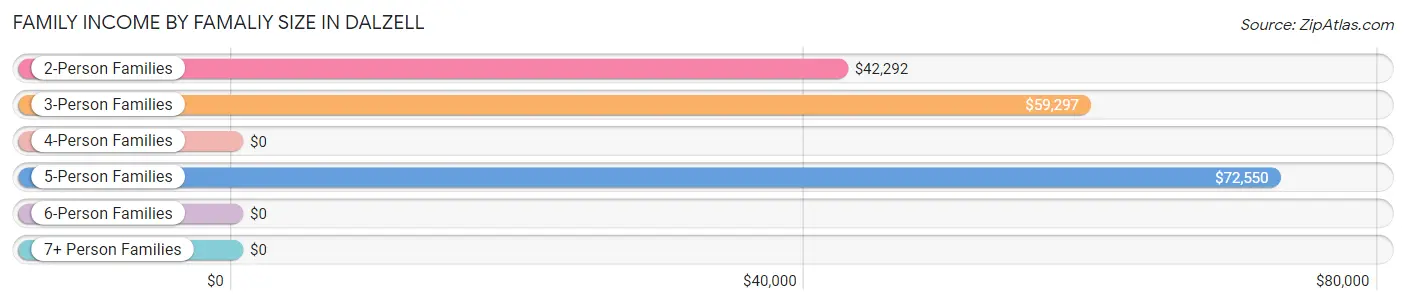
| Income Bracket | # Families | Median Income |
| 2-Person Families | 306 (36.1%) | $42,292 |
| 3-Person Families | 313 (36.9%) | $59,297 |
| 4-Person Families | 142 (16.8%) | $0 |
| 5-Person Families | 71 (8.4%) | $72,550 |
| 6-Person Families | 15 (1.8%) | $0 |
| 7+ Person Families | 0 (0.0%) | $0 |
| Total | 847 (100.0%) | $63,972 |
Family Income by Number of Earners in Dalzell
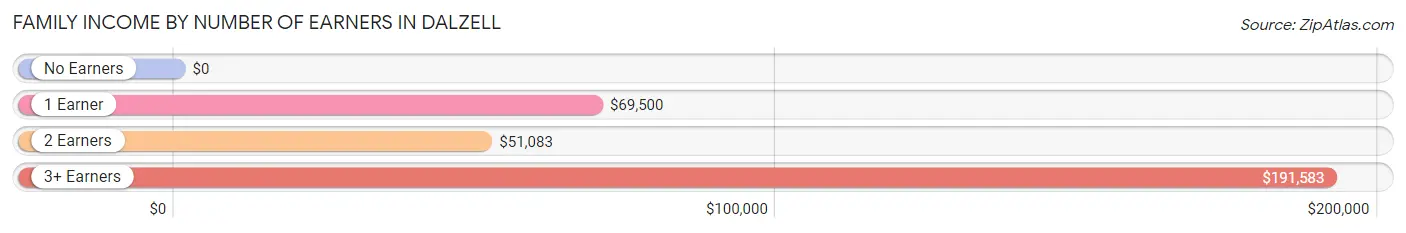
| Number of Earners | # Families | Median Income |
| No Earners | 142 (16.8%) | $0 |
| 1 Earner | 330 (39.0%) | $69,500 |
| 2 Earners | 292 (34.5%) | $51,083 |
| 3+ Earners | 83 (9.8%) | $191,583 |
| Total | 847 (100.0%) | $63,972 |
Household Income in Dalzell
Household Income Brackets in Dalzell
With 444 households falling in the category, the $50,000 to $74,999 income range is the most frequent in Dalzell, accounting for 35.4% of all households. In contrast, only 33 households (2.6%) fall into the $25,000 to $34,999 income bracket, making it the least populous group.
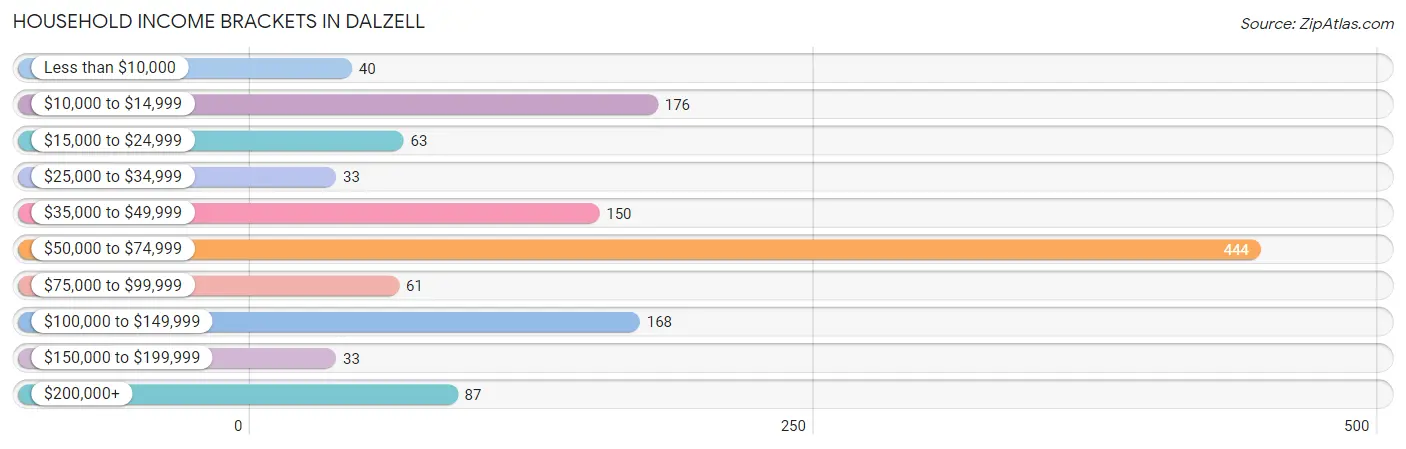
| Income Bracket | # Households | % Households |
| Less than $10,000 | 40 | 3.2% |
| $10,000 to $14,999 | 176 | 14.0% |
| $15,000 to $24,999 | 63 | 5.0% |
| $25,000 to $34,999 | 33 | 2.6% |
| $35,000 to $49,999 | 150 | 12.0% |
| $50,000 to $74,999 | 444 | 35.4% |
| $75,000 to $99,999 | 61 | 4.9% |
| $100,000 to $149,999 | 168 | 13.4% |
| $150,000 to $199,999 | 33 | 2.6% |
| $200,000+ | 87 | 6.9% |
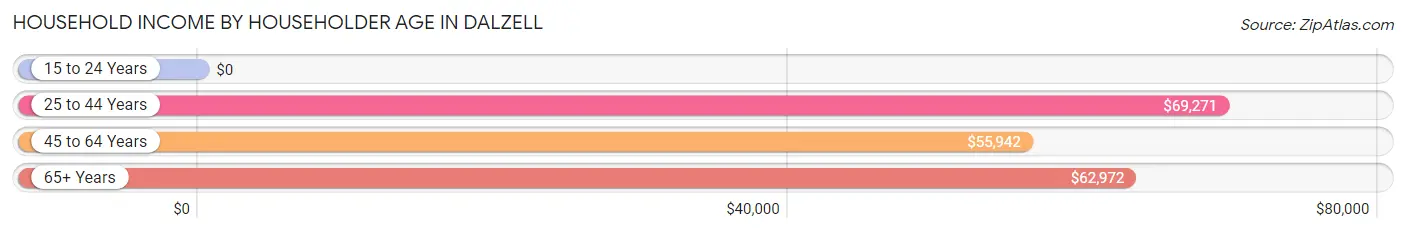
Household Income by Householder Age in Dalzell
The median household income in Dalzell is $62,159, with the highest median household income of $69,271 found in the 25 to 44 years age bracket for the primary householder. A total of 523 households (41.7%) fall into this category. Meanwhile, the 15 to 24 years age bracket for the primary householder has the lowest median household income of $0, with 146 households (11.6%) in this group.
| Income Bracket | # Households | Median Income |
| 15 to 24 Years | 146 (11.6%) | $0 |
| 25 to 44 Years | 523 (41.7%) | $69,271 |
| 45 to 64 Years | 320 (25.5%) | $55,942 |
| 65+ Years | 265 (21.1%) | $62,972 |
| Total | 1,254 (100.0%) | $62,159 |
Poverty in Dalzell
Income Below Poverty by Sex and Age in Dalzell
With 14.1% poverty level for males and 12.9% for females among the residents of Dalzell, 18 to 24 year old males and 65 to 74 year old females are the most vulnerable to poverty, with 120 males (56.9%) and 61 females (64.2%) in their respective age groups living below the poverty level.
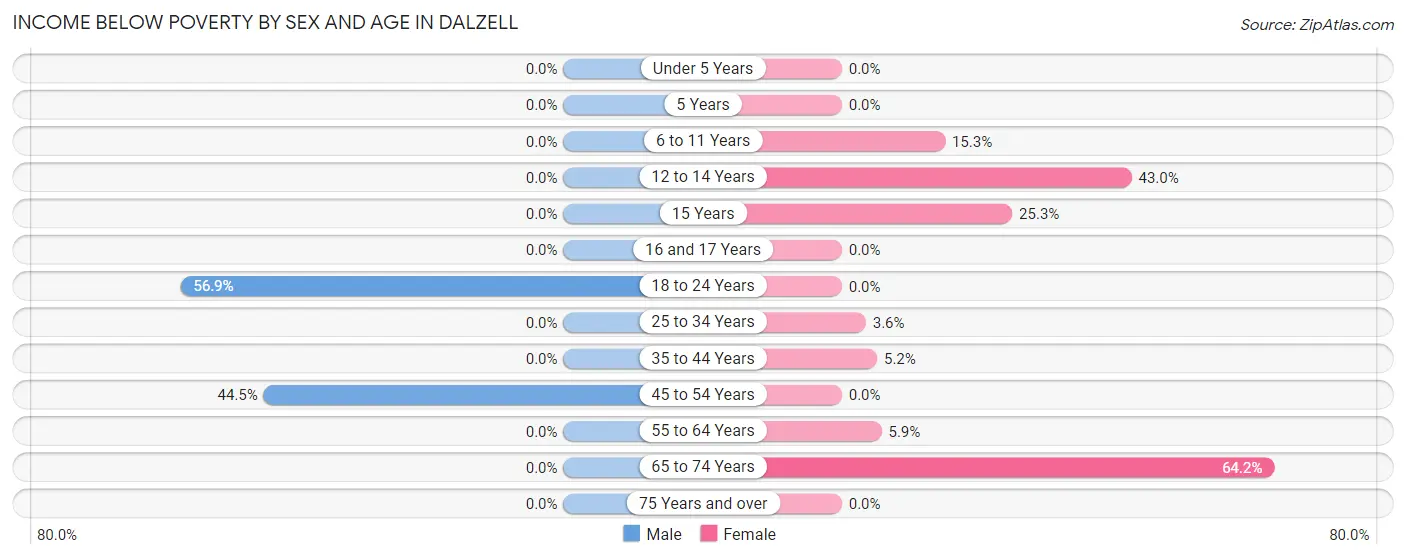
| Age Bracket | Male | Female |
| Under 5 Years | 0 (0.0%) | 0 (0.0%) |
| 5 Years | 0 (0.0%) | 0 (0.0%) |
| 6 to 11 Years | 0 (0.0%) | 19 (15.3%) |
| 12 to 14 Years | 0 (0.0%) | 105 (43.0%) |
| 15 Years | 0 (0.0%) | 21 (25.3%) |
| 16 and 17 Years | 0 (0.0%) | 0 (0.0%) |
| 18 to 24 Years | 120 (56.9%) | 0 (0.0%) |
| 25 to 34 Years | 0 (0.0%) | 12 (3.6%) |
| 35 to 44 Years | 0 (0.0%) | 17 (5.2%) |
| 45 to 54 Years | 77 (44.5%) | 0 (0.0%) |
| 55 to 64 Years | 0 (0.0%) | 17 (5.9%) |
| 65 to 74 Years | 0 (0.0%) | 61 (64.2%) |
| 75 Years and over | 0 (0.0%) | 0 (0.0%) |
| Total | 197 (14.1%) | 252 (12.9%) |
Income Above Poverty by Sex and Age in Dalzell
According to the poverty statistics in Dalzell, males aged under 5 years and females aged under 5 years are the age groups that are most secure financially, with 100.0% of males and 100.0% of females in these age groups living above the poverty line.
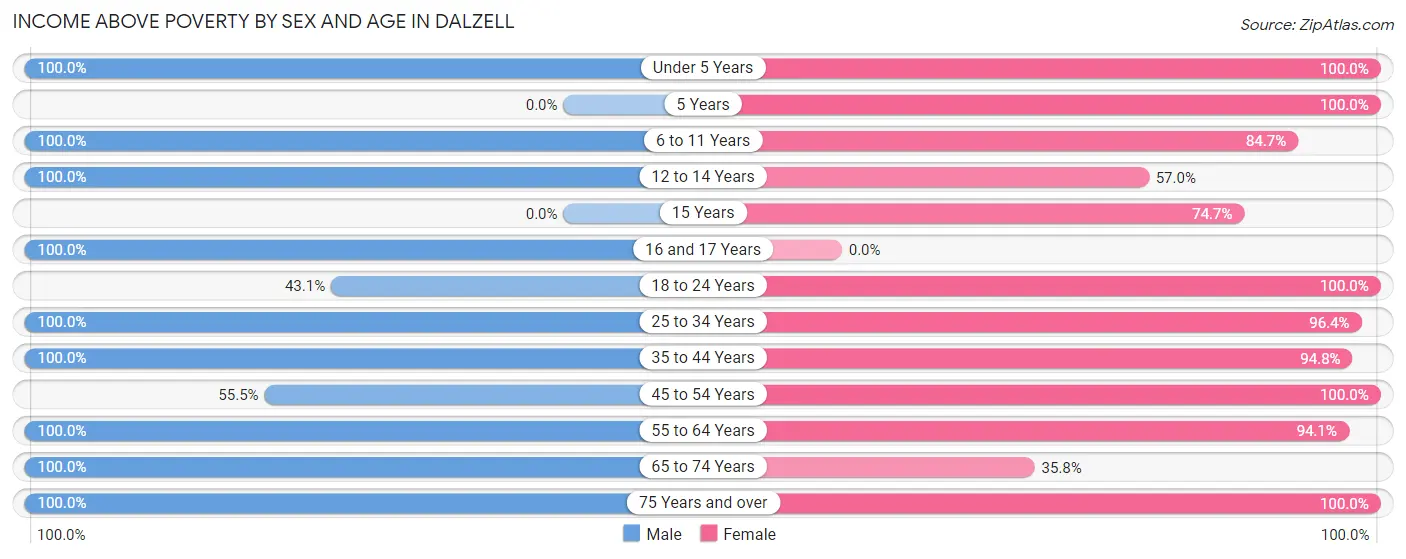
| Age Bracket | Male | Female |
| Under 5 Years | 209 (100.0%) | 129 (100.0%) |
| 5 Years | 0 (0.0%) | 21 (100.0%) |
| 6 to 11 Years | 46 (100.0%) | 105 (84.7%) |
| 12 to 14 Years | 22 (100.0%) | 139 (57.0%) |
| 15 Years | 0 (0.0%) | 62 (74.7%) |
| 16 and 17 Years | 8 (100.0%) | 0 (0.0%) |
| 18 to 24 Years | 91 (43.1%) | 112 (100.0%) |
| 25 to 34 Years | 367 (100.0%) | 325 (96.4%) |
| 35 to 44 Years | 95 (100.0%) | 308 (94.8%) |
| 45 to 54 Years | 96 (55.5%) | 93 (100.0%) |
| 55 to 64 Years | 130 (100.0%) | 271 (94.1%) |
| 65 to 74 Years | 93 (100.0%) | 34 (35.8%) |
| 75 Years and over | 42 (100.0%) | 96 (100.0%) |
| Total | 1,199 (85.9%) | 1,695 (87.1%) |
Income Below Poverty Among Married-Couple Families in Dalzell
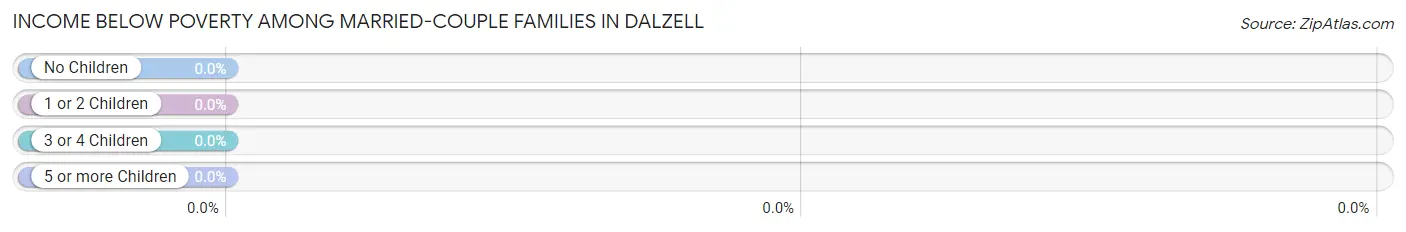
| Children | Above Poverty | Below Poverty |
| No Children | 224 (100.0%) | 0 (0.0%) |
| 1 or 2 Children | 203 (100.0%) | 0 (0.0%) |
| 3 or 4 Children | 60 (100.0%) | 0 (0.0%) |
| 5 or more Children | 0 (0.0%) | 0 (0.0%) |
| Total | 487 (100.0%) | 0 (0.0%) |
Income Below Poverty Among Single-Parent Households in Dalzell
According to the poverty data in Dalzell, 64.7% or 77 single-father households and 7.0% or 17 single-mother households are living below the poverty line. Among single-father households, those with 1 or 2 children have the highest poverty rate, with 77 households (100.0%) experiencing poverty. Likewise, among single-mother households, those with 3 or 4 children have the highest poverty rate, with 17 households (100.0%) falling below the poverty line.
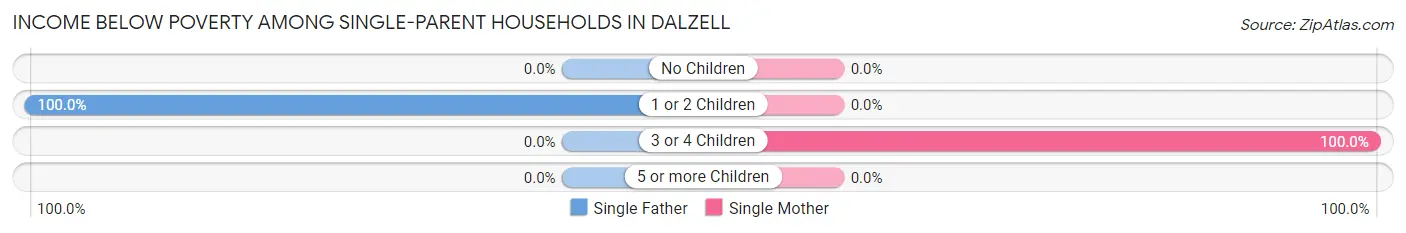
| Children | Single Father | Single Mother |
| No Children | 0 (0.0%) | 0 (0.0%) |
| 1 or 2 Children | 77 (100.0%) | 0 (0.0%) |
| 3 or 4 Children | 0 (0.0%) | 17 (100.0%) |
| 5 or more Children | 0 (0.0%) | 0 (0.0%) |
| Total | 77 (64.7%) | 17 (7.0%) |
Income Below Poverty Among Married-Couple vs Single-Parent Households in Dalzell
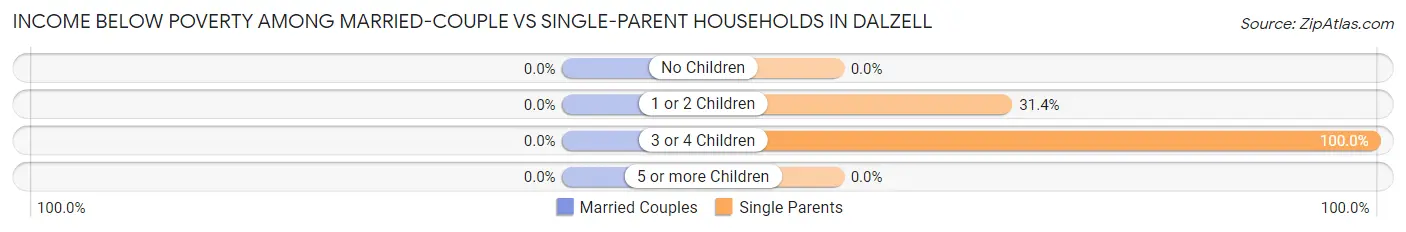
| Children | Married-Couple Families | Single-Parent Households |
| No Children | 0 (0.0%) | 0 (0.0%) |
| 1 or 2 Children | 0 (0.0%) | 77 (31.4%) |
| 3 or 4 Children | 0 (0.0%) | 17 (100.0%) |
| 5 or more Children | 0 (0.0%) | 0 (0.0%) |
| Total | 0 (0.0%) | 94 (26.1%) |
Race in Dalzell
The most populous races in Dalzell are White / Caucasian (1,932 | 56.5%), Black / African American (1,216 | 35.6%), and Two or more Races (234 | 6.9%).
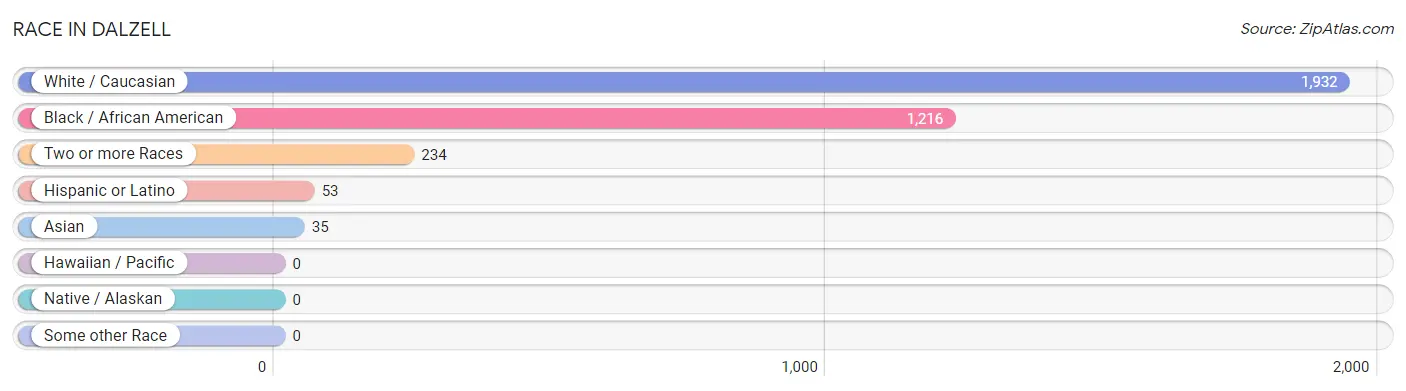
| Race | # Population | % Population |
| Asian | 35 | 1.0% |
| Black / African American | 1,216 | 35.6% |
| Hawaiian / Pacific | 0 | 0.0% |
| Hispanic or Latino | 53 | 1.5% |
| Native / Alaskan | 0 | 0.0% |
| White / Caucasian | 1,932 | 56.5% |
| Two or more Races | 234 | 6.9% |
| Some other Race | 0 | 0.0% |
| Total | 3,417 | 100.0% |
Ancestry in Dalzell
The most populous ancestries reported in Dalzell are English (375 | 11.0%), Irish (279 | 8.2%), German (245 | 7.2%), Italian (203 | 5.9%), and American (145 | 4.2%), together accounting for 36.5% of all Dalzell residents.
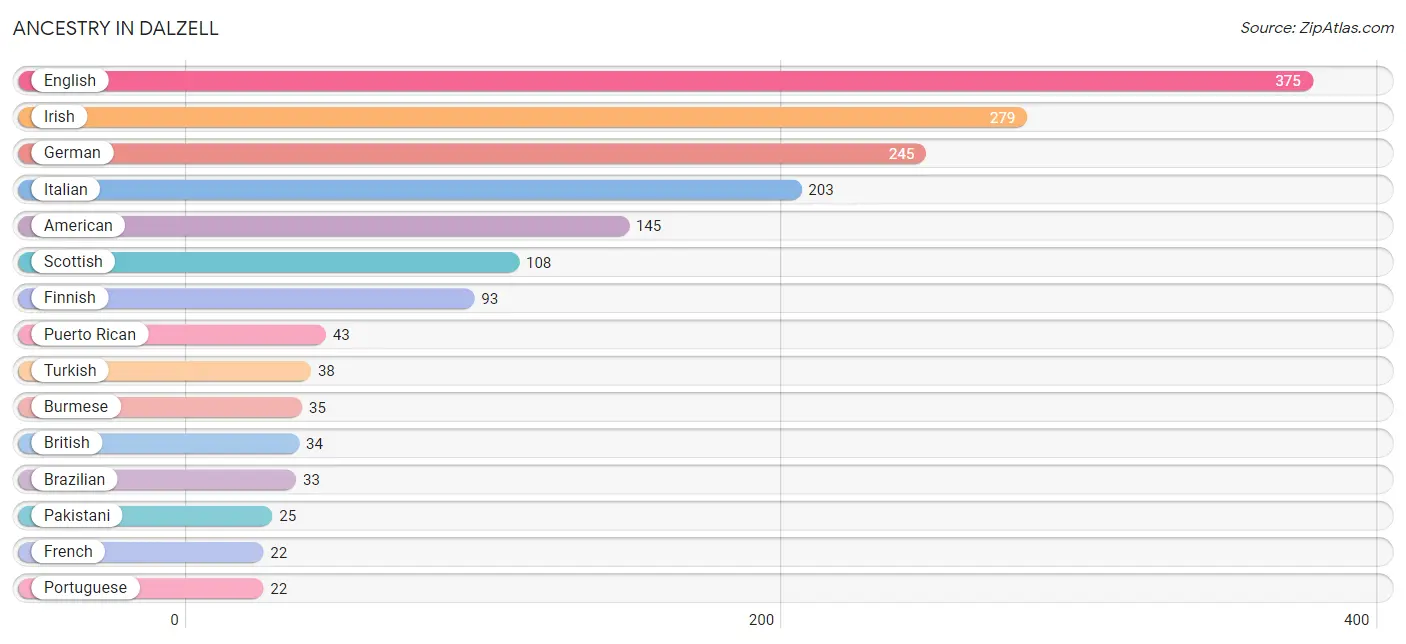
| Ancestry | # Population | % Population |
| American | 145 | 4.2% |
| Brazilian | 33 | 1.0% |
| British | 34 | 1.0% |
| Burmese | 35 | 1.0% |
| Celtic | 17 | 0.5% |
| English | 375 | 11.0% |
| European | 21 | 0.6% |
| Finnish | 93 | 2.7% |
| French | 22 | 0.6% |
| German | 245 | 7.2% |
| Irish | 279 | 8.2% |
| Iroquois | 10 | 0.3% |
| Italian | 203 | 5.9% |
| Pakistani | 25 | 0.7% |
| Portuguese | 22 | 0.6% |
| Puerto Rican | 43 | 1.3% |
| Scottish | 108 | 3.2% |
| Turkish | 38 | 1.1% | View All 18 Rows |
Immigrants in Dalzell
The most numerous immigrant groups reported in Dalzell came from Europe (43 | 1.3%), Germany (43 | 1.3%), Western Europe (43 | 1.3%), Asia (35 | 1.0%), and Eastern Asia (35 | 1.0%), together accounting for 5.8% of all Dalzell residents.
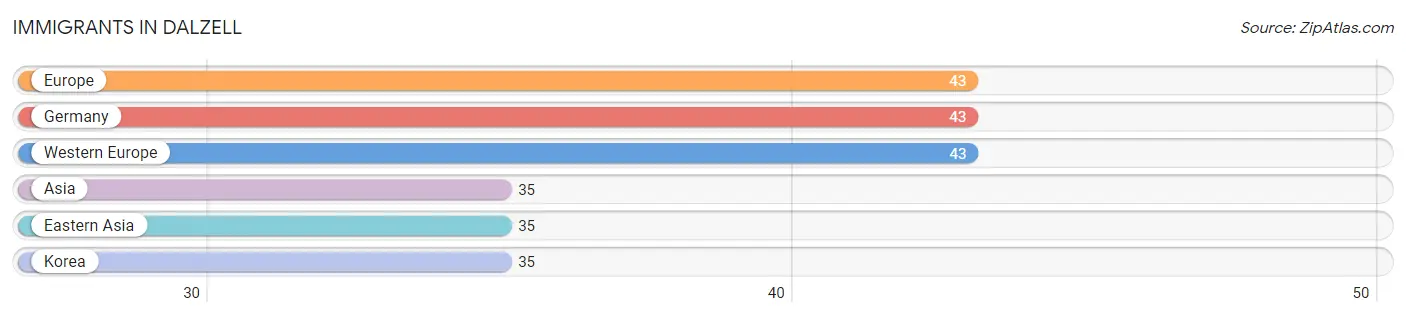
| Immigration Origin | # Population | % Population |
| Asia | 35 | 1.0% |
| Eastern Asia | 35 | 1.0% |
| Europe | 43 | 1.3% |
| Germany | 43 | 1.3% |
| Korea | 35 | 1.0% |
| Western Europe | 43 | 1.3% | View All 6 Rows |
Sex and Age in Dalzell
Sex and Age in Dalzell
The most populous age groups in Dalzell are Under 5 Years (242 | 16.9%) for men and 10 to 14 Years (318 | 16.0%) for women.
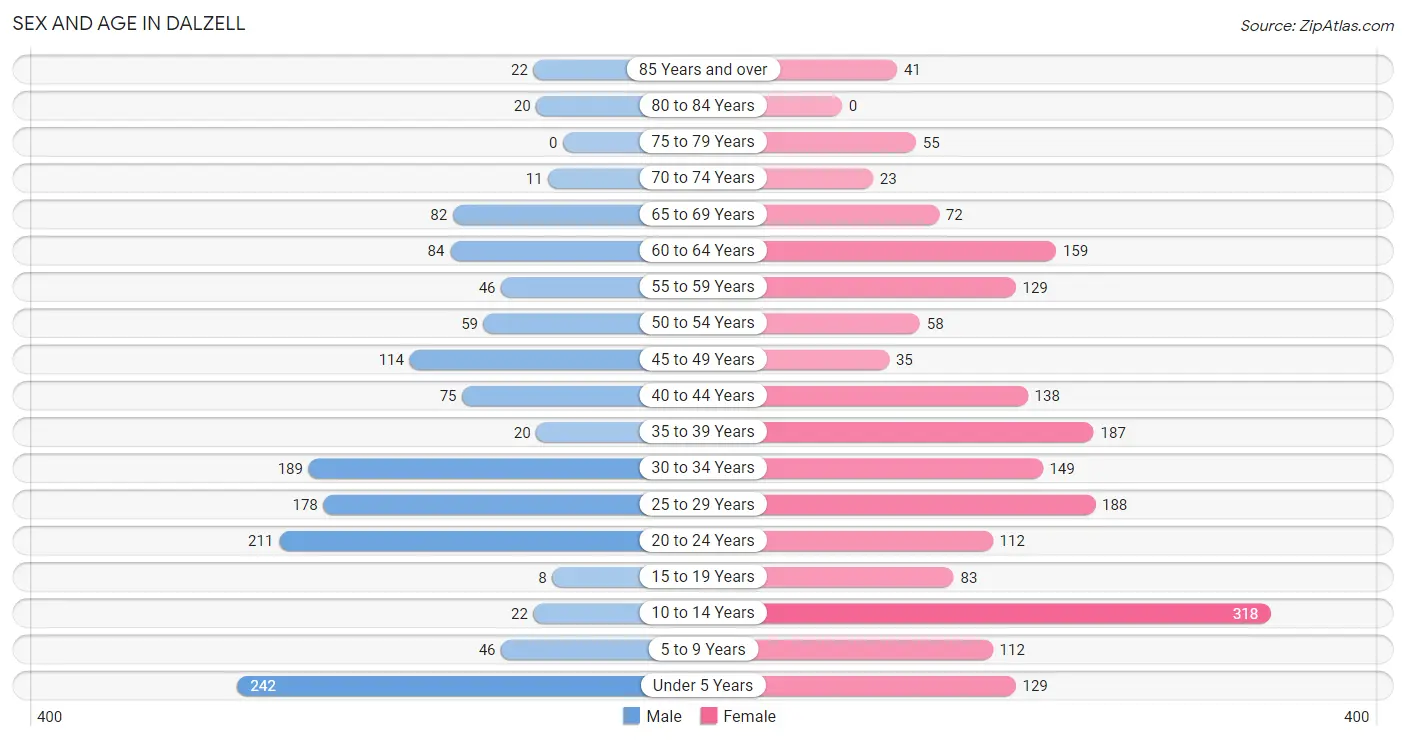
| Age Bracket | Male | Female |
| Under 5 Years | 242 (16.9%) | 129 (6.5%) |
| 5 to 9 Years | 46 (3.2%) | 112 (5.6%) |
| 10 to 14 Years | 22 (1.5%) | 318 (16.0%) |
| 15 to 19 Years | 8 (0.6%) | 83 (4.2%) |
| 20 to 24 Years | 211 (14.8%) | 112 (5.6%) |
| 25 to 29 Years | 178 (12.5%) | 188 (9.5%) |
| 30 to 34 Years | 189 (13.2%) | 149 (7.5%) |
| 35 to 39 Years | 20 (1.4%) | 187 (9.4%) |
| 40 to 44 Years | 75 (5.2%) | 138 (6.9%) |
| 45 to 49 Years | 114 (8.0%) | 35 (1.8%) |
| 50 to 54 Years | 59 (4.1%) | 58 (2.9%) |
| 55 to 59 Years | 46 (3.2%) | 129 (6.5%) |
| 60 to 64 Years | 84 (5.9%) | 159 (8.0%) |
| 65 to 69 Years | 82 (5.7%) | 72 (3.6%) |
| 70 to 74 Years | 11 (0.8%) | 23 (1.2%) |
| 75 to 79 Years | 0 (0.0%) | 55 (2.8%) |
| 80 to 84 Years | 20 (1.4%) | 0 (0.0%) |
| 85 Years and over | 22 (1.5%) | 41 (2.1%) |
| Total | 1,429 (100.0%) | 1,988 (100.0%) |
Families and Households in Dalzell
Median Family Size in Dalzell
The median family size in Dalzell is 3.24 persons per family, with married-couple families (487 | 57.5%) accounting for the largest median family size of 3.69 persons per family. On the other hand, single male/father families (119 | 14.1%) represent the smallest median family size with 2.00 persons per family.
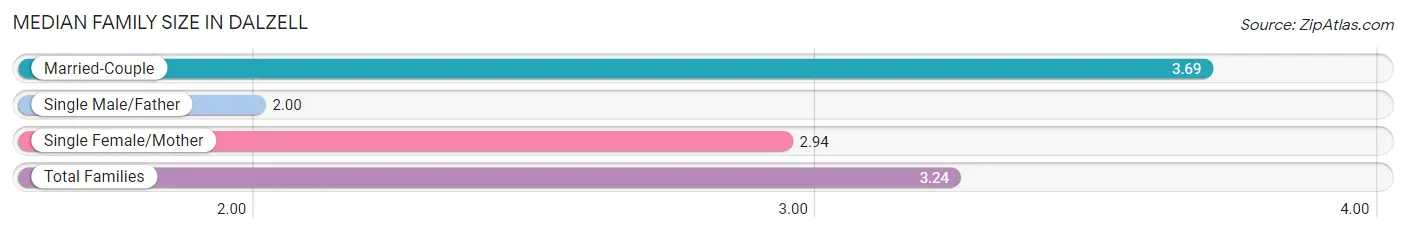
| Family Type | # Families | Family Size |
| Married-Couple | 487 (57.5%) | 3.69 |
| Single Male/Father | 119 (14.1%) | 2.00 |
| Single Female/Mother | 241 (28.4%) | 2.94 |
| Total Families | 847 (100.0%) | 3.24 |
Median Household Size in Dalzell
The median household size in Dalzell is 2.72 persons per household, with married-couple households (487 | 38.8%) accounting for the largest median household size of 3.69 persons per household. non-family households (407 | 32.5%) represent the smallest median household size with 1.39 persons per household.
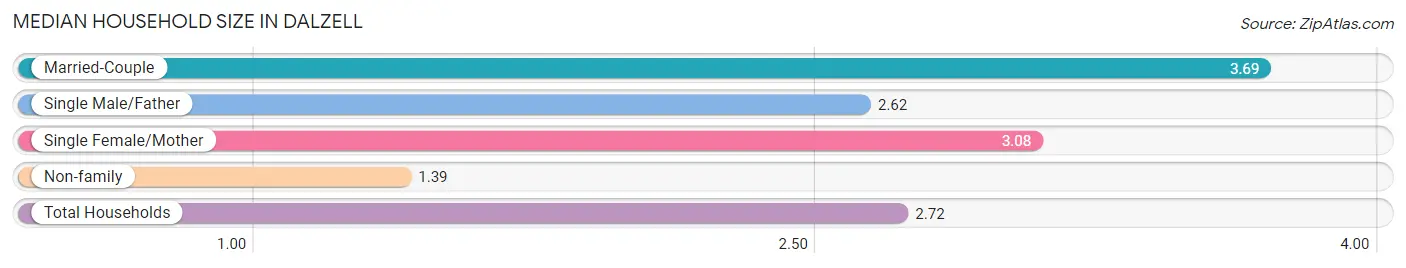
| Household Type | # Households | Household Size |
| Married-Couple | 487 (38.8%) | 3.69 |
| Single Male/Father | 119 (9.5%) | 2.62 |
| Single Female/Mother | 241 (19.2%) | 3.08 |
| Non-family | 407 (32.5%) | 1.39 |
| Total Households | 1,254 (100.0%) | 2.72 |
Household Size by Marriage Status in Dalzell
Out of a total of 1,254 households in Dalzell, 847 (67.5%) are family households, while 407 (32.5%) are nonfamily households. The most numerous type of family households are 3-person households, comprising 427, and the most common type of nonfamily households are 1-person households, comprising 316.
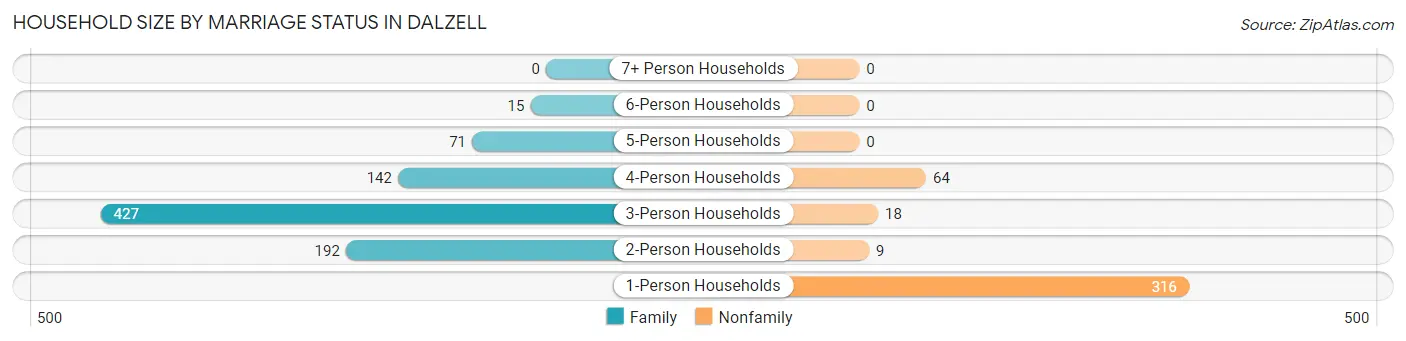
| Household Size | Family Households | Nonfamily Households |
| 1-Person Households | - | 316 (25.2%) |
| 2-Person Households | 192 (15.3%) | 9 (0.7%) |
| 3-Person Households | 427 (34.1%) | 18 (1.4%) |
| 4-Person Households | 142 (11.3%) | 64 (5.1%) |
| 5-Person Households | 71 (5.7%) | 0 (0.0%) |
| 6-Person Households | 15 (1.2%) | 0 (0.0%) |
| 7+ Person Households | 0 (0.0%) | 0 (0.0%) |
| Total | 847 (67.5%) | 407 (32.5%) |
Female Fertility in Dalzell
Fertility by Age in Dalzell
Average fertility rate in Dalzell is 64.0 births per 1,000 women. Women in the age bracket of 20 to 34 years have the highest fertility rate with 127.0 births per 1,000 women. Women in the age bracket of 20 to 34 years acount for 100.0% of all women with births.
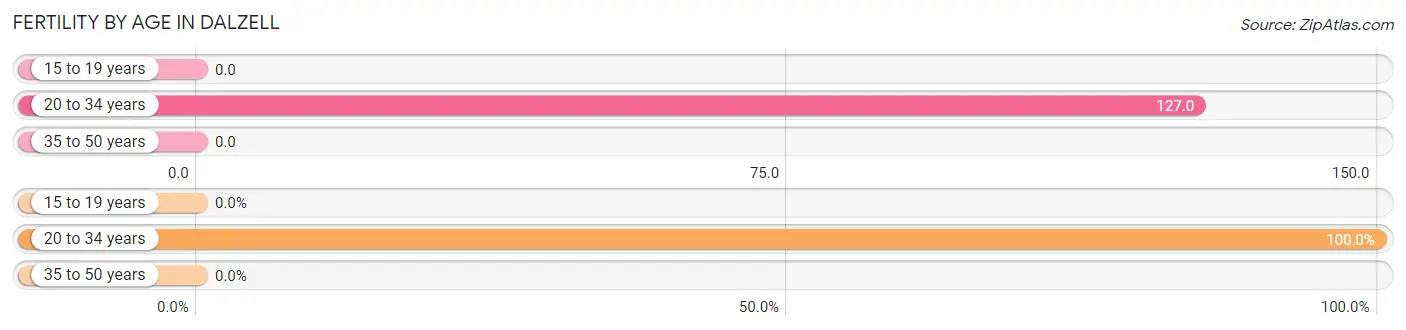
| Age Bracket | Women with Births | Births / 1,000 Women |
| 15 to 19 years | 0 (0.0%) | 0.0 |
| 20 to 34 years | 57 (100.0%) | 127.0 |
| 35 to 50 years | 0 (0.0%) | 0.0 |
| Total | 57 (100.0%) | 64.0 |
Fertility by Age by Marriage Status in Dalzell
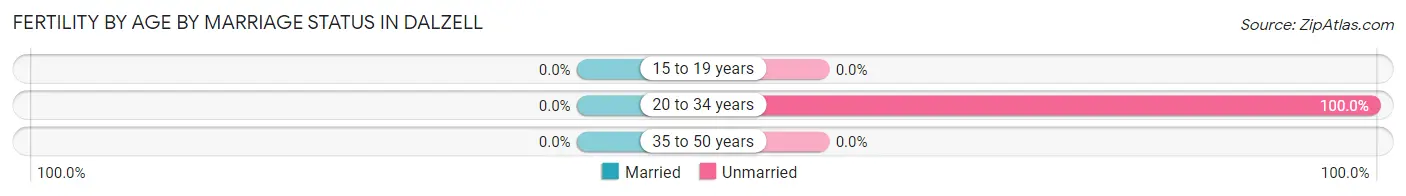
| Age Bracket | Married | Unmarried |
| 15 to 19 years | 0 (0.0%) | 0 (0.0%) |
| 20 to 34 years | 0 (0.0%) | 57 (100.0%) |
| 35 to 50 years | 0 (0.0%) | 0 (0.0%) |
| Total | 0 (0.0%) | 57 (100.0%) |
Fertility by Education in Dalzell
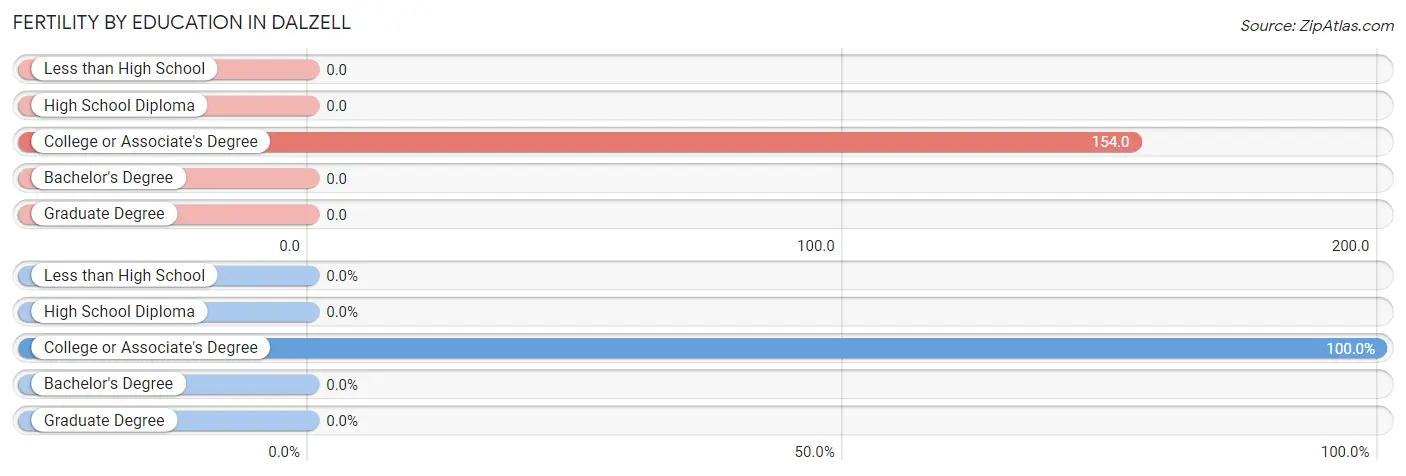
| Educational Attainment | Women with Births | Births / 1,000 Women |
| Less than High School | 0 (0.0%) | 0.0 |
| High School Diploma | 0 (0.0%) | 0.0 |
| College or Associate's Degree | 57 (100.0%) | 154.0 |
| Bachelor's Degree | 0 (0.0%) | 0.0 |
| Graduate Degree | 0 (0.0%) | 0.0 |
| Total | 57 (100.0%) | 64.0 |
Fertility by Education by Marriage Status in Dalzell
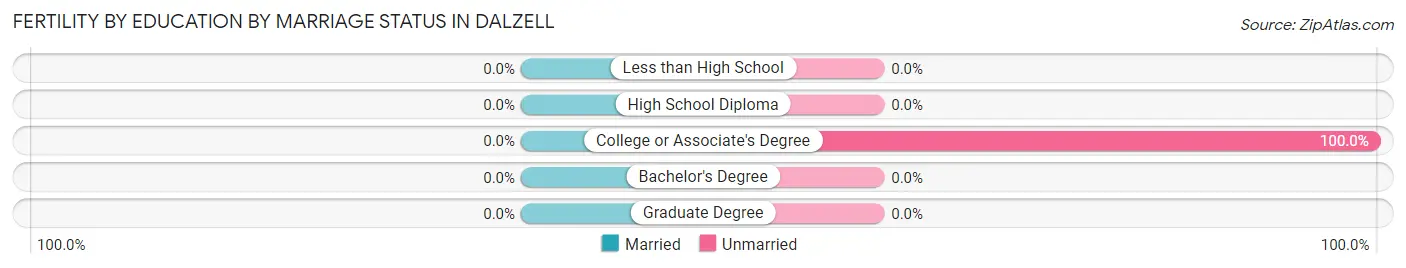
| Educational Attainment | Married | Unmarried |
| Less than High School | 0 (0.0%) | 0 (0.0%) |
| High School Diploma | 0 (0.0%) | 0 (0.0%) |
| College or Associate's Degree | 0 (0.0%) | 57 (100.0%) |
| Bachelor's Degree | 0 (0.0%) | 0 (0.0%) |
| Graduate Degree | 0 (0.0%) | 0 (0.0%) |
| Total | 0 (0.0%) | 57 (100.0%) |
Employment Characteristics in Dalzell
Employment by Class of Employer in Dalzell
Among the 1,553 employed individuals in Dalzell, private company employees (950 | 61.2%), federal government employees (266 | 17.1%), and state government employees (109 | 7.0%) make up the most common classes of employment.
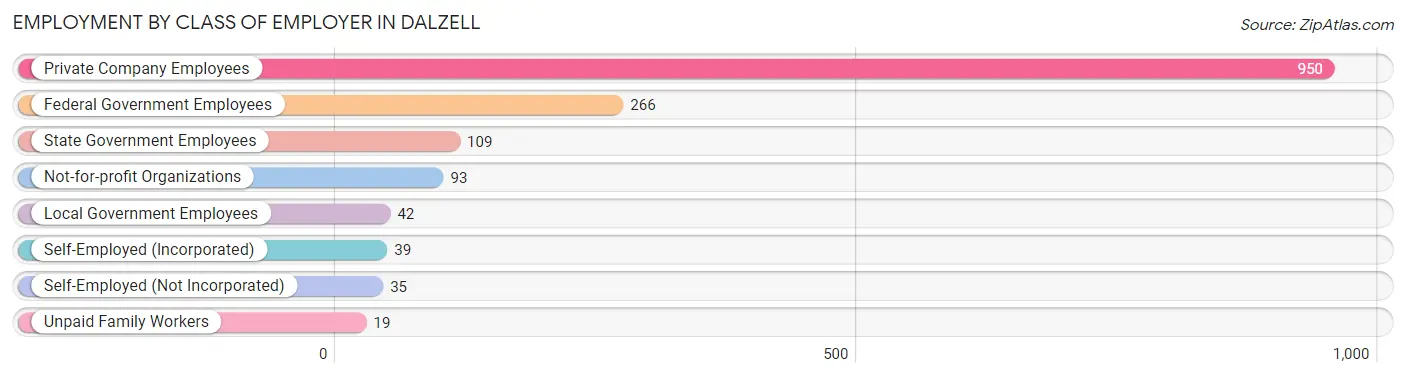
| Employer Class | # Employees | % Employees |
| Private Company Employees | 950 | 61.2% |
| Self-Employed (Incorporated) | 39 | 2.5% |
| Self-Employed (Not Incorporated) | 35 | 2.2% |
| Not-for-profit Organizations | 93 | 6.0% |
| Local Government Employees | 42 | 2.7% |
| State Government Employees | 109 | 7.0% |
| Federal Government Employees | 266 | 17.1% |
| Unpaid Family Workers | 19 | 1.2% |
| Total | 1,553 | 100.0% |
Employment Status by Age in Dalzell
According to the labor force statistics for Dalzell, out of the total population over 16 years of age (2,465), 68.6% or 1,691 individuals are in the labor force, with 9.3% or 157 of them unemployed. The age group with the highest labor force participation rate is 30 to 34 years, with 93.8% or 317 individuals in the labor force. Within the labor force, the 75 years and over age range has the highest percentage of unemployed individuals, with 100.0% or 24 of them being unemployed.
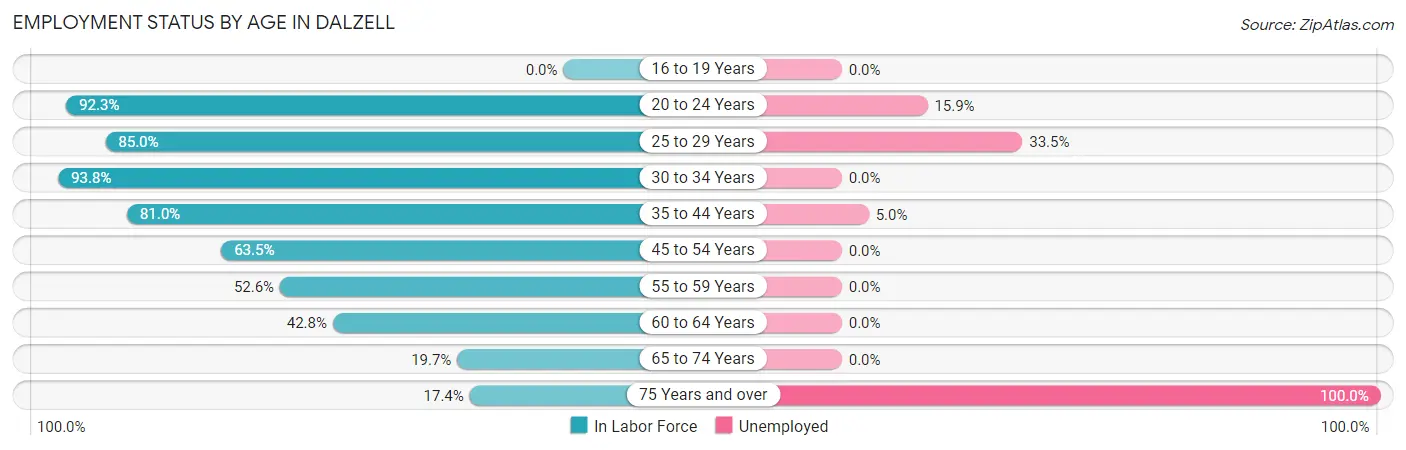
| Age Bracket | In Labor Force | Unemployed |
| 16 to 19 Years | 0 (0.0%) | 0 (0.0%) |
| 20 to 24 Years | 298 (92.3%) | 47 (15.9%) |
| 25 to 29 Years | 311 (85.0%) | 104 (33.5%) |
| 30 to 34 Years | 317 (93.8%) | 0 (0.0%) |
| 35 to 44 Years | 340 (81.0%) | 17 (5.0%) |
| 45 to 54 Years | 169 (63.5%) | 0 (0.0%) |
| 55 to 59 Years | 92 (52.6%) | 0 (0.0%) |
| 60 to 64 Years | 104 (42.8%) | 0 (0.0%) |
| 65 to 74 Years | 37 (19.7%) | 0 (0.0%) |
| 75 Years and over | 24 (17.4%) | 24 (100.0%) |
| Total | 1,691 (68.6%) | 157 (9.3%) |
Employment Status by Educational Attainment in Dalzell
According to labor force statistics for Dalzell, 73.7% of individuals (1,332) out of the total population between 25 and 64 years of age (1,808) are in the labor force, with 6.3% or 84 of them being unemployed. The group with the highest labor force participation rate are those with the educational attainment of college / associate degree, with 84.0% or 842 individuals in the labor force. Within the labor force, individuals with college / associate degree education have the highest percentage of unemployment, with 10.5% or 88 of them being unemployed.
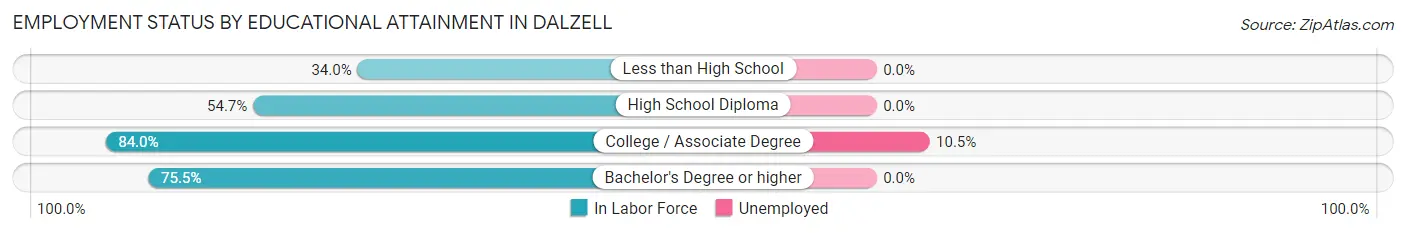
| Educational Attainment | In Labor Force | Unemployed |
| Less than High School | 17 (34.0%) | 0 (0.0%) |
| High School Diploma | 255 (54.7%) | 0 (0.0%) |
| College / Associate Degree | 842 (84.0%) | 105 (10.5%) |
| Bachelor's Degree or higher | 219 (75.5%) | 0 (0.0%) |
| Total | 1,332 (73.7%) | 114 (6.3%) |
Employment Occupations by Sex in Dalzell
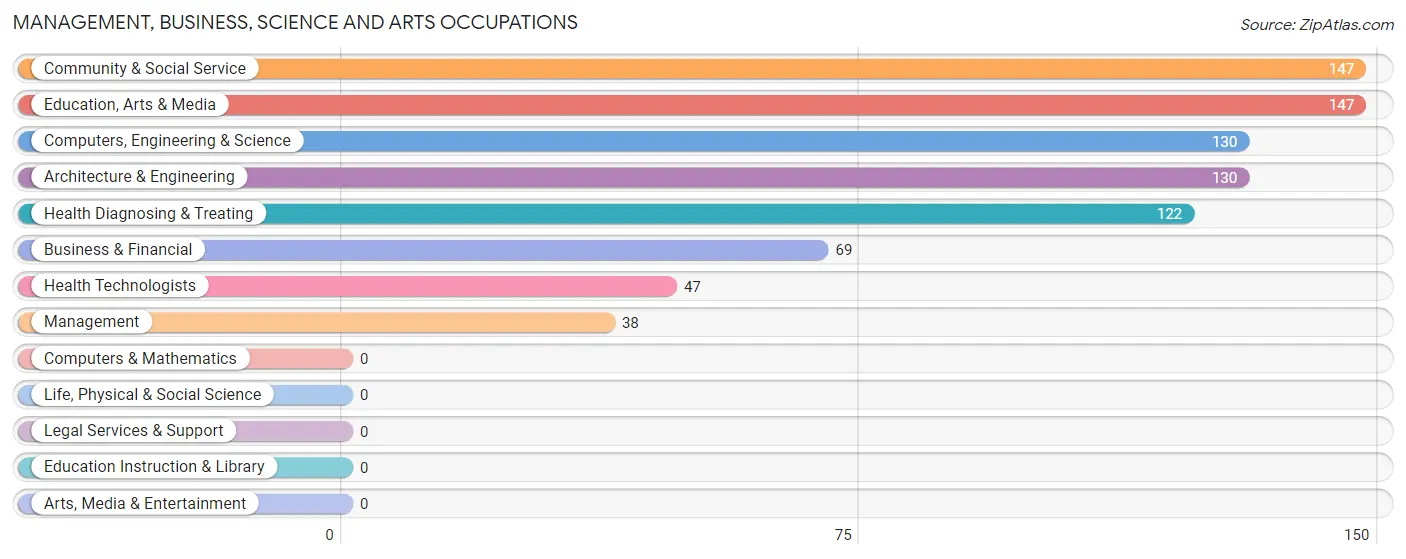
Management, Business, Science and Arts Occupations
The most common Management, Business, Science and Arts occupations in Dalzell are Community & Social Service (147 | 10.8%), Education, Arts & Media (147 | 10.8%), Computers, Engineering & Science (130 | 9.6%), Architecture & Engineering (130 | 9.6%), and Health Diagnosing & Treating (122 | 9.0%).
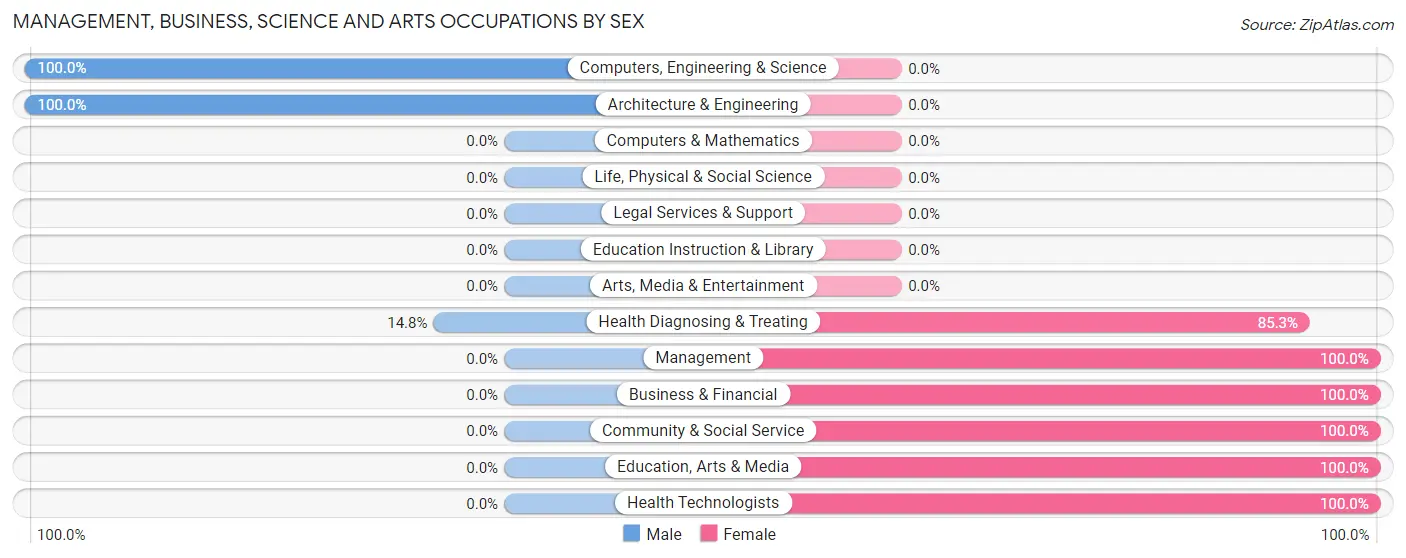
Management, Business, Science and Arts Occupations by Sex
Within the Management, Business, Science and Arts occupations in Dalzell, the most male-oriented occupations are Computers, Engineering & Science (100.0%), Architecture & Engineering (100.0%), and Health Diagnosing & Treating (14.7%), while the most female-oriented occupations are Management (100.0%), Business & Financial (100.0%), and Community & Social Service (100.0%).
| Occupation | Male | Female |
| Management | 0 (0.0%) | 38 (100.0%) |
| Business & Financial | 0 (0.0%) | 69 (100.0%) |
| Computers, Engineering & Science | 130 (100.0%) | 0 (0.0%) |
| Computers & Mathematics | 0 (0.0%) | 0 (0.0%) |
| Architecture & Engineering | 130 (100.0%) | 0 (0.0%) |
| Life, Physical & Social Science | 0 (0.0%) | 0 (0.0%) |
| Community & Social Service | 0 (0.0%) | 147 (100.0%) |
| Education, Arts & Media | 0 (0.0%) | 147 (100.0%) |
| Legal Services & Support | 0 (0.0%) | 0 (0.0%) |
| Education Instruction & Library | 0 (0.0%) | 0 (0.0%) |
| Arts, Media & Entertainment | 0 (0.0%) | 0 (0.0%) |
| Health Diagnosing & Treating | 18 (14.7%) | 104 (85.3%) |
| Health Technologists | 0 (0.0%) | 47 (100.0%) |
| Total (Category) | 148 (29.2%) | 358 (70.8%) |
| Total (Overall) | 658 (48.5%) | 699 (51.5%) |
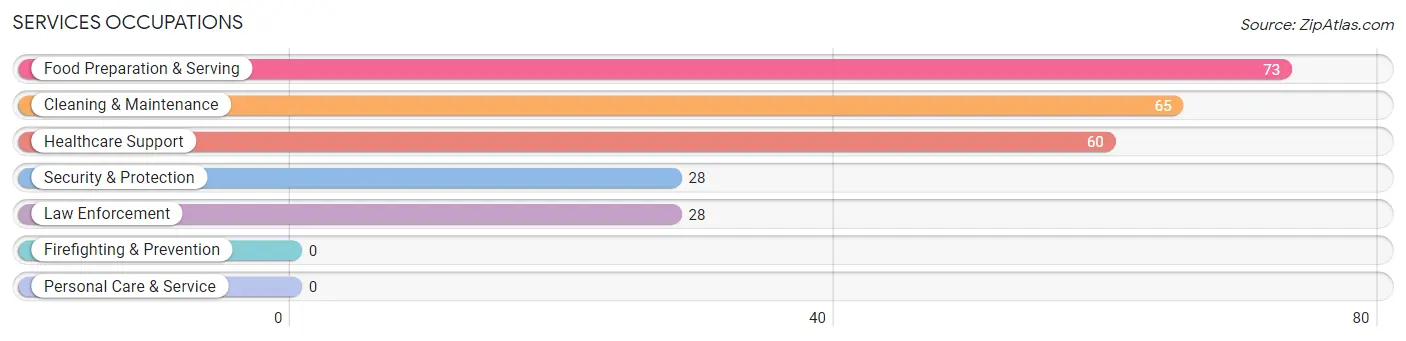
Services Occupations
The most common Services occupations in Dalzell are Food Preparation & Serving (73 | 5.4%), Cleaning & Maintenance (65 | 4.8%), Healthcare Support (60 | 4.4%), Security & Protection (28 | 2.1%), and Law Enforcement (28 | 2.1%).
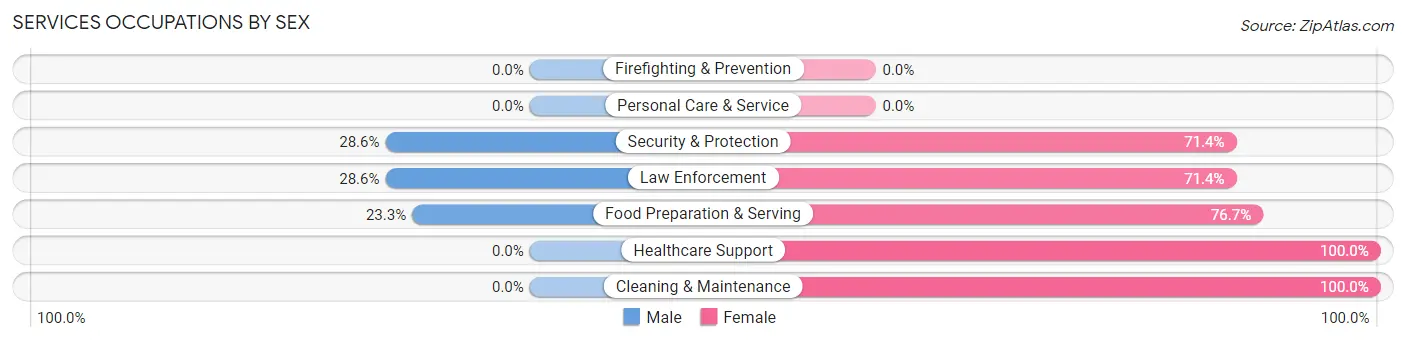
Services Occupations by Sex
Within the Services occupations in Dalzell, the most male-oriented occupations are Security & Protection (28.6%), Law Enforcement (28.6%), and Food Preparation & Serving (23.3%), while the most female-oriented occupations are Healthcare Support (100.0%), Cleaning & Maintenance (100.0%), and Food Preparation & Serving (76.7%).
| Occupation | Male | Female |
| Healthcare Support | 0 (0.0%) | 60 (100.0%) |
| Security & Protection | 8 (28.6%) | 20 (71.4%) |
| Firefighting & Prevention | 0 (0.0%) | 0 (0.0%) |
| Law Enforcement | 8 (28.6%) | 20 (71.4%) |
| Food Preparation & Serving | 17 (23.3%) | 56 (76.7%) |
| Cleaning & Maintenance | 0 (0.0%) | 65 (100.0%) |
| Personal Care & Service | 0 (0.0%) | 0 (0.0%) |
| Total (Category) | 25 (11.1%) | 201 (88.9%) |
| Total (Overall) | 658 (48.5%) | 699 (51.5%) |
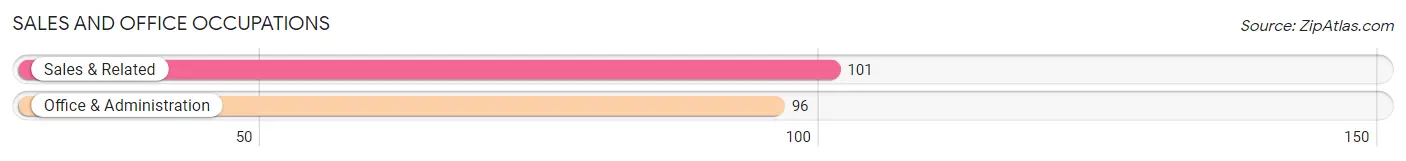
Sales and Office Occupations
The most common Sales and Office occupations in Dalzell are Sales & Related (101 | 7.4%), and Office & Administration (96 | 7.1%).
Sales and Office Occupations by Sex
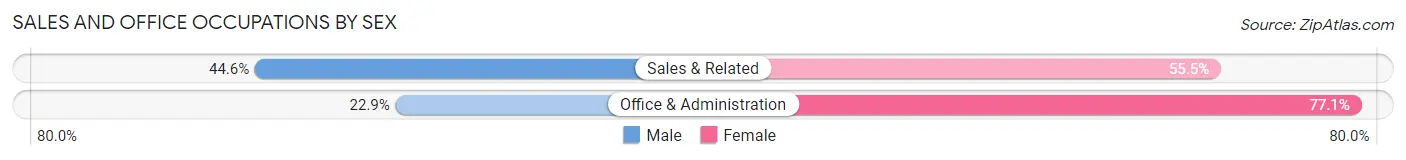
| Occupation | Male | Female |
| Sales & Related | 45 (44.6%) | 56 (55.4%) |
| Office & Administration | 22 (22.9%) | 74 (77.1%) |
| Total (Category) | 67 (34.0%) | 130 (66.0%) |
| Total (Overall) | 658 (48.5%) | 699 (51.5%) |
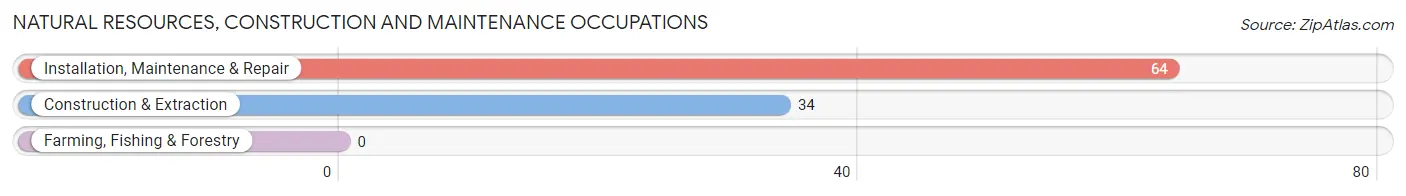
Natural Resources, Construction and Maintenance Occupations
The most common Natural Resources, Construction and Maintenance occupations in Dalzell are Installation, Maintenance & Repair (64 | 4.7%), and Construction & Extraction (34 | 2.5%).
Natural Resources, Construction and Maintenance Occupations by Sex
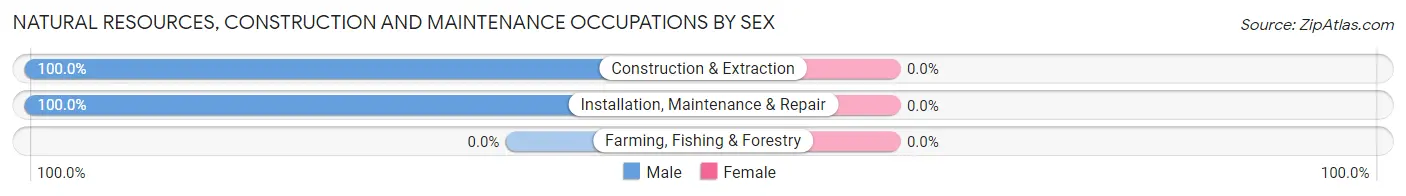
| Occupation | Male | Female |
| Farming, Fishing & Forestry | 0 (0.0%) | 0 (0.0%) |
| Construction & Extraction | 34 (100.0%) | 0 (0.0%) |
| Installation, Maintenance & Repair | 64 (100.0%) | 0 (0.0%) |
| Total (Category) | 98 (100.0%) | 0 (0.0%) |
| Total (Overall) | 658 (48.5%) | 699 (51.5%) |
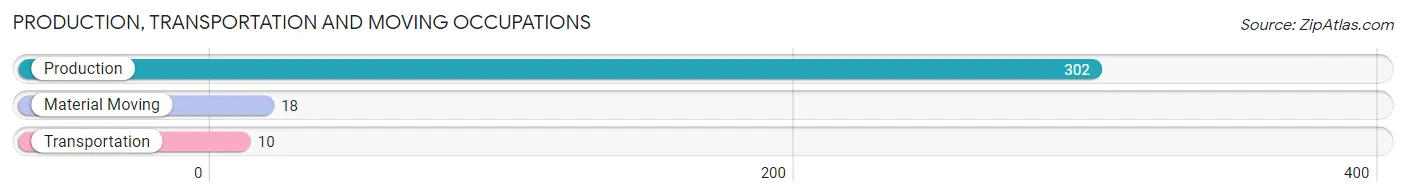
Production, Transportation and Moving Occupations
The most common Production, Transportation and Moving occupations in Dalzell are Production (302 | 22.3%), Material Moving (18 | 1.3%), and Transportation (10 | 0.7%).
Production, Transportation and Moving Occupations by Sex
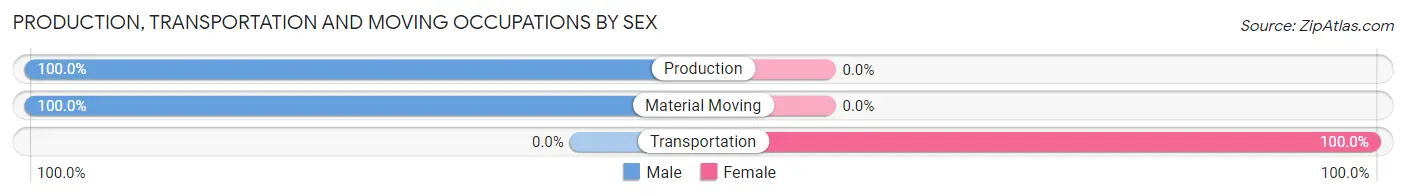
| Occupation | Male | Female |
| Production | 302 (100.0%) | 0 (0.0%) |
| Transportation | 0 (0.0%) | 10 (100.0%) |
| Material Moving | 18 (100.0%) | 0 (0.0%) |
| Total (Category) | 320 (97.0%) | 10 (3.0%) |
| Total (Overall) | 658 (48.5%) | 699 (51.5%) |
Employment Industries by Sex in Dalzell
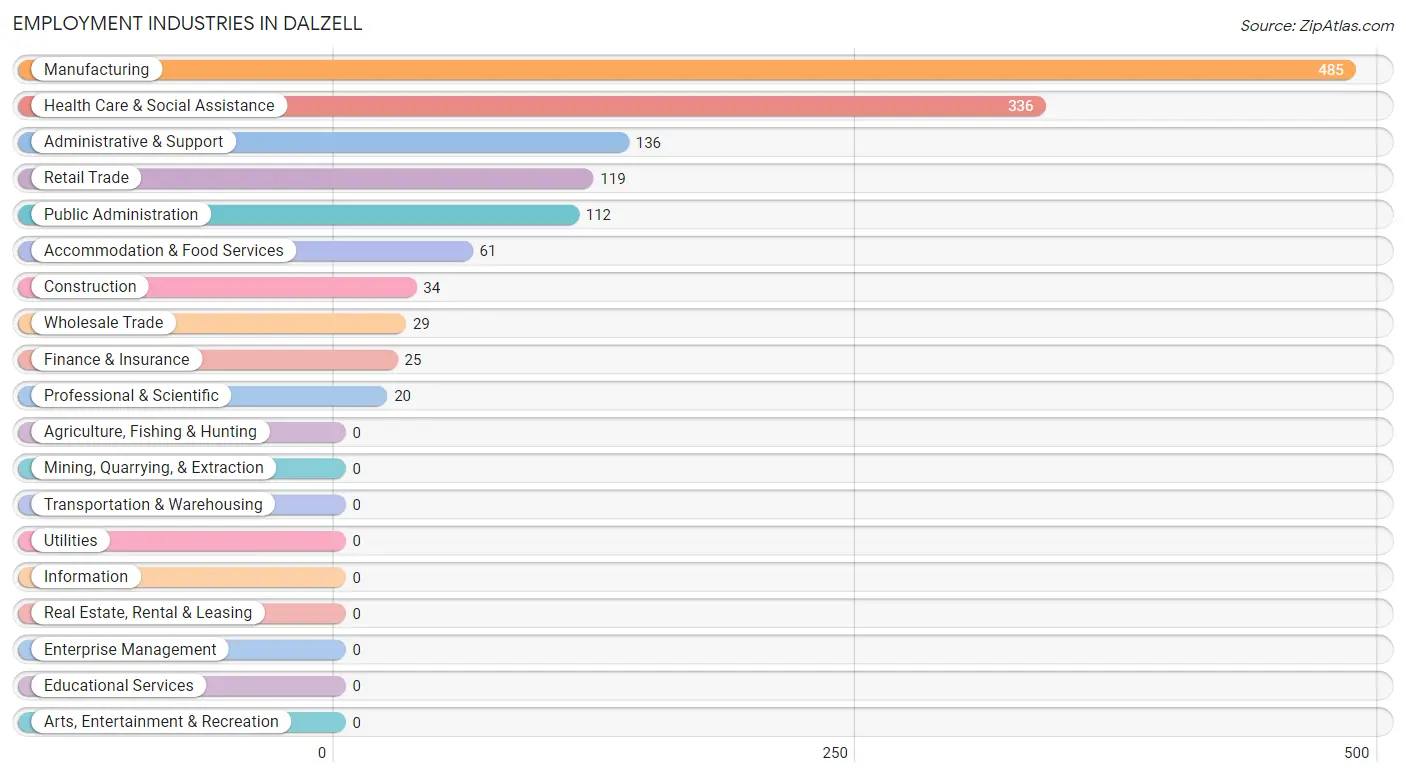
Employment Industries in Dalzell
The major employment industries in Dalzell include Manufacturing (485 | 35.7%), Health Care & Social Assistance (336 | 24.8%), Administrative & Support (136 | 10.0%), Retail Trade (119 | 8.8%), and Public Administration (112 | 8.3%).
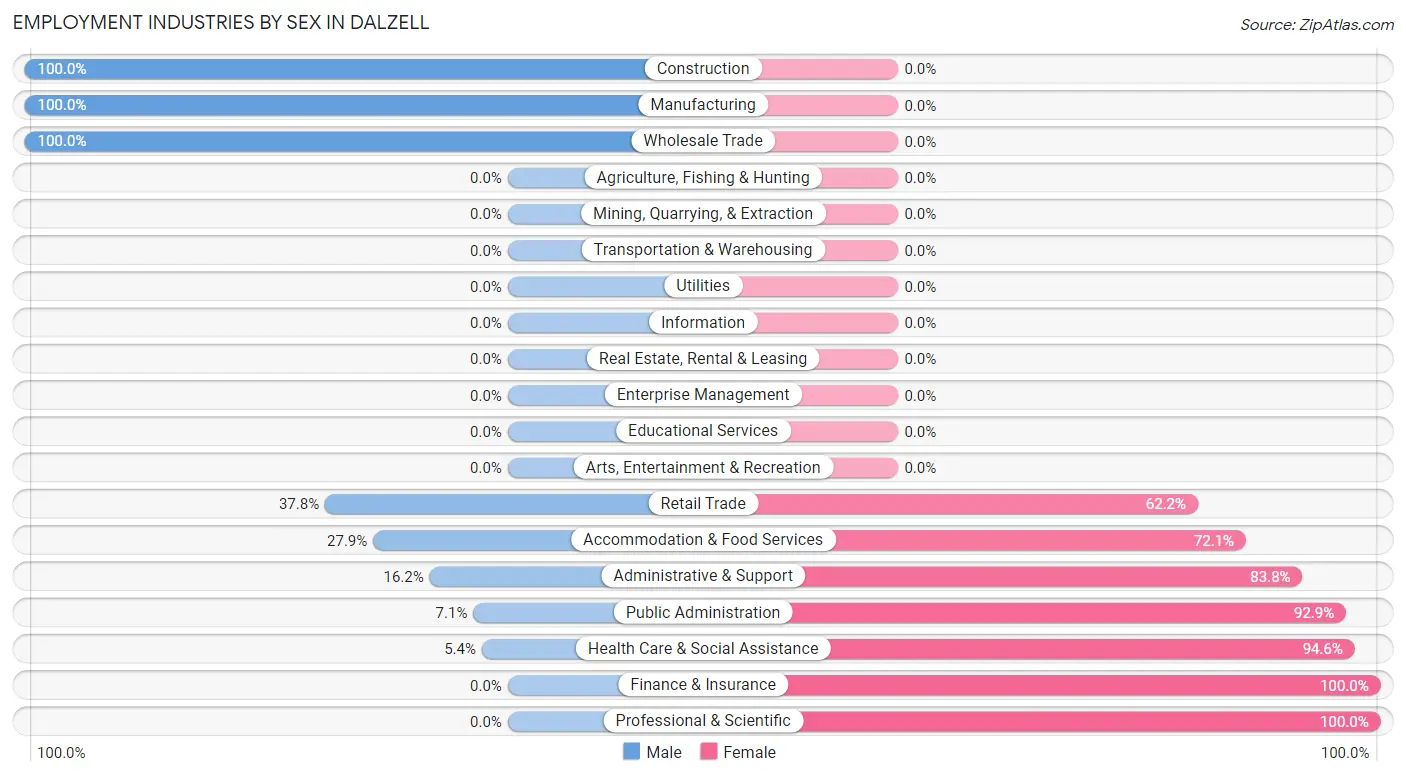
Employment Industries by Sex in Dalzell
The Dalzell industries that see more men than women are Construction (100.0%), Manufacturing (100.0%), and Wholesale Trade (100.0%), whereas the industries that tend to have a higher number of women are Finance & Insurance (100.0%), Professional & Scientific (100.0%), and Health Care & Social Assistance (94.6%).
| Industry | Male | Female |
| Agriculture, Fishing & Hunting | 0 (0.0%) | 0 (0.0%) |
| Mining, Quarrying, & Extraction | 0 (0.0%) | 0 (0.0%) |
| Construction | 34 (100.0%) | 0 (0.0%) |
| Manufacturing | 485 (100.0%) | 0 (0.0%) |
| Wholesale Trade | 29 (100.0%) | 0 (0.0%) |
| Retail Trade | 45 (37.8%) | 74 (62.2%) |
| Transportation & Warehousing | 0 (0.0%) | 0 (0.0%) |
| Utilities | 0 (0.0%) | 0 (0.0%) |
| Information | 0 (0.0%) | 0 (0.0%) |
| Finance & Insurance | 0 (0.0%) | 25 (100.0%) |
| Real Estate, Rental & Leasing | 0 (0.0%) | 0 (0.0%) |
| Professional & Scientific | 0 (0.0%) | 20 (100.0%) |
| Enterprise Management | 0 (0.0%) | 0 (0.0%) |
| Administrative & Support | 22 (16.2%) | 114 (83.8%) |
| Educational Services | 0 (0.0%) | 0 (0.0%) |
| Health Care & Social Assistance | 18 (5.4%) | 318 (94.6%) |
| Arts, Entertainment & Recreation | 0 (0.0%) | 0 (0.0%) |
| Accommodation & Food Services | 17 (27.9%) | 44 (72.1%) |
| Public Administration | 8 (7.1%) | 104 (92.9%) |
| Total | 658 (48.5%) | 699 (51.5%) |
Education in Dalzell
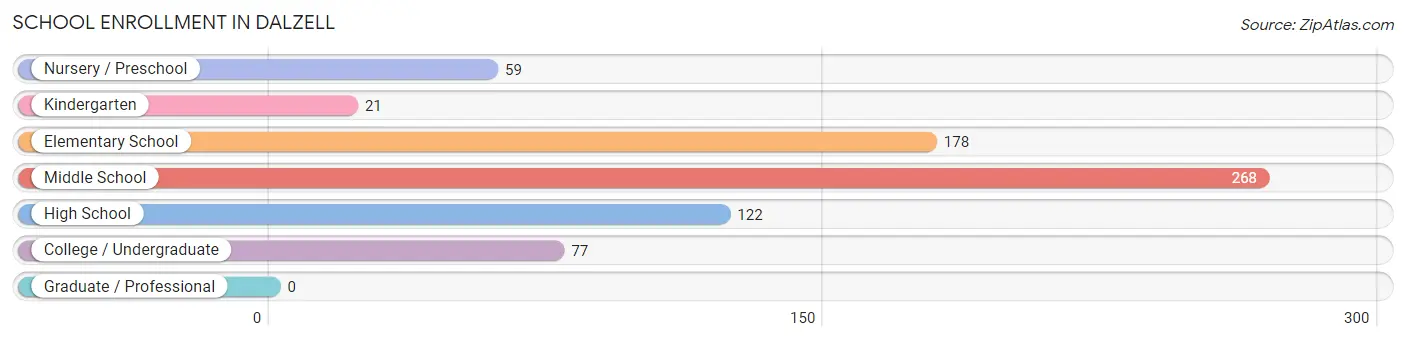
School Enrollment in Dalzell
The most common levels of schooling among the 725 students in Dalzell are middle school (268 | 37.0%), elementary school (178 | 24.5%), and high school (122 | 16.8%).
| School Level | # Students | % Students |
| Nursery / Preschool | 59 | 8.1% |
| Kindergarten | 21 | 2.9% |
| Elementary School | 178 | 24.5% |
| Middle School | 268 | 37.0% |
| High School | 122 | 16.8% |
| College / Undergraduate | 77 | 10.6% |
| Graduate / Professional | 0 | 0.0% |
| Total | 725 | 100.0% |
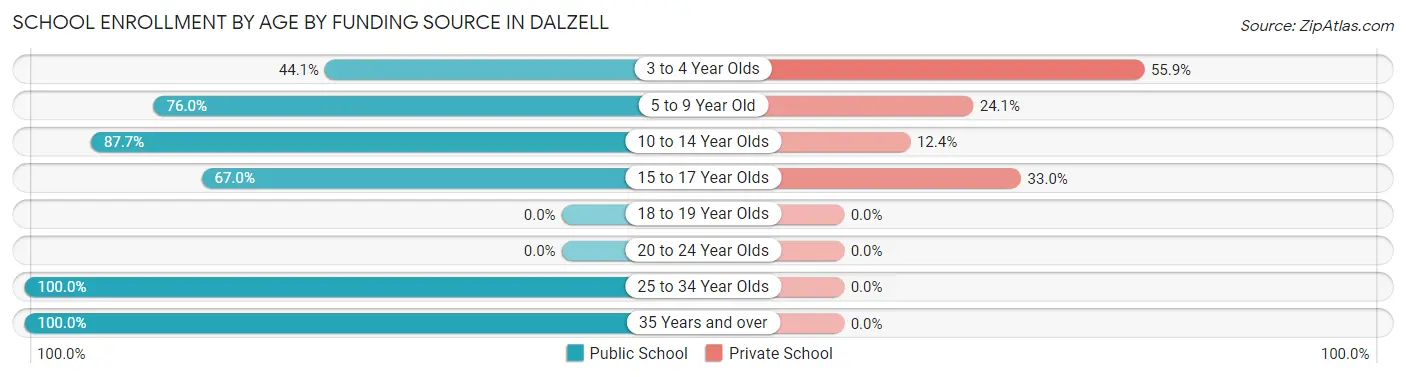
School Enrollment by Age by Funding Source in Dalzell
Out of a total of 725 students who are enrolled in schools in Dalzell, 143 (19.7%) attend a private institution, while the remaining 582 (80.3%) are enrolled in public schools. The age group of 3 to 4 year olds has the highest likelihood of being enrolled in private schools, with 33 (55.9% in the age bracket) enrolled. Conversely, the age group of 25 to 34 year olds has the lowest likelihood of being enrolled in a private school, with 50 (100.0% in the age bracket) attending a public institution.
| Age Bracket | Public School | Private School |
| 3 to 4 Year Olds | 26 (44.1%) | 33 (55.9%) |
| 5 to 9 Year Old | 120 (75.9%) | 38 (24.0%) |
| 10 to 14 Year Olds | 298 (87.6%) | 42 (12.3%) |
| 15 to 17 Year Olds | 61 (67.0%) | 30 (33.0%) |
| 18 to 19 Year Olds | 0 (0.0%) | 0 (0.0%) |
| 20 to 24 Year Olds | 0 (0.0%) | 0 (0.0%) |
| 25 to 34 Year Olds | 50 (100.0%) | 0 (0.0%) |
| 35 Years and over | 27 (100.0%) | 0 (0.0%) |
| Total | 582 (80.3%) | 143 (19.7%) |
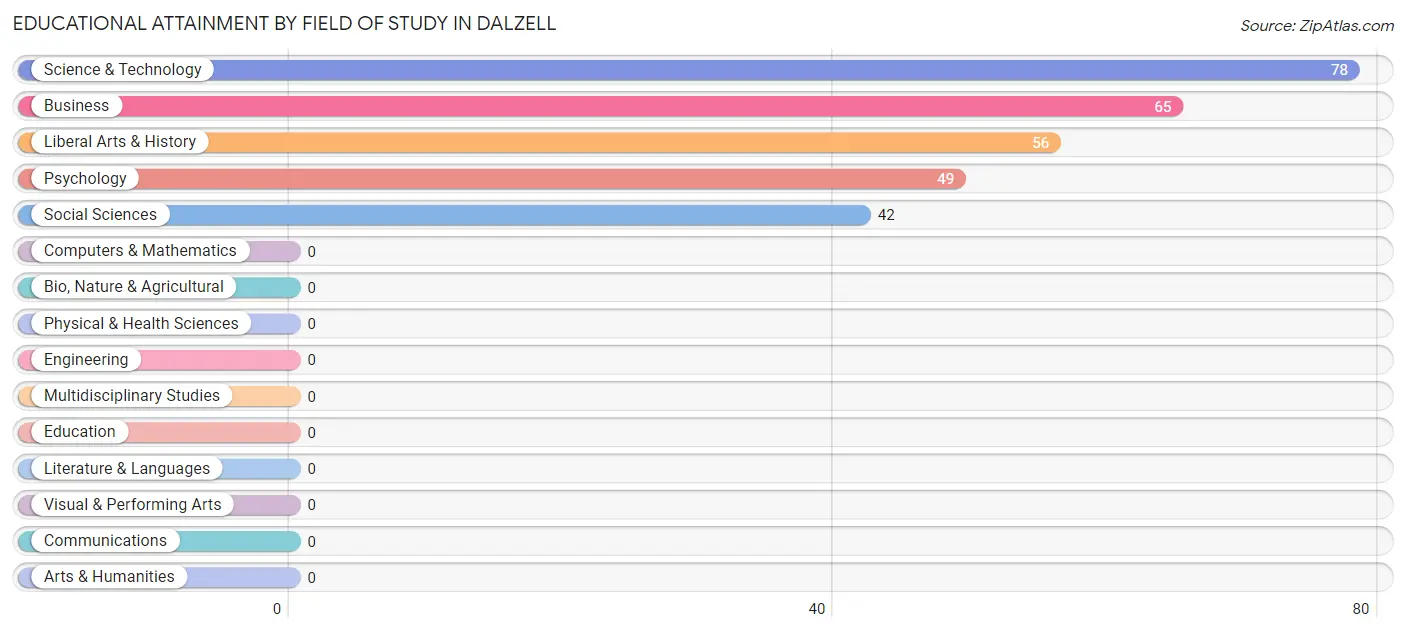
Educational Attainment by Field of Study in Dalzell
Science & technology (78 | 26.9%), business (65 | 22.4%), liberal arts & history (56 | 19.3%), psychology (49 | 16.9%), and social sciences (42 | 14.5%) are the most common fields of study among 290 individuals in Dalzell who have obtained a bachelor's degree or higher.
| Field of Study | # Graduates | % Graduates |
| Computers & Mathematics | 0 | 0.0% |
| Bio, Nature & Agricultural | 0 | 0.0% |
| Physical & Health Sciences | 0 | 0.0% |
| Psychology | 49 | 16.9% |
| Social Sciences | 42 | 14.5% |
| Engineering | 0 | 0.0% |
| Multidisciplinary Studies | 0 | 0.0% |
| Science & Technology | 78 | 26.9% |
| Business | 65 | 22.4% |
| Education | 0 | 0.0% |
| Literature & Languages | 0 | 0.0% |
| Liberal Arts & History | 56 | 19.3% |
| Visual & Performing Arts | 0 | 0.0% |
| Communications | 0 | 0.0% |
| Arts & Humanities | 0 | 0.0% |
| Total | 290 | 100.0% |
Transportation & Commute in Dalzell
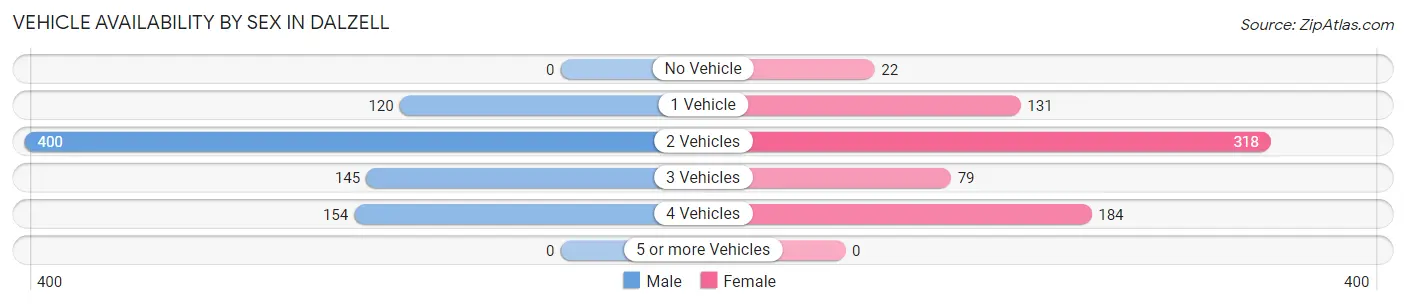
Vehicle Availability by Sex in Dalzell
The most prevalent vehicle ownership categories in Dalzell are males with 2 vehicles (400, accounting for 48.8%) and females with 2 vehicles (318, making up 54.5%).
| Vehicles Available | Male | Female |
| No Vehicle | 0 (0.0%) | 22 (3.0%) |
| 1 Vehicle | 120 (14.6%) | 131 (17.8%) |
| 2 Vehicles | 400 (48.8%) | 318 (43.3%) |
| 3 Vehicles | 145 (17.7%) | 79 (10.8%) |
| 4 Vehicles | 154 (18.8%) | 184 (25.1%) |
| 5 or more Vehicles | 0 (0.0%) | 0 (0.0%) |
| Total | 819 (100.0%) | 734 (100.0%) |
Commute Time in Dalzell
The most frequently occuring commute durations in Dalzell are 20 to 24 minutes (370 commuters, 24.1%), 15 to 19 minutes (358 commuters, 23.3%), and 30 to 34 minutes (318 commuters, 20.7%).
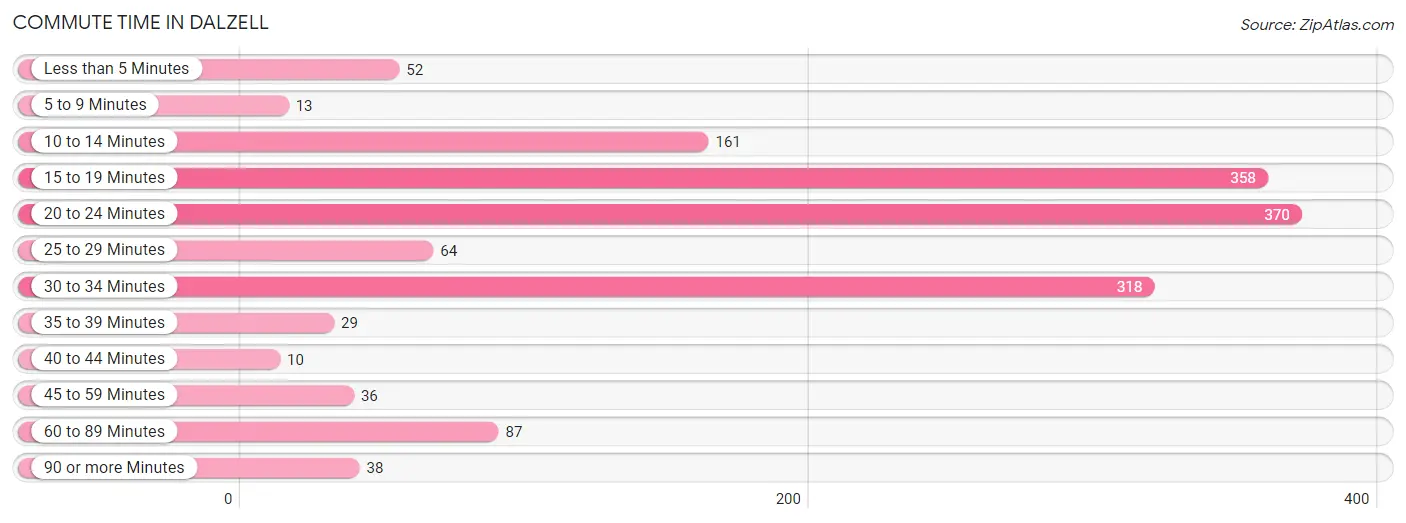
| Commute Time | # Commuters | % Commuters |
| Less than 5 Minutes | 52 | 3.4% |
| 5 to 9 Minutes | 13 | 0.9% |
| 10 to 14 Minutes | 161 | 10.5% |
| 15 to 19 Minutes | 358 | 23.3% |
| 20 to 24 Minutes | 370 | 24.1% |
| 25 to 29 Minutes | 64 | 4.2% |
| 30 to 34 Minutes | 318 | 20.7% |
| 35 to 39 Minutes | 29 | 1.9% |
| 40 to 44 Minutes | 10 | 0.6% |
| 45 to 59 Minutes | 36 | 2.3% |
| 60 to 89 Minutes | 87 | 5.7% |
| 90 or more Minutes | 38 | 2.5% |
Commute Time by Sex in Dalzell
The most common commute times in Dalzell are 15 to 19 minutes (242 commuters, 29.5%) for males and 30 to 34 minutes (202 commuters, 28.2%) for females.
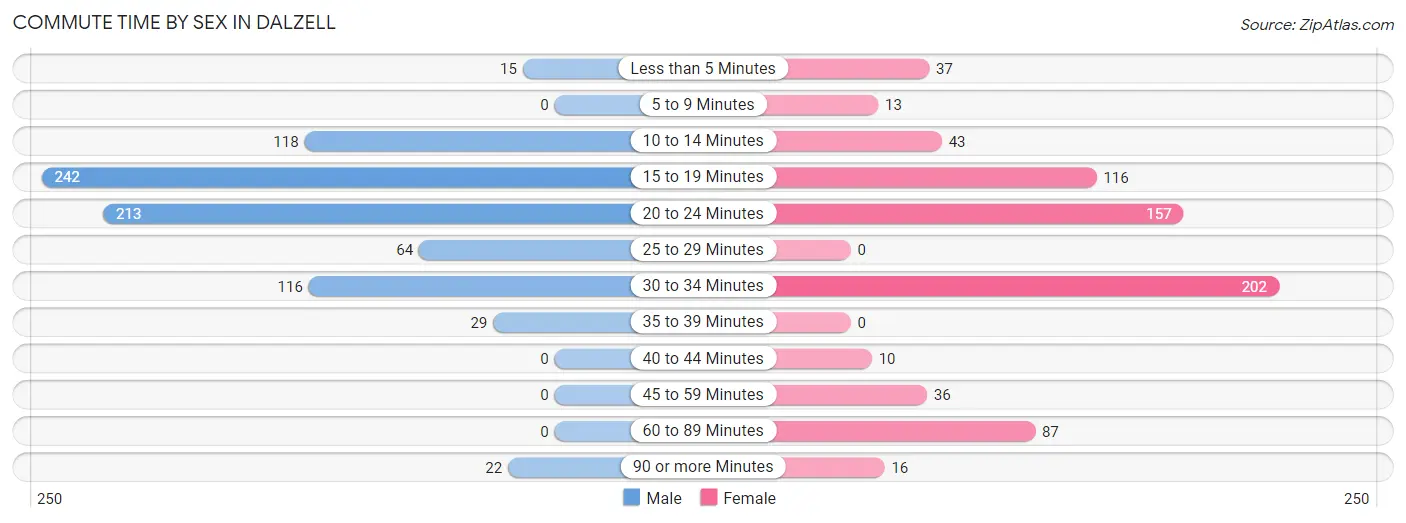
| Commute Time | Male | Female |
| Less than 5 Minutes | 15 (1.8%) | 37 (5.2%) |
| 5 to 9 Minutes | 0 (0.0%) | 13 (1.8%) |
| 10 to 14 Minutes | 118 (14.4%) | 43 (6.0%) |
| 15 to 19 Minutes | 242 (29.5%) | 116 (16.2%) |
| 20 to 24 Minutes | 213 (26.0%) | 157 (21.9%) |
| 25 to 29 Minutes | 64 (7.8%) | 0 (0.0%) |
| 30 to 34 Minutes | 116 (14.2%) | 202 (28.2%) |
| 35 to 39 Minutes | 29 (3.5%) | 0 (0.0%) |
| 40 to 44 Minutes | 0 (0.0%) | 10 (1.4%) |
| 45 to 59 Minutes | 0 (0.0%) | 36 (5.0%) |
| 60 to 89 Minutes | 0 (0.0%) | 87 (12.1%) |
| 90 or more Minutes | 22 (2.7%) | 16 (2.2%) |
Time of Departure to Work by Sex in Dalzell
The most frequent times of departure to work in Dalzell are 6:00 AM to 6:29 AM (188, 23.0%) for males and 7:30 AM to 7:59 AM (121, 16.9%) for females.
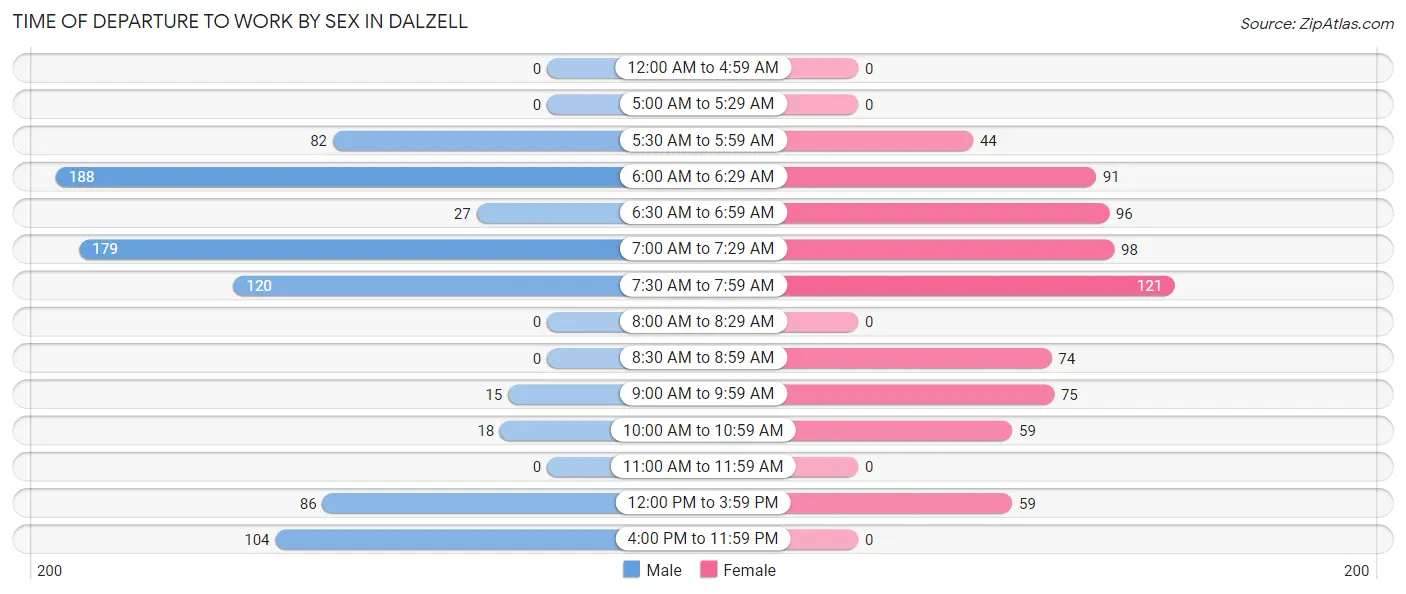
| Time of Departure | Male | Female |
| 12:00 AM to 4:59 AM | 0 (0.0%) | 0 (0.0%) |
| 5:00 AM to 5:29 AM | 0 (0.0%) | 0 (0.0%) |
| 5:30 AM to 5:59 AM | 82 (10.0%) | 44 (6.1%) |
| 6:00 AM to 6:29 AM | 188 (23.0%) | 91 (12.7%) |
| 6:30 AM to 6:59 AM | 27 (3.3%) | 96 (13.4%) |
| 7:00 AM to 7:29 AM | 179 (21.9%) | 98 (13.7%) |
| 7:30 AM to 7:59 AM | 120 (14.6%) | 121 (16.9%) |
| 8:00 AM to 8:29 AM | 0 (0.0%) | 0 (0.0%) |
| 8:30 AM to 8:59 AM | 0 (0.0%) | 74 (10.3%) |
| 9:00 AM to 9:59 AM | 15 (1.8%) | 75 (10.5%) |
| 10:00 AM to 10:59 AM | 18 (2.2%) | 59 (8.2%) |
| 11:00 AM to 11:59 AM | 0 (0.0%) | 0 (0.0%) |
| 12:00 PM to 3:59 PM | 86 (10.5%) | 59 (8.2%) |
| 4:00 PM to 11:59 PM | 104 (12.7%) | 0 (0.0%) |
| Total | 819 (100.0%) | 717 (100.0%) |
Housing Occupancy in Dalzell
Occupancy by Ownership in Dalzell
Of the total 1,254 dwellings in Dalzell, owner-occupied units account for 867 (69.1%), while renter-occupied units make up 387 (30.9%).
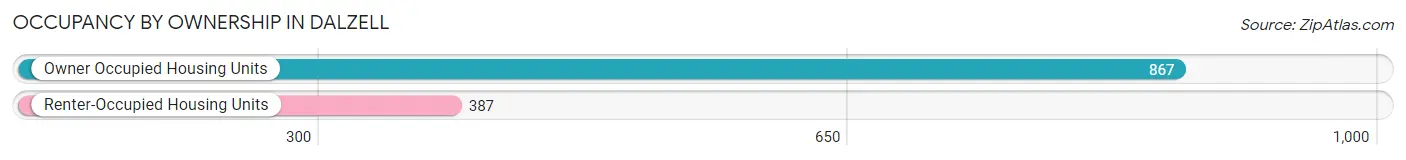
| Occupancy | # Housing Units | % Housing Units |
| Owner Occupied Housing Units | 867 | 69.1% |
| Renter-Occupied Housing Units | 387 | 30.9% |
| Total Occupied Housing Units | 1,254 | 100.0% |
Occupancy by Household Size in Dalzell
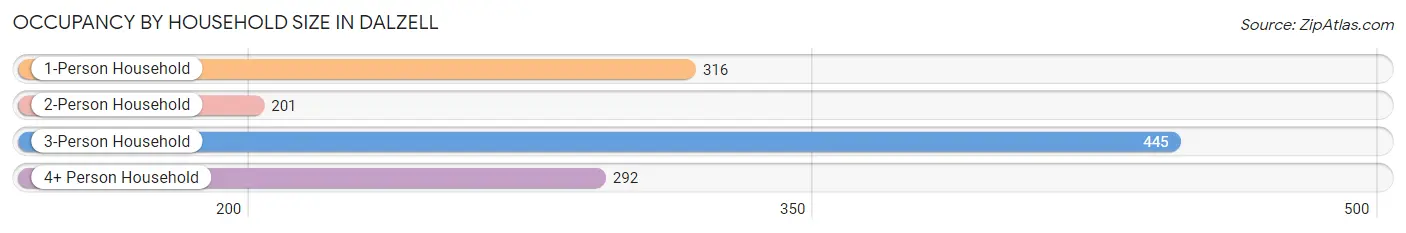
| Household Size | # Housing Units | % Housing Units |
| 1-Person Household | 316 | 25.2% |
| 2-Person Household | 201 | 16.0% |
| 3-Person Household | 445 | 35.5% |
| 4+ Person Household | 292 | 23.3% |
| Total Housing Units | 1,254 | 100.0% |
Occupancy by Ownership by Household Size in Dalzell
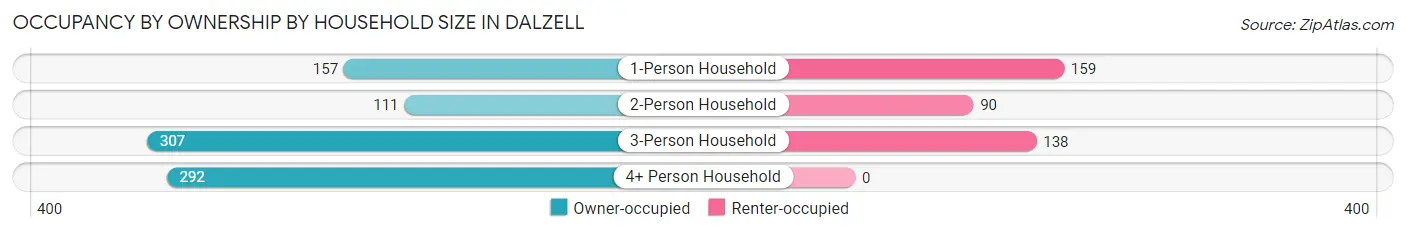
| Household Size | Owner-occupied | Renter-occupied |
| 1-Person Household | 157 (49.7%) | 159 (50.3%) |
| 2-Person Household | 111 (55.2%) | 90 (44.8%) |
| 3-Person Household | 307 (69.0%) | 138 (31.0%) |
| 4+ Person Household | 292 (100.0%) | 0 (0.0%) |
| Total Housing Units | 867 (69.1%) | 387 (30.9%) |
Occupancy by Educational Attainment in Dalzell
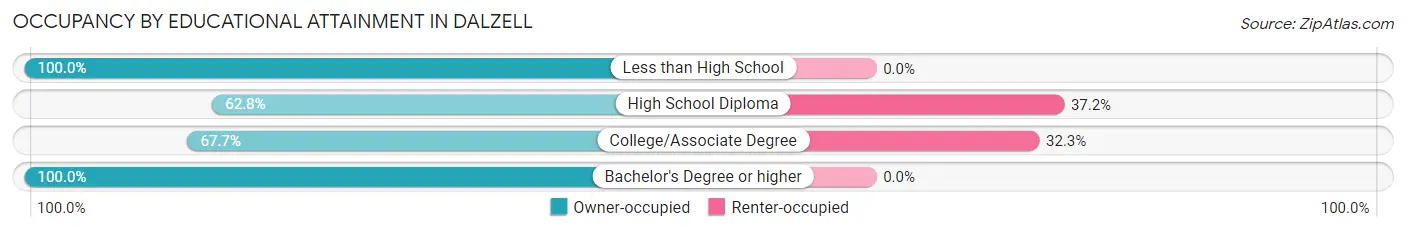
| Household Size | Owner-occupied | Renter-occupied |
| Less than High School | 21 (100.0%) | 0 (0.0%) |
| High School Diploma | 317 (62.8%) | 188 (37.2%) |
| College/Associate Degree | 417 (67.7%) | 199 (32.3%) |
| Bachelor's Degree or higher | 112 (100.0%) | 0 (0.0%) |
Occupancy by Age of Householder in Dalzell
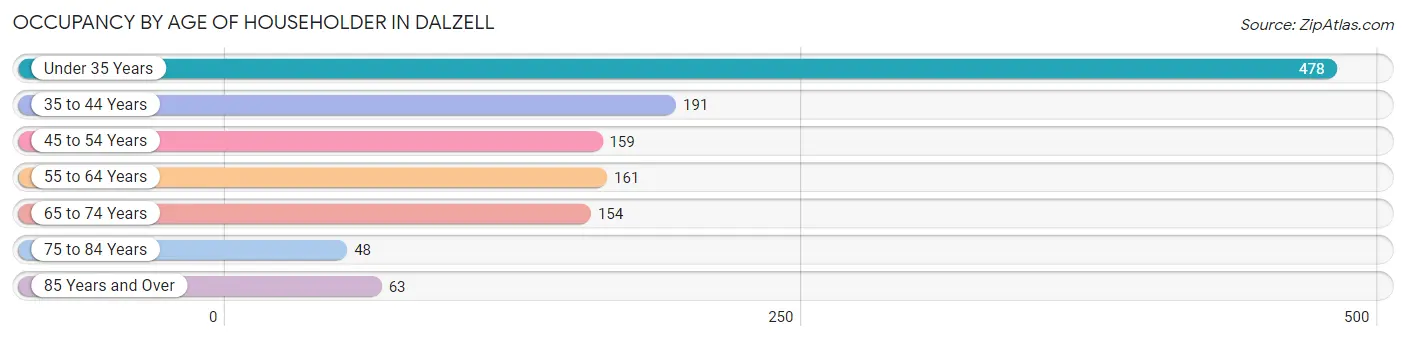
| Age Bracket | # Households | % Households |
| Under 35 Years | 478 | 38.1% |
| 35 to 44 Years | 191 | 15.2% |
| 45 to 54 Years | 159 | 12.7% |
| 55 to 64 Years | 161 | 12.8% |
| 65 to 74 Years | 154 | 12.3% |
| 75 to 84 Years | 48 | 3.8% |
| 85 Years and Over | 63 | 5.0% |
| Total | 1,254 | 100.0% |
Housing Finances in Dalzell
Median Income by Occupancy in Dalzell
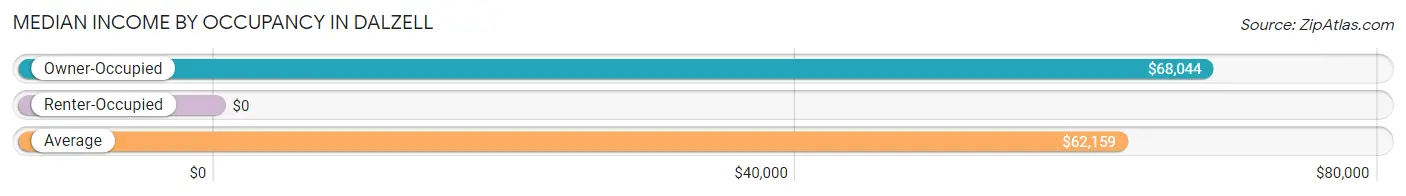
| Occupancy Type | # Households | Median Income |
| Owner-Occupied | 867 (69.1%) | $68,044 |
| Renter-Occupied | 387 (30.9%) | $0 |
| Average | 1,254 (100.0%) | $62,159 |
Occupancy by Householder Income Bracket in Dalzell
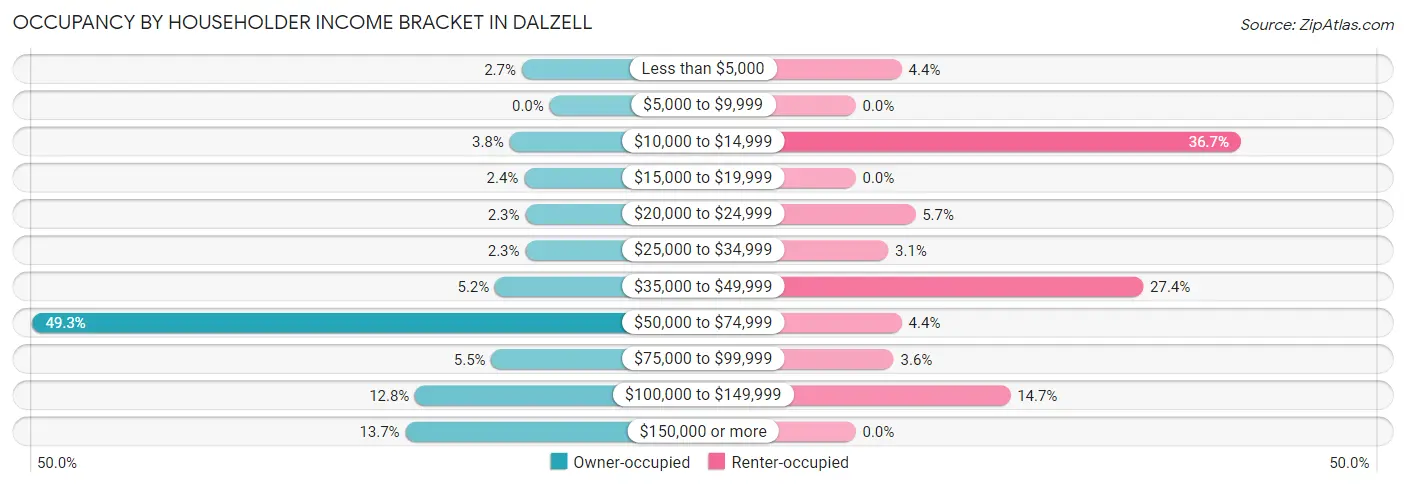
| Income Bracket | Owner-occupied | Renter-occupied |
| Less than $5,000 | 23 (2.6%) | 17 (4.4%) |
| $5,000 to $9,999 | 0 (0.0%) | 0 (0.0%) |
| $10,000 to $14,999 | 33 (3.8%) | 142 (36.7%) |
| $15,000 to $19,999 | 21 (2.4%) | 0 (0.0%) |
| $20,000 to $24,999 | 20 (2.3%) | 22 (5.7%) |
| $25,000 to $34,999 | 20 (2.3%) | 12 (3.1%) |
| $35,000 to $49,999 | 45 (5.2%) | 106 (27.4%) |
| $50,000 to $74,999 | 427 (49.2%) | 17 (4.4%) |
| $75,000 to $99,999 | 48 (5.5%) | 14 (3.6%) |
| $100,000 to $149,999 | 111 (12.8%) | 57 (14.7%) |
| $150,000 or more | 119 (13.7%) | 0 (0.0%) |
| Total | 867 (100.0%) | 387 (100.0%) |
Monthly Housing Cost Tiers in Dalzell
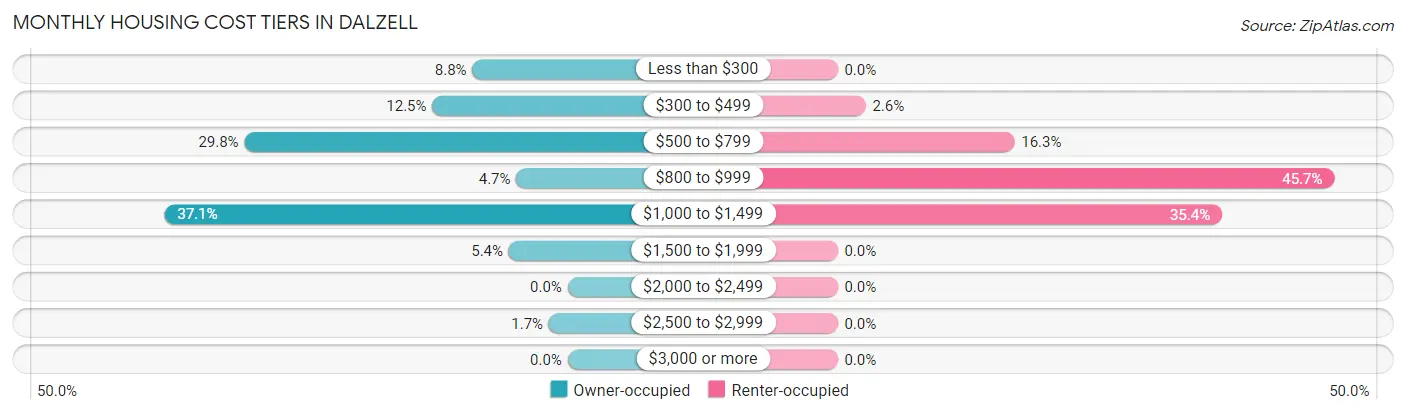
| Monthly Cost | Owner-occupied | Renter-occupied |
| Less than $300 | 76 (8.8%) | 0 (0.0%) |
| $300 to $499 | 108 (12.5%) | 10 (2.6%) |
| $500 to $799 | 258 (29.8%) | 63 (16.3%) |
| $800 to $999 | 41 (4.7%) | 177 (45.7%) |
| $1,000 to $1,499 | 322 (37.1%) | 137 (35.4%) |
| $1,500 to $1,999 | 47 (5.4%) | 0 (0.0%) |
| $2,000 to $2,499 | 0 (0.0%) | 0 (0.0%) |
| $2,500 to $2,999 | 15 (1.7%) | 0 (0.0%) |
| $3,000 or more | 0 (0.0%) | 0 (0.0%) |
| Total | 867 (100.0%) | 387 (100.0%) |
Physical Housing Characteristics in Dalzell
Housing Structures in Dalzell
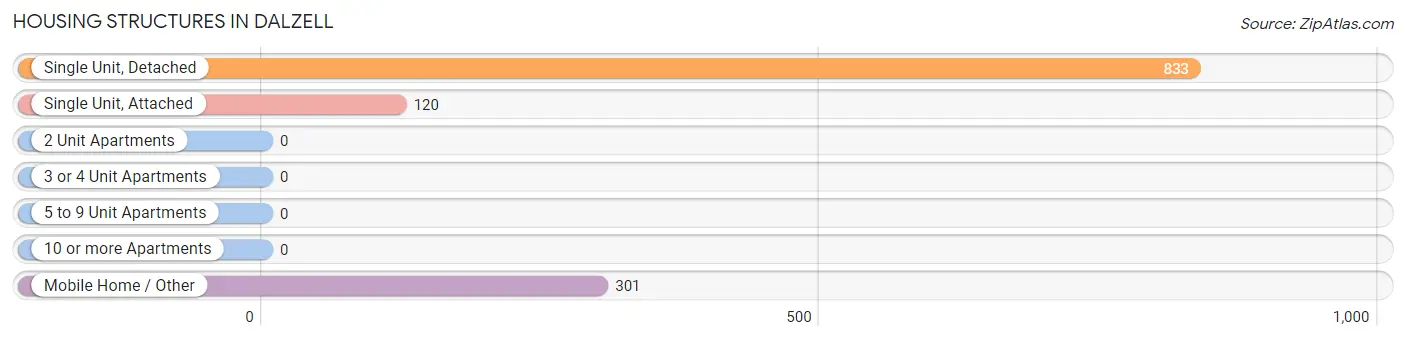
| Structure Type | # Housing Units | % Housing Units |
| Single Unit, Detached | 833 | 66.4% |
| Single Unit, Attached | 120 | 9.6% |
| 2 Unit Apartments | 0 | 0.0% |
| 3 or 4 Unit Apartments | 0 | 0.0% |
| 5 to 9 Unit Apartments | 0 | 0.0% |
| 10 or more Apartments | 0 | 0.0% |
| Mobile Home / Other | 301 | 24.0% |
| Total | 1,254 | 100.0% |
Housing Structures by Occupancy in Dalzell
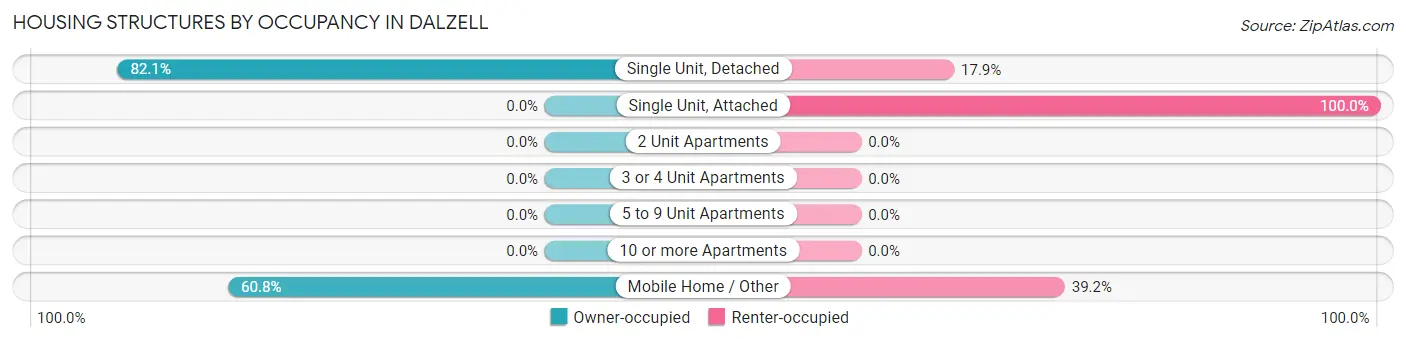
| Structure Type | Owner-occupied | Renter-occupied |
| Single Unit, Detached | 684 (82.1%) | 149 (17.9%) |
| Single Unit, Attached | 0 (0.0%) | 120 (100.0%) |
| 2 Unit Apartments | 0 (0.0%) | 0 (0.0%) |
| 3 or 4 Unit Apartments | 0 (0.0%) | 0 (0.0%) |
| 5 to 9 Unit Apartments | 0 (0.0%) | 0 (0.0%) |
| 10 or more Apartments | 0 (0.0%) | 0 (0.0%) |
| Mobile Home / Other | 183 (60.8%) | 118 (39.2%) |
| Total | 867 (69.1%) | 387 (30.9%) |
Housing Structures by Number of Rooms in Dalzell
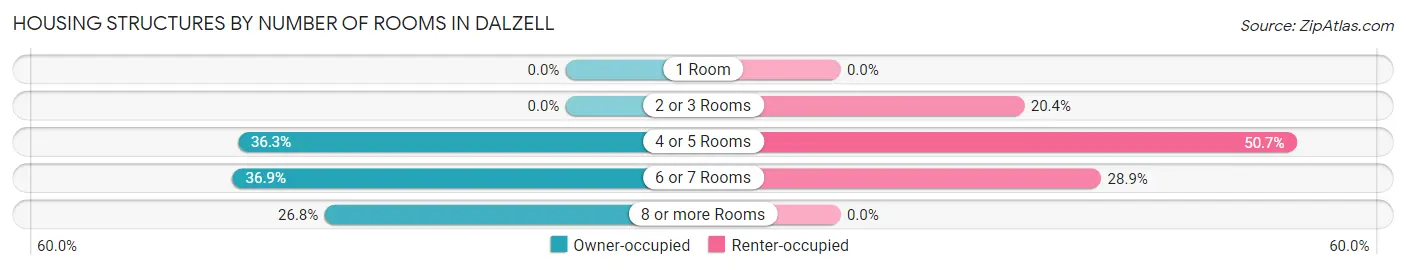
| Number of Rooms | Owner-occupied | Renter-occupied |
| 1 Room | 0 (0.0%) | 0 (0.0%) |
| 2 or 3 Rooms | 0 (0.0%) | 79 (20.4%) |
| 4 or 5 Rooms | 315 (36.3%) | 196 (50.6%) |
| 6 or 7 Rooms | 320 (36.9%) | 112 (28.9%) |
| 8 or more Rooms | 232 (26.8%) | 0 (0.0%) |
| Total | 867 (100.0%) | 387 (100.0%) |
Housing Structure by Heating Type in Dalzell
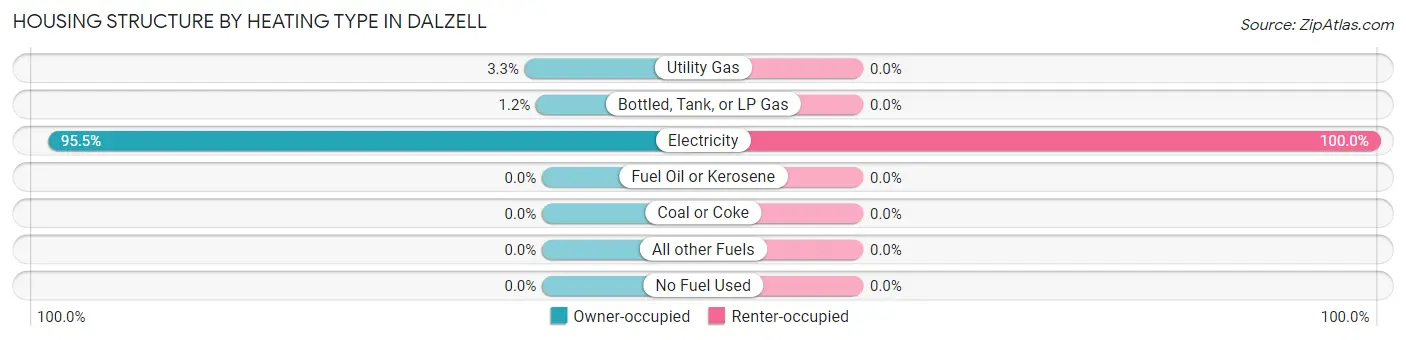
| Heating Type | Owner-occupied | Renter-occupied |
| Utility Gas | 29 (3.3%) | 0 (0.0%) |
| Bottled, Tank, or LP Gas | 10 (1.1%) | 0 (0.0%) |
| Electricity | 828 (95.5%) | 387 (100.0%) |
| Fuel Oil or Kerosene | 0 (0.0%) | 0 (0.0%) |
| Coal or Coke | 0 (0.0%) | 0 (0.0%) |
| All other Fuels | 0 (0.0%) | 0 (0.0%) |
| No Fuel Used | 0 (0.0%) | 0 (0.0%) |
| Total | 867 (100.0%) | 387 (100.0%) |
Household Vehicle Usage in Dalzell
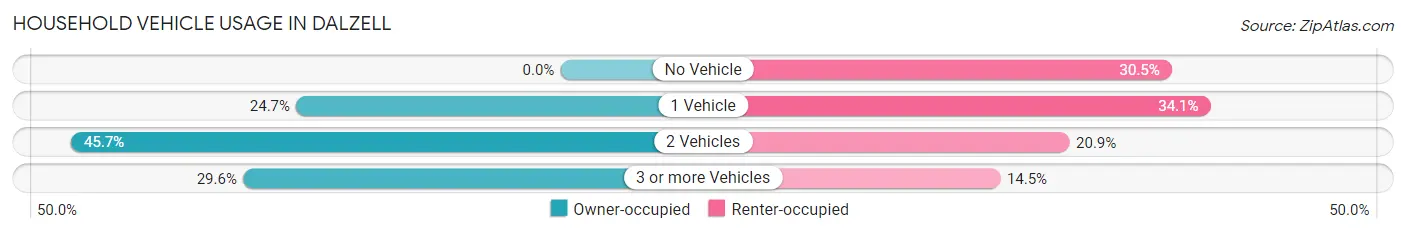
| Vehicles per Household | Owner-occupied | Renter-occupied |
| No Vehicle | 0 (0.0%) | 118 (30.5%) |
| 1 Vehicle | 214 (24.7%) | 132 (34.1%) |
| 2 Vehicles | 396 (45.7%) | 81 (20.9%) |
| 3 or more Vehicles | 257 (29.6%) | 56 (14.5%) |
| Total | 867 (100.0%) | 387 (100.0%) |
Real Estate & Mortgages in Dalzell
Real Estate and Mortgage Overview in Dalzell
| Characteristic | Without Mortgage | With Mortgage |
| Housing Units | 329 | 538 |
| Median Property Value | $110,600 | $138,600 |
| Median Household Income | $60,284 | $51 |
| Monthly Housing Costs | $477 | $0 |
| Real Estate Taxes | $690 | $24 |
Property Value by Mortgage Status in Dalzell
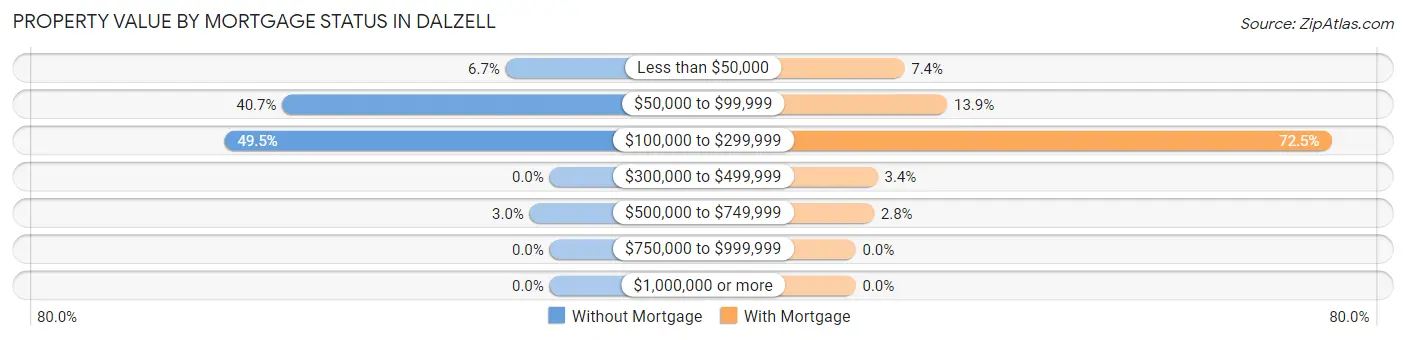
| Property Value | Without Mortgage | With Mortgage |
| Less than $50,000 | 22 (6.7%) | 40 (7.4%) |
| $50,000 to $99,999 | 134 (40.7%) | 75 (13.9%) |
| $100,000 to $299,999 | 163 (49.5%) | 390 (72.5%) |
| $300,000 to $499,999 | 0 (0.0%) | 18 (3.4%) |
| $500,000 to $749,999 | 10 (3.0%) | 15 (2.8%) |
| $750,000 to $999,999 | 0 (0.0%) | 0 (0.0%) |
| $1,000,000 or more | 0 (0.0%) | 0 (0.0%) |
| Total | 329 (100.0%) | 538 (100.0%) |
Household Income by Mortgage Status in Dalzell
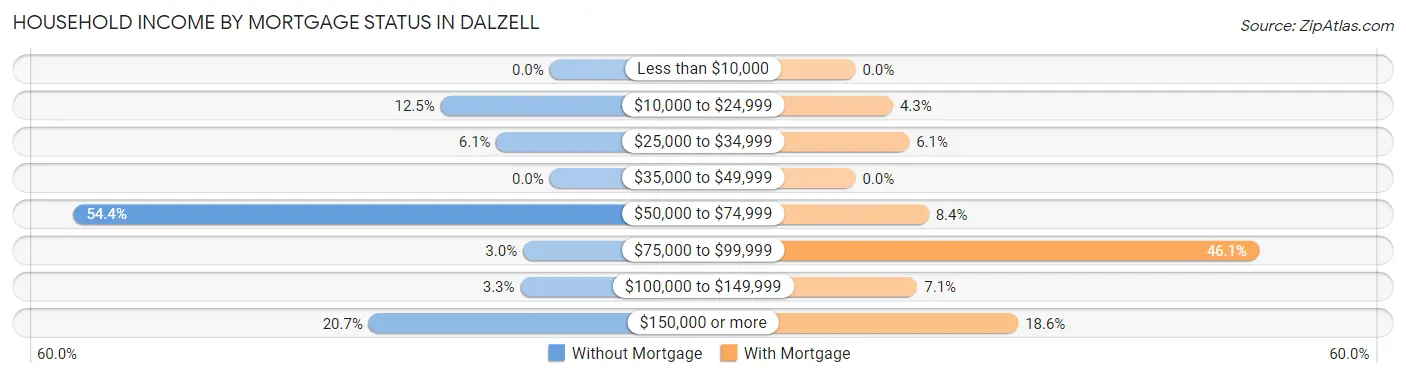
| Household Income | Without Mortgage | With Mortgage |
| Less than $10,000 | 0 (0.0%) | 0 (0.0%) |
| $10,000 to $24,999 | 41 (12.5%) | 23 (4.3%) |
| $25,000 to $34,999 | 20 (6.1%) | 33 (6.1%) |
| $35,000 to $49,999 | 0 (0.0%) | 0 (0.0%) |
| $50,000 to $74,999 | 179 (54.4%) | 45 (8.4%) |
| $75,000 to $99,999 | 10 (3.0%) | 248 (46.1%) |
| $100,000 to $149,999 | 11 (3.3%) | 38 (7.1%) |
| $150,000 or more | 68 (20.7%) | 100 (18.6%) |
| Total | 329 (100.0%) | 538 (100.0%) |
Property Value to Household Income Ratio in Dalzell
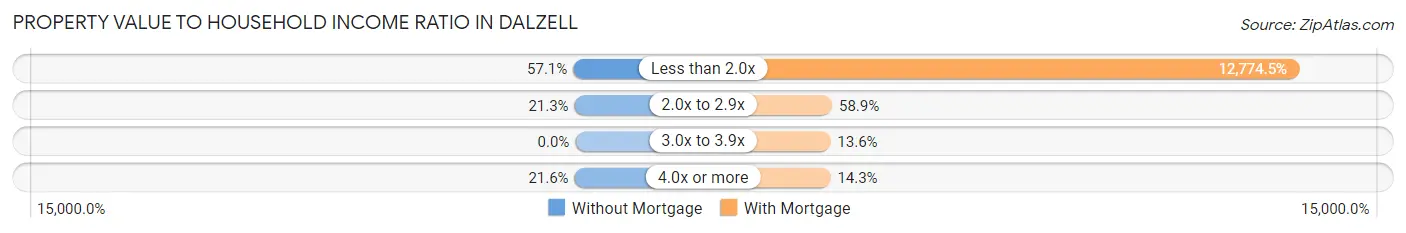
| Value-to-Income Ratio | Without Mortgage | With Mortgage |
| Less than 2.0x | 188 (57.1%) | 68,727 (12,774.5%) |
| 2.0x to 2.9x | 70 (21.3%) | 317 (58.9%) |
| 3.0x to 3.9x | 0 (0.0%) | 73 (13.6%) |
| 4.0x or more | 71 (21.6%) | 77 (14.3%) |
| Total | 329 (100.0%) | 538 (100.0%) |
Real Estate Taxes by Mortgage Status in Dalzell
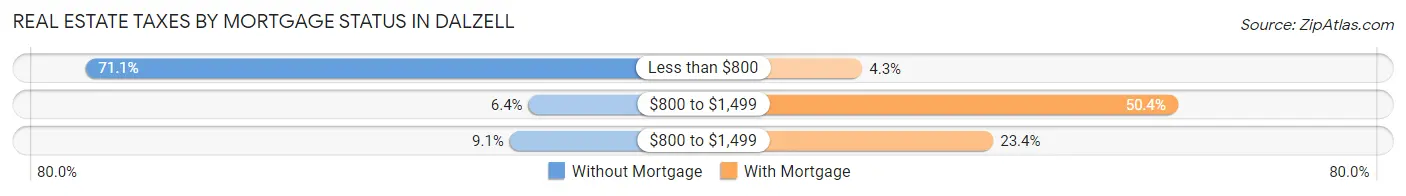
| Property Taxes | Without Mortgage | With Mortgage |
| Less than $800 | 234 (71.1%) | 23 (4.3%) |
| $800 to $1,499 | 21 (6.4%) | 271 (50.4%) |
| $800 to $1,499 | 30 (9.1%) | 126 (23.4%) |
| Total | 329 (100.0%) | 538 (100.0%) |
Health & Disability in Dalzell
Health Insurance Coverage by Age in Dalzell
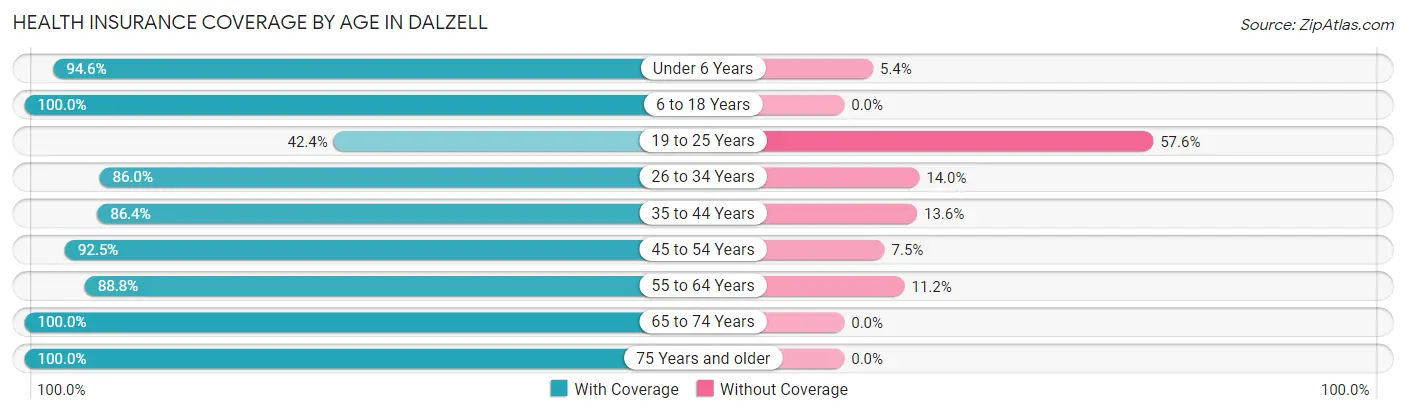
| Age Bracket | With Coverage | Without Coverage |
| Under 6 Years | 371 (94.6%) | 21 (5.4%) |
| 6 to 18 Years | 568 (100.0%) | 0 (0.0%) |
| 19 to 25 Years | 131 (42.4%) | 178 (57.6%) |
| 26 to 34 Years | 449 (86.0%) | 73 (14.0%) |
| 35 to 44 Years | 363 (86.4%) | 57 (13.6%) |
| 45 to 54 Years | 246 (92.5%) | 20 (7.5%) |
| 55 to 64 Years | 371 (88.8%) | 47 (11.2%) |
| 65 to 74 Years | 188 (100.0%) | 0 (0.0%) |
| 75 Years and older | 138 (100.0%) | 0 (0.0%) |
| Total | 2,825 (87.7%) | 396 (12.3%) |
Health Insurance Coverage by Citizenship Status in Dalzell
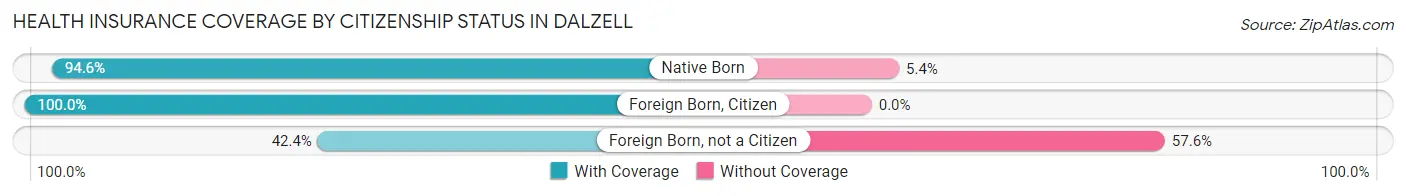
| Citizenship Status | With Coverage | Without Coverage |
| Native Born | 371 (94.6%) | 21 (5.4%) |
| Foreign Born, Citizen | 568 (100.0%) | 0 (0.0%) |
| Foreign Born, not a Citizen | 131 (42.4%) | 178 (57.6%) |
Health Insurance Coverage by Household Income in Dalzell
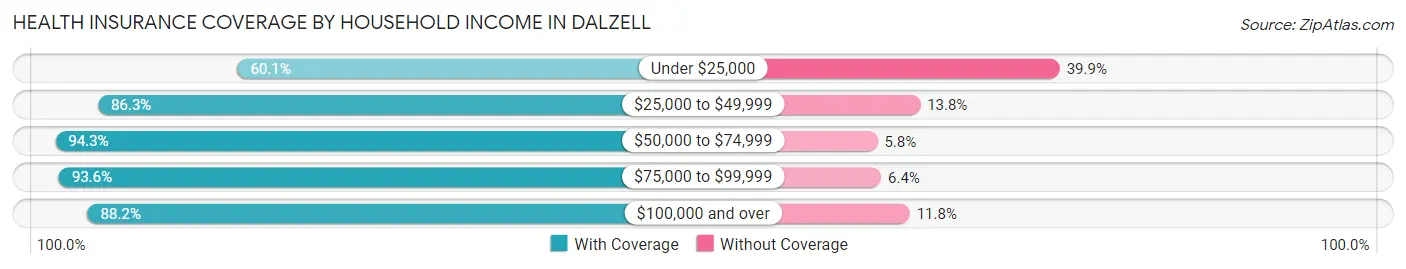
| Household Income | With Coverage | Without Coverage |
| Under $25,000 | 226 (60.1%) | 150 (39.9%) |
| $25,000 to $49,999 | 232 (86.3%) | 37 (13.8%) |
| $50,000 to $74,999 | 1,295 (94.3%) | 79 (5.8%) |
| $75,000 to $99,999 | 204 (93.6%) | 14 (6.4%) |
| $100,000 and over | 868 (88.2%) | 116 (11.8%) |
Public vs Private Health Insurance Coverage by Age in Dalzell
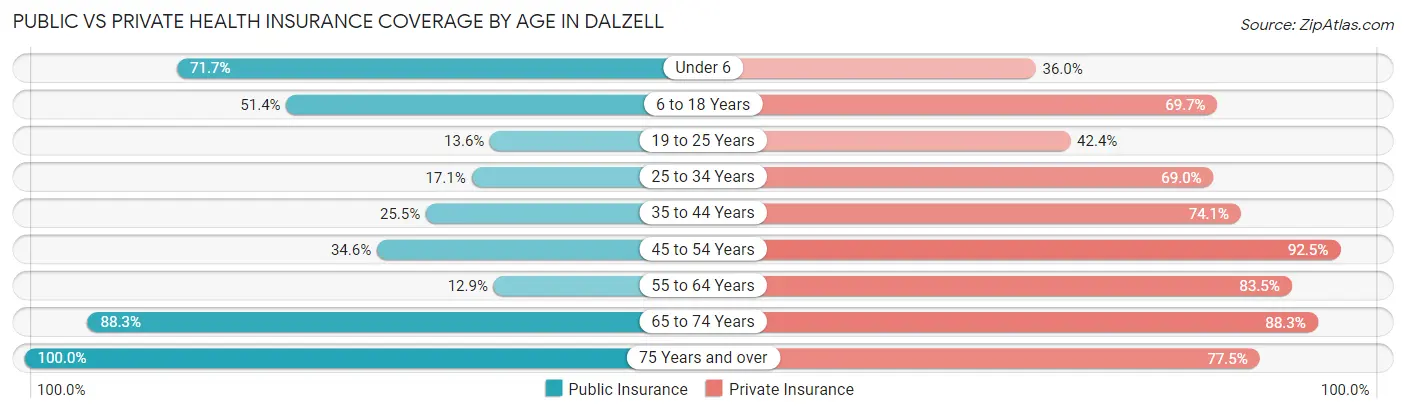
| Age Bracket | Public Insurance | Private Insurance |
| Under 6 | 281 (71.7%) | 141 (36.0%) |
| 6 to 18 Years | 292 (51.4%) | 396 (69.7%) |
| 19 to 25 Years | 42 (13.6%) | 131 (42.4%) |
| 25 to 34 Years | 89 (17.1%) | 360 (69.0%) |
| 35 to 44 Years | 107 (25.5%) | 311 (74.1%) |
| 45 to 54 Years | 92 (34.6%) | 246 (92.5%) |
| 55 to 64 Years | 54 (12.9%) | 349 (83.5%) |
| 65 to 74 Years | 166 (88.3%) | 166 (88.3%) |
| 75 Years and over | 138 (100.0%) | 107 (77.5%) |
| Total | 1,261 (39.2%) | 2,207 (68.5%) |
Disability Status by Sex by Age in Dalzell
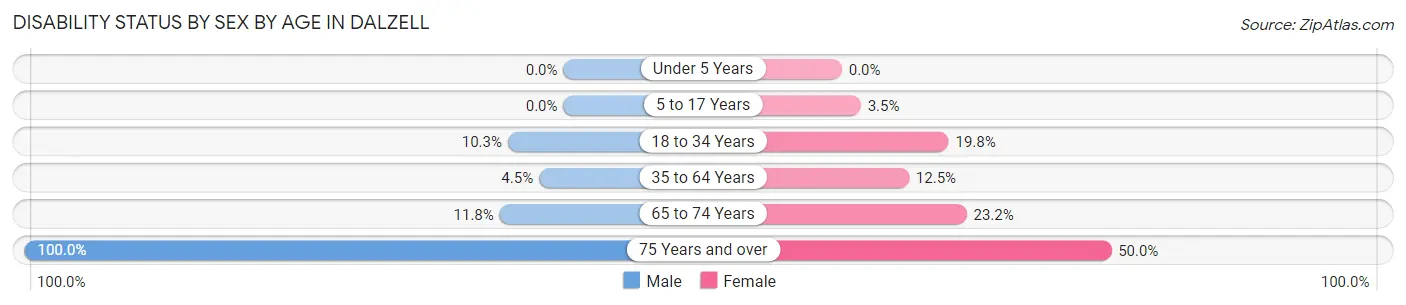
| Age Bracket | Male | Female |
| Under 5 Years | 0 (0.0%) | 0 (0.0%) |
| 5 to 17 Years | 0 (0.0%) | 18 (3.5%) |
| 18 to 34 Years | 43 (10.3%) | 82 (19.8%) |
| 35 to 64 Years | 18 (4.5%) | 88 (12.5%) |
| 65 to 74 Years | 11 (11.8%) | 22 (23.2%) |
| 75 Years and over | 42 (100.0%) | 48 (50.0%) |
Disability Class by Sex by Age in Dalzell
Disability Class: Hearing Difficulty
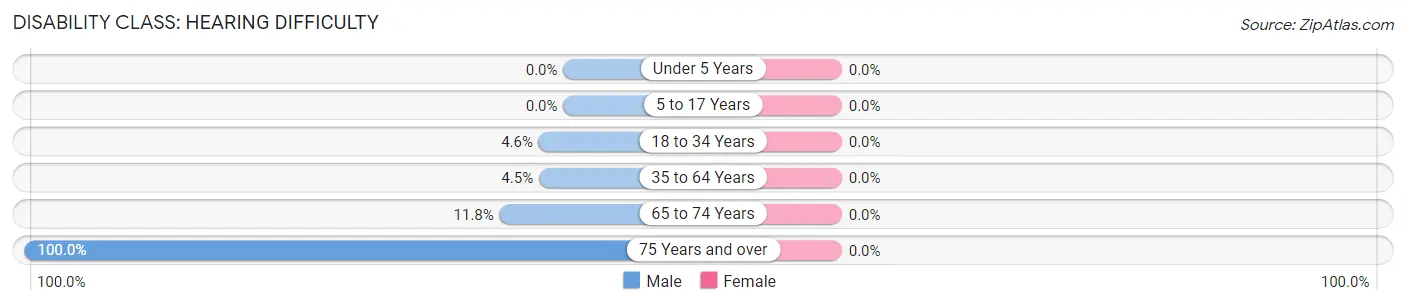
| Age Bracket | Male | Female |
| Under 5 Years | 0 (0.0%) | 0 (0.0%) |
| 5 to 17 Years | 0 (0.0%) | 0 (0.0%) |
| 18 to 34 Years | 19 (4.6%) | 0 (0.0%) |
| 35 to 64 Years | 18 (4.5%) | 0 (0.0%) |
| 65 to 74 Years | 11 (11.8%) | 0 (0.0%) |
| 75 Years and over | 42 (100.0%) | 0 (0.0%) |
Disability Class: Vision Difficulty
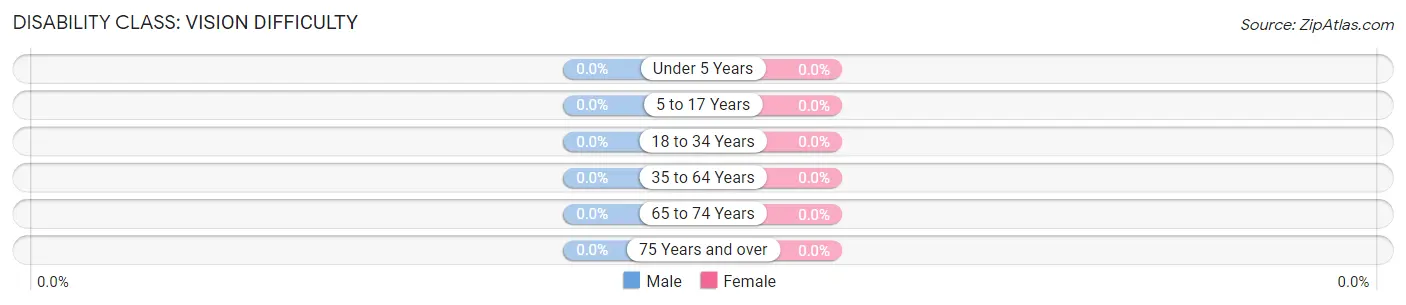
| Age Bracket | Male | Female |
| Under 5 Years | 0 (0.0%) | 0 (0.0%) |
| 5 to 17 Years | 0 (0.0%) | 0 (0.0%) |
| 18 to 34 Years | 0 (0.0%) | 0 (0.0%) |
| 35 to 64 Years | 0 (0.0%) | 0 (0.0%) |
| 65 to 74 Years | 0 (0.0%) | 0 (0.0%) |
| 75 Years and over | 0 (0.0%) | 0 (0.0%) |
Disability Class: Cognitive Difficulty
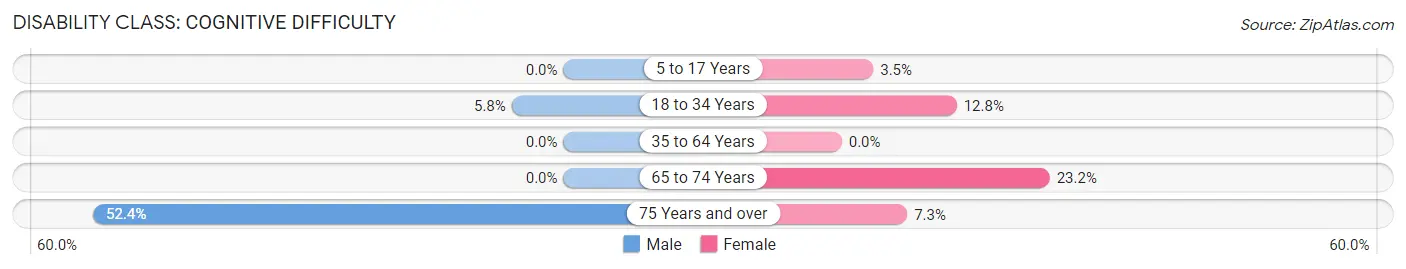
| Age Bracket | Male | Female |
| 5 to 17 Years | 0 (0.0%) | 18 (3.5%) |
| 18 to 34 Years | 24 (5.8%) | 53 (12.8%) |
| 35 to 64 Years | 0 (0.0%) | 0 (0.0%) |
| 65 to 74 Years | 0 (0.0%) | 22 (23.2%) |
| 75 Years and over | 22 (52.4%) | 7 (7.3%) |
Disability Class: Ambulatory Difficulty
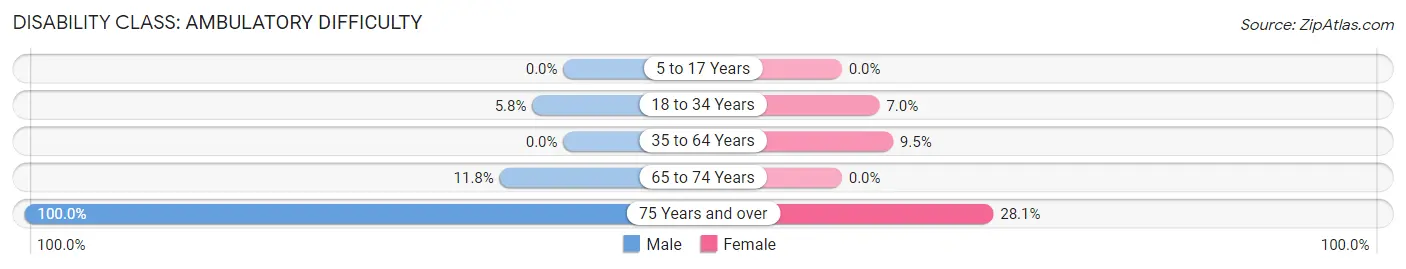
| Age Bracket | Male | Female |
| 5 to 17 Years | 0 (0.0%) | 0 (0.0%) |
| 18 to 34 Years | 24 (5.8%) | 29 (7.0%) |
| 35 to 64 Years | 0 (0.0%) | 67 (9.5%) |
| 65 to 74 Years | 11 (11.8%) | 0 (0.0%) |
| 75 Years and over | 42 (100.0%) | 27 (28.1%) |
Disability Class: Self-Care Difficulty
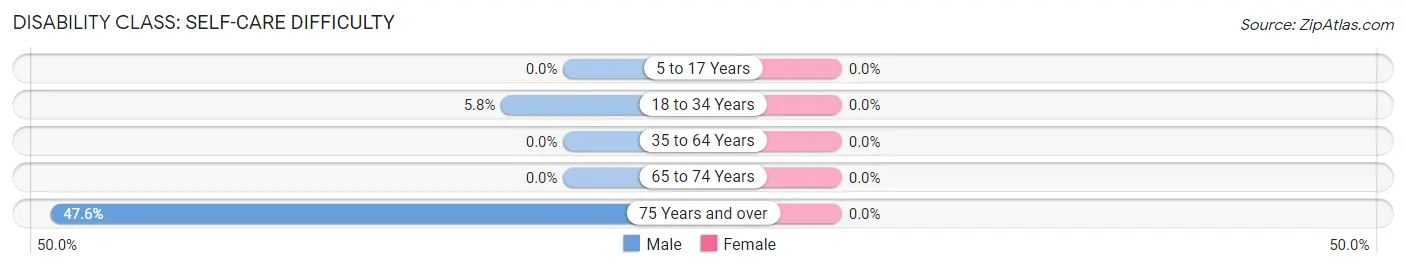
| Age Bracket | Male | Female |
| 5 to 17 Years | 0 (0.0%) | 0 (0.0%) |
| 18 to 34 Years | 24 (5.8%) | 0 (0.0%) |
| 35 to 64 Years | 0 (0.0%) | 0 (0.0%) |
| 65 to 74 Years | 0 (0.0%) | 0 (0.0%) |
| 75 Years and over | 20 (47.6%) | 0 (0.0%) |
Technology Access in Dalzell
Computing Device Access in Dalzell
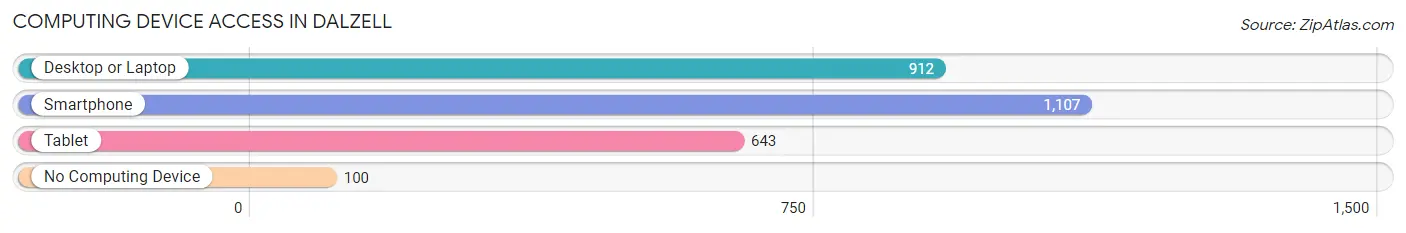
| Device Type | # Households | % Households |
| Desktop or Laptop | 912 | 72.7% |
| Smartphone | 1,107 | 88.3% |
| Tablet | 643 | 51.3% |
| No Computing Device | 100 | 8.0% |
| Total | 1,254 | 100.0% |
Internet Access in Dalzell
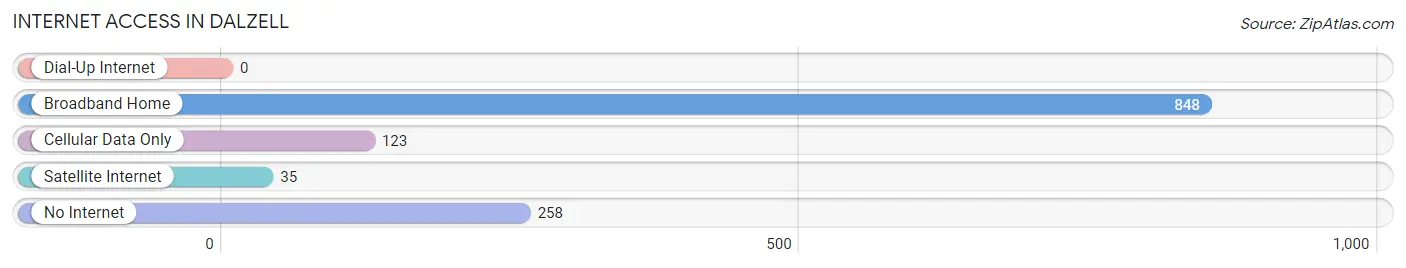
| Internet Type | # Households | % Households |
| Dial-Up Internet | 0 | 0.0% |
| Broadband Home | 848 | 67.6% |
| Cellular Data Only | 123 | 9.8% |
| Satellite Internet | 35 | 2.8% |
| No Internet | 258 | 20.6% |
| Total | 1,254 | 100.0% |
Dalzell Summary
Dalzell, South Carolina is a small town located in Sumter County, South Carolina. It is situated on the banks of the Black River, about 20 miles south of Sumter, the county seat. The town was founded in 1891 and incorporated in 1895. It is home to approximately 1,000 people, and is a part of the Sumter Metropolitan Statistical Area.
History
The area that is now Dalzell was originally inhabited by the Catawba Indians. The first European settlers arrived in the area in the late 1700s, and the town was officially founded in 1891. The town was named after the Dalzell family, who were among the first settlers in the area.
The town was originally a farming community, and the main crops grown were cotton, corn, and tobacco. In the early 1900s, the town began to grow and develop, and the first school was built in 1910. The town also had a post office, a bank, and a few stores.
In the 1920s, the town began to decline, as many of the residents moved away in search of better economic opportunities. The Great Depression further exacerbated the town’s decline, and by the 1940s, the population had dropped to just over 500 people.
In the 1950s, the town began to experience a resurgence, as new businesses and industries moved into the area. The town’s population began to grow again, and by the 1970s, it had reached 1,000 people.
Geography
Dalzell is located in Sumter County, South Carolina, about 20 miles south of Sumter, the county seat. The town is situated on the banks of the Black River, and is surrounded by rural farmland. The town is located in the Piedmont region of South Carolina, and has a humid subtropical climate.
Economy
The economy of Dalzell is largely based on agriculture and manufacturing. The town is home to several small businesses, including a grocery store, a hardware store, and a few restaurants. The town is also home to several manufacturing companies, including a paper mill and a furniture factory.
Demographics
As of the 2010 census, the population of Dalzell was 1,039. The racial makeup of the town was 79.3% White, 17.2% African American, 0.3% Native American, 0.7% Asian, 0.1% Pacific Islander, and 2.4% from other races. The median household income was $31,250, and the median family income was $37,500.
Conclusion
Dalzell, South Carolina is a small town located in Sumter County, South Carolina. It was founded in 1891 and incorporated in 1895, and is home to approximately 1,000 people. The town’s economy is largely based on agriculture and manufacturing, and the town is home to several small businesses and manufacturing companies. The population of Dalzell is largely White, with a small percentage of African Americans, Native Americans, Asians, and Pacific Islanders.
Common Questions
What is Per Capita Income in Dalzell?
Per Capita income in Dalzell is $27,107.
What is the Median Family Income in Dalzell?
Median Family Income in Dalzell is $63,972.
What is the Median Household income in Dalzell?
Median Household Income in Dalzell is $62,159.
What is Income or Wage Gap in Dalzell?
Income or Wage Gap in Dalzell is 26.7%.
Women in Dalzell earn 73.3 cents for every dollar earned by a man.
What is Inequality or Gini Index in Dalzell?
Inequality or Gini Index in Dalzell is 0.42.
What is the Total Population of Dalzell?
Total Population of Dalzell is 3,417.
What is the Total Male Population of Dalzell?
Total Male Population of Dalzell is 1,429.
What is the Total Female Population of Dalzell?
Total Female Population of Dalzell is 1,988.
What is the Ratio of Males per 100 Females in Dalzell?
There are 71.88 Males per 100 Females in Dalzell.
What is the Ratio of Females per 100 Males in Dalzell?
There are 139.12 Females per 100 Males in Dalzell.
What is the Median Population Age in Dalzell?
Median Population Age in Dalzell is 30.3 Years.
What is the Average Family Size in Dalzell
Average Family Size in Dalzell is 3.2 People.
What is the Average Household Size in Dalzell
Average Household Size in Dalzell is 2.7 People.
How Large is the Labor Force in Dalzell?
There are 1,691 People in the Labor Forcein in Dalzell.
What is the Percentage of People in the Labor Force in Dalzell?
68.6% of People are in the Labor Force in Dalzell.
What is the Unemployment Rate in Dalzell?
Unemployment Rate in Dalzell is 9.3%.