Chester, SC Map & Demographics
Chester Map
Chester Overview
$20,036
PER CAPITA INCOME
$49,583
AVG FAMILY INCOME
$39,951
AVG HOUSEHOLD INCOME
27.5%
WAGE / INCOME GAP [ % ]
72.5¢/ $1
WAGE / INCOME GAP [ $ ]
0.40
INEQUALITY / GINI INDEX
5,260
TOTAL POPULATION
2,569
MALE POPULATION
2,691
FEMALE POPULATION
95.47
MALES / 100 FEMALES
104.75
FEMALES / 100 MALES
33.5
MEDIAN AGE
3.2
AVG FAMILY SIZE
2.3
AVG HOUSEHOLD SIZE
2,339
LABOR FORCE [ PEOPLE ]
56.6%
PERCENT IN LABOR FORCE
10.2%
UNEMPLOYMENT RATE
Chester Zip Codes
Chester Area Codes
Income in Chester
Income Overview in Chester
Per Capita Income in Chester is $20,036, while median incomes of families and households are $49,583 and $39,951 respectively.
| Characteristic | Number | Measure |
| Per Capita Income | 5,260 | $20,036 |
| Median Family Income | 1,150 | $49,583 |
| Mean Family Income | 1,150 | $51,902 |
| Median Household Income | 2,248 | $39,951 |
| Mean Household Income | 2,248 | $45,536 |
| Income Deficit | 1,150 | $0 |
| Wage / Income Gap (%) | 5,260 | 27.46% |
| Wage / Income Gap ($) | 5,260 | 72.54¢ per $1 |
| Gini / Inequality Index | 5,260 | 0.40 |
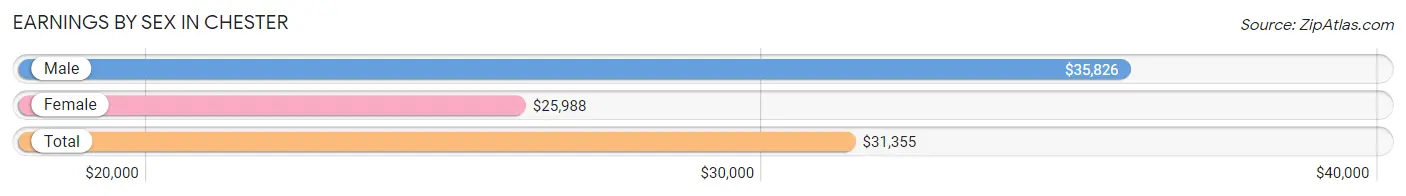
Earnings by Sex in Chester
Average Earnings in Chester are $31,355, $35,826 for men and $25,988 for women, a difference of 27.5%.
| Sex | Number | Average Earnings |
| Male | 1,071 (46.1%) | $35,826 |
| Female | 1,252 (53.9%) | $25,988 |
| Total | 2,323 (100.0%) | $31,355 |
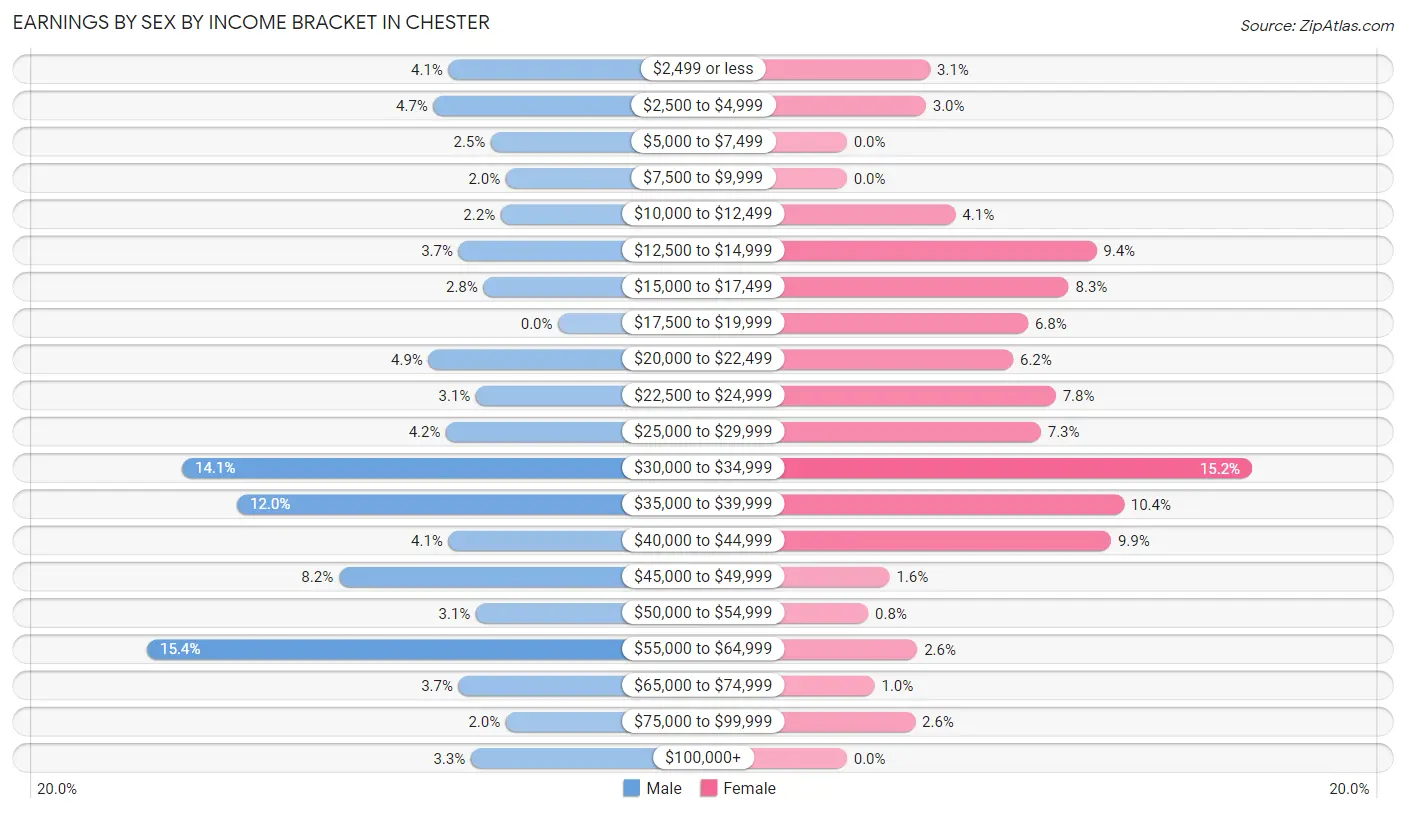
Earnings by Sex by Income Bracket in Chester
The most common earnings brackets in Chester are $55,000 to $64,999 for men (165 | 15.4%) and $30,000 to $34,999 for women (190 | 15.2%).
| Income | Male | Female |
| $2,499 or less | 44 (4.1%) | 39 (3.1%) |
| $2,500 to $4,999 | 50 (4.7%) | 37 (3.0%) |
| $5,000 to $7,499 | 27 (2.5%) | 0 (0.0%) |
| $7,500 to $9,999 | 21 (2.0%) | 0 (0.0%) |
| $10,000 to $12,499 | 23 (2.1%) | 51 (4.1%) |
| $12,500 to $14,999 | 40 (3.7%) | 117 (9.3%) |
| $15,000 to $17,499 | 30 (2.8%) | 104 (8.3%) |
| $17,500 to $19,999 | 0 (0.0%) | 85 (6.8%) |
| $20,000 to $22,499 | 52 (4.9%) | 78 (6.2%) |
| $22,500 to $24,999 | 33 (3.1%) | 98 (7.8%) |
| $25,000 to $29,999 | 45 (4.2%) | 91 (7.3%) |
| $30,000 to $34,999 | 151 (14.1%) | 190 (15.2%) |
| $35,000 to $39,999 | 129 (12.0%) | 130 (10.4%) |
| $40,000 to $44,999 | 44 (4.1%) | 124 (9.9%) |
| $45,000 to $49,999 | 88 (8.2%) | 20 (1.6%) |
| $50,000 to $54,999 | 33 (3.1%) | 10 (0.8%) |
| $55,000 to $64,999 | 165 (15.4%) | 33 (2.6%) |
| $65,000 to $74,999 | 40 (3.7%) | 13 (1.0%) |
| $75,000 to $99,999 | 21 (2.0%) | 32 (2.6%) |
| $100,000+ | 35 (3.3%) | 0 (0.0%) |
| Total | 1,071 (100.0%) | 1,252 (100.0%) |
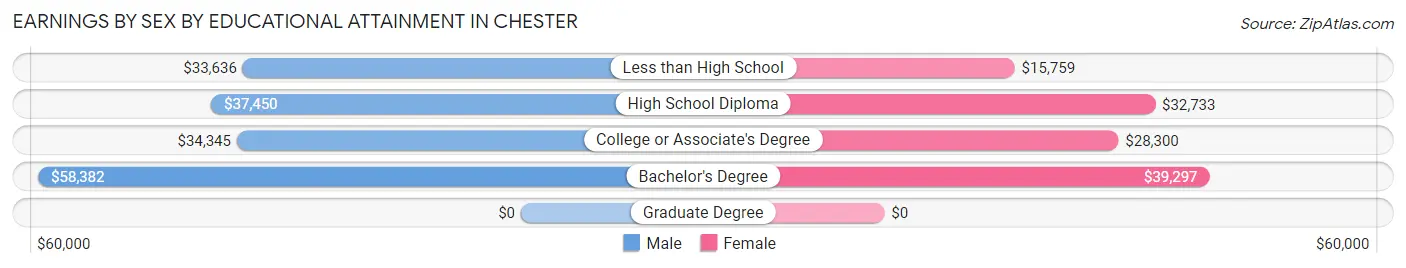
Earnings by Sex by Educational Attainment in Chester
Average earnings in Chester are $37,571 for men and $26,890 for women, a difference of 28.4%. Men with an educational attainment of bachelor's degree enjoy the highest average annual earnings of $58,382, while those with less than high school education earn the least with $33,636. Women with an educational attainment of bachelor's degree earn the most with the average annual earnings of $39,297, while those with less than high school education have the smallest earnings of $15,759.
| Educational Attainment | Male Income | Female Income |
| Less than High School | $33,636 | $15,759 |
| High School Diploma | $37,450 | $32,733 |
| College or Associate's Degree | $34,345 | $28,300 |
| Bachelor's Degree | $58,382 | $39,297 |
| Graduate Degree | - | - |
| Total | $37,571 | $26,890 |
Family Income in Chester
Family Income Brackets in Chester
According to the Chester family income data, there are 389 families falling into the $50,000 to $74,999 income range, which is the most common income bracket and makes up 33.8% of all families. Conversely, the $10,000 to $14,999 income bracket is the least frequent group with only 12 families (1.0%) belonging to this category.
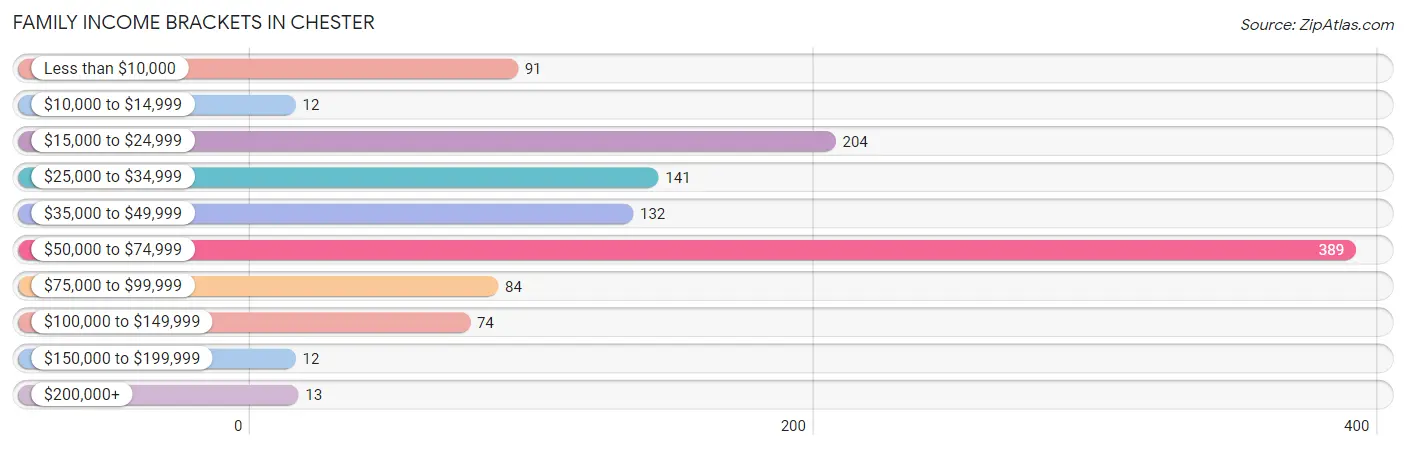
| Income Bracket | # Families | % Families |
| Less than $10,000 | 91 | 7.9% |
| $10,000 to $14,999 | 12 | 1.0% |
| $15,000 to $24,999 | 204 | 17.7% |
| $25,000 to $34,999 | 141 | 12.3% |
| $35,000 to $49,999 | 132 | 11.5% |
| $50,000 to $74,999 | 389 | 33.8% |
| $75,000 to $99,999 | 84 | 7.3% |
| $100,000 to $149,999 | 74 | 6.4% |
| $150,000 to $199,999 | 12 | 1.0% |
| $200,000+ | 13 | 1.1% |
Family Income by Famaliy Size in Chester
3-person families (281 | 24.4%) account for the highest median family income in Chester with $56,648 per family, while 2-person families (575 | 50.0%) have the highest median income of $20,020 per family member.
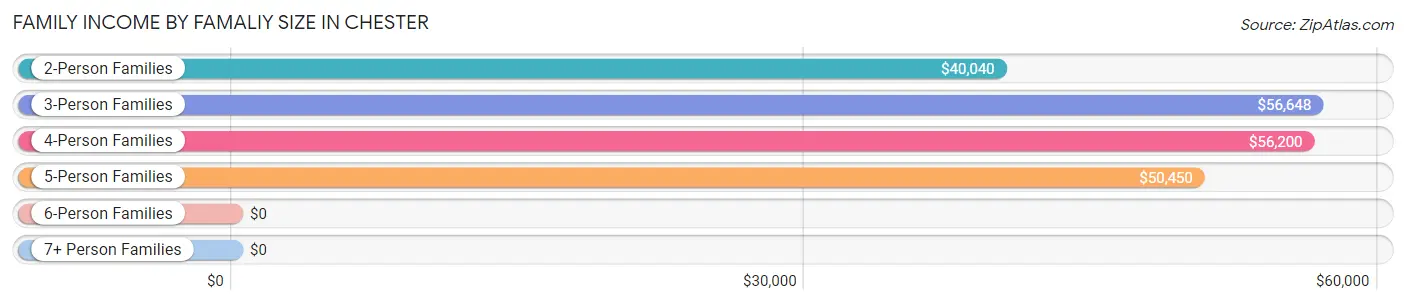
| Income Bracket | # Families | Median Income |
| 2-Person Families | 575 (50.0%) | $40,040 |
| 3-Person Families | 281 (24.4%) | $56,648 |
| 4-Person Families | 206 (17.9%) | $56,200 |
| 5-Person Families | 59 (5.1%) | $50,450 |
| 6-Person Families | 29 (2.5%) | $0 |
| 7+ Person Families | 0 (0.0%) | $0 |
| Total | 1,150 (100.0%) | $49,583 |
Family Income by Number of Earners in Chester
The median family income in Chester is $49,583, with families comprising 3+ earners (71) having the highest median family income of $85,288, while families with no earners (262) have the lowest median family income of $16,887, accounting for 6.2% and 22.8% of families, respectively.
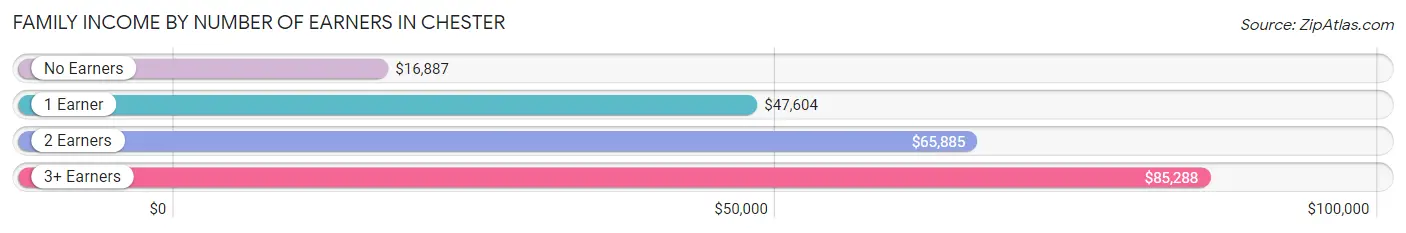
| Number of Earners | # Families | Median Income |
| No Earners | 262 (22.8%) | $16,887 |
| 1 Earner | 426 (37.0%) | $47,604 |
| 2 Earners | 391 (34.0%) | $65,885 |
| 3+ Earners | 71 (6.2%) | $85,288 |
| Total | 1,150 (100.0%) | $49,583 |
Household Income in Chester
Household Income Brackets in Chester
With 580 households falling in the category, the $50,000 to $74,999 income range is the most frequent in Chester, accounting for 25.8% of all households. In contrast, only 13 households (0.6%) fall into the $200,000+ income bracket, making it the least populous group.
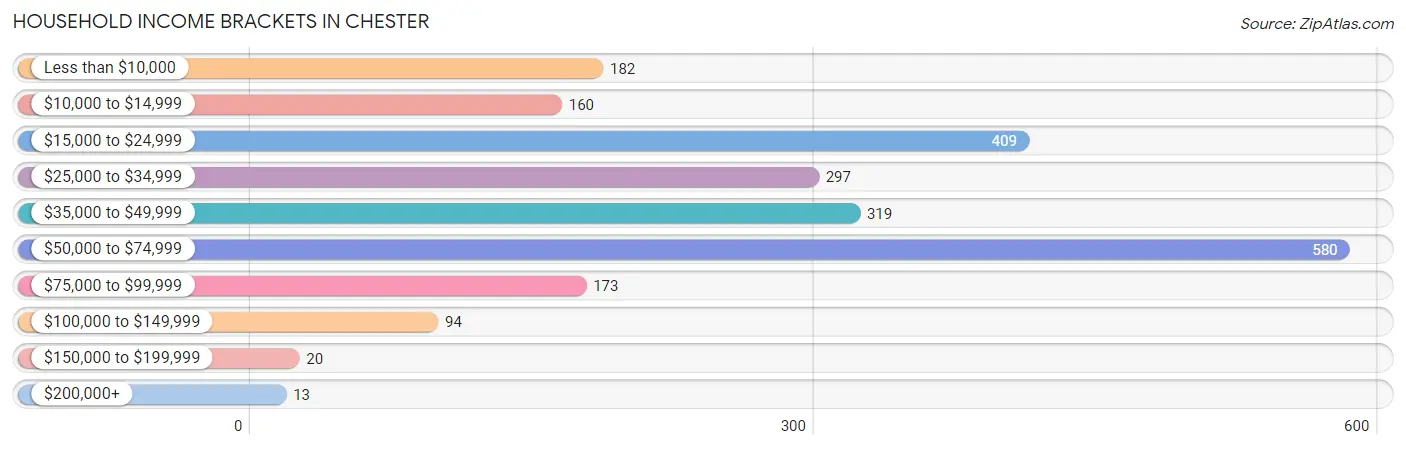
| Income Bracket | # Households | % Households |
| Less than $10,000 | 182 | 8.1% |
| $10,000 to $14,999 | 160 | 7.1% |
| $15,000 to $24,999 | 409 | 18.2% |
| $25,000 to $34,999 | 297 | 13.2% |
| $35,000 to $49,999 | 319 | 14.2% |
| $50,000 to $74,999 | 580 | 25.8% |
| $75,000 to $99,999 | 173 | 7.7% |
| $100,000 to $149,999 | 94 | 4.2% |
| $150,000 to $199,999 | 20 | 0.9% |
| $200,000+ | 13 | 0.6% |
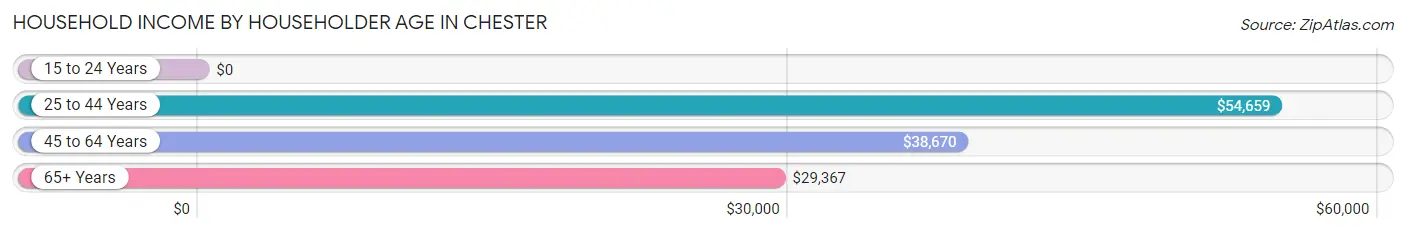
Household Income by Householder Age in Chester
The median household income in Chester is $39,951, with the highest median household income of $54,659 found in the 25 to 44 years age bracket for the primary householder. A total of 766 households (34.1%) fall into this category.
| Income Bracket | # Households | Median Income |
| 15 to 24 Years | 0 (0.0%) | $0 |
| 25 to 44 Years | 766 (34.1%) | $54,659 |
| 45 to 64 Years | 842 (37.5%) | $38,670 |
| 65+ Years | 640 (28.5%) | $29,367 |
| Total | 2,248 (100.0%) | $39,951 |
Poverty in Chester
Income Below Poverty by Sex and Age in Chester
With 20.4% poverty level for males and 27.1% for females among the residents of Chester, 12 to 14 year old males and 16 and 17 year old females are the most vulnerable to poverty, with 11 males (57.9%) and 30 females (100.0%) in their respective age groups living below the poverty level.
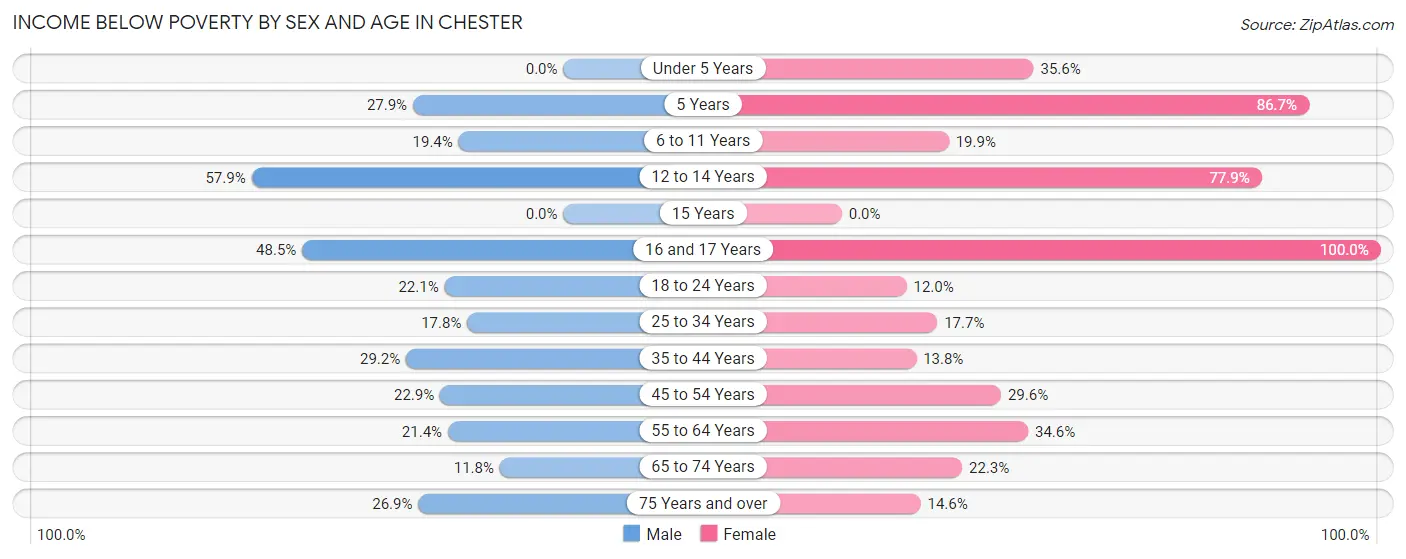
| Age Bracket | Male | Female |
| Under 5 Years | 0 (0.0%) | 110 (35.6%) |
| 5 Years | 67 (27.9%) | 26 (86.7%) |
| 6 to 11 Years | 7 (19.4%) | 26 (19.9%) |
| 12 to 14 Years | 11 (57.9%) | 74 (77.9%) |
| 15 Years | 0 (0.0%) | 0 (0.0%) |
| 16 and 17 Years | 32 (48.5%) | 30 (100.0%) |
| 18 to 24 Years | 30 (22.1%) | 31 (12.0%) |
| 25 to 34 Years | 117 (17.8%) | 82 (17.7%) |
| 35 to 44 Years | 80 (29.2%) | 29 (13.8%) |
| 45 to 54 Years | 35 (22.9%) | 86 (29.5%) |
| 55 to 64 Years | 78 (21.4%) | 130 (34.6%) |
| 65 to 74 Years | 29 (11.8%) | 69 (22.3%) |
| 75 Years and over | 28 (26.9%) | 19 (14.6%) |
| Total | 514 (20.4%) | 712 (27.1%) |
Income Above Poverty by Sex and Age in Chester
According to the poverty statistics in Chester, males aged under 5 years and females aged 18 to 24 years are the age groups that are most secure financially, with 100.0% of males and 88.0% of females in these age groups living above the poverty line.
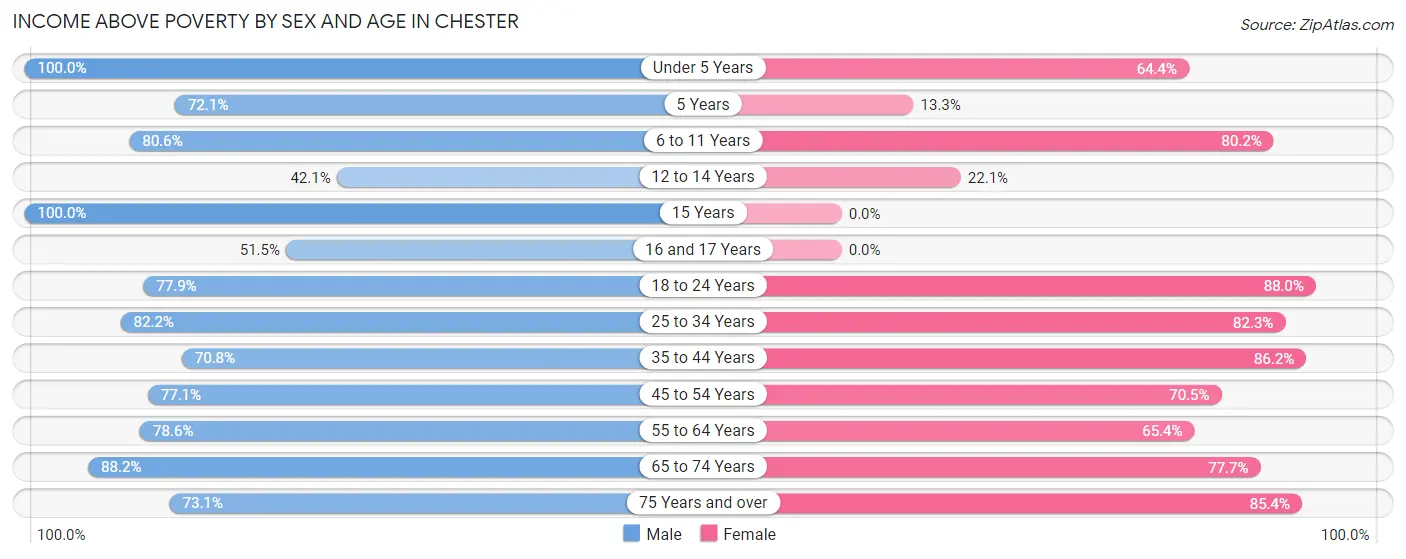
| Age Bracket | Male | Female |
| Under 5 Years | 199 (100.0%) | 199 (64.4%) |
| 5 Years | 173 (72.1%) | 4 (13.3%) |
| 6 to 11 Years | 29 (80.6%) | 105 (80.1%) |
| 12 to 14 Years | 8 (42.1%) | 21 (22.1%) |
| 15 Years | 22 (100.0%) | 0 (0.0%) |
| 16 and 17 Years | 34 (51.5%) | 0 (0.0%) |
| 18 to 24 Years | 106 (77.9%) | 227 (88.0%) |
| 25 to 34 Years | 539 (82.2%) | 381 (82.3%) |
| 35 to 44 Years | 194 (70.8%) | 181 (86.2%) |
| 45 to 54 Years | 118 (77.1%) | 205 (70.5%) |
| 55 to 64 Years | 286 (78.6%) | 246 (65.4%) |
| 65 to 74 Years | 217 (88.2%) | 240 (77.7%) |
| 75 Years and over | 76 (73.1%) | 111 (85.4%) |
| Total | 2,001 (79.6%) | 1,920 (73.0%) |
Income Below Poverty Among Married-Couple Families in Chester
The poverty statistics for married-couple families in Chester show that 2.7% or 15 of the total 550 families live below the poverty line. Families with 1 or 2 children have the highest poverty rate of 6.1%, comprising of 11 families. On the other hand, families with no children have the lowest poverty rate of 1.1%, which includes 4 families.
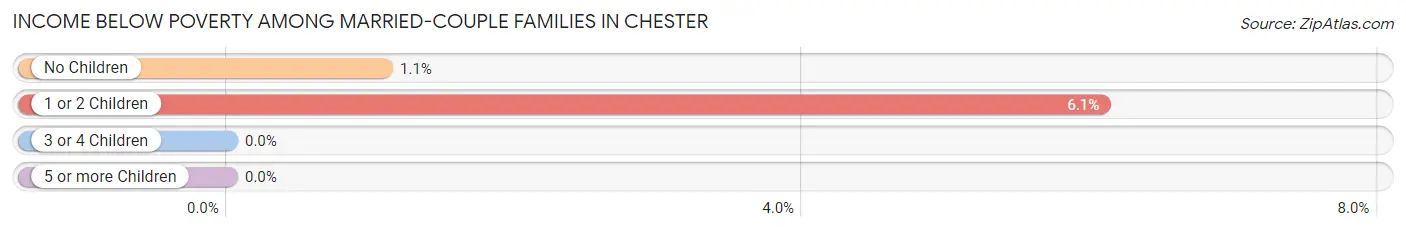
| Children | Above Poverty | Below Poverty |
| No Children | 365 (98.9%) | 4 (1.1%) |
| 1 or 2 Children | 170 (93.9%) | 11 (6.1%) |
| 3 or 4 Children | 0 (0.0%) | 0 (0.0%) |
| 5 or more Children | 0 (0.0%) | 0 (0.0%) |
| Total | 535 (97.3%) | 15 (2.7%) |
Income Below Poverty Among Single-Parent Households in Chester
According to the poverty data in Chester, 29.6% or 42 single-father households and 45.9% or 210 single-mother households are living below the poverty line. Among single-father households, those with 1 or 2 children have the highest poverty rate, with 42 households (42.0%) experiencing poverty. Likewise, among single-mother households, those with 3 or 4 children have the highest poverty rate, with 26 households (76.5%) falling below the poverty line.
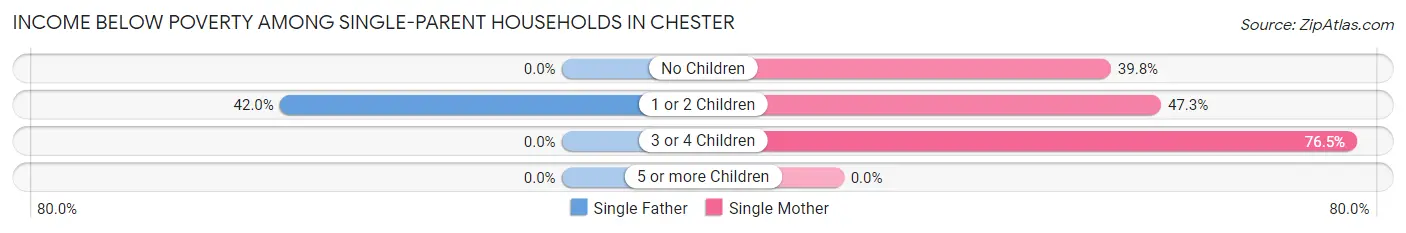
| Children | Single Father | Single Mother |
| No Children | 0 (0.0%) | 88 (39.8%) |
| 1 or 2 Children | 42 (42.0%) | 96 (47.3%) |
| 3 or 4 Children | 0 (0.0%) | 26 (76.5%) |
| 5 or more Children | 0 (0.0%) | 0 (0.0%) |
| Total | 42 (29.6%) | 210 (45.9%) |
Income Below Poverty Among Married-Couple vs Single-Parent Households in Chester
The poverty data for Chester shows that 15 of the married-couple family households (2.7%) and 252 of the single-parent households (42.0%) are living below the poverty level. Within the married-couple family households, those with 1 or 2 children have the highest poverty rate, with 11 households (6.1%) falling below the poverty line. Among the single-parent households, those with 3 or 4 children have the highest poverty rate, with 26 household (60.5%) living below poverty.
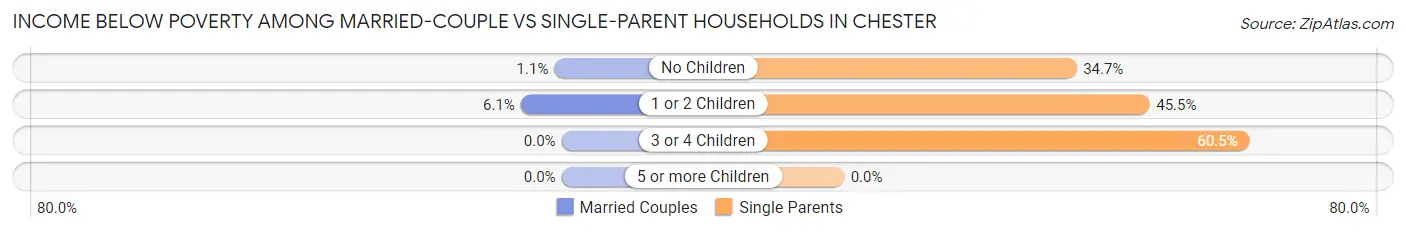
| Children | Married-Couple Families | Single-Parent Households |
| No Children | 4 (1.1%) | 88 (34.6%) |
| 1 or 2 Children | 11 (6.1%) | 138 (45.5%) |
| 3 or 4 Children | 0 (0.0%) | 26 (60.5%) |
| 5 or more Children | 0 (0.0%) | 0 (0.0%) |
| Total | 15 (2.7%) | 252 (42.0%) |
Race in Chester
The most populous races in Chester are Black / African American (3,230 | 61.4%), White / Caucasian (1,929 | 36.7%), and Hispanic or Latino (72 | 1.4%).
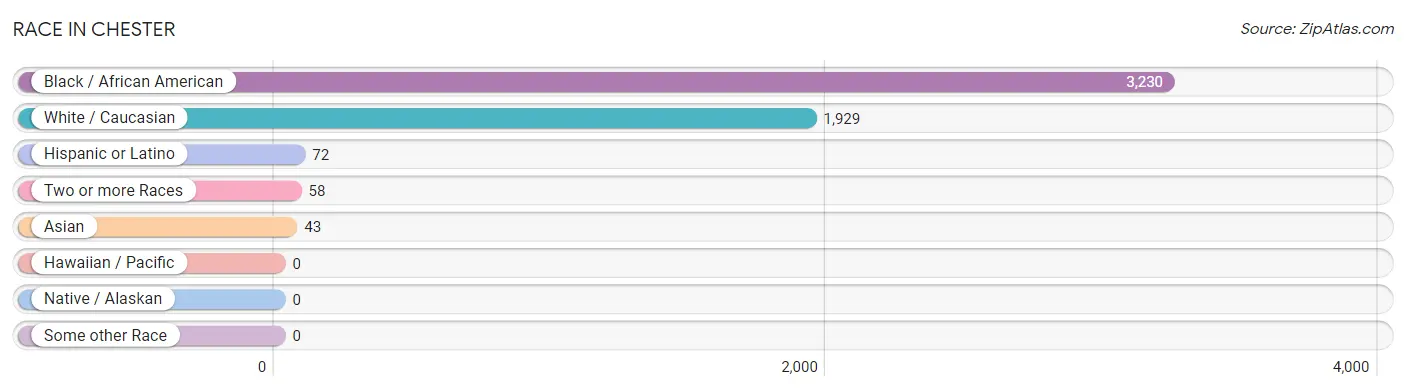
| Race | # Population | % Population |
| Asian | 43 | 0.8% |
| Black / African American | 3,230 | 61.4% |
| Hawaiian / Pacific | 0 | 0.0% |
| Hispanic or Latino | 72 | 1.4% |
| Native / Alaskan | 0 | 0.0% |
| White / Caucasian | 1,929 | 36.7% |
| Two or more Races | 58 | 1.1% |
| Some other Race | 0 | 0.0% |
| Total | 5,260 | 100.0% |
Ancestry in Chester
The most populous ancestries reported in Chester are American (759 | 14.4%), Welsh (262 | 5.0%), Italian (255 | 4.9%), Scotch-Irish (242 | 4.6%), and African (203 | 3.9%), together accounting for 32.7% of all Chester residents.
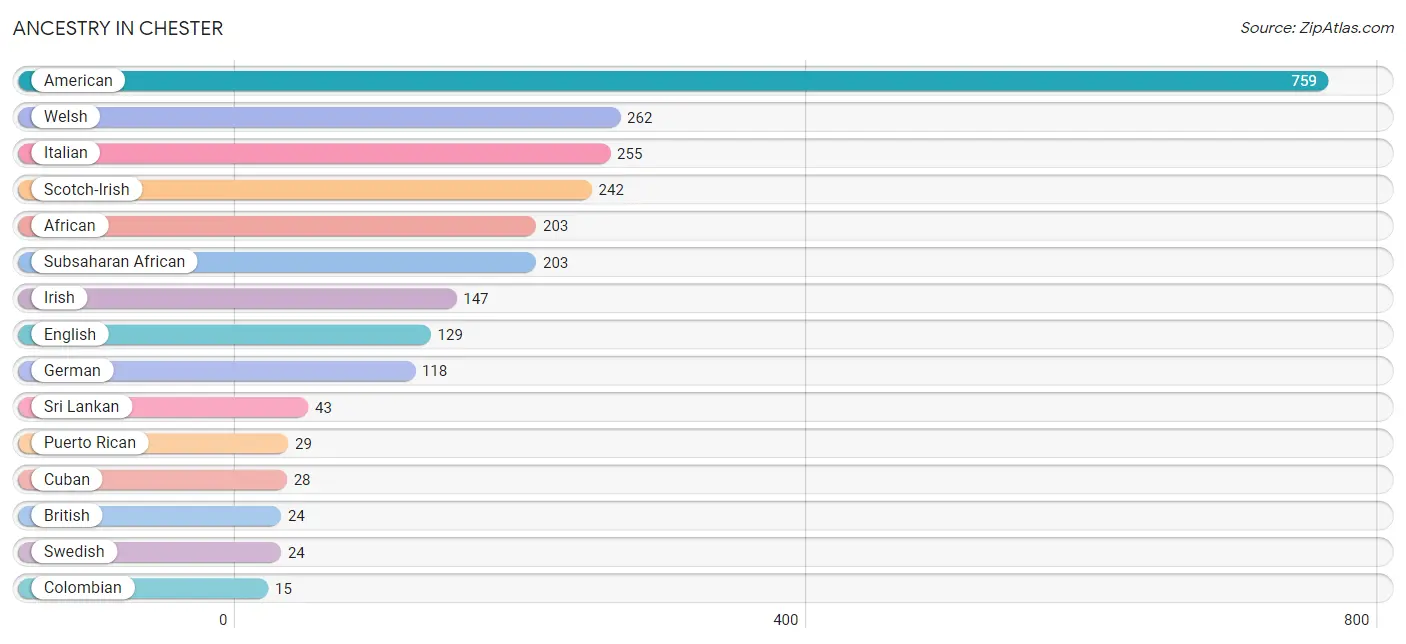
| Ancestry | # Population | % Population |
| African | 203 | 3.9% |
| American | 759 | 14.4% |
| Blackfeet | 4 | 0.1% |
| British | 24 | 0.5% |
| Cherokee | 12 | 0.2% |
| Colombian | 15 | 0.3% |
| Cuban | 28 | 0.5% |
| Dutch | 3 | 0.1% |
| English | 129 | 2.5% |
| German | 118 | 2.2% |
| Indian (Asian) | 8 | 0.2% |
| Irish | 147 | 2.8% |
| Italian | 255 | 4.9% |
| Norwegian | 9 | 0.2% |
| Puerto Rican | 29 | 0.5% |
| Scotch-Irish | 242 | 4.6% |
| Scottish | 7 | 0.1% |
| South American | 15 | 0.3% |
| Sri Lankan | 43 | 0.8% |
| Subsaharan African | 203 | 3.9% |
| Swedish | 24 | 0.5% |
| Trinidadian and Tobagonian | 4 | 0.1% |
| Welsh | 262 | 5.0% | View All 23 Rows |
Immigrants in Chester
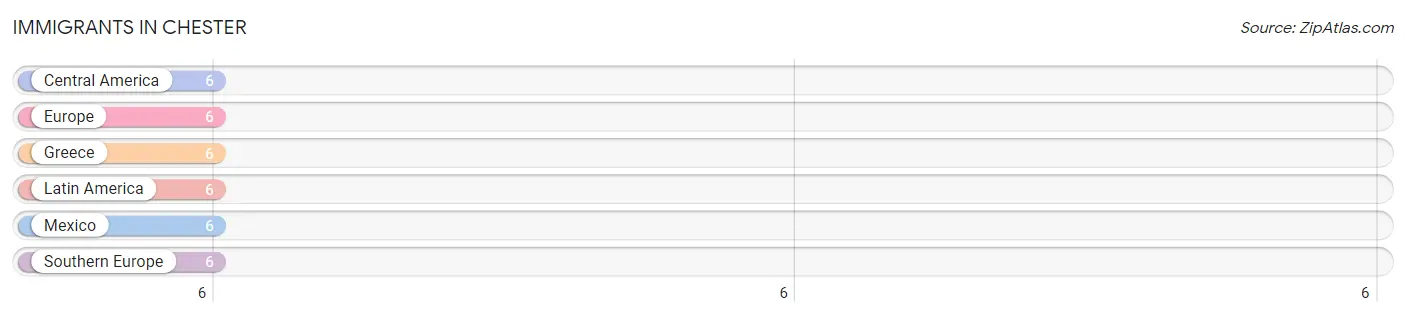
The most numerous immigrant groups reported in Chester came from Central America (6 | 0.1%), Europe (6 | 0.1%), Greece (6 | 0.1%), Latin America (6 | 0.1%), and Mexico (6 | 0.1%), together accounting for 0.6% of all Chester residents.
| Immigration Origin | # Population | % Population |
| Central America | 6 | 0.1% |
| Europe | 6 | 0.1% |
| Greece | 6 | 0.1% |
| Latin America | 6 | 0.1% |
| Mexico | 6 | 0.1% |
| Southern Europe | 6 | 0.1% | View All 6 Rows |
Sex and Age in Chester
Sex and Age in Chester
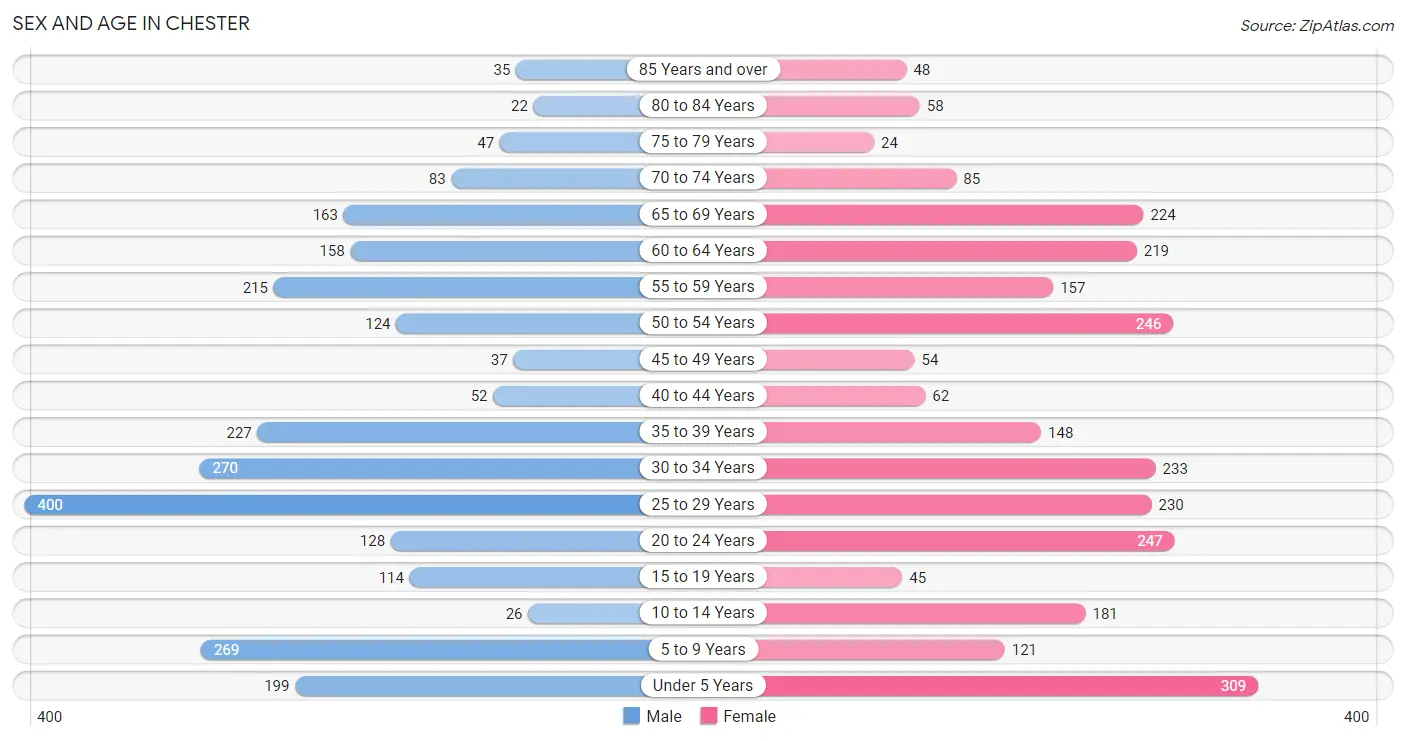
The most populous age groups in Chester are 25 to 29 Years (400 | 15.6%) for men and Under 5 Years (309 | 11.5%) for women.
| Age Bracket | Male | Female |
| Under 5 Years | 199 (7.7%) | 309 (11.5%) |
| 5 to 9 Years | 269 (10.5%) | 121 (4.5%) |
| 10 to 14 Years | 26 (1.0%) | 181 (6.7%) |
| 15 to 19 Years | 114 (4.4%) | 45 (1.7%) |
| 20 to 24 Years | 128 (5.0%) | 247 (9.2%) |
| 25 to 29 Years | 400 (15.6%) | 230 (8.6%) |
| 30 to 34 Years | 270 (10.5%) | 233 (8.7%) |
| 35 to 39 Years | 227 (8.8%) | 148 (5.5%) |
| 40 to 44 Years | 52 (2.0%) | 62 (2.3%) |
| 45 to 49 Years | 37 (1.4%) | 54 (2.0%) |
| 50 to 54 Years | 124 (4.8%) | 246 (9.1%) |
| 55 to 59 Years | 215 (8.4%) | 157 (5.8%) |
| 60 to 64 Years | 158 (6.1%) | 219 (8.1%) |
| 65 to 69 Years | 163 (6.3%) | 224 (8.3%) |
| 70 to 74 Years | 83 (3.2%) | 85 (3.2%) |
| 75 to 79 Years | 47 (1.8%) | 24 (0.9%) |
| 80 to 84 Years | 22 (0.9%) | 58 (2.2%) |
| 85 Years and over | 35 (1.4%) | 48 (1.8%) |
| Total | 2,569 (100.0%) | 2,691 (100.0%) |
Families and Households in Chester
Median Family Size in Chester
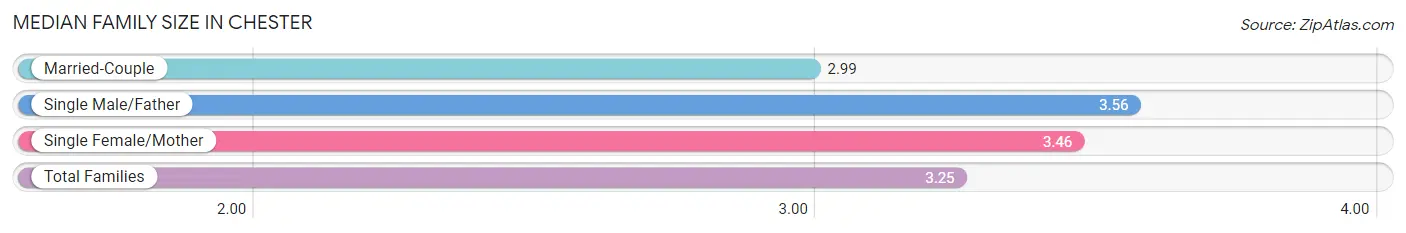
The median family size in Chester is 3.25 persons per family, with single male/father families (142 | 12.3%) accounting for the largest median family size of 3.56 persons per family. On the other hand, married-couple families (550 | 47.8%) represent the smallest median family size with 2.99 persons per family.
| Family Type | # Families | Family Size |
| Married-Couple | 550 (47.8%) | 2.99 |
| Single Male/Father | 142 (12.3%) | 3.56 |
| Single Female/Mother | 458 (39.8%) | 3.46 |
| Total Families | 1,150 (100.0%) | 3.25 |
Median Household Size in Chester
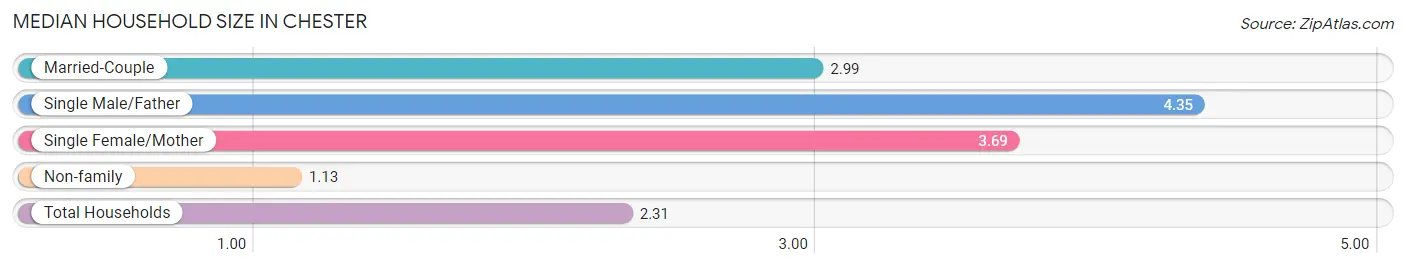
The median household size in Chester is 2.31 persons per household, with single male/father households (142 | 6.3%) accounting for the largest median household size of 4.35 persons per household. non-family households (1,098 | 48.8%) represent the smallest median household size with 1.13 persons per household.
| Household Type | # Households | Household Size |
| Married-Couple | 550 (24.5%) | 2.99 |
| Single Male/Father | 142 (6.3%) | 4.35 |
| Single Female/Mother | 458 (20.4%) | 3.69 |
| Non-family | 1,098 (48.8%) | 1.13 |
| Total Households | 2,248 (100.0%) | 2.31 |
Household Size by Marriage Status in Chester
Out of a total of 2,248 households in Chester, 1,150 (51.2%) are family households, while 1,098 (48.8%) are nonfamily households. The most numerous type of family households are 2-person households, comprising 483, and the most common type of nonfamily households are 1-person households, comprising 974.
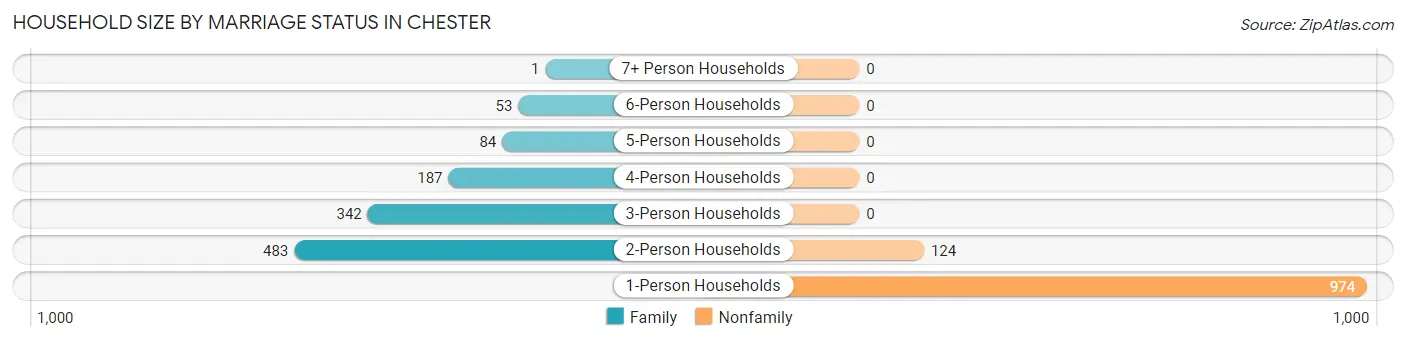
| Household Size | Family Households | Nonfamily Households |
| 1-Person Households | - | 974 (43.3%) |
| 2-Person Households | 483 (21.5%) | 124 (5.5%) |
| 3-Person Households | 342 (15.2%) | 0 (0.0%) |
| 4-Person Households | 187 (8.3%) | 0 (0.0%) |
| 5-Person Households | 84 (3.7%) | 0 (0.0%) |
| 6-Person Households | 53 (2.4%) | 0 (0.0%) |
| 7+ Person Households | 1 (0.0%) | 0 (0.0%) |
| Total | 1,150 (51.2%) | 1,098 (48.8%) |
Female Fertility in Chester
Fertility by Age in Chester
Average fertility rate in Chester is 140.0 births per 1,000 women. Women in the age bracket of 15 to 19 years have the highest fertility rate with 333.0 births per 1,000 women. Women in the age bracket of 20 to 34 years acount for 70.5% of all women with births.
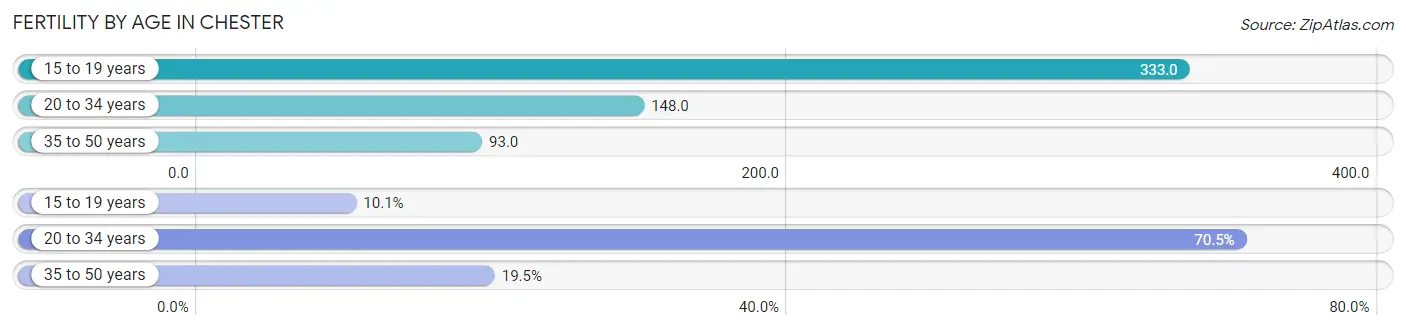
| Age Bracket | Women with Births | Births / 1,000 Women |
| 15 to 19 years | 15 (10.1%) | 333.0 |
| 20 to 34 years | 105 (70.5%) | 148.0 |
| 35 to 50 years | 29 (19.5%) | 93.0 |
| Total | 149 (100.0%) | 140.0 |
Fertility by Age by Marriage Status in Chester
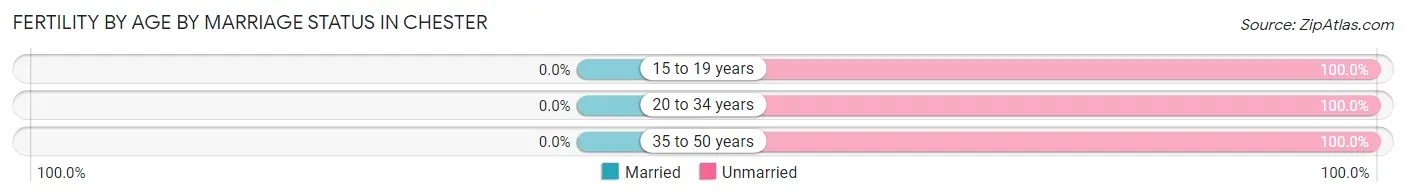
| Age Bracket | Married | Unmarried |
| 15 to 19 years | 0 (0.0%) | 15 (100.0%) |
| 20 to 34 years | 0 (0.0%) | 105 (100.0%) |
| 35 to 50 years | 0 (0.0%) | 29 (100.0%) |
| Total | 0 (0.0%) | 149 (100.0%) |
Fertility by Education in Chester
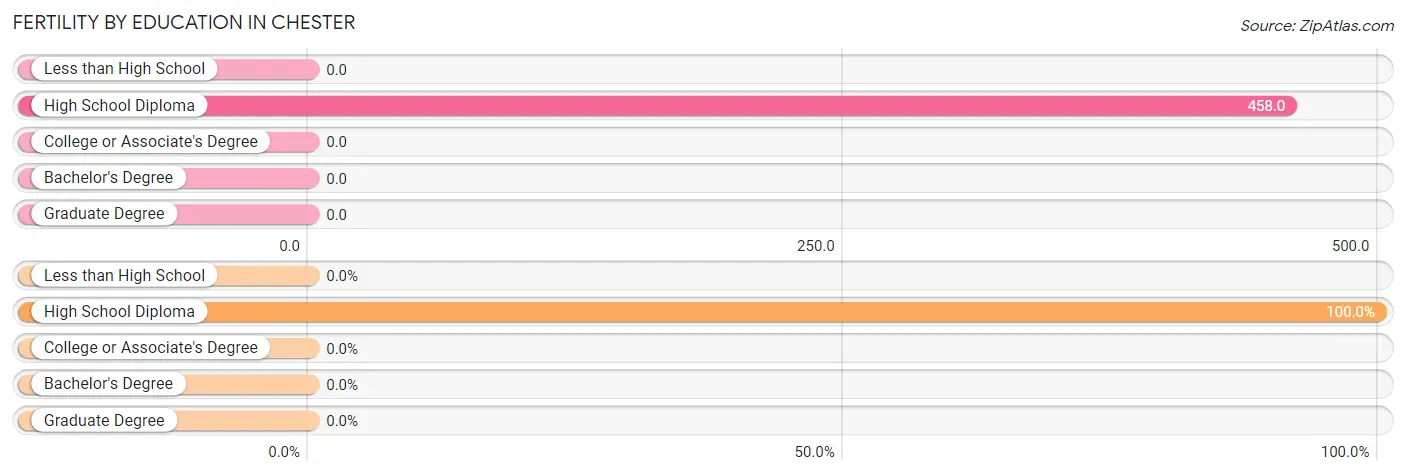
| Educational Attainment | Women with Births | Births / 1,000 Women |
| Less than High School | 0 (0.0%) | 0.0 |
| High School Diploma | 149 (100.0%) | 458.0 |
| College or Associate's Degree | 0 (0.0%) | 0.0 |
| Bachelor's Degree | 0 (0.0%) | 0.0 |
| Graduate Degree | 0 (0.0%) | 0.0 |
| Total | 149 (100.0%) | 140.0 |
Fertility by Education by Marriage Status in Chester
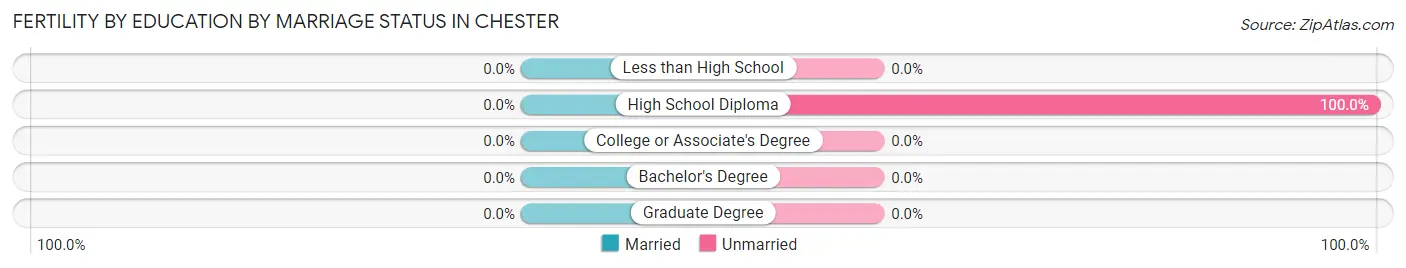
| Educational Attainment | Married | Unmarried |
| Less than High School | 0 (0.0%) | 0 (0.0%) |
| High School Diploma | 0 (0.0%) | 149 (100.0%) |
| College or Associate's Degree | 0 (0.0%) | 0 (0.0%) |
| Bachelor's Degree | 0 (0.0%) | 0 (0.0%) |
| Graduate Degree | 0 (0.0%) | 0 (0.0%) |
| Total | 0 (0.0%) | 149 (100.0%) |
Employment Characteristics in Chester
Employment by Class of Employer in Chester
Among the 2,016 employed individuals in Chester, private company employees (1,571 | 77.9%), state government employees (167 | 8.3%), and local government employees (106 | 5.3%) make up the most common classes of employment.
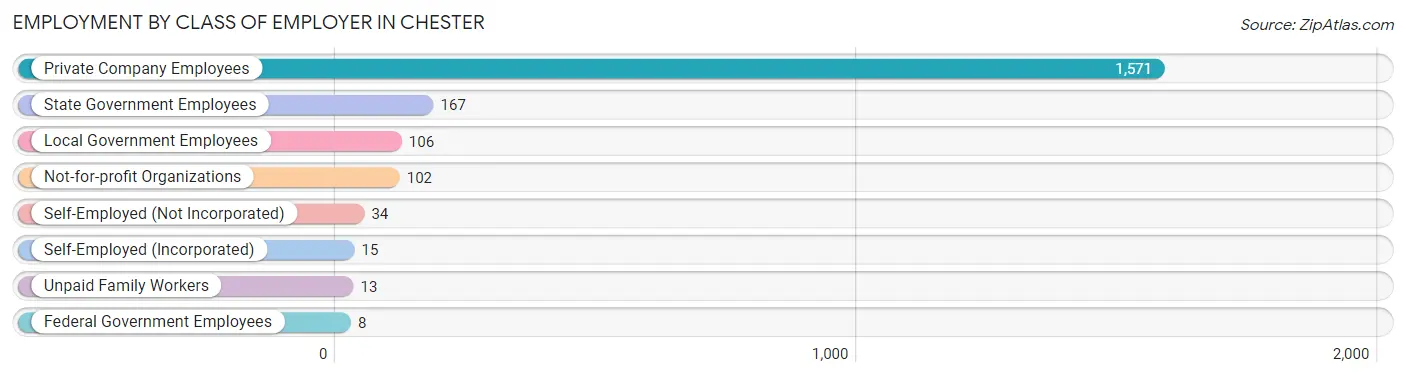
| Employer Class | # Employees | % Employees |
| Private Company Employees | 1,571 | 77.9% |
| Self-Employed (Incorporated) | 15 | 0.7% |
| Self-Employed (Not Incorporated) | 34 | 1.7% |
| Not-for-profit Organizations | 102 | 5.1% |
| Local Government Employees | 106 | 5.3% |
| State Government Employees | 167 | 8.3% |
| Federal Government Employees | 8 | 0.4% |
| Unpaid Family Workers | 13 | 0.6% |
| Total | 2,016 | 100.0% |
Employment Status by Age in Chester
According to the labor force statistics for Chester, out of the total population over 16 years of age (4,133), 56.6% or 2,339 individuals are in the labor force, with 10.2% or 239 of them unemployed. The age group with the highest labor force participation rate is 30 to 34 years, with 94.6% or 476 individuals in the labor force. Within the labor force, the 30 to 34 years age range has the highest percentage of unemployed individuals, with 17.2% or 82 of them being unemployed.
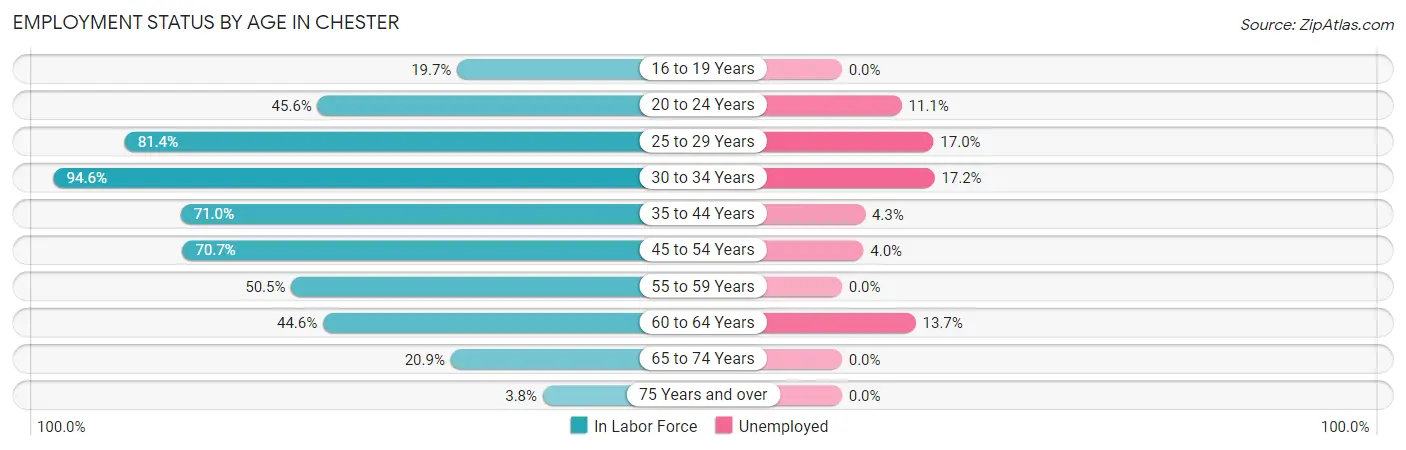
| Age Bracket | In Labor Force | Unemployed |
| 16 to 19 Years | 27 (19.7%) | 0 (0.0%) |
| 20 to 24 Years | 171 (45.6%) | 19 (11.1%) |
| 25 to 29 Years | 513 (81.4%) | 87 (17.0%) |
| 30 to 34 Years | 476 (94.6%) | 82 (17.2%) |
| 35 to 44 Years | 347 (71.0%) | 15 (4.3%) |
| 45 to 54 Years | 326 (70.7%) | 13 (4.0%) |
| 55 to 59 Years | 188 (50.5%) | 0 (0.0%) |
| 60 to 64 Years | 168 (44.6%) | 23 (13.7%) |
| 65 to 74 Years | 116 (20.9%) | 0 (0.0%) |
| 75 Years and over | 9 (3.8%) | 0 (0.0%) |
| Total | 2,339 (56.6%) | 239 (10.2%) |
Employment Status by Educational Attainment in Chester
According to labor force statistics for Chester, 71.3% of individuals (2,019) out of the total population between 25 and 64 years of age (2,832) are in the labor force, with 10.9% or 220 of them being unemployed. The group with the highest labor force participation rate are those with the educational attainment of bachelor's degree or higher, with 84.5% or 278 individuals in the labor force. Within the labor force, individuals with college / associate degree education have the highest percentage of unemployment, with 13.8% or 137 of them being unemployed.
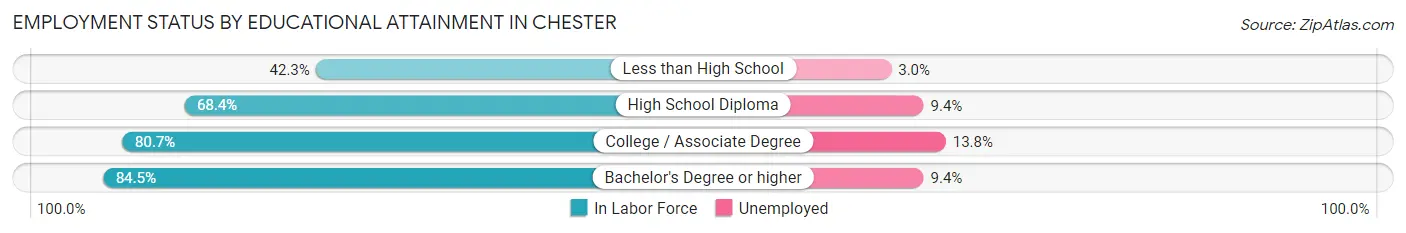
| Educational Attainment | In Labor Force | Unemployed |
| Less than High School | 201 (42.3%) | 14 (3.0%) |
| High School Diploma | 544 (68.4%) | 75 (9.4%) |
| College / Associate Degree | 995 (80.7%) | 170 (13.8%) |
| Bachelor's Degree or higher | 278 (84.5%) | 31 (9.4%) |
| Total | 2,019 (71.3%) | 309 (10.9%) |
Employment Occupations by Sex in Chester
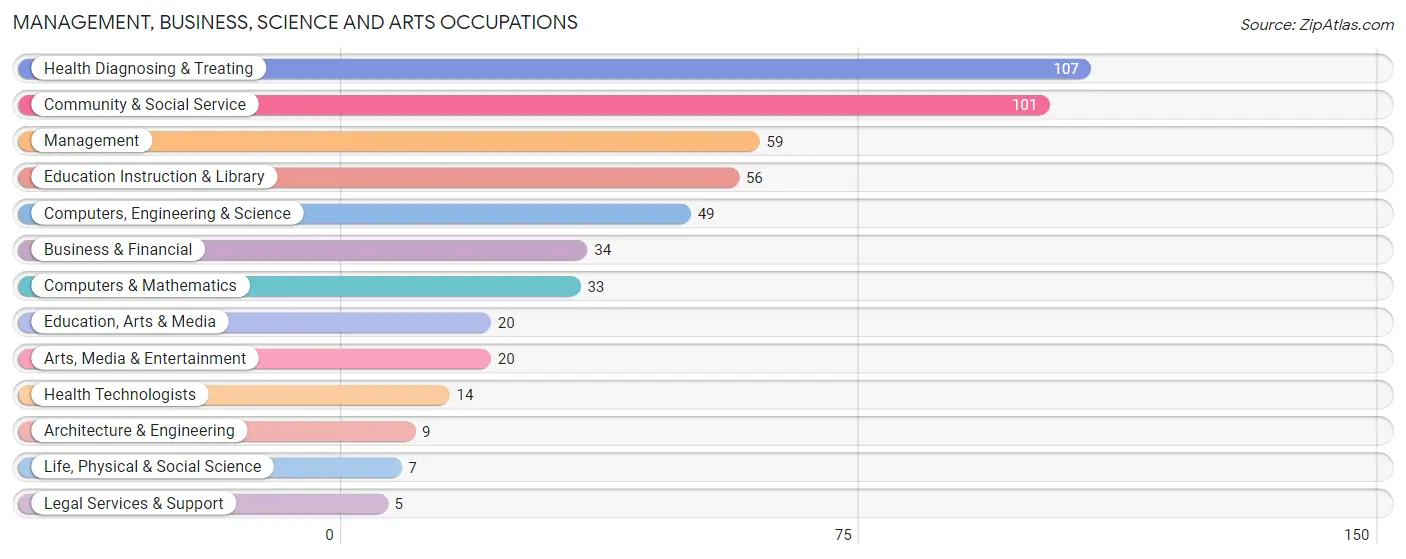
Management, Business, Science and Arts Occupations
The most common Management, Business, Science and Arts occupations in Chester are Health Diagnosing & Treating (107 | 5.1%), Community & Social Service (101 | 4.8%), Management (59 | 2.8%), Education Instruction & Library (56 | 2.7%), and Computers, Engineering & Science (49 | 2.3%).
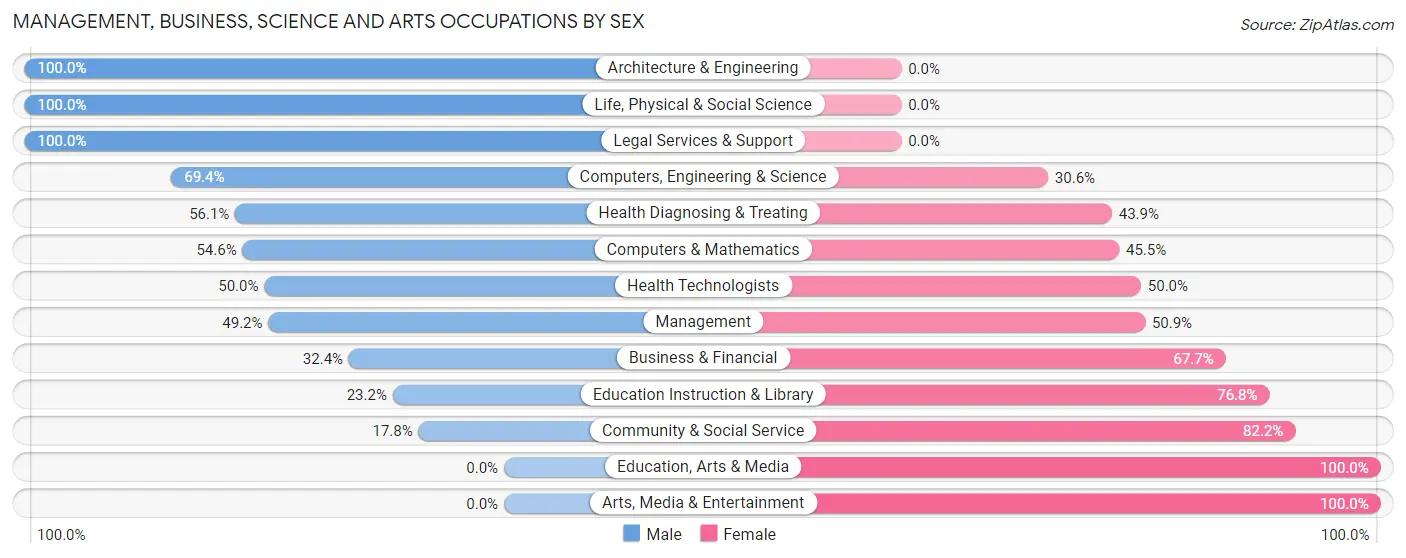
Management, Business, Science and Arts Occupations by Sex
Within the Management, Business, Science and Arts occupations in Chester, the most male-oriented occupations are Architecture & Engineering (100.0%), Life, Physical & Social Science (100.0%), and Legal Services & Support (100.0%), while the most female-oriented occupations are Education, Arts & Media (100.0%), Arts, Media & Entertainment (100.0%), and Community & Social Service (82.2%).
| Occupation | Male | Female |
| Management | 29 (49.1%) | 30 (50.8%) |
| Business & Financial | 11 (32.4%) | 23 (67.6%) |
| Computers, Engineering & Science | 34 (69.4%) | 15 (30.6%) |
| Computers & Mathematics | 18 (54.5%) | 15 (45.5%) |
| Architecture & Engineering | 9 (100.0%) | 0 (0.0%) |
| Life, Physical & Social Science | 7 (100.0%) | 0 (0.0%) |
| Community & Social Service | 18 (17.8%) | 83 (82.2%) |
| Education, Arts & Media | 0 (0.0%) | 20 (100.0%) |
| Legal Services & Support | 5 (100.0%) | 0 (0.0%) |
| Education Instruction & Library | 13 (23.2%) | 43 (76.8%) |
| Arts, Media & Entertainment | 0 (0.0%) | 20 (100.0%) |
| Health Diagnosing & Treating | 60 (56.1%) | 47 (43.9%) |
| Health Technologists | 7 (50.0%) | 7 (50.0%) |
| Total (Category) | 152 (43.4%) | 198 (56.6%) |
| Total (Overall) | 933 (44.4%) | 1,169 (55.6%) |
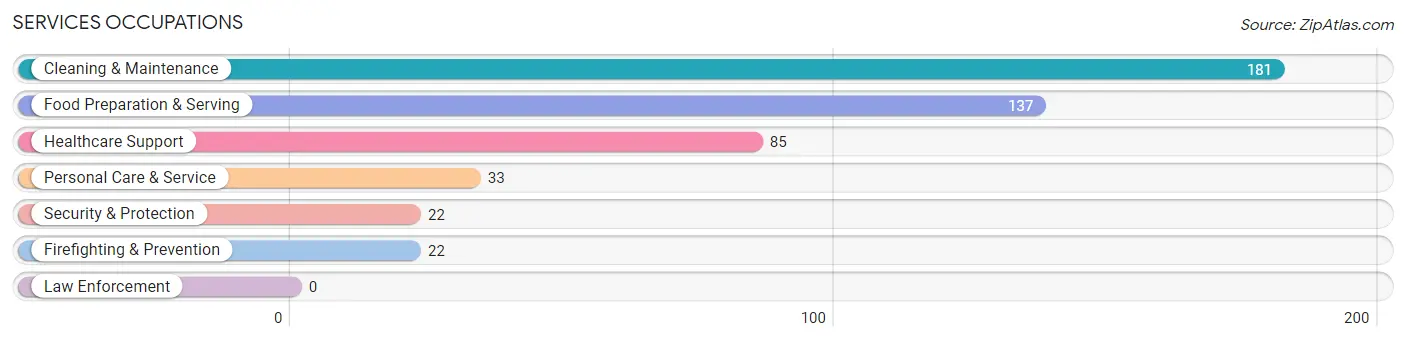
Services Occupations
The most common Services occupations in Chester are Cleaning & Maintenance (181 | 8.6%), Food Preparation & Serving (137 | 6.5%), Healthcare Support (85 | 4.0%), Personal Care & Service (33 | 1.6%), and Security & Protection (22 | 1.1%).
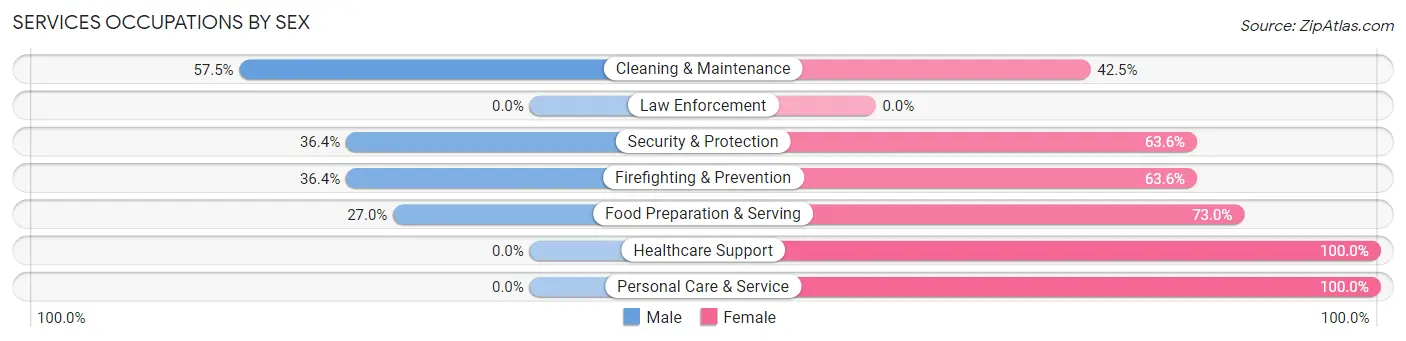
Services Occupations by Sex
Within the Services occupations in Chester, the most male-oriented occupations are Cleaning & Maintenance (57.5%), Security & Protection (36.4%), and Firefighting & Prevention (36.4%), while the most female-oriented occupations are Healthcare Support (100.0%), Personal Care & Service (100.0%), and Food Preparation & Serving (73.0%).
| Occupation | Male | Female |
| Healthcare Support | 0 (0.0%) | 85 (100.0%) |
| Security & Protection | 8 (36.4%) | 14 (63.6%) |
| Firefighting & Prevention | 8 (36.4%) | 14 (63.6%) |
| Law Enforcement | 0 (0.0%) | 0 (0.0%) |
| Food Preparation & Serving | 37 (27.0%) | 100 (73.0%) |
| Cleaning & Maintenance | 104 (57.5%) | 77 (42.5%) |
| Personal Care & Service | 0 (0.0%) | 33 (100.0%) |
| Total (Category) | 149 (32.5%) | 309 (67.5%) |
| Total (Overall) | 933 (44.4%) | 1,169 (55.6%) |
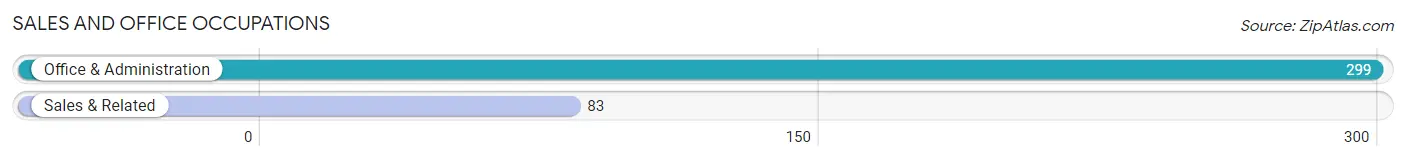
Sales and Office Occupations
The most common Sales and Office occupations in Chester are Office & Administration (299 | 14.2%), and Sales & Related (83 | 4.0%).
Sales and Office Occupations by Sex
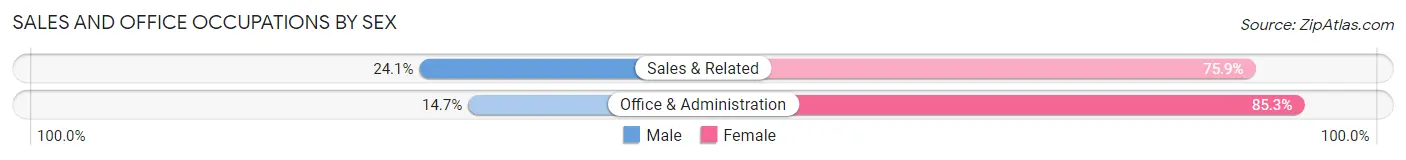
| Occupation | Male | Female |
| Sales & Related | 20 (24.1%) | 63 (75.9%) |
| Office & Administration | 44 (14.7%) | 255 (85.3%) |
| Total (Category) | 64 (16.8%) | 318 (83.3%) |
| Total (Overall) | 933 (44.4%) | 1,169 (55.6%) |
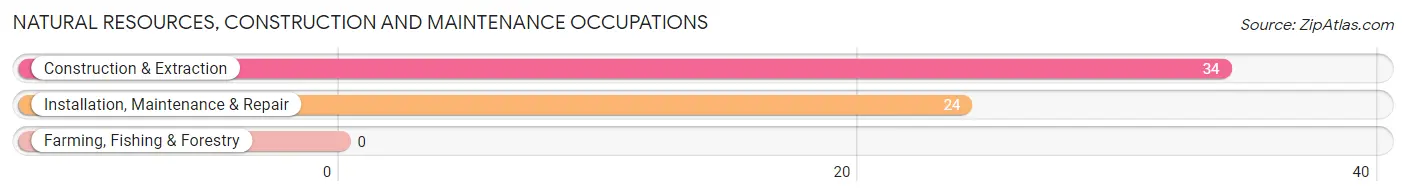
Natural Resources, Construction and Maintenance Occupations
The most common Natural Resources, Construction and Maintenance occupations in Chester are Construction & Extraction (34 | 1.6%), and Installation, Maintenance & Repair (24 | 1.1%).
Natural Resources, Construction and Maintenance Occupations by Sex
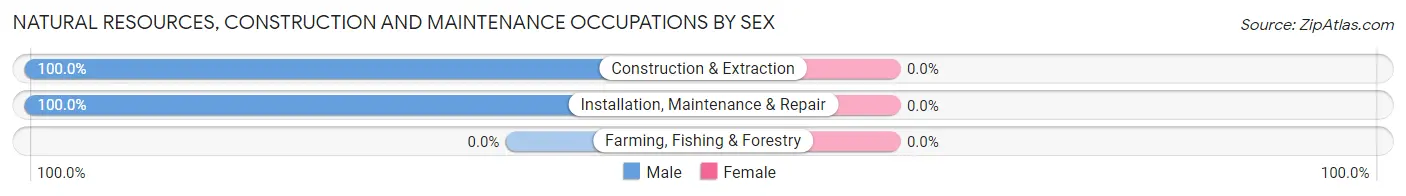
| Occupation | Male | Female |
| Farming, Fishing & Forestry | 0 (0.0%) | 0 (0.0%) |
| Construction & Extraction | 34 (100.0%) | 0 (0.0%) |
| Installation, Maintenance & Repair | 24 (100.0%) | 0 (0.0%) |
| Total (Category) | 58 (100.0%) | 0 (0.0%) |
| Total (Overall) | 933 (44.4%) | 1,169 (55.6%) |
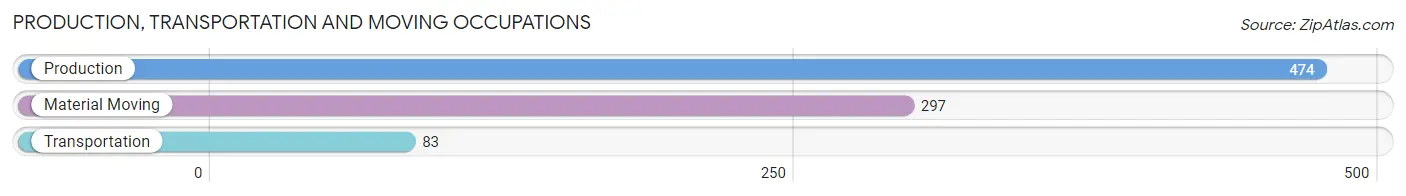
Production, Transportation and Moving Occupations
The most common Production, Transportation and Moving occupations in Chester are Production (474 | 22.6%), Material Moving (297 | 14.1%), and Transportation (83 | 4.0%).
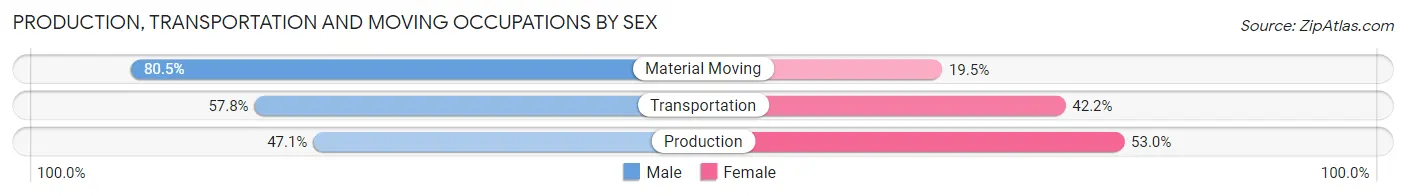
Production, Transportation and Moving Occupations by Sex
| Occupation | Male | Female |
| Production | 223 (47.0%) | 251 (52.9%) |
| Transportation | 48 (57.8%) | 35 (42.2%) |
| Material Moving | 239 (80.5%) | 58 (19.5%) |
| Total (Category) | 510 (59.7%) | 344 (40.3%) |
| Total (Overall) | 933 (44.4%) | 1,169 (55.6%) |
Employment Industries by Sex in Chester
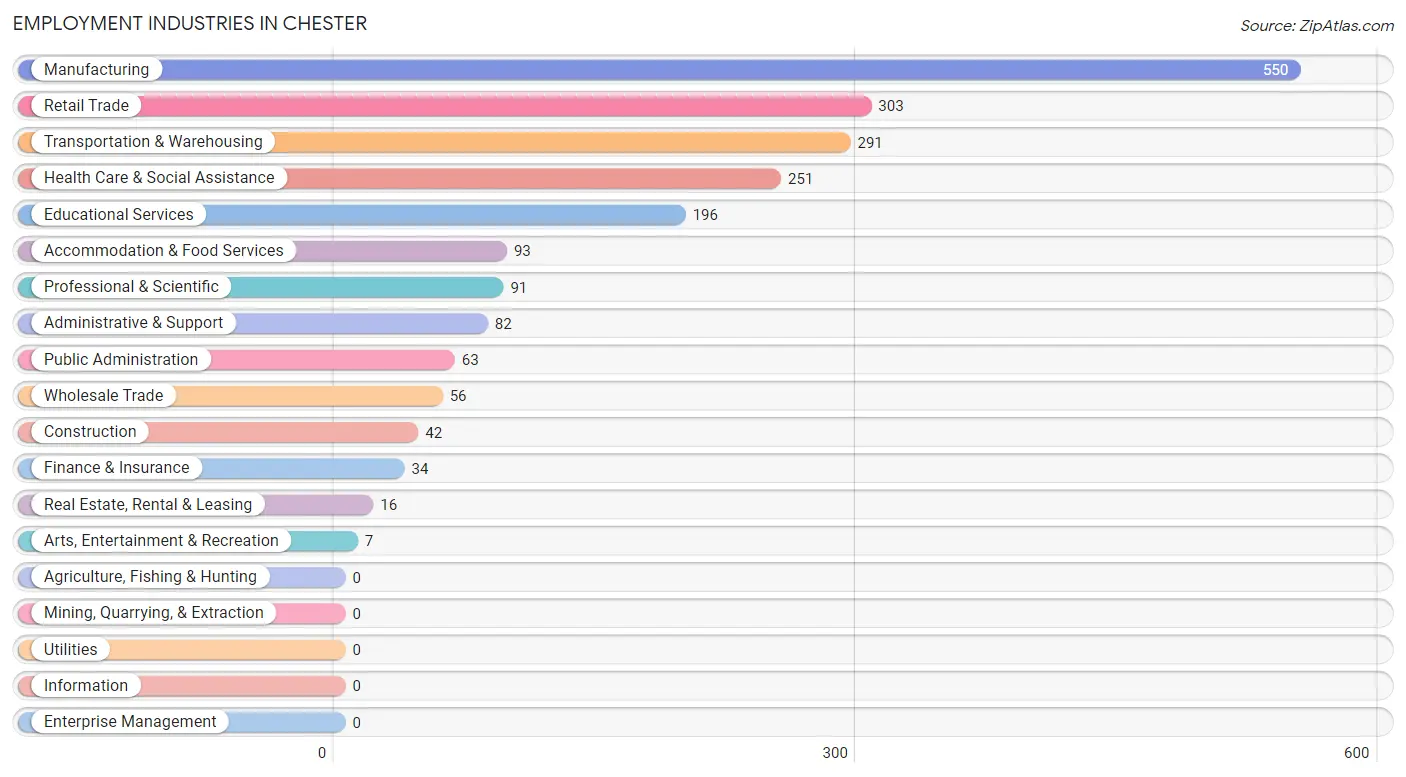
Employment Industries in Chester
The major employment industries in Chester include Manufacturing (550 | 26.2%), Retail Trade (303 | 14.4%), Transportation & Warehousing (291 | 13.8%), Health Care & Social Assistance (251 | 11.9%), and Educational Services (196 | 9.3%).
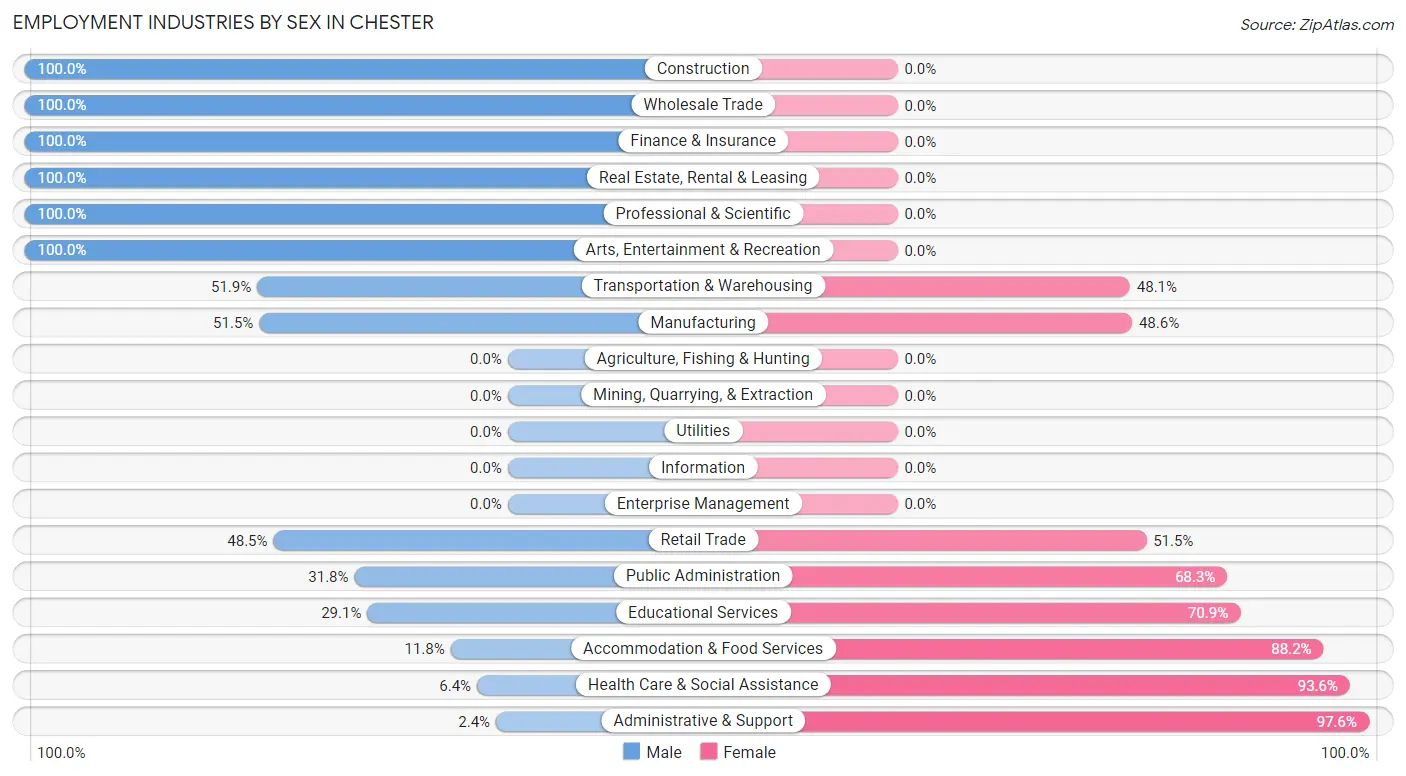
Employment Industries by Sex in Chester
The Chester industries that see more men than women are Construction (100.0%), Wholesale Trade (100.0%), and Finance & Insurance (100.0%), whereas the industries that tend to have a higher number of women are Administrative & Support (97.6%), Health Care & Social Assistance (93.6%), and Accommodation & Food Services (88.2%).
| Industry | Male | Female |
| Agriculture, Fishing & Hunting | 0 (0.0%) | 0 (0.0%) |
| Mining, Quarrying, & Extraction | 0 (0.0%) | 0 (0.0%) |
| Construction | 42 (100.0%) | 0 (0.0%) |
| Manufacturing | 283 (51.4%) | 267 (48.5%) |
| Wholesale Trade | 56 (100.0%) | 0 (0.0%) |
| Retail Trade | 147 (48.5%) | 156 (51.5%) |
| Transportation & Warehousing | 151 (51.9%) | 140 (48.1%) |
| Utilities | 0 (0.0%) | 0 (0.0%) |
| Information | 0 (0.0%) | 0 (0.0%) |
| Finance & Insurance | 34 (100.0%) | 0 (0.0%) |
| Real Estate, Rental & Leasing | 16 (100.0%) | 0 (0.0%) |
| Professional & Scientific | 91 (100.0%) | 0 (0.0%) |
| Enterprise Management | 0 (0.0%) | 0 (0.0%) |
| Administrative & Support | 2 (2.4%) | 80 (97.6%) |
| Educational Services | 57 (29.1%) | 139 (70.9%) |
| Health Care & Social Assistance | 16 (6.4%) | 235 (93.6%) |
| Arts, Entertainment & Recreation | 7 (100.0%) | 0 (0.0%) |
| Accommodation & Food Services | 11 (11.8%) | 82 (88.2%) |
| Public Administration | 20 (31.8%) | 43 (68.2%) |
| Total | 933 (44.4%) | 1,169 (55.6%) |
Education in Chester
School Enrollment in Chester
The most common levels of schooling among the 790 students in Chester are kindergarten (234 | 29.6%), middle school (188 | 23.8%), and high school (173 | 21.9%).
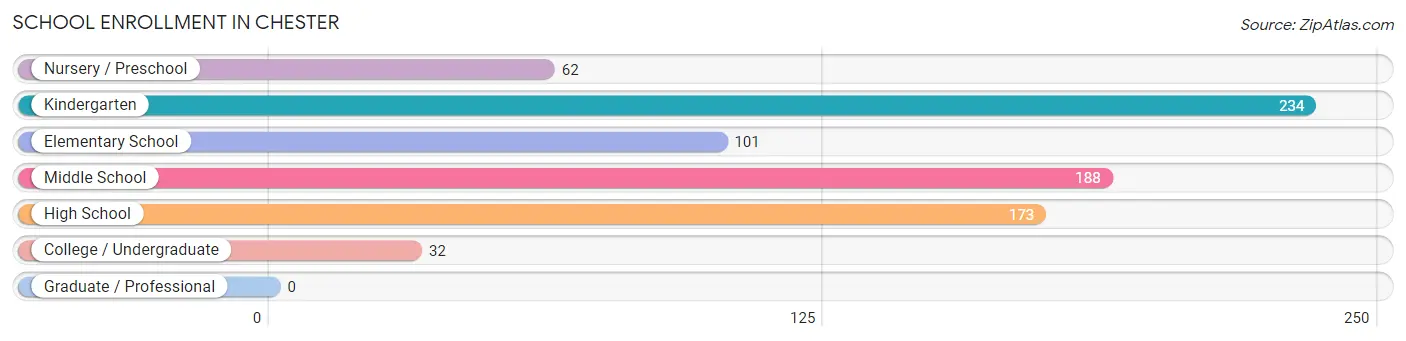
| School Level | # Students | % Students |
| Nursery / Preschool | 62 | 7.9% |
| Kindergarten | 234 | 29.6% |
| Elementary School | 101 | 12.8% |
| Middle School | 188 | 23.8% |
| High School | 173 | 21.9% |
| College / Undergraduate | 32 | 4.1% |
| Graduate / Professional | 0 | 0.0% |
| Total | 790 | 100.0% |
School Enrollment by Age by Funding Source in Chester
Out of a total of 790 students who are enrolled in schools in Chester, 33 (4.2%) attend a private institution, while the remaining 757 (95.8%) are enrolled in public schools. The age group of 15 to 17 year olds has the highest likelihood of being enrolled in private schools, with 22 (18.6% in the age bracket) enrolled. Conversely, the age group of 10 to 14 year olds has the lowest likelihood of being enrolled in a private school, with 207 (100.0% in the age bracket) attending a public institution.
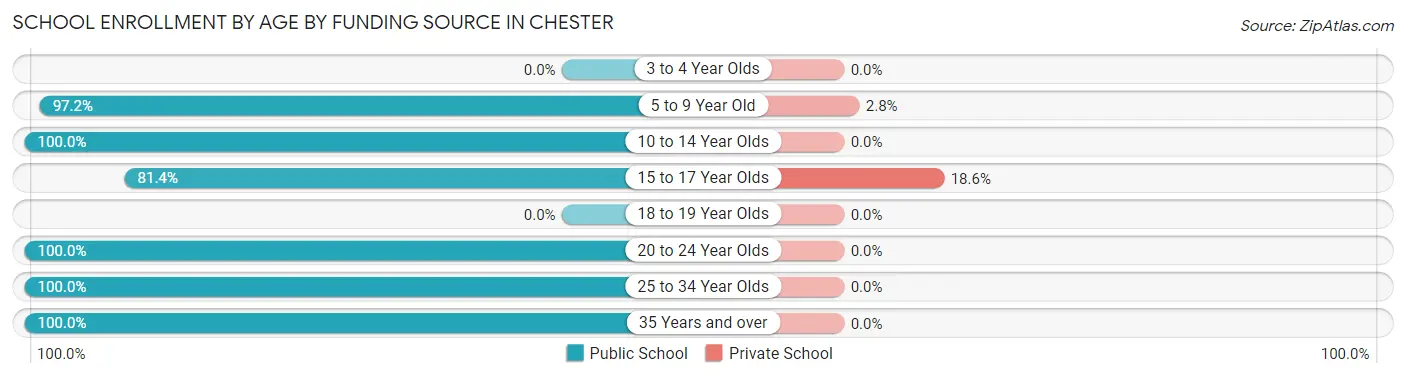
| Age Bracket | Public School | Private School |
| 3 to 4 Year Olds | 0 (0.0%) | 0 (0.0%) |
| 5 to 9 Year Old | 379 (97.2%) | 11 (2.8%) |
| 10 to 14 Year Olds | 207 (100.0%) | 0 (0.0%) |
| 15 to 17 Year Olds | 96 (81.4%) | 22 (18.6%) |
| 18 to 19 Year Olds | 0 (0.0%) | 0 (0.0%) |
| 20 to 24 Year Olds | 43 (100.0%) | 0 (0.0%) |
| 25 to 34 Year Olds | 25 (100.0%) | 0 (0.0%) |
| 35 Years and over | 7 (100.0%) | 0 (0.0%) |
| Total | 757 (95.8%) | 33 (4.2%) |
Educational Attainment by Field of Study in Chester
Business (92 | 22.1%), science & technology (91 | 21.8%), education (76 | 18.2%), arts & humanities (45 | 10.8%), and computers & mathematics (30 | 7.2%) are the most common fields of study among 417 individuals in Chester who have obtained a bachelor's degree or higher.
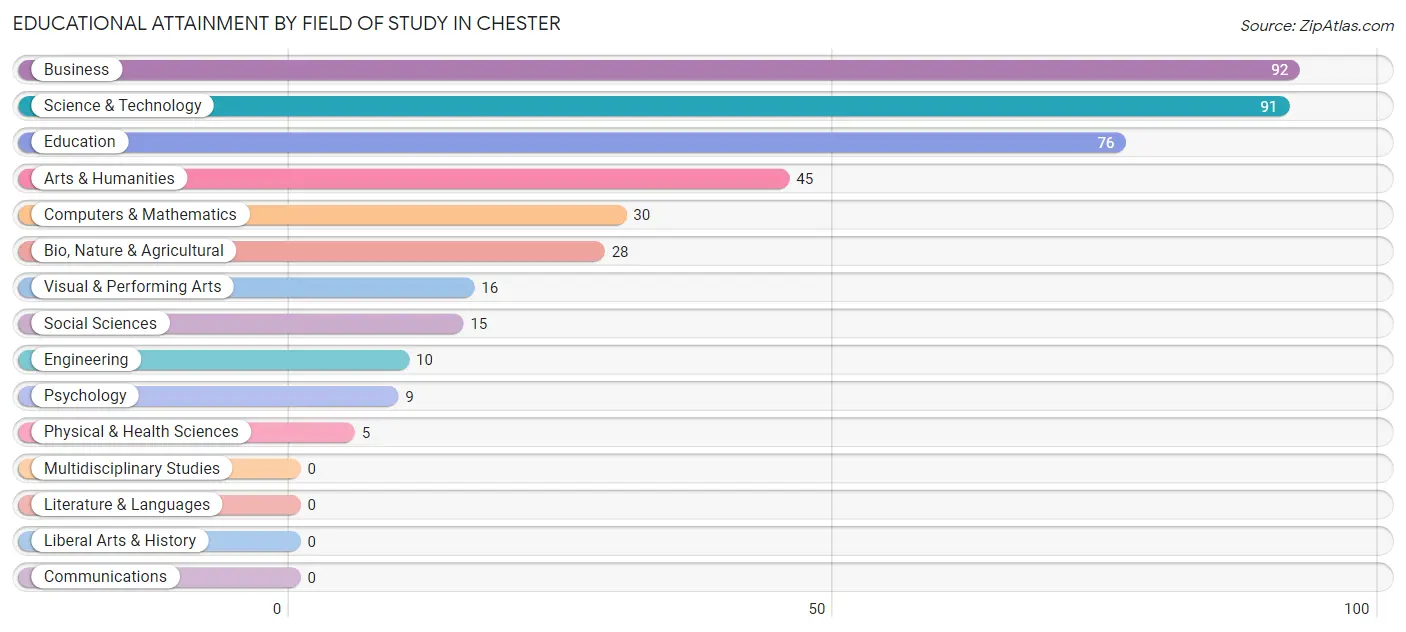
| Field of Study | # Graduates | % Graduates |
| Computers & Mathematics | 30 | 7.2% |
| Bio, Nature & Agricultural | 28 | 6.7% |
| Physical & Health Sciences | 5 | 1.2% |
| Psychology | 9 | 2.2% |
| Social Sciences | 15 | 3.6% |
| Engineering | 10 | 2.4% |
| Multidisciplinary Studies | 0 | 0.0% |
| Science & Technology | 91 | 21.8% |
| Business | 92 | 22.1% |
| Education | 76 | 18.2% |
| Literature & Languages | 0 | 0.0% |
| Liberal Arts & History | 0 | 0.0% |
| Visual & Performing Arts | 16 | 3.8% |
| Communications | 0 | 0.0% |
| Arts & Humanities | 45 | 10.8% |
| Total | 417 | 100.0% |
Transportation & Commute in Chester
Vehicle Availability by Sex in Chester
The most prevalent vehicle ownership categories in Chester are males with 1 vehicle (363, accounting for 40.6%) and females with 1 vehicle (457, making up 32.4%).
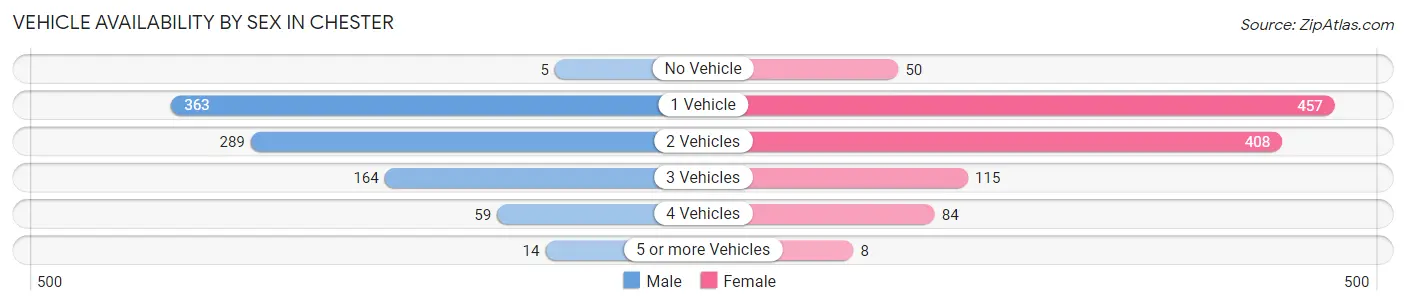
| Vehicles Available | Male | Female |
| No Vehicle | 5 (0.6%) | 50 (4.5%) |
| 1 Vehicle | 363 (40.6%) | 457 (40.7%) |
| 2 Vehicles | 289 (32.3%) | 408 (36.4%) |
| 3 Vehicles | 164 (18.3%) | 115 (10.2%) |
| 4 Vehicles | 59 (6.6%) | 84 (7.5%) |
| 5 or more Vehicles | 14 (1.6%) | 8 (0.7%) |
| Total | 894 (100.0%) | 1,122 (100.0%) |
Commute Time in Chester
The most frequently occuring commute durations in Chester are 45 to 59 minutes (352 commuters, 18.1%), 30 to 34 minutes (320 commuters, 16.4%), and 10 to 14 minutes (235 commuters, 12.1%).
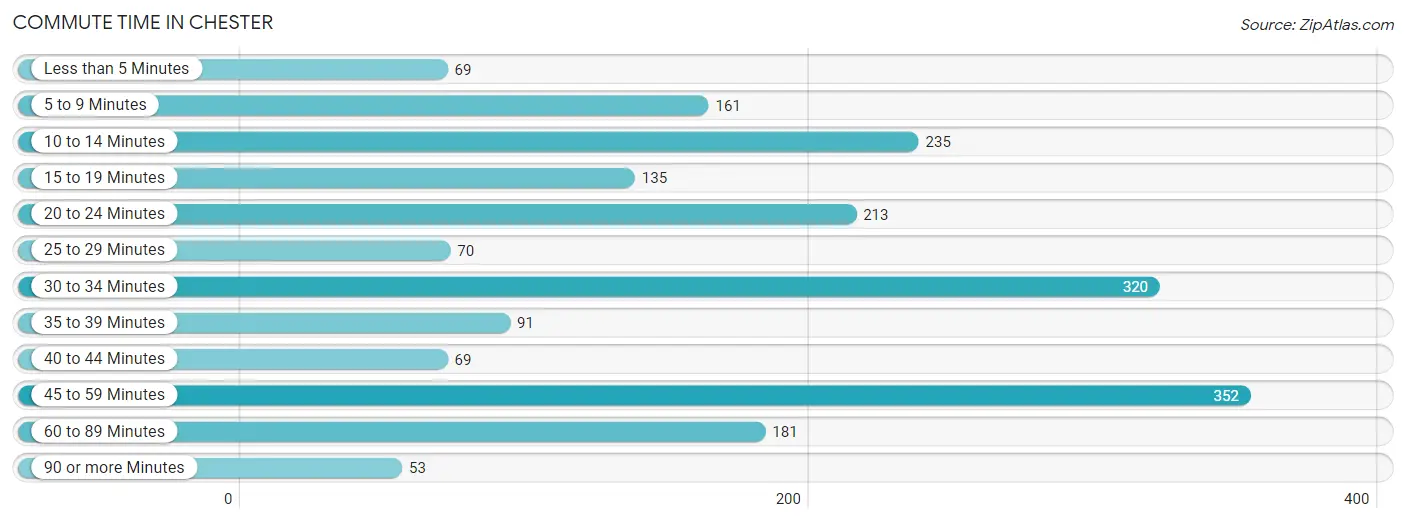
| Commute Time | # Commuters | % Commuters |
| Less than 5 Minutes | 69 | 3.5% |
| 5 to 9 Minutes | 161 | 8.3% |
| 10 to 14 Minutes | 235 | 12.1% |
| 15 to 19 Minutes | 135 | 6.9% |
| 20 to 24 Minutes | 213 | 10.9% |
| 25 to 29 Minutes | 70 | 3.6% |
| 30 to 34 Minutes | 320 | 16.4% |
| 35 to 39 Minutes | 91 | 4.7% |
| 40 to 44 Minutes | 69 | 3.5% |
| 45 to 59 Minutes | 352 | 18.1% |
| 60 to 89 Minutes | 181 | 9.3% |
| 90 or more Minutes | 53 | 2.7% |
Commute Time by Sex in Chester
The most common commute times in Chester are 45 to 59 minutes (257 commuters, 28.9%) for males and 30 to 34 minutes (278 commuters, 26.2%) for females.
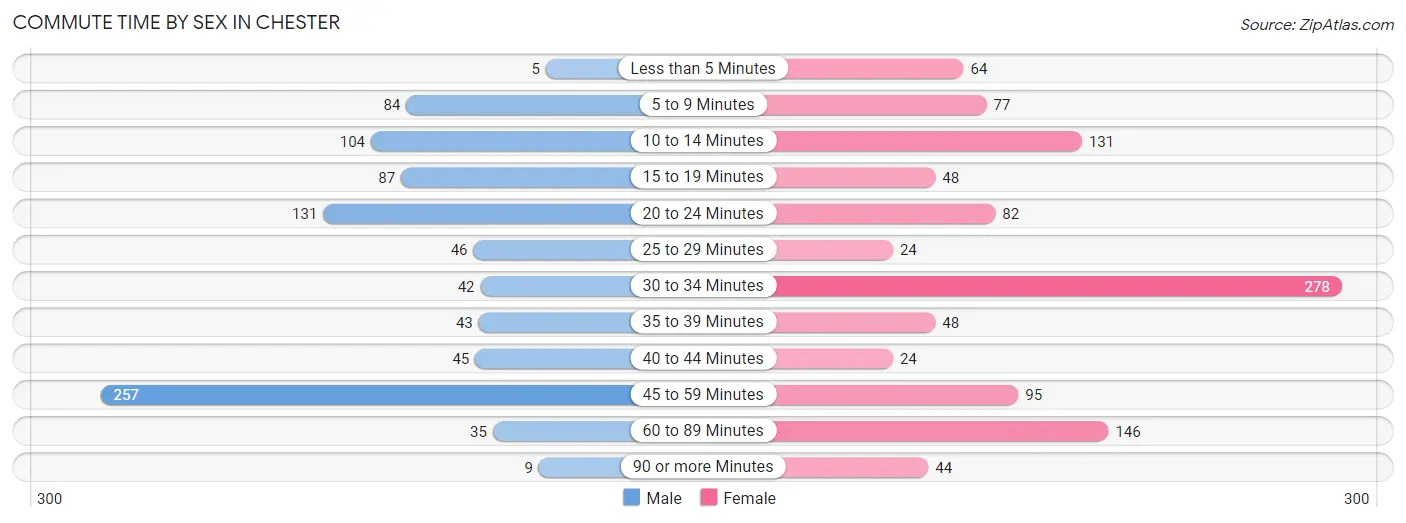
| Commute Time | Male | Female |
| Less than 5 Minutes | 5 (0.6%) | 64 (6.0%) |
| 5 to 9 Minutes | 84 (9.5%) | 77 (7.3%) |
| 10 to 14 Minutes | 104 (11.7%) | 131 (12.3%) |
| 15 to 19 Minutes | 87 (9.8%) | 48 (4.5%) |
| 20 to 24 Minutes | 131 (14.7%) | 82 (7.7%) |
| 25 to 29 Minutes | 46 (5.2%) | 24 (2.3%) |
| 30 to 34 Minutes | 42 (4.7%) | 278 (26.2%) |
| 35 to 39 Minutes | 43 (4.8%) | 48 (4.5%) |
| 40 to 44 Minutes | 45 (5.1%) | 24 (2.3%) |
| 45 to 59 Minutes | 257 (28.9%) | 95 (8.9%) |
| 60 to 89 Minutes | 35 (3.9%) | 146 (13.8%) |
| 90 or more Minutes | 9 (1.0%) | 44 (4.2%) |
Time of Departure to Work by Sex in Chester
The most frequent times of departure to work in Chester are 4:00 PM to 11:59 PM (266, 29.9%) for males and 7:00 AM to 7:29 AM (221, 20.8%) for females.
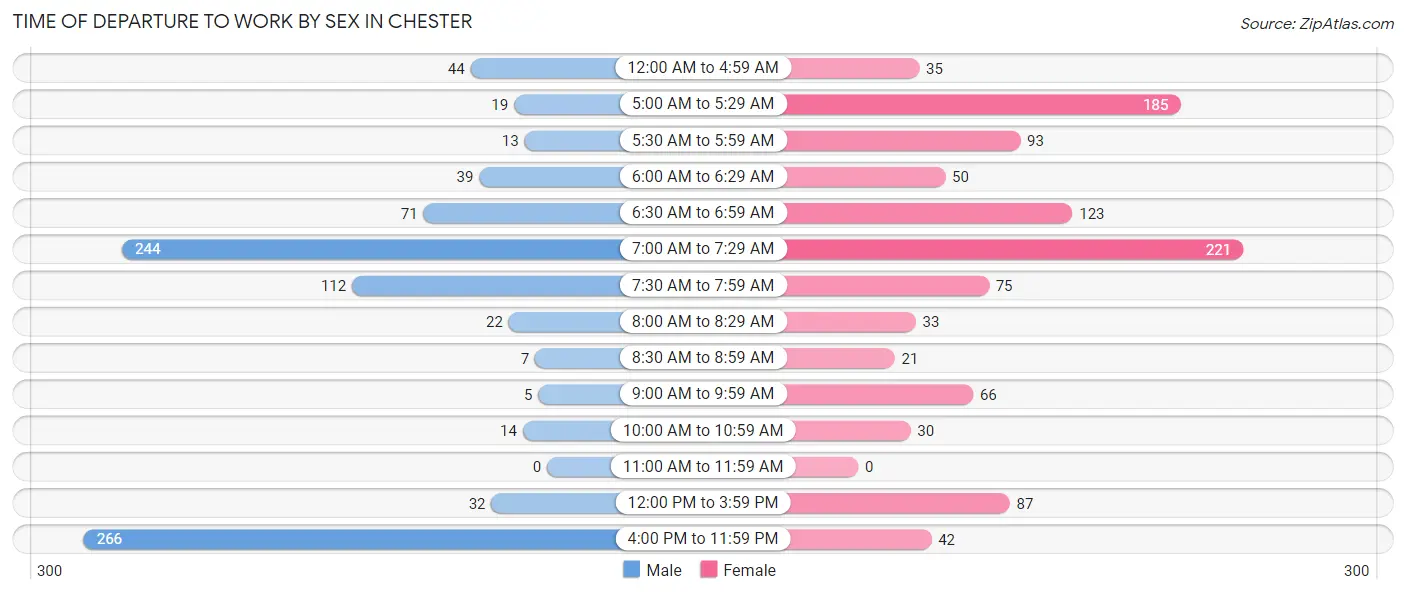
| Time of Departure | Male | Female |
| 12:00 AM to 4:59 AM | 44 (5.0%) | 35 (3.3%) |
| 5:00 AM to 5:29 AM | 19 (2.1%) | 185 (17.4%) |
| 5:30 AM to 5:59 AM | 13 (1.5%) | 93 (8.8%) |
| 6:00 AM to 6:29 AM | 39 (4.4%) | 50 (4.7%) |
| 6:30 AM to 6:59 AM | 71 (8.0%) | 123 (11.6%) |
| 7:00 AM to 7:29 AM | 244 (27.5%) | 221 (20.8%) |
| 7:30 AM to 7:59 AM | 112 (12.6%) | 75 (7.1%) |
| 8:00 AM to 8:29 AM | 22 (2.5%) | 33 (3.1%) |
| 8:30 AM to 8:59 AM | 7 (0.8%) | 21 (2.0%) |
| 9:00 AM to 9:59 AM | 5 (0.6%) | 66 (6.2%) |
| 10:00 AM to 10:59 AM | 14 (1.6%) | 30 (2.8%) |
| 11:00 AM to 11:59 AM | 0 (0.0%) | 0 (0.0%) |
| 12:00 PM to 3:59 PM | 32 (3.6%) | 87 (8.2%) |
| 4:00 PM to 11:59 PM | 266 (29.9%) | 42 (4.0%) |
| Total | 888 (100.0%) | 1,061 (100.0%) |
Housing Occupancy in Chester
Occupancy by Ownership in Chester
Of the total 2,248 dwellings in Chester, owner-occupied units account for 1,080 (48.0%), while renter-occupied units make up 1,168 (52.0%).
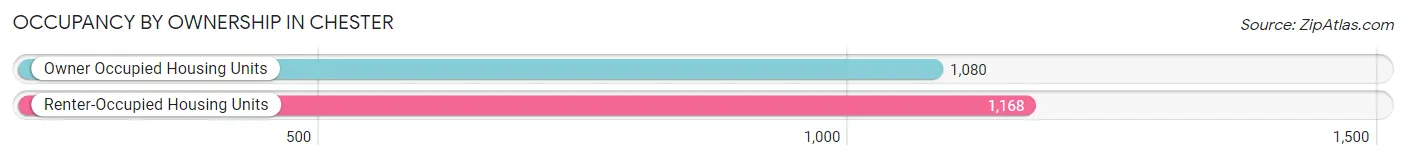
| Occupancy | # Housing Units | % Housing Units |
| Owner Occupied Housing Units | 1,080 | 48.0% |
| Renter-Occupied Housing Units | 1,168 | 52.0% |
| Total Occupied Housing Units | 2,248 | 100.0% |
Occupancy by Household Size in Chester
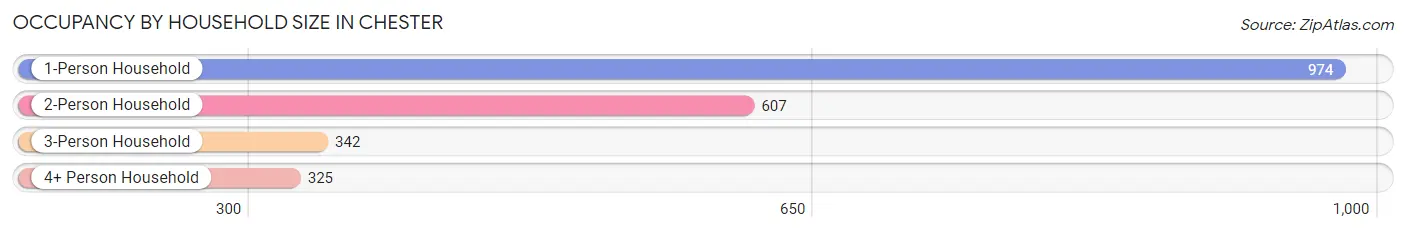
| Household Size | # Housing Units | % Housing Units |
| 1-Person Household | 974 | 43.3% |
| 2-Person Household | 607 | 27.0% |
| 3-Person Household | 342 | 15.2% |
| 4+ Person Household | 325 | 14.5% |
| Total Housing Units | 2,248 | 100.0% |
Occupancy by Ownership by Household Size in Chester
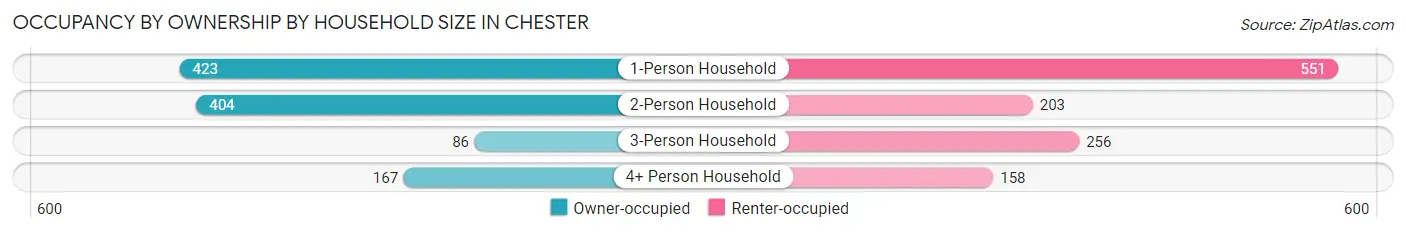
| Household Size | Owner-occupied | Renter-occupied |
| 1-Person Household | 423 (43.4%) | 551 (56.6%) |
| 2-Person Household | 404 (66.6%) | 203 (33.4%) |
| 3-Person Household | 86 (25.2%) | 256 (74.9%) |
| 4+ Person Household | 167 (51.4%) | 158 (48.6%) |
| Total Housing Units | 1,080 (48.0%) | 1,168 (52.0%) |
Occupancy by Educational Attainment in Chester
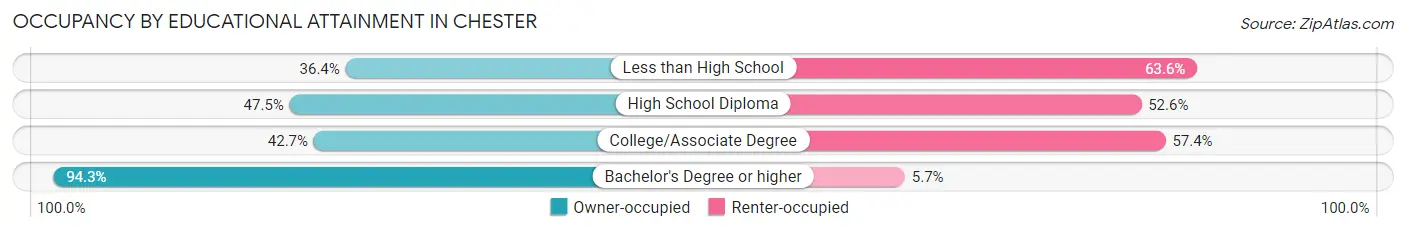
| Household Size | Owner-occupied | Renter-occupied |
| Less than High School | 168 (36.4%) | 294 (63.6%) |
| High School Diploma | 316 (47.4%) | 350 (52.5%) |
| College/Associate Degree | 380 (42.6%) | 511 (57.4%) |
| Bachelor's Degree or higher | 216 (94.3%) | 13 (5.7%) |
Occupancy by Age of Householder in Chester
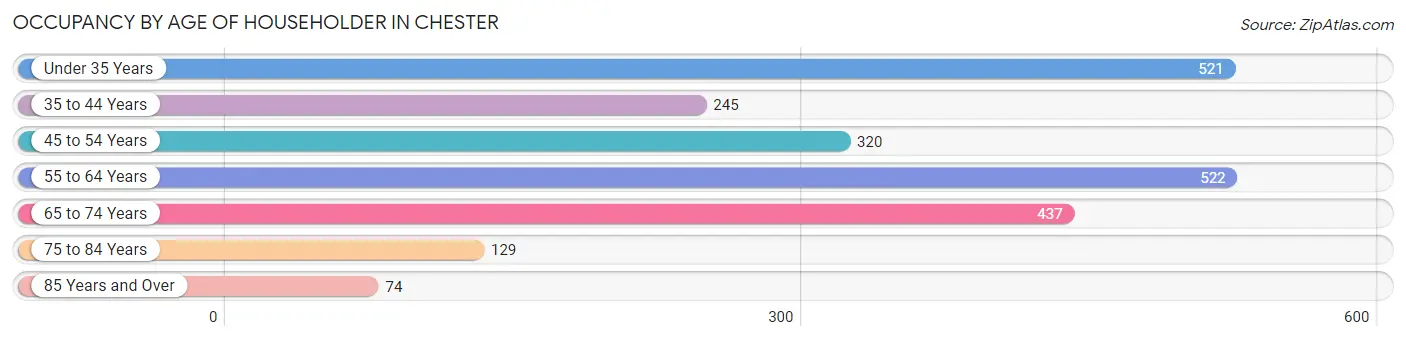
| Age Bracket | # Households | % Households |
| Under 35 Years | 521 | 23.2% |
| 35 to 44 Years | 245 | 10.9% |
| 45 to 54 Years | 320 | 14.2% |
| 55 to 64 Years | 522 | 23.2% |
| 65 to 74 Years | 437 | 19.4% |
| 75 to 84 Years | 129 | 5.7% |
| 85 Years and Over | 74 | 3.3% |
| Total | 2,248 | 100.0% |
Housing Finances in Chester
Median Income by Occupancy in Chester
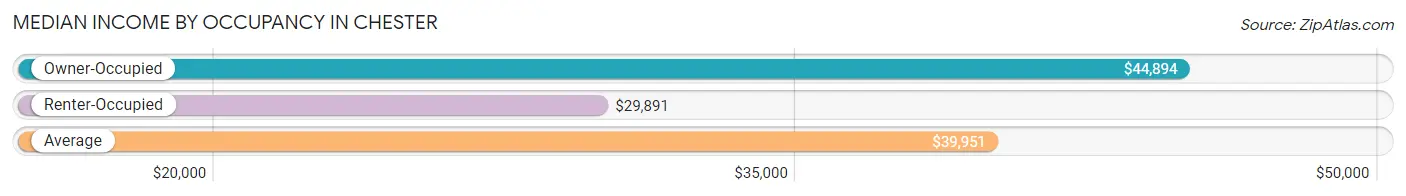
| Occupancy Type | # Households | Median Income |
| Owner-Occupied | 1,080 (48.0%) | $44,894 |
| Renter-Occupied | 1,168 (52.0%) | $29,891 |
| Average | 2,248 (100.0%) | $39,951 |
Occupancy by Householder Income Bracket in Chester
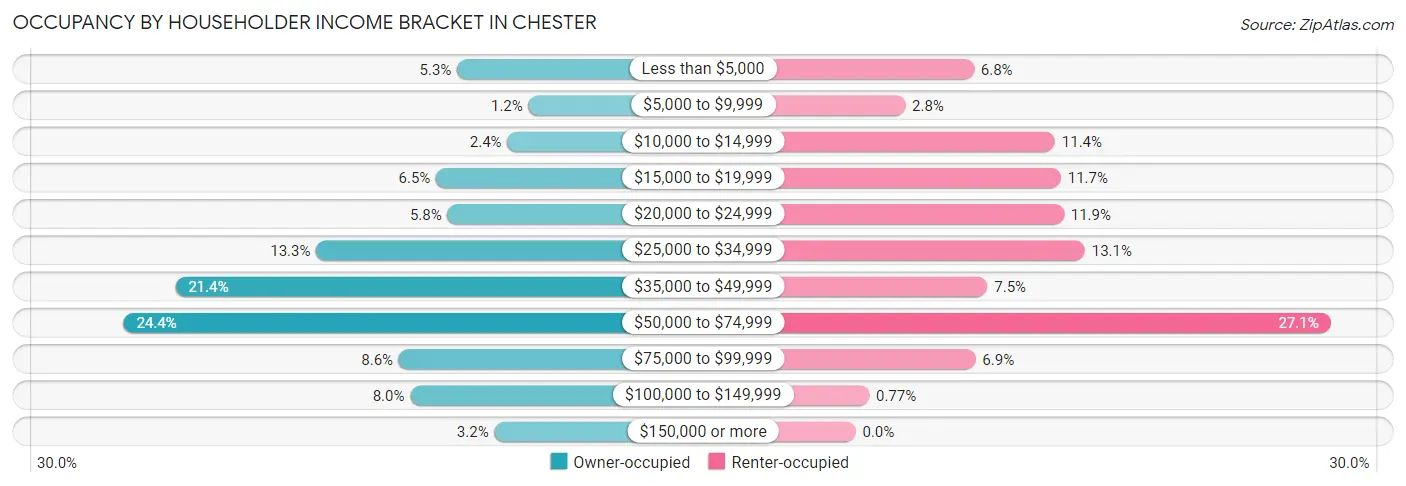
| Income Bracket | Owner-occupied | Renter-occupied |
| Less than $5,000 | 57 (5.3%) | 79 (6.8%) |
| $5,000 to $9,999 | 13 (1.2%) | 33 (2.8%) |
| $10,000 to $14,999 | 26 (2.4%) | 133 (11.4%) |
| $15,000 to $19,999 | 70 (6.5%) | 137 (11.7%) |
| $20,000 to $24,999 | 63 (5.8%) | 139 (11.9%) |
| $25,000 to $34,999 | 144 (13.3%) | 153 (13.1%) |
| $35,000 to $49,999 | 231 (21.4%) | 88 (7.5%) |
| $50,000 to $74,999 | 263 (24.3%) | 317 (27.1%) |
| $75,000 to $99,999 | 93 (8.6%) | 80 (6.9%) |
| $100,000 to $149,999 | 86 (8.0%) | 9 (0.8%) |
| $150,000 or more | 34 (3.2%) | 0 (0.0%) |
| Total | 1,080 (100.0%) | 1,168 (100.0%) |
Monthly Housing Cost Tiers in Chester
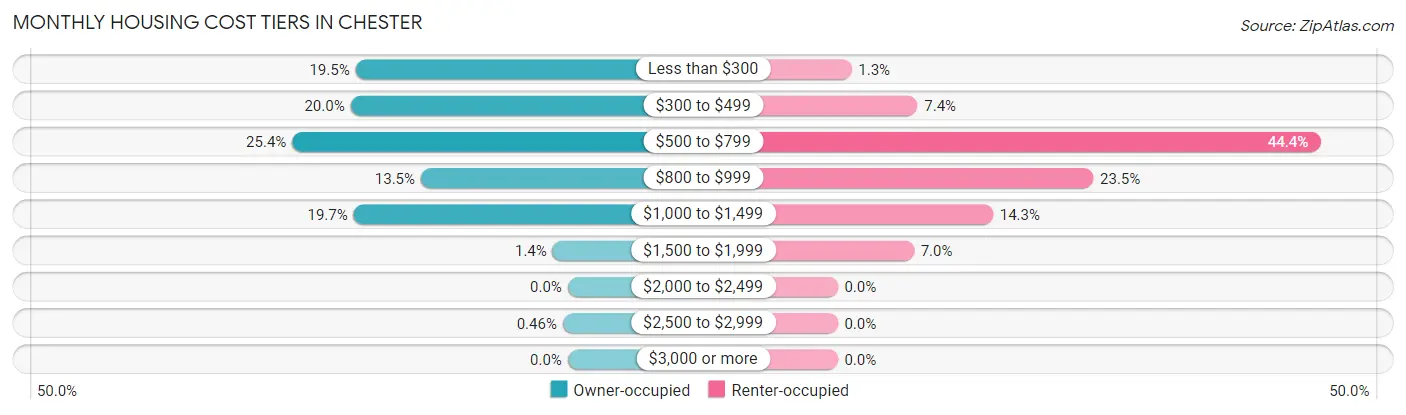
| Monthly Cost | Owner-occupied | Renter-occupied |
| Less than $300 | 211 (19.5%) | 15 (1.3%) |
| $300 to $499 | 216 (20.0%) | 86 (7.4%) |
| $500 to $799 | 274 (25.4%) | 519 (44.4%) |
| $800 to $999 | 146 (13.5%) | 275 (23.5%) |
| $1,000 to $1,499 | 213 (19.7%) | 167 (14.3%) |
| $1,500 to $1,999 | 15 (1.4%) | 82 (7.0%) |
| $2,000 to $2,499 | 0 (0.0%) | 0 (0.0%) |
| $2,500 to $2,999 | 5 (0.5%) | 0 (0.0%) |
| $3,000 or more | 0 (0.0%) | 0 (0.0%) |
| Total | 1,080 (100.0%) | 1,168 (100.0%) |
Physical Housing Characteristics in Chester
Housing Structures in Chester
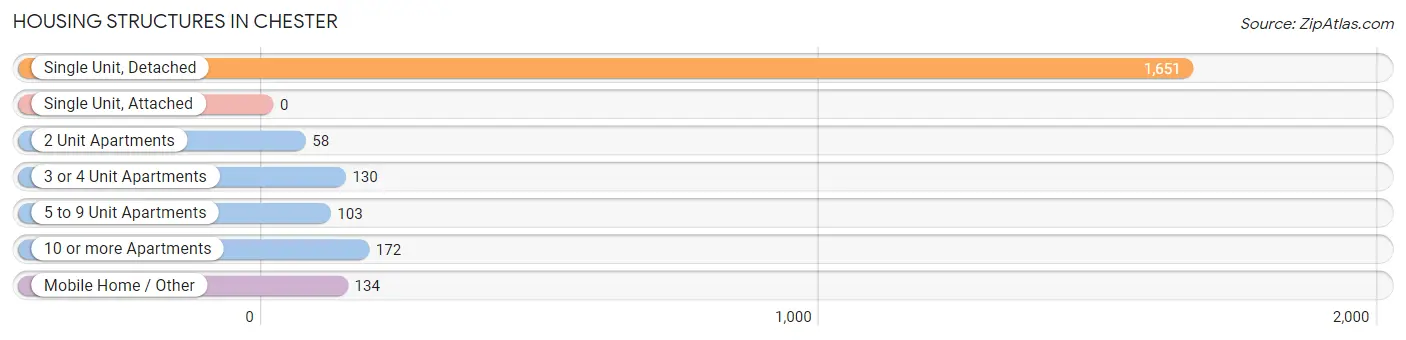
| Structure Type | # Housing Units | % Housing Units |
| Single Unit, Detached | 1,651 | 73.4% |
| Single Unit, Attached | 0 | 0.0% |
| 2 Unit Apartments | 58 | 2.6% |
| 3 or 4 Unit Apartments | 130 | 5.8% |
| 5 to 9 Unit Apartments | 103 | 4.6% |
| 10 or more Apartments | 172 | 7.6% |
| Mobile Home / Other | 134 | 6.0% |
| Total | 2,248 | 100.0% |
Housing Structures by Occupancy in Chester
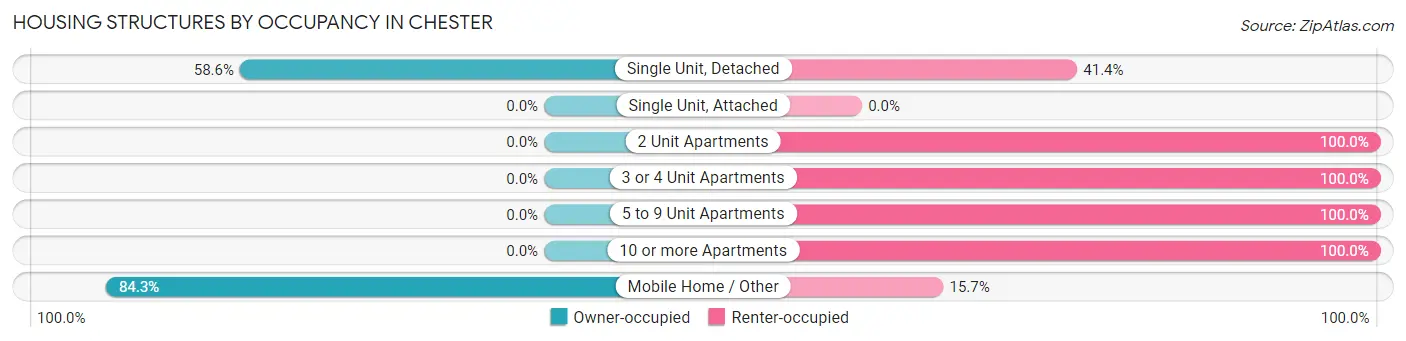
| Structure Type | Owner-occupied | Renter-occupied |
| Single Unit, Detached | 967 (58.6%) | 684 (41.4%) |
| Single Unit, Attached | 0 (0.0%) | 0 (0.0%) |
| 2 Unit Apartments | 0 (0.0%) | 58 (100.0%) |
| 3 or 4 Unit Apartments | 0 (0.0%) | 130 (100.0%) |
| 5 to 9 Unit Apartments | 0 (0.0%) | 103 (100.0%) |
| 10 or more Apartments | 0 (0.0%) | 172 (100.0%) |
| Mobile Home / Other | 113 (84.3%) | 21 (15.7%) |
| Total | 1,080 (48.0%) | 1,168 (52.0%) |
Housing Structures by Number of Rooms in Chester
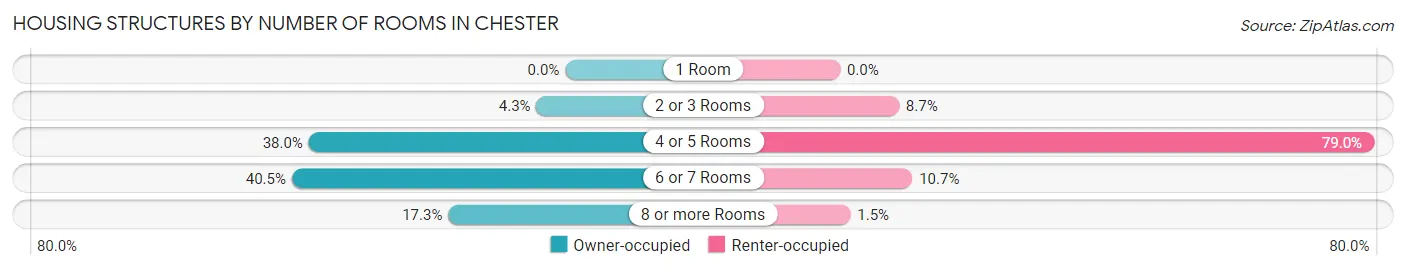
| Number of Rooms | Owner-occupied | Renter-occupied |
| 1 Room | 0 (0.0%) | 0 (0.0%) |
| 2 or 3 Rooms | 46 (4.3%) | 102 (8.7%) |
| 4 or 5 Rooms | 410 (38.0%) | 923 (79.0%) |
| 6 or 7 Rooms | 437 (40.5%) | 125 (10.7%) |
| 8 or more Rooms | 187 (17.3%) | 18 (1.5%) |
| Total | 1,080 (100.0%) | 1,168 (100.0%) |
Housing Structure by Heating Type in Chester
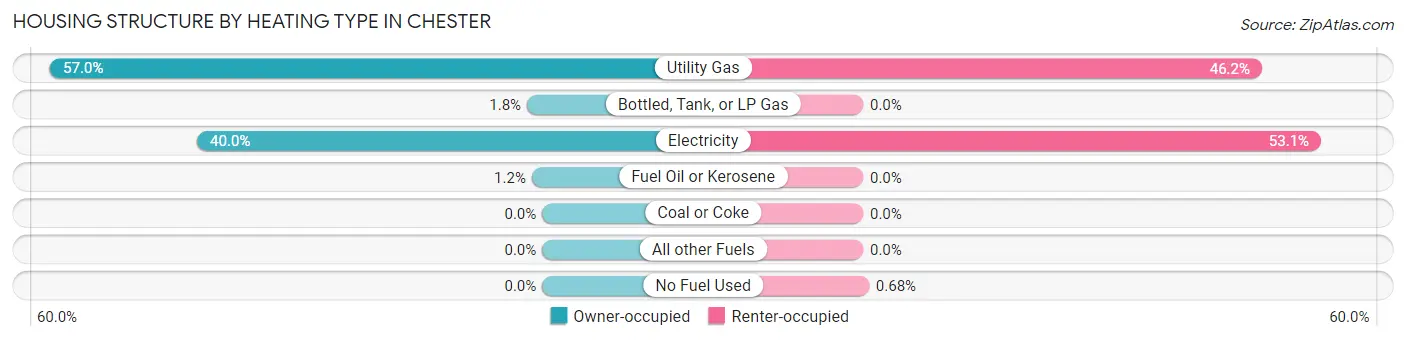
| Heating Type | Owner-occupied | Renter-occupied |
| Utility Gas | 616 (57.0%) | 540 (46.2%) |
| Bottled, Tank, or LP Gas | 19 (1.8%) | 0 (0.0%) |
| Electricity | 432 (40.0%) | 620 (53.1%) |
| Fuel Oil or Kerosene | 13 (1.2%) | 0 (0.0%) |
| Coal or Coke | 0 (0.0%) | 0 (0.0%) |
| All other Fuels | 0 (0.0%) | 0 (0.0%) |
| No Fuel Used | 0 (0.0%) | 8 (0.7%) |
| Total | 1,080 (100.0%) | 1,168 (100.0%) |
Household Vehicle Usage in Chester
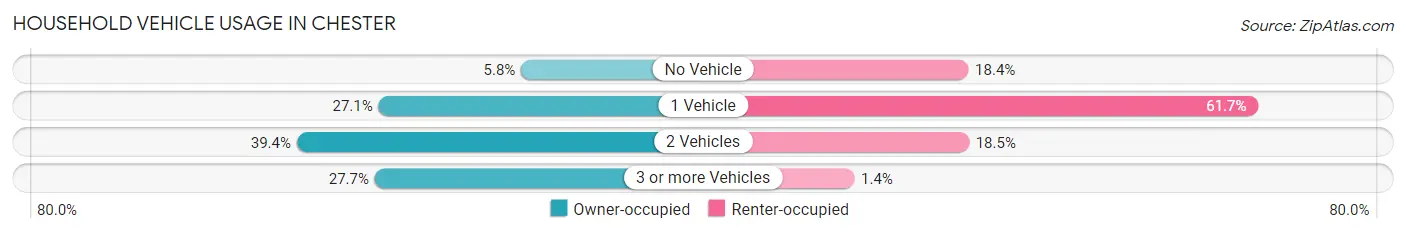
| Vehicles per Household | Owner-occupied | Renter-occupied |
| No Vehicle | 63 (5.8%) | 215 (18.4%) |
| 1 Vehicle | 293 (27.1%) | 721 (61.7%) |
| 2 Vehicles | 425 (39.4%) | 216 (18.5%) |
| 3 or more Vehicles | 299 (27.7%) | 16 (1.4%) |
| Total | 1,080 (100.0%) | 1,168 (100.0%) |
Real Estate & Mortgages in Chester
Real Estate and Mortgage Overview in Chester
| Characteristic | Without Mortgage | With Mortgage |
| Housing Units | 632 | 448 |
| Median Property Value | $80,600 | $116,500 |
| Median Household Income | $43,448 | $11 |
| Monthly Housing Costs | $404 | $0 |
| Real Estate Taxes | $604 | $42 |
Property Value by Mortgage Status in Chester
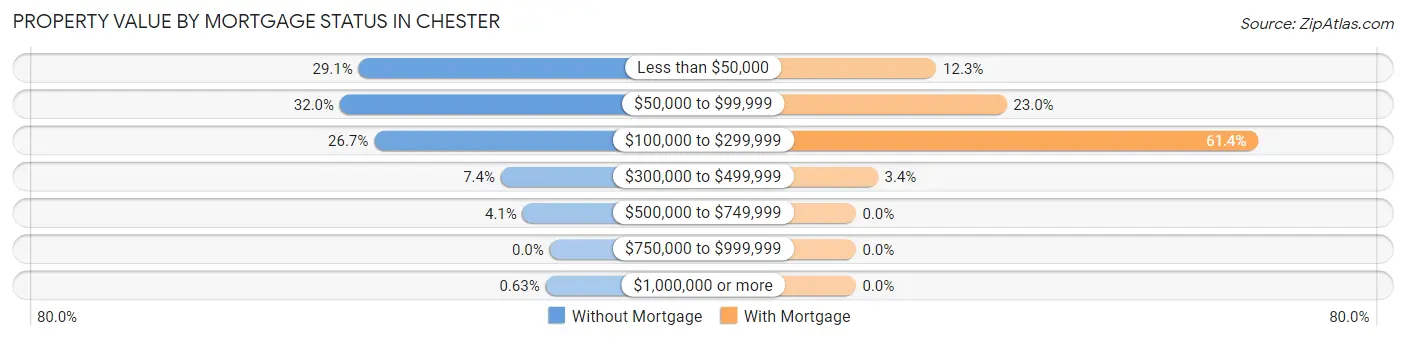
| Property Value | Without Mortgage | With Mortgage |
| Less than $50,000 | 184 (29.1%) | 55 (12.3%) |
| $50,000 to $99,999 | 202 (32.0%) | 103 (23.0%) |
| $100,000 to $299,999 | 169 (26.7%) | 275 (61.4%) |
| $300,000 to $499,999 | 47 (7.4%) | 15 (3.4%) |
| $500,000 to $749,999 | 26 (4.1%) | 0 (0.0%) |
| $750,000 to $999,999 | 0 (0.0%) | 0 (0.0%) |
| $1,000,000 or more | 4 (0.6%) | 0 (0.0%) |
| Total | 632 (100.0%) | 448 (100.0%) |
Household Income by Mortgage Status in Chester
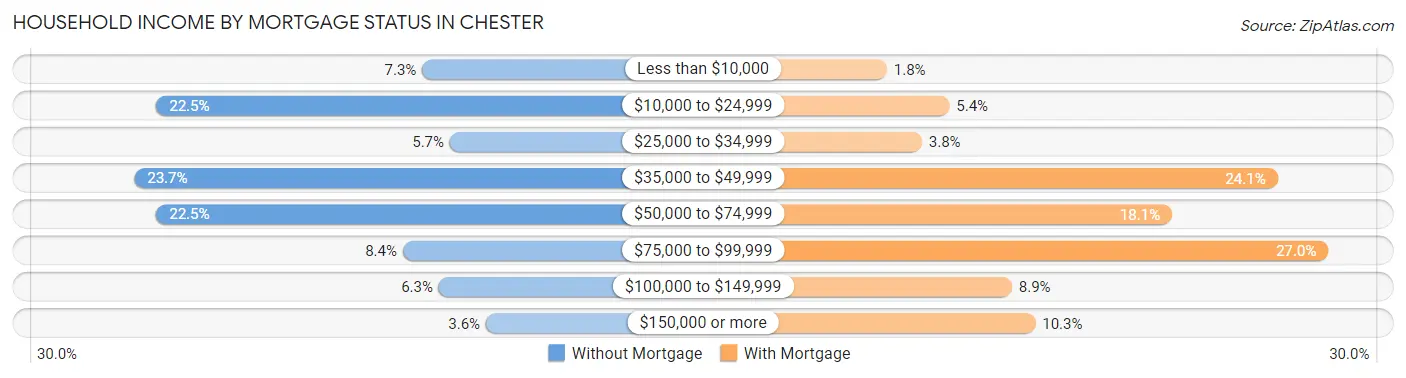
| Household Income | Without Mortgage | With Mortgage |
| Less than $10,000 | 46 (7.3%) | 8 (1.8%) |
| $10,000 to $24,999 | 142 (22.5%) | 24 (5.4%) |
| $25,000 to $34,999 | 36 (5.7%) | 17 (3.8%) |
| $35,000 to $49,999 | 150 (23.7%) | 108 (24.1%) |
| $50,000 to $74,999 | 142 (22.5%) | 81 (18.1%) |
| $75,000 to $99,999 | 53 (8.4%) | 121 (27.0%) |
| $100,000 to $149,999 | 40 (6.3%) | 40 (8.9%) |
| $150,000 or more | 23 (3.6%) | 46 (10.3%) |
| Total | 632 (100.0%) | 448 (100.0%) |
Property Value to Household Income Ratio in Chester
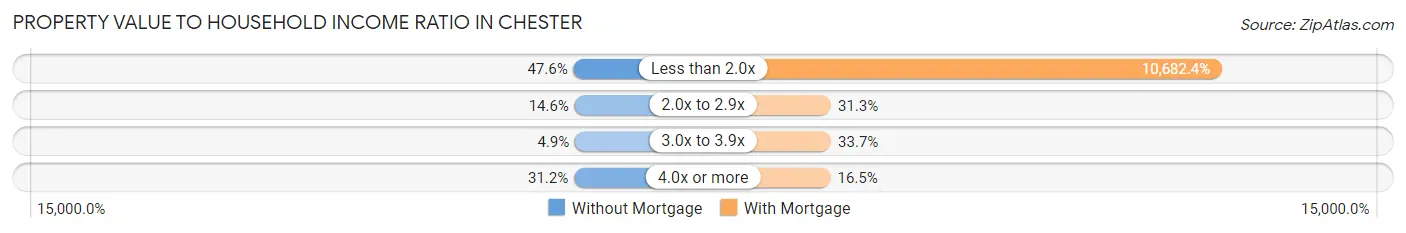
| Value-to-Income Ratio | Without Mortgage | With Mortgage |
| Less than 2.0x | 301 (47.6%) | 47,857 (10,682.4%) |
| 2.0x to 2.9x | 92 (14.6%) | 140 (31.2%) |
| 3.0x to 3.9x | 31 (4.9%) | 151 (33.7%) |
| 4.0x or more | 197 (31.2%) | 74 (16.5%) |
| Total | 632 (100.0%) | 448 (100.0%) |
Real Estate Taxes by Mortgage Status in Chester
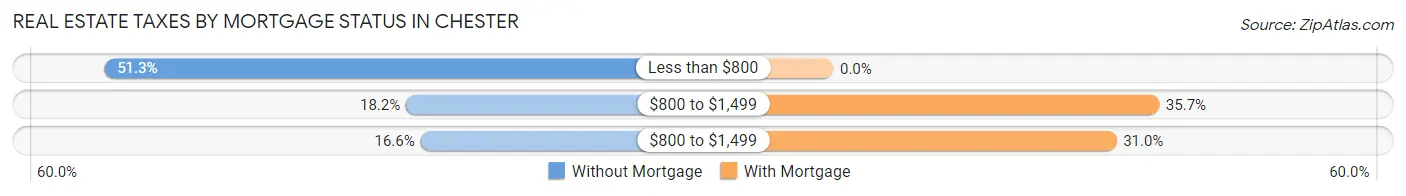
| Property Taxes | Without Mortgage | With Mortgage |
| Less than $800 | 324 (51.3%) | 0 (0.0%) |
| $800 to $1,499 | 115 (18.2%) | 160 (35.7%) |
| $800 to $1,499 | 105 (16.6%) | 139 (31.0%) |
| Total | 632 (100.0%) | 448 (100.0%) |
Health & Disability in Chester
Health Insurance Coverage by Age in Chester
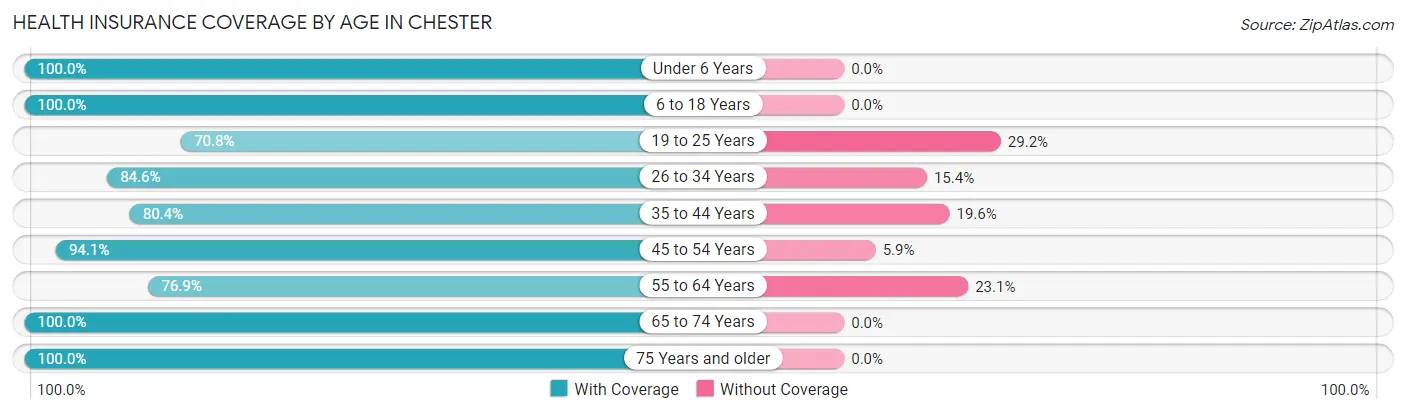
| Age Bracket | With Coverage | Without Coverage |
| Under 6 Years | 778 (100.0%) | 0 (0.0%) |
| 6 to 18 Years | 445 (100.0%) | 0 (0.0%) |
| 19 to 25 Years | 378 (70.8%) | 156 (29.2%) |
| 26 to 34 Years | 828 (84.6%) | 151 (15.4%) |
| 35 to 44 Years | 389 (80.4%) | 95 (19.6%) |
| 45 to 54 Years | 418 (94.1%) | 26 (5.9%) |
| 55 to 64 Years | 569 (76.9%) | 171 (23.1%) |
| 65 to 74 Years | 555 (100.0%) | 0 (0.0%) |
| 75 Years and older | 234 (100.0%) | 0 (0.0%) |
| Total | 4,594 (88.5%) | 599 (11.5%) |
Health Insurance Coverage by Citizenship Status in Chester
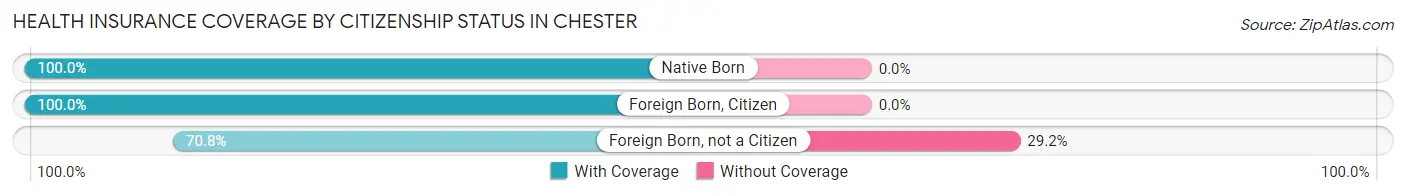
| Citizenship Status | With Coverage | Without Coverage |
| Native Born | 778 (100.0%) | 0 (0.0%) |
| Foreign Born, Citizen | 445 (100.0%) | 0 (0.0%) |
| Foreign Born, not a Citizen | 378 (70.8%) | 156 (29.2%) |
Health Insurance Coverage by Household Income in Chester
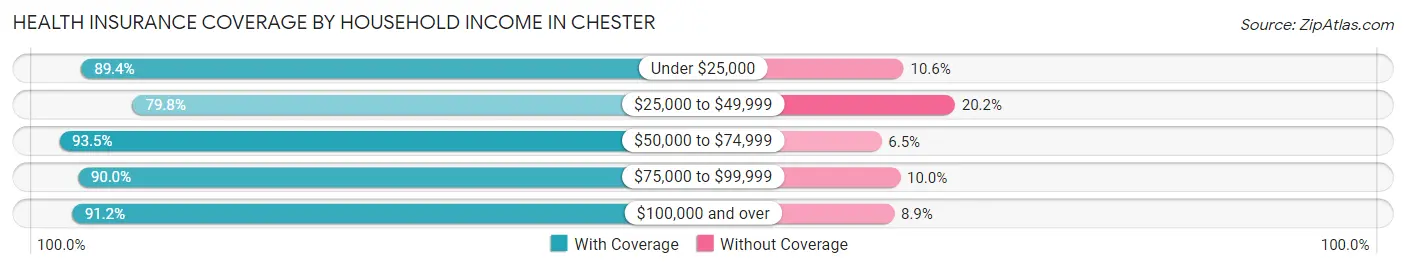
| Household Income | With Coverage | Without Coverage |
| Under $25,000 | 992 (89.4%) | 118 (10.6%) |
| $25,000 to $49,999 | 1,108 (79.8%) | 281 (20.2%) |
| $50,000 to $74,999 | 1,734 (93.5%) | 120 (6.5%) |
| $75,000 to $99,999 | 451 (90.0%) | 50 (10.0%) |
| $100,000 and over | 309 (91.1%) | 30 (8.8%) |
Public vs Private Health Insurance Coverage by Age in Chester
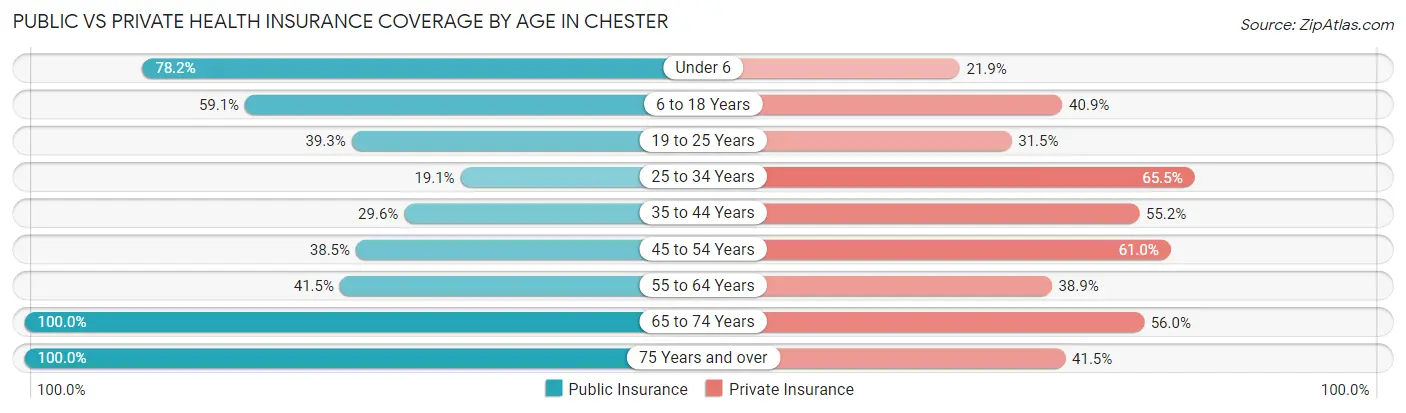
| Age Bracket | Public Insurance | Private Insurance |
| Under 6 | 608 (78.1%) | 170 (21.8%) |
| 6 to 18 Years | 263 (59.1%) | 182 (40.9%) |
| 19 to 25 Years | 210 (39.3%) | 168 (31.5%) |
| 25 to 34 Years | 187 (19.1%) | 641 (65.5%) |
| 35 to 44 Years | 143 (29.5%) | 267 (55.2%) |
| 45 to 54 Years | 171 (38.5%) | 271 (61.0%) |
| 55 to 64 Years | 307 (41.5%) | 288 (38.9%) |
| 65 to 74 Years | 555 (100.0%) | 311 (56.0%) |
| 75 Years and over | 234 (100.0%) | 97 (41.4%) |
| Total | 2,678 (51.6%) | 2,395 (46.1%) |
Disability Status by Sex by Age in Chester
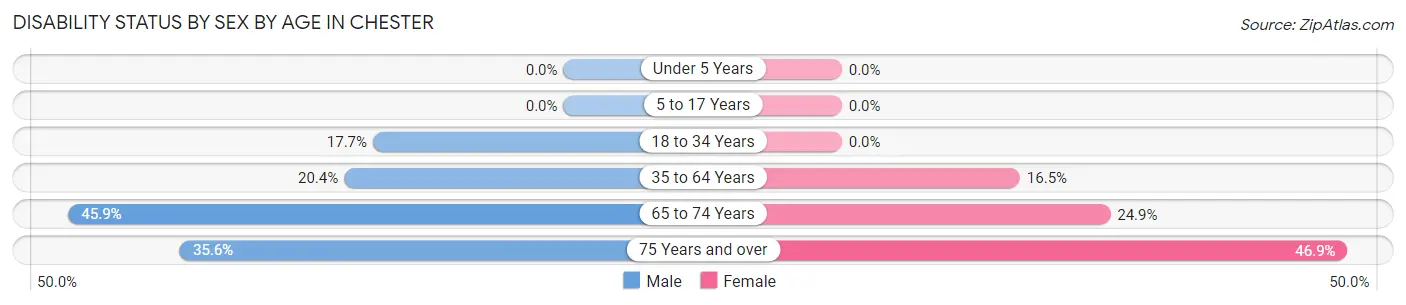
| Age Bracket | Male | Female |
| Under 5 Years | 0 (0.0%) | 0 (0.0%) |
| 5 to 17 Years | 0 (0.0%) | 0 (0.0%) |
| 18 to 34 Years | 140 (17.7%) | 0 (0.0%) |
| 35 to 64 Years | 161 (20.3%) | 145 (16.5%) |
| 65 to 74 Years | 113 (45.9%) | 77 (24.9%) |
| 75 Years and over | 37 (35.6%) | 61 (46.9%) |
Disability Class by Sex by Age in Chester
Disability Class: Hearing Difficulty
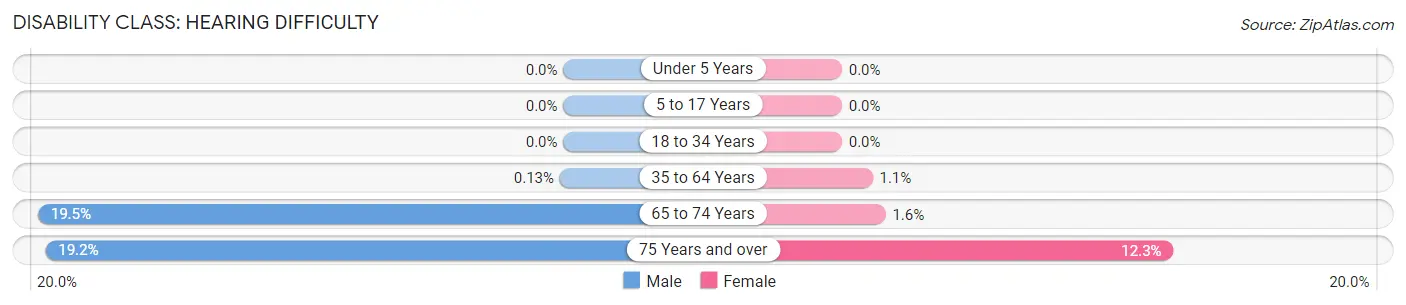
| Age Bracket | Male | Female |
| Under 5 Years | 0 (0.0%) | 0 (0.0%) |
| 5 to 17 Years | 0 (0.0%) | 0 (0.0%) |
| 18 to 34 Years | 0 (0.0%) | 0 (0.0%) |
| 35 to 64 Years | 1 (0.1%) | 10 (1.1%) |
| 65 to 74 Years | 48 (19.5%) | 5 (1.6%) |
| 75 Years and over | 20 (19.2%) | 16 (12.3%) |
Disability Class: Vision Difficulty
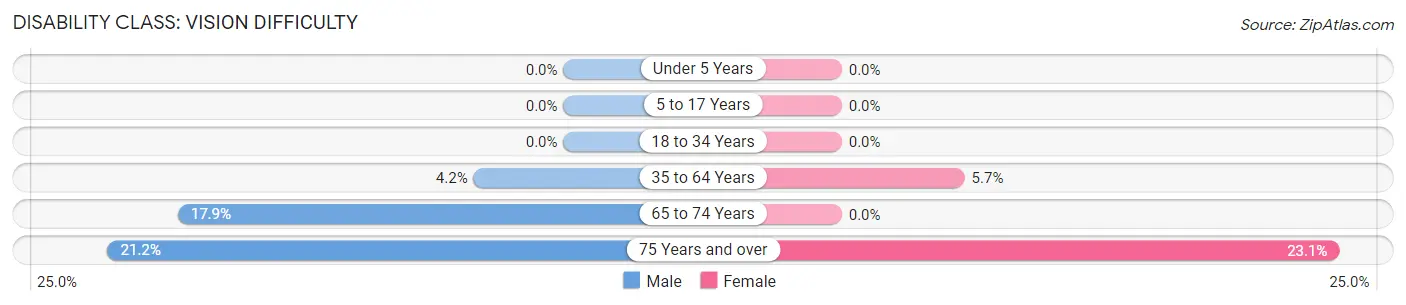
| Age Bracket | Male | Female |
| Under 5 Years | 0 (0.0%) | 0 (0.0%) |
| 5 to 17 Years | 0 (0.0%) | 0 (0.0%) |
| 18 to 34 Years | 0 (0.0%) | 0 (0.0%) |
| 35 to 64 Years | 33 (4.2%) | 50 (5.7%) |
| 65 to 74 Years | 44 (17.9%) | 0 (0.0%) |
| 75 Years and over | 22 (21.1%) | 30 (23.1%) |
Disability Class: Cognitive Difficulty
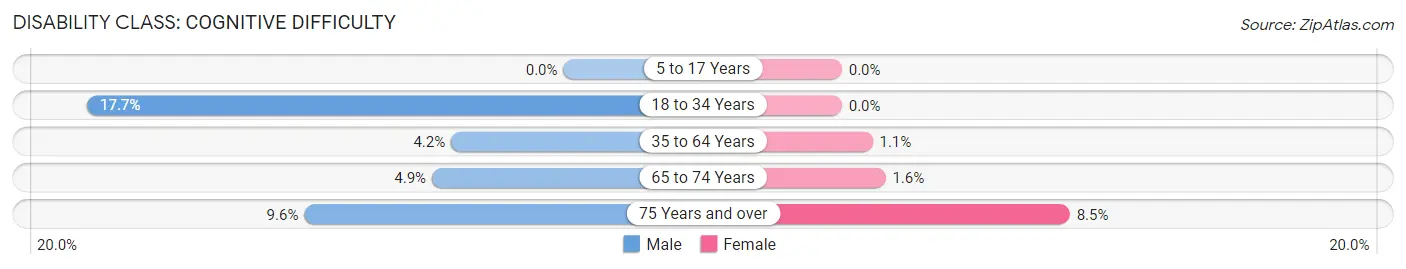
| Age Bracket | Male | Female |
| 5 to 17 Years | 0 (0.0%) | 0 (0.0%) |
| 18 to 34 Years | 140 (17.7%) | 0 (0.0%) |
| 35 to 64 Years | 33 (4.2%) | 10 (1.1%) |
| 65 to 74 Years | 12 (4.9%) | 5 (1.6%) |
| 75 Years and over | 10 (9.6%) | 11 (8.5%) |
Disability Class: Ambulatory Difficulty
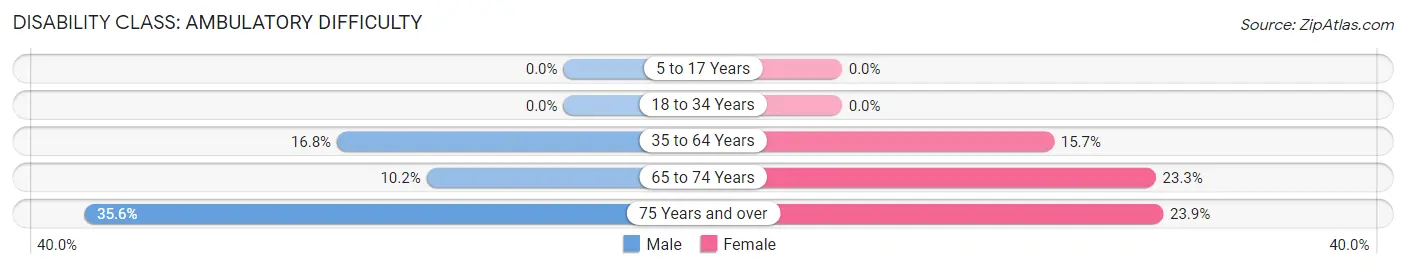
| Age Bracket | Male | Female |
| 5 to 17 Years | 0 (0.0%) | 0 (0.0%) |
| 18 to 34 Years | 0 (0.0%) | 0 (0.0%) |
| 35 to 64 Years | 133 (16.8%) | 138 (15.7%) |
| 65 to 74 Years | 25 (10.2%) | 72 (23.3%) |
| 75 Years and over | 37 (35.6%) | 31 (23.8%) |
Disability Class: Self-Care Difficulty
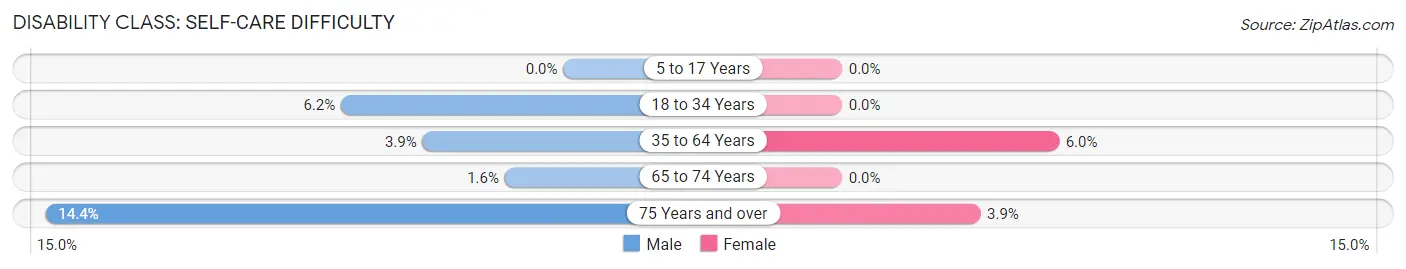
| Age Bracket | Male | Female |
| 5 to 17 Years | 0 (0.0%) | 0 (0.0%) |
| 18 to 34 Years | 49 (6.2%) | 0 (0.0%) |
| 35 to 64 Years | 31 (3.9%) | 53 (6.0%) |
| 65 to 74 Years | 4 (1.6%) | 0 (0.0%) |
| 75 Years and over | 15 (14.4%) | 5 (3.8%) |
Technology Access in Chester
Computing Device Access in Chester
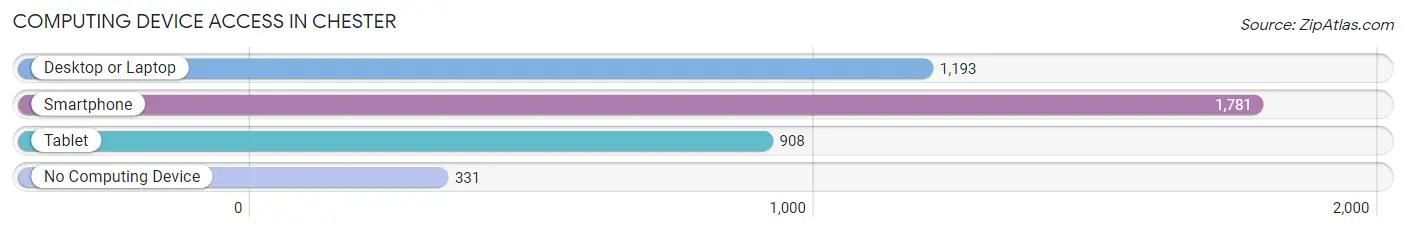
| Device Type | # Households | % Households |
| Desktop or Laptop | 1,193 | 53.1% |
| Smartphone | 1,781 | 79.2% |
| Tablet | 908 | 40.4% |
| No Computing Device | 331 | 14.7% |
| Total | 2,248 | 100.0% |
Internet Access in Chester
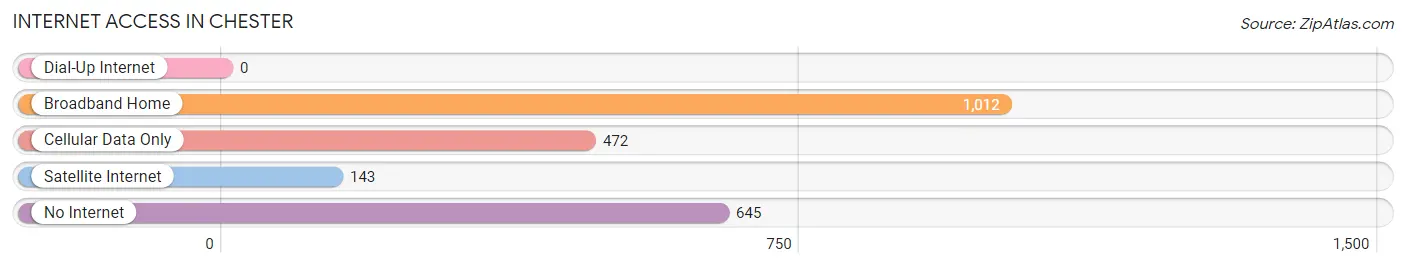
| Internet Type | # Households | % Households |
| Dial-Up Internet | 0 | 0.0% |
| Broadband Home | 1,012 | 45.0% |
| Cellular Data Only | 472 | 21.0% |
| Satellite Internet | 143 | 6.4% |
| No Internet | 645 | 28.7% |
| Total | 2,248 | 100.0% |
Chester Summary
Chester, South Carolina is a small town located in the northwestern corner of the state, approximately 40 miles south of Charlotte, North Carolina. It is the county seat of Chester County and is home to a population of approximately 5,000 people. The town is situated in the foothills of the Blue Ridge Mountains and is surrounded by rolling hills and lush forests.
History
Chester was founded in 1790 by a group of settlers from Virginia. The town was named after the English city of Chester, and was originally intended to be a trading post. The town quickly grew and by the early 1800s, it had become a major center for trade and commerce. The town was also home to a number of mills, which provided employment for many of the town’s residents.
In the mid-1800s, the town was a major stop on the Charlotte-Columbia Railroad. This allowed the town to become a major hub for the transportation of goods and people. The railroad also allowed the town to become a major center for the production of textiles.
In the late 1800s, the town was home to a number of educational institutions, including the Chester Female College and the Chester Male Academy. These institutions provided education to many of the town’s residents.
Geography
Chester is located in the northwestern corner of South Carolina, approximately 40 miles south of Charlotte, North Carolina. The town is situated in the foothills of the Blue Ridge Mountains and is surrounded by rolling hills and lush forests. The town is located on the banks of the Catawba River, which provides a number of recreational opportunities for the town’s residents.
The town is located in a humid subtropical climate zone, which means that it experiences hot, humid summers and mild winters. The average temperature in the summer is around 80 degrees Fahrenheit, while the average temperature in the winter is around 50 degrees Fahrenheit.
Economy
Chester’s economy is largely based on the production of textiles and other goods. The town is home to a number of textile mills, which provide employment for many of the town’s residents. The town is also home to a number of small businesses, including restaurants, retail stores, and other services.
The town is also home to a number of educational institutions, including the Chester Female College and the Chester Male Academy. These institutions provide education to many of the town’s residents.
Demographics
As of the 2010 census, the population of Chester was 5,039. The town is predominantly white, with African Americans making up approximately 25% of the population. The median household income in the town is $35,000, and the median age is 38. The town is home to a number of churches, including the First Baptist Church of Chester, the First Presbyterian Church of Chester, and the Chester United Methodist Church.
Common Questions
What is Per Capita Income in Chester?
Per Capita income in Chester is $20,036.
What is the Median Family Income in Chester?
Median Family Income in Chester is $49,583.
What is the Median Household income in Chester?
Median Household Income in Chester is $39,951.
What is Income or Wage Gap in Chester?
Income or Wage Gap in Chester is 27.5%.
Women in Chester earn 72.5 cents for every dollar earned by a man.
What is Inequality or Gini Index in Chester?
Inequality or Gini Index in Chester is 0.40.
What is the Total Population of Chester?
Total Population of Chester is 5,260.
What is the Total Male Population of Chester?
Total Male Population of Chester is 2,569.
What is the Total Female Population of Chester?
Total Female Population of Chester is 2,691.
What is the Ratio of Males per 100 Females in Chester?
There are 95.47 Males per 100 Females in Chester.
What is the Ratio of Females per 100 Males in Chester?
There are 104.75 Females per 100 Males in Chester.
What is the Median Population Age in Chester?
Median Population Age in Chester is 33.5 Years.
What is the Average Family Size in Chester
Average Family Size in Chester is 3.2 People.
What is the Average Household Size in Chester
Average Household Size in Chester is 2.3 People.
How Large is the Labor Force in Chester?
There are 2,339 People in the Labor Forcein in Chester.
What is the Percentage of People in the Labor Force in Chester?
56.6% of People are in the Labor Force in Chester.
What is the Unemployment Rate in Chester?
Unemployment Rate in Chester is 10.2%.