Calhoun Falls, SC Map & Demographics
Calhoun Falls Map
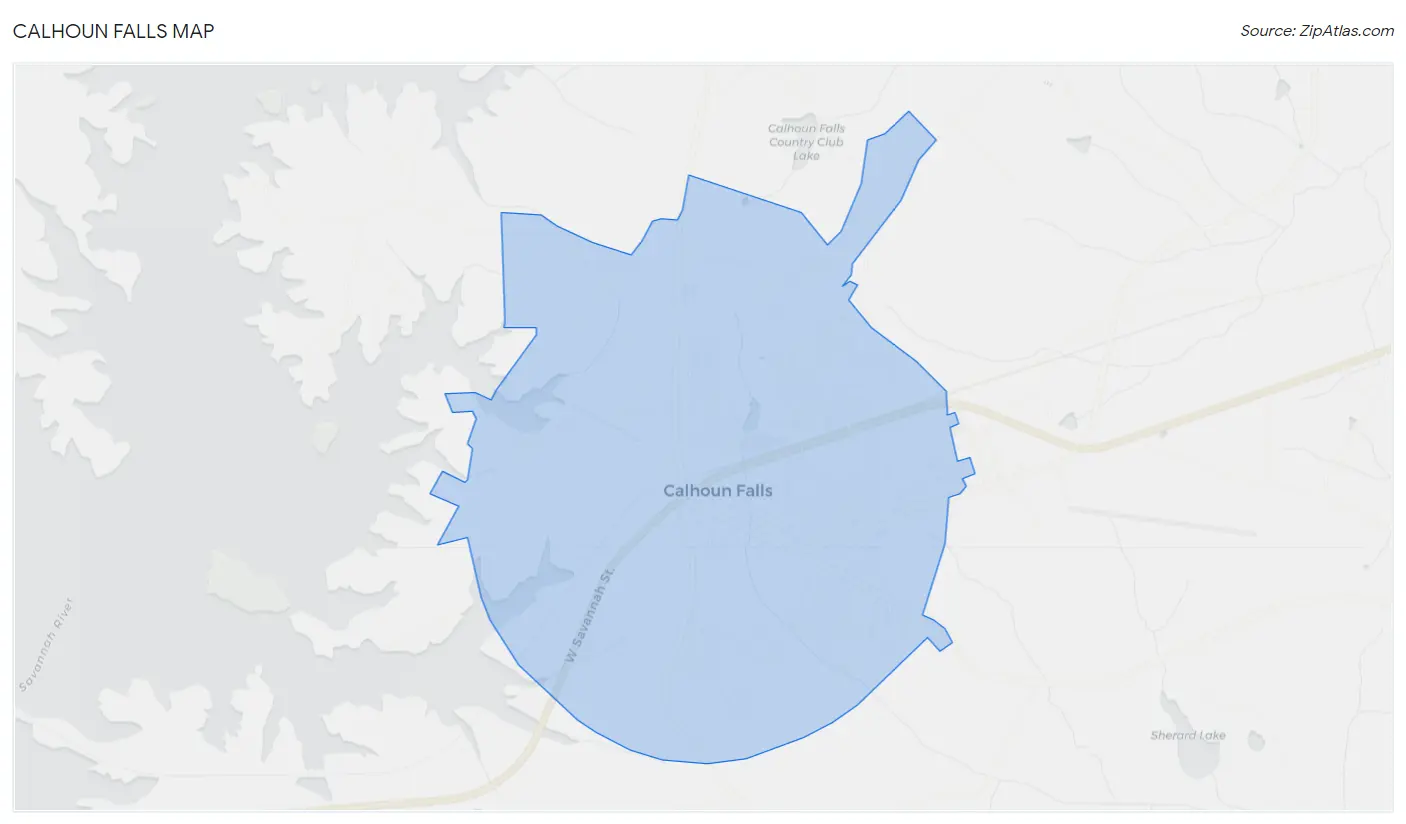
Calhoun Falls Overview
$20,539
PER CAPITA INCOME
$55,357
AVG FAMILY INCOME
$30,078
AVG HOUSEHOLD INCOME
16.8%
WAGE / INCOME GAP [ % ]
83.2¢/ $1
WAGE / INCOME GAP [ $ ]
0.52
INEQUALITY / GINI INDEX
1,939
TOTAL POPULATION
876
MALE POPULATION
1,063
FEMALE POPULATION
82.41
MALES / 100 FEMALES
121.35
FEMALES / 100 MALES
42.0
MEDIAN AGE
3.4
AVG FAMILY SIZE
2.5
AVG HOUSEHOLD SIZE
799
LABOR FORCE [ PEOPLE ]
49.7%
PERCENT IN LABOR FORCE
3.0%
UNEMPLOYMENT RATE
Calhoun Falls Zip Codes
Calhoun Falls Area Codes
Income in Calhoun Falls
Income Overview in Calhoun Falls
Per Capita Income in Calhoun Falls is $20,539, while median incomes of families and households are $55,357 and $30,078 respectively.
| Characteristic | Number | Measure |
| Per Capita Income | 1,939 | $20,539 |
| Median Family Income | 410 | $55,357 |
| Mean Family Income | 410 | $52,683 |
| Median Household Income | 785 | $30,078 |
| Mean Household Income | 785 | $54,324 |
| Income Deficit | 410 | $0 |
| Wage / Income Gap (%) | 1,939 | 16.81% |
| Wage / Income Gap ($) | 1,939 | 83.19¢ per $1 |
| Gini / Inequality Index | 1,939 | 0.52 |
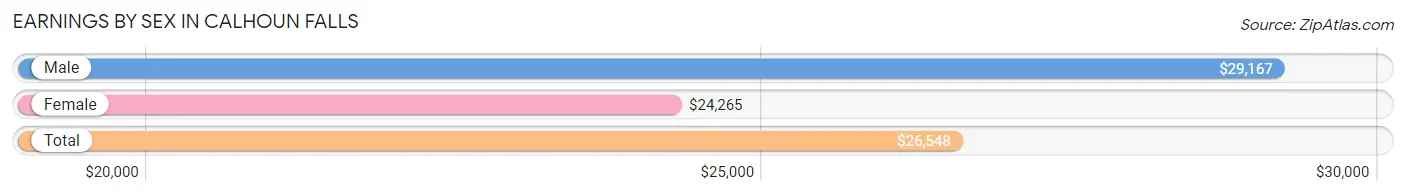
Earnings by Sex in Calhoun Falls
Average Earnings in Calhoun Falls are $26,548, $29,167 for men and $24,265 for women, a difference of 16.8%.
| Sex | Number | Average Earnings |
| Male | 326 (40.4%) | $29,167 |
| Female | 482 (59.7%) | $24,265 |
| Total | 808 (100.0%) | $26,548 |
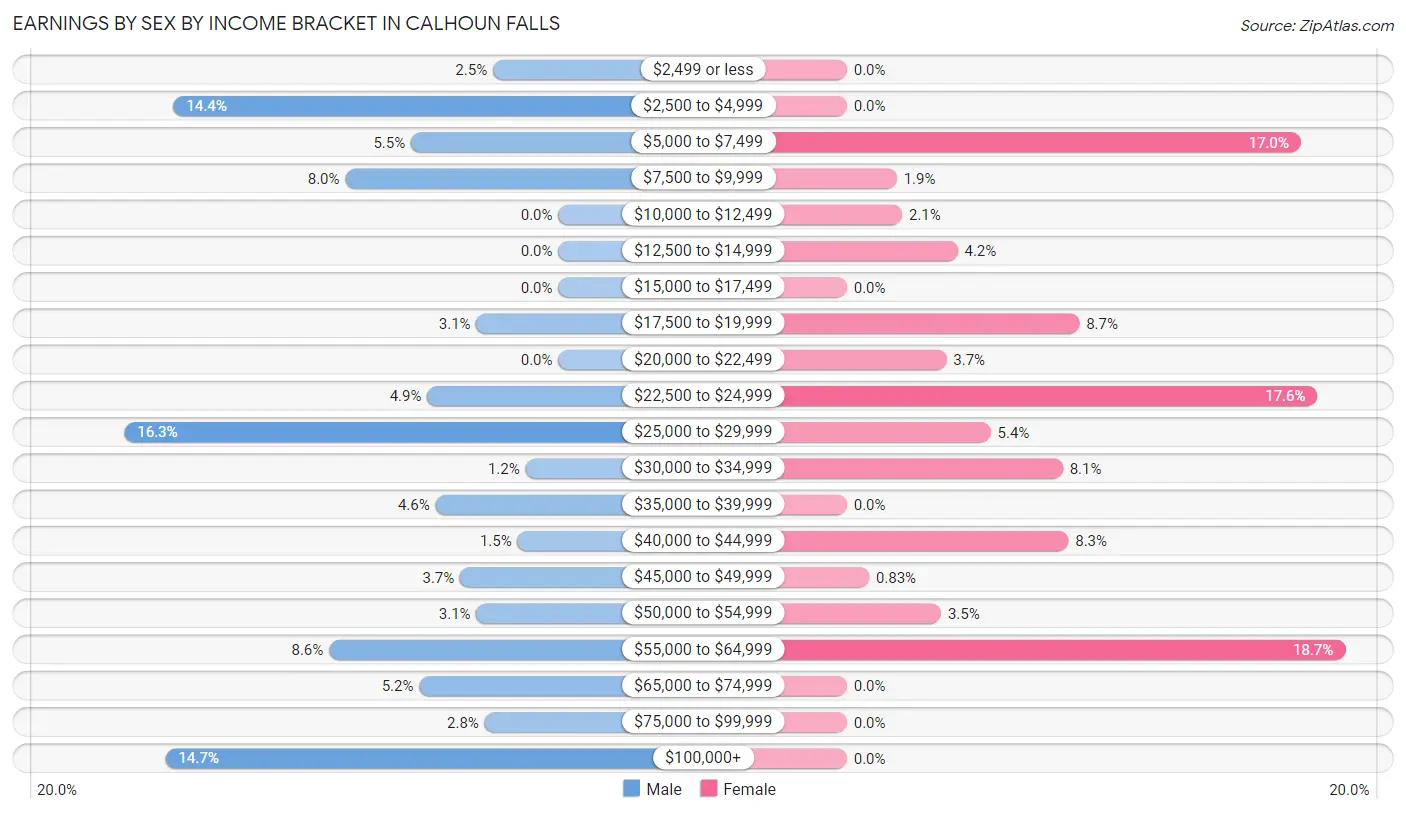
Earnings by Sex by Income Bracket in Calhoun Falls
The most common earnings brackets in Calhoun Falls are $25,000 to $29,999 for men (53 | 16.3%) and $55,000 to $64,999 for women (90 | 18.7%).
| Income | Male | Female |
| $2,499 or less | 8 (2.5%) | 0 (0.0%) |
| $2,500 to $4,999 | 47 (14.4%) | 0 (0.0%) |
| $5,000 to $7,499 | 18 (5.5%) | 82 (17.0%) |
| $7,500 to $9,999 | 26 (8.0%) | 9 (1.9%) |
| $10,000 to $12,499 | 0 (0.0%) | 10 (2.1%) |
| $12,500 to $14,999 | 0 (0.0%) | 20 (4.2%) |
| $15,000 to $17,499 | 0 (0.0%) | 0 (0.0%) |
| $17,500 to $19,999 | 10 (3.1%) | 42 (8.7%) |
| $20,000 to $22,499 | 0 (0.0%) | 18 (3.7%) |
| $22,500 to $24,999 | 16 (4.9%) | 85 (17.6%) |
| $25,000 to $29,999 | 53 (16.3%) | 26 (5.4%) |
| $30,000 to $34,999 | 4 (1.2%) | 39 (8.1%) |
| $35,000 to $39,999 | 15 (4.6%) | 0 (0.0%) |
| $40,000 to $44,999 | 5 (1.5%) | 40 (8.3%) |
| $45,000 to $49,999 | 12 (3.7%) | 4 (0.8%) |
| $50,000 to $54,999 | 10 (3.1%) | 17 (3.5%) |
| $55,000 to $64,999 | 28 (8.6%) | 90 (18.7%) |
| $65,000 to $74,999 | 17 (5.2%) | 0 (0.0%) |
| $75,000 to $99,999 | 9 (2.8%) | 0 (0.0%) |
| $100,000+ | 48 (14.7%) | 0 (0.0%) |
| Total | 326 (100.0%) | 482 (100.0%) |
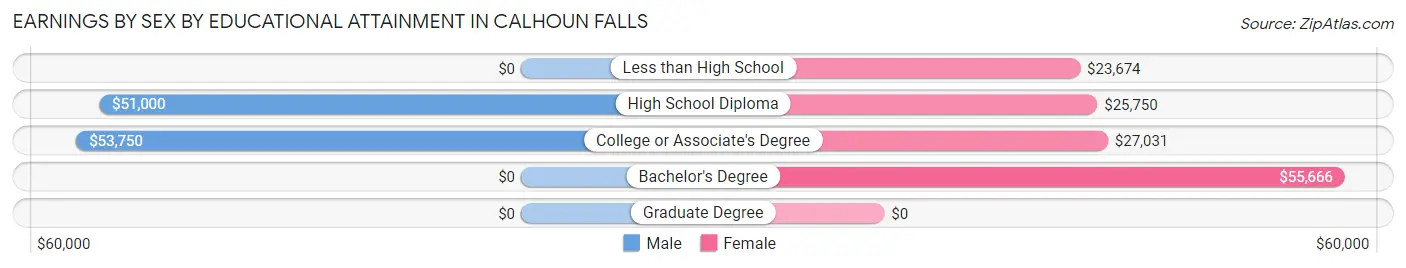
Earnings by Sex by Educational Attainment in Calhoun Falls
Average earnings in Calhoun Falls are $48,750 for men and $27,212 for women, a difference of 44.2%. Men with an educational attainment of college or associate's degree enjoy the highest average annual earnings of $53,750, while those with high school diploma education earn the least with $51,000. Women with an educational attainment of bachelor's degree earn the most with the average annual earnings of $55,666, while those with less than high school education have the smallest earnings of $23,674.
| Educational Attainment | Male Income | Female Income |
| Less than High School | - | - |
| High School Diploma | $51,000 | $25,750 |
| College or Associate's Degree | $53,750 | $27,031 |
| Bachelor's Degree | - | - |
| Graduate Degree | - | - |
| Total | $48,750 | $27,212 |
Family Income in Calhoun Falls
Family Income Brackets in Calhoun Falls
According to the Calhoun Falls family income data, there are 150 families falling into the $50,000 to $74,999 income range, which is the most common income bracket and makes up 36.6% of all families.
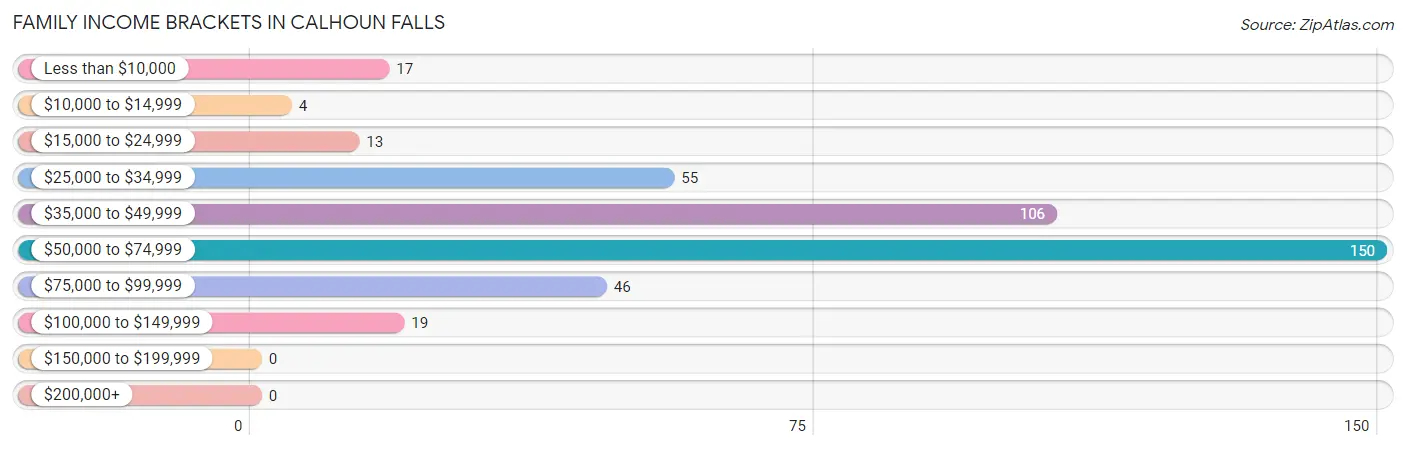
| Income Bracket | # Families | % Families |
| Less than $10,000 | 17 | 4.1% |
| $10,000 to $14,999 | 4 | 1.0% |
| $15,000 to $24,999 | 13 | 3.2% |
| $25,000 to $34,999 | 55 | 13.4% |
| $35,000 to $49,999 | 106 | 25.9% |
| $50,000 to $74,999 | 150 | 36.6% |
| $75,000 to $99,999 | 46 | 11.2% |
| $100,000 to $149,999 | 19 | 4.6% |
| $150,000 to $199,999 | 0 | 0.0% |
| $200,000+ | 0 | 0.0% |
Family Income by Famaliy Size in Calhoun Falls
3-person families (143 | 34.9%) account for the highest median family income in Calhoun Falls with $61,104 per family, while 2-person families (148 | 36.1%) have the highest median income of $20,400 per family member.
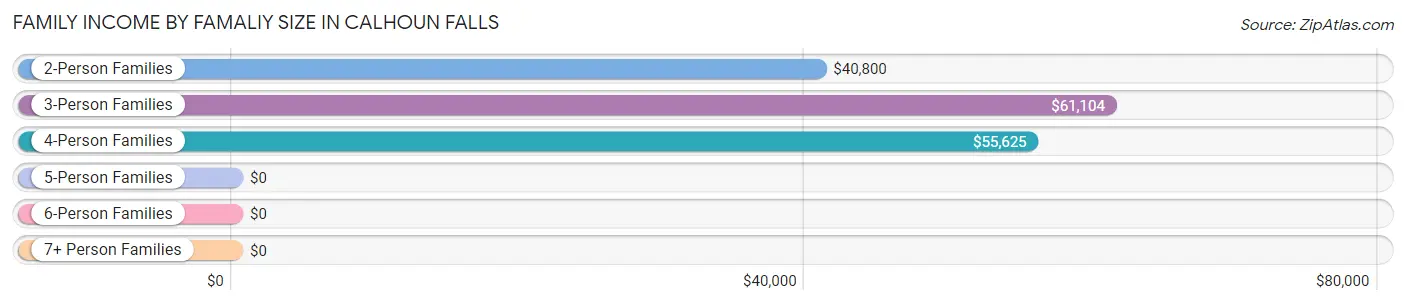
| Income Bracket | # Families | Median Income |
| 2-Person Families | 148 (36.1%) | $40,800 |
| 3-Person Families | 143 (34.9%) | $61,104 |
| 4-Person Families | 103 (25.1%) | $55,625 |
| 5-Person Families | 16 (3.9%) | $0 |
| 6-Person Families | 0 (0.0%) | $0 |
| 7+ Person Families | 0 (0.0%) | $0 |
| Total | 410 (100.0%) | $55,357 |
Family Income by Number of Earners in Calhoun Falls
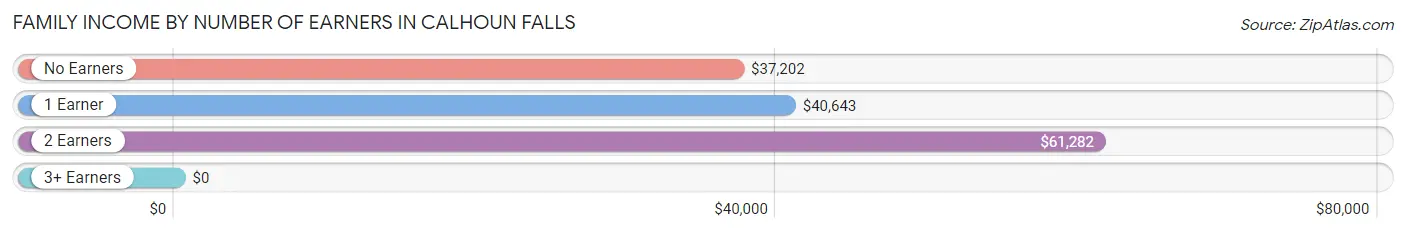
| Number of Earners | # Families | Median Income |
| No Earners | 59 (14.4%) | $37,202 |
| 1 Earner | 182 (44.4%) | $40,643 |
| 2 Earners | 159 (38.8%) | $61,282 |
| 3+ Earners | 10 (2.4%) | $0 |
| Total | 410 (100.0%) | $55,357 |
Household Income in Calhoun Falls
Household Income Brackets in Calhoun Falls
With 169 households falling in the category, the $15,000 to $24,999 income range is the most frequent in Calhoun Falls, accounting for 21.5% of all households.
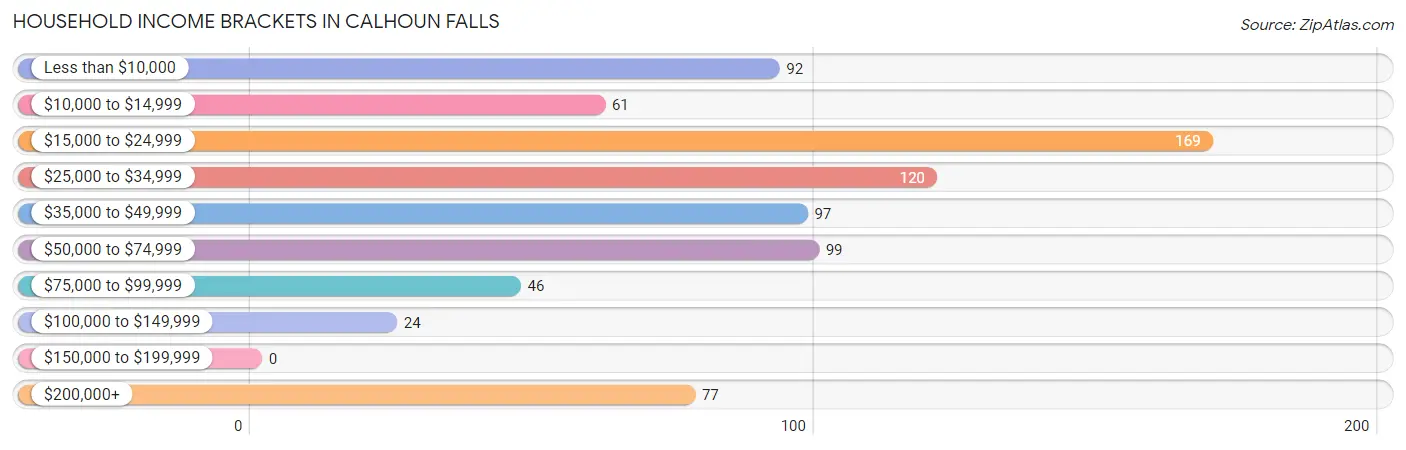
| Income Bracket | # Households | % Households |
| Less than $10,000 | 92 | 11.7% |
| $10,000 to $14,999 | 61 | 7.8% |
| $15,000 to $24,999 | 169 | 21.5% |
| $25,000 to $34,999 | 120 | 15.3% |
| $35,000 to $49,999 | 97 | 12.4% |
| $50,000 to $74,999 | 99 | 12.6% |
| $75,000 to $99,999 | 46 | 5.9% |
| $100,000 to $149,999 | 24 | 3.1% |
| $150,000 to $199,999 | 0 | 0.0% |
| $200,000+ | 77 | 9.8% |
Household Income by Householder Age in Calhoun Falls
The median household income in Calhoun Falls is $30,078, with the highest median household income of $49,500 found in the 25 to 44 years age bracket for the primary householder. A total of 126 households (16.1%) fall into this category. Meanwhile, the 15 to 24 years age bracket for the primary householder has the lowest median household income of $0, with 40 households (5.1%) in this group.
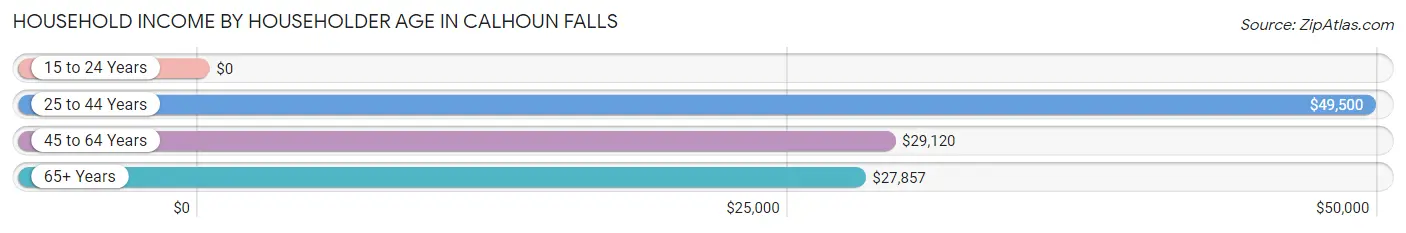
| Income Bracket | # Households | Median Income |
| 15 to 24 Years | 40 (5.1%) | $0 |
| 25 to 44 Years | 126 (16.1%) | $49,500 |
| 45 to 64 Years | 401 (51.1%) | $29,120 |
| 65+ Years | 218 (27.8%) | $27,857 |
| Total | 785 (100.0%) | $30,078 |
Poverty in Calhoun Falls
Income Below Poverty by Sex and Age in Calhoun Falls
With 18.7% poverty level for males and 24.3% for females among the residents of Calhoun Falls, 16 and 17 year old males and 12 to 14 year old females are the most vulnerable to poverty, with 6 males (100.0%) and 18 females (75.0%) in their respective age groups living below the poverty level.
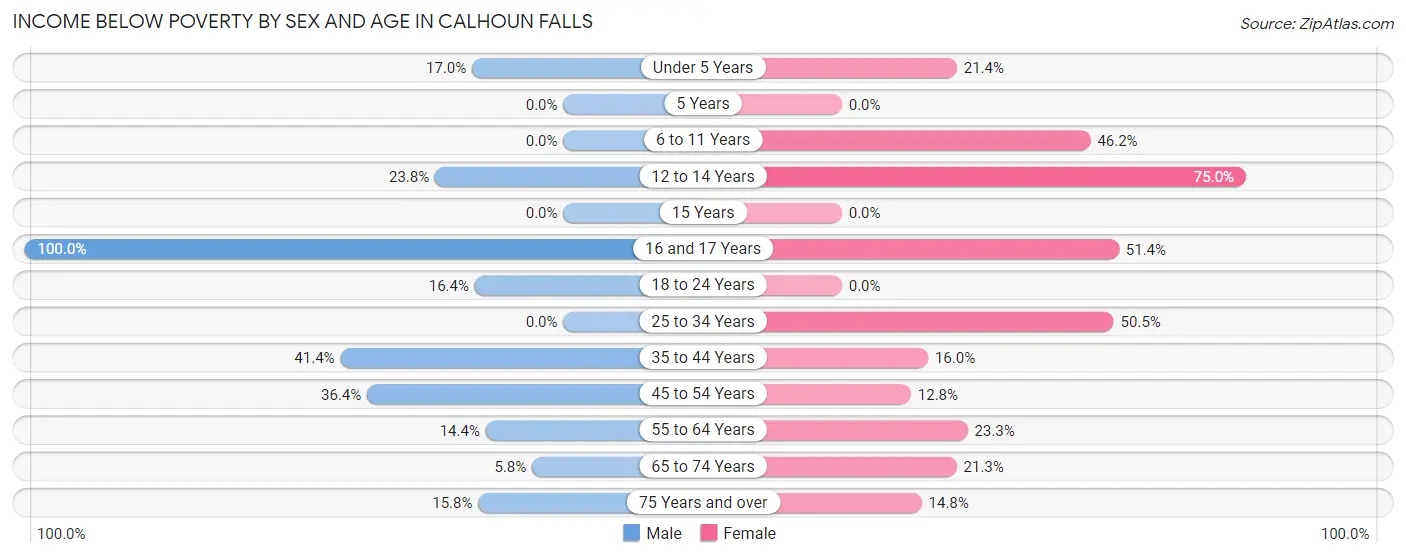
| Age Bracket | Male | Female |
| Under 5 Years | 10 (17.0%) | 19 (21.3%) |
| 5 Years | 0 (0.0%) | 0 (0.0%) |
| 6 to 11 Years | 0 (0.0%) | 24 (46.2%) |
| 12 to 14 Years | 10 (23.8%) | 18 (75.0%) |
| 15 Years | 0 (0.0%) | 0 (0.0%) |
| 16 and 17 Years | 6 (100.0%) | 18 (51.4%) |
| 18 to 24 Years | 36 (16.4%) | 0 (0.0%) |
| 25 to 34 Years | 0 (0.0%) | 55 (50.5%) |
| 35 to 44 Years | 24 (41.4%) | 16 (16.0%) |
| 45 to 54 Years | 51 (36.4%) | 25 (12.8%) |
| 55 to 64 Years | 16 (14.4%) | 49 (23.3%) |
| 65 to 74 Years | 5 (5.8%) | 26 (21.3%) |
| 75 Years and over | 6 (15.8%) | 8 (14.8%) |
| Total | 164 (18.7%) | 258 (24.3%) |
Income Above Poverty by Sex and Age in Calhoun Falls
According to the poverty statistics in Calhoun Falls, males aged 5 years and females aged 18 to 24 years are the age groups that are most secure financially, with 100.0% of males and 100.0% of females in these age groups living above the poverty line.
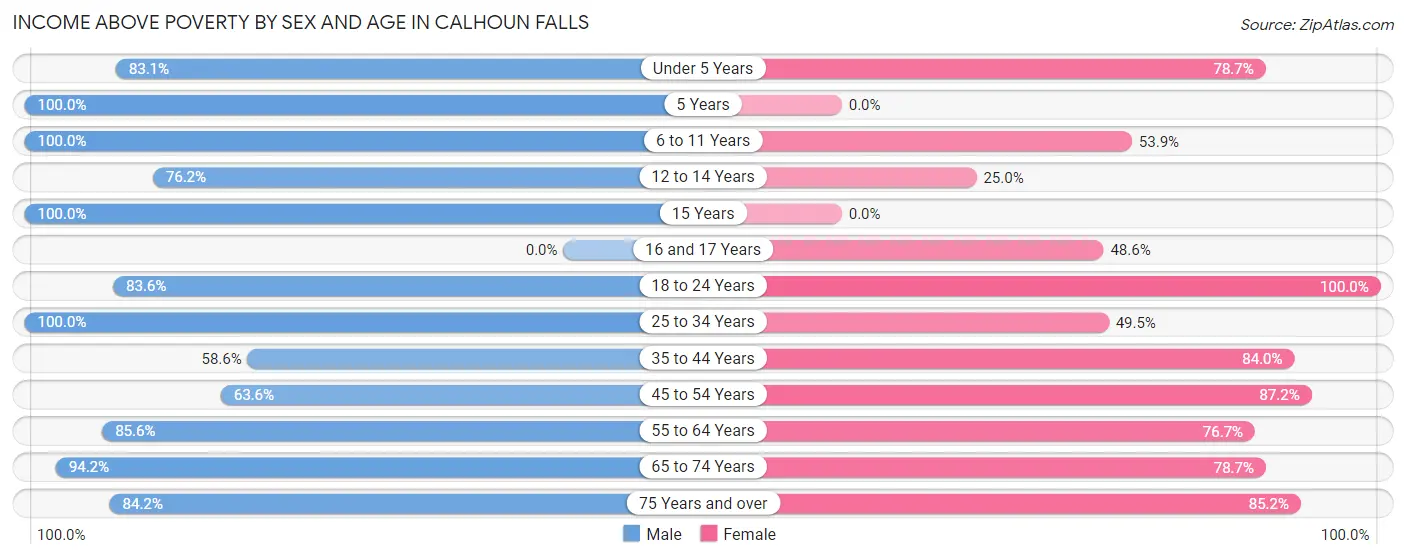
| Age Bracket | Male | Female |
| Under 5 Years | 49 (83.1%) | 70 (78.6%) |
| 5 Years | 15 (100.0%) | 0 (0.0%) |
| 6 to 11 Years | 47 (100.0%) | 28 (53.8%) |
| 12 to 14 Years | 32 (76.2%) | 6 (25.0%) |
| 15 Years | 3 (100.0%) | 0 (0.0%) |
| 16 and 17 Years | 0 (0.0%) | 17 (48.6%) |
| 18 to 24 Years | 183 (83.6%) | 73 (100.0%) |
| 25 to 34 Years | 52 (100.0%) | 54 (49.5%) |
| 35 to 44 Years | 34 (58.6%) | 84 (84.0%) |
| 45 to 54 Years | 89 (63.6%) | 170 (87.2%) |
| 55 to 64 Years | 95 (85.6%) | 161 (76.7%) |
| 65 to 74 Years | 81 (94.2%) | 96 (78.7%) |
| 75 Years and over | 32 (84.2%) | 46 (85.2%) |
| Total | 712 (81.3%) | 805 (75.7%) |
Income Below Poverty Among Married-Couple Families in Calhoun Falls
The poverty statistics for married-couple families in Calhoun Falls show that 1.2% or 2 of the total 162 families live below the poverty line. Families with no children have the highest poverty rate of 1.7%, comprising of 2 families. On the other hand, families with 1 or 2 children have the lowest poverty rate of 0.0%, which includes 0 families.
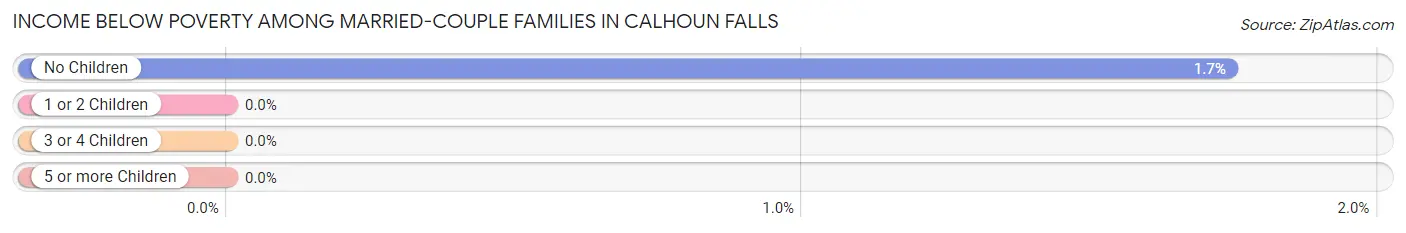
| Children | Above Poverty | Below Poverty |
| No Children | 113 (98.3%) | 2 (1.7%) |
| 1 or 2 Children | 47 (100.0%) | 0 (0.0%) |
| 3 or 4 Children | 0 (0.0%) | 0 (0.0%) |
| 5 or more Children | 0 (0.0%) | 0 (0.0%) |
| Total | 160 (98.8%) | 2 (1.2%) |
Income Below Poverty Among Single-Parent Households in Calhoun Falls
According to the poverty data in Calhoun Falls, 37.1% or 23 single-father households and 13.4% or 25 single-mother households are living below the poverty line. Among single-father households, those with 1 or 2 children have the highest poverty rate, with 12 households (41.4%) experiencing poverty. Likewise, among single-mother households, those with 3 or 4 children have the highest poverty rate, with 16 households (61.5%) falling below the poverty line.
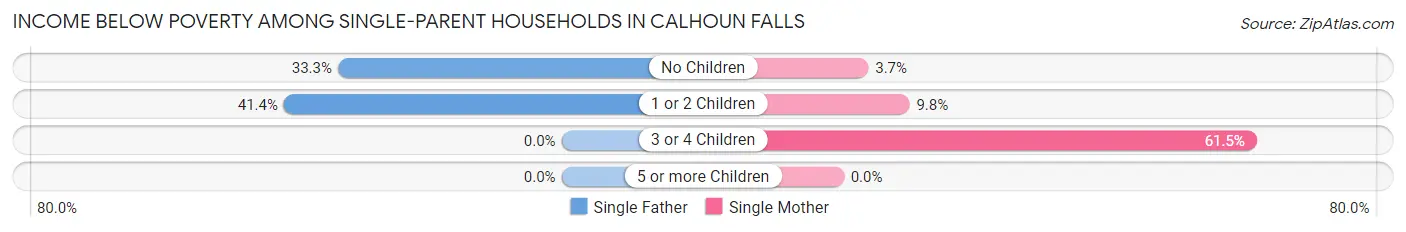
| Children | Single Father | Single Mother |
| No Children | 11 (33.3%) | 4 (3.7%) |
| 1 or 2 Children | 12 (41.4%) | 5 (9.8%) |
| 3 or 4 Children | 0 (0.0%) | 16 (61.5%) |
| 5 or more Children | 0 (0.0%) | 0 (0.0%) |
| Total | 23 (37.1%) | 25 (13.4%) |
Income Below Poverty Among Married-Couple vs Single-Parent Households in Calhoun Falls
The poverty data for Calhoun Falls shows that 2 of the married-couple family households (1.2%) and 48 of the single-parent households (19.4%) are living below the poverty level. Within the married-couple family households, those with no children have the highest poverty rate, with 2 households (1.7%) falling below the poverty line. Among the single-parent households, those with 3 or 4 children have the highest poverty rate, with 16 household (61.5%) living below poverty.
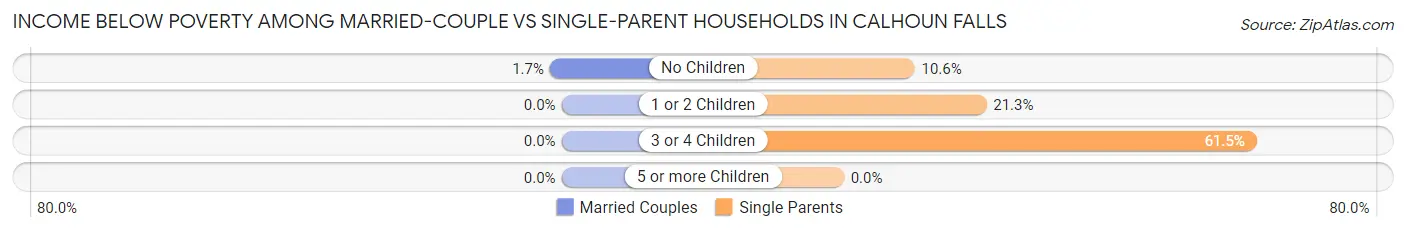
| Children | Married-Couple Families | Single-Parent Households |
| No Children | 2 (1.7%) | 15 (10.6%) |
| 1 or 2 Children | 0 (0.0%) | 17 (21.2%) |
| 3 or 4 Children | 0 (0.0%) | 16 (61.5%) |
| 5 or more Children | 0 (0.0%) | 0 (0.0%) |
| Total | 2 (1.2%) | 48 (19.4%) |
Race in Calhoun Falls
The most populous races in Calhoun Falls are Black / African American (1,162 | 59.9%), White / Caucasian (711 | 36.7%), and Two or more Races (66 | 3.4%).
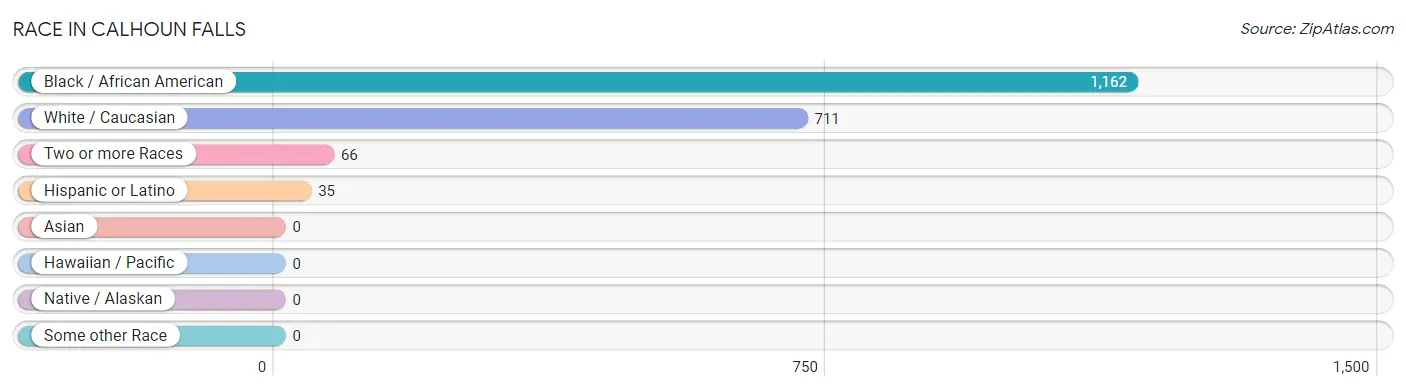
| Race | # Population | % Population |
| Asian | 0 | 0.0% |
| Black / African American | 1,162 | 59.9% |
| Hawaiian / Pacific | 0 | 0.0% |
| Hispanic or Latino | 35 | 1.8% |
| Native / Alaskan | 0 | 0.0% |
| White / Caucasian | 711 | 36.7% |
| Two or more Races | 66 | 3.4% |
| Some other Race | 0 | 0.0% |
| Total | 1,939 | 100.0% |
Ancestry in Calhoun Falls
The most populous ancestries reported in Calhoun Falls are African (64 | 3.3%), Subsaharan African (64 | 3.3%), Irish (43 | 2.2%), American (35 | 1.8%), and Mexican (35 | 1.8%), together accounting for 12.4% of all Calhoun Falls residents.
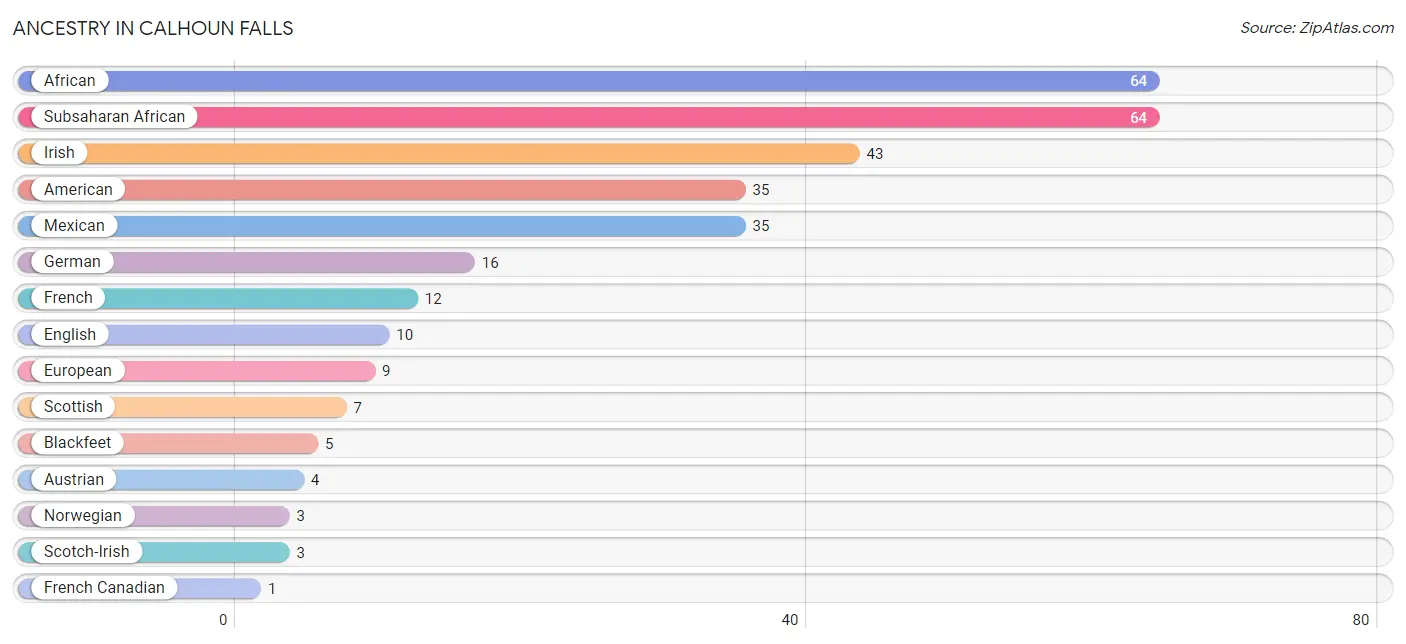
| Ancestry | # Population | % Population |
| African | 64 | 3.3% |
| American | 35 | 1.8% |
| Austrian | 4 | 0.2% |
| Blackfeet | 5 | 0.3% |
| English | 10 | 0.5% |
| European | 9 | 0.5% |
| French | 12 | 0.6% |
| French Canadian | 1 | 0.1% |
| German | 16 | 0.8% |
| Irish | 43 | 2.2% |
| Mexican | 35 | 1.8% |
| Norwegian | 3 | 0.2% |
| Scotch-Irish | 3 | 0.2% |
| Scottish | 7 | 0.4% |
| Subsaharan African | 64 | 3.3% | View All 15 Rows |
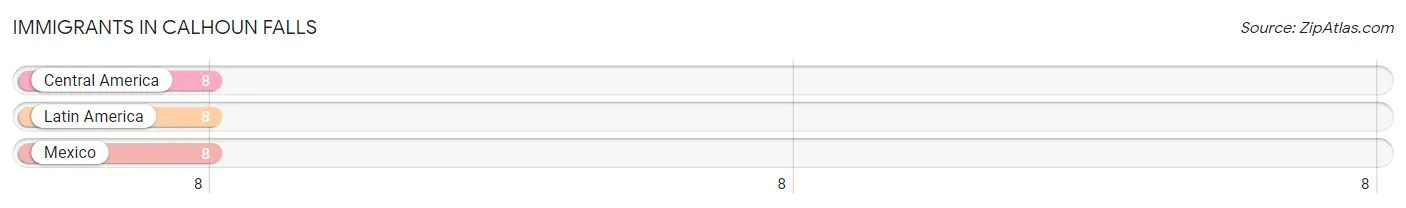
Immigrants in Calhoun Falls
The most numerous immigrant groups reported in Calhoun Falls came from Central America (8 | 0.4%), Latin America (8 | 0.4%), and Mexico (8 | 0.4%), together accounting for 1.2% of all Calhoun Falls residents.
| Immigration Origin | # Population | % Population |
| Central America | 8 | 0.4% |
| Latin America | 8 | 0.4% |
| Mexico | 8 | 0.4% | View All 3 Rows |
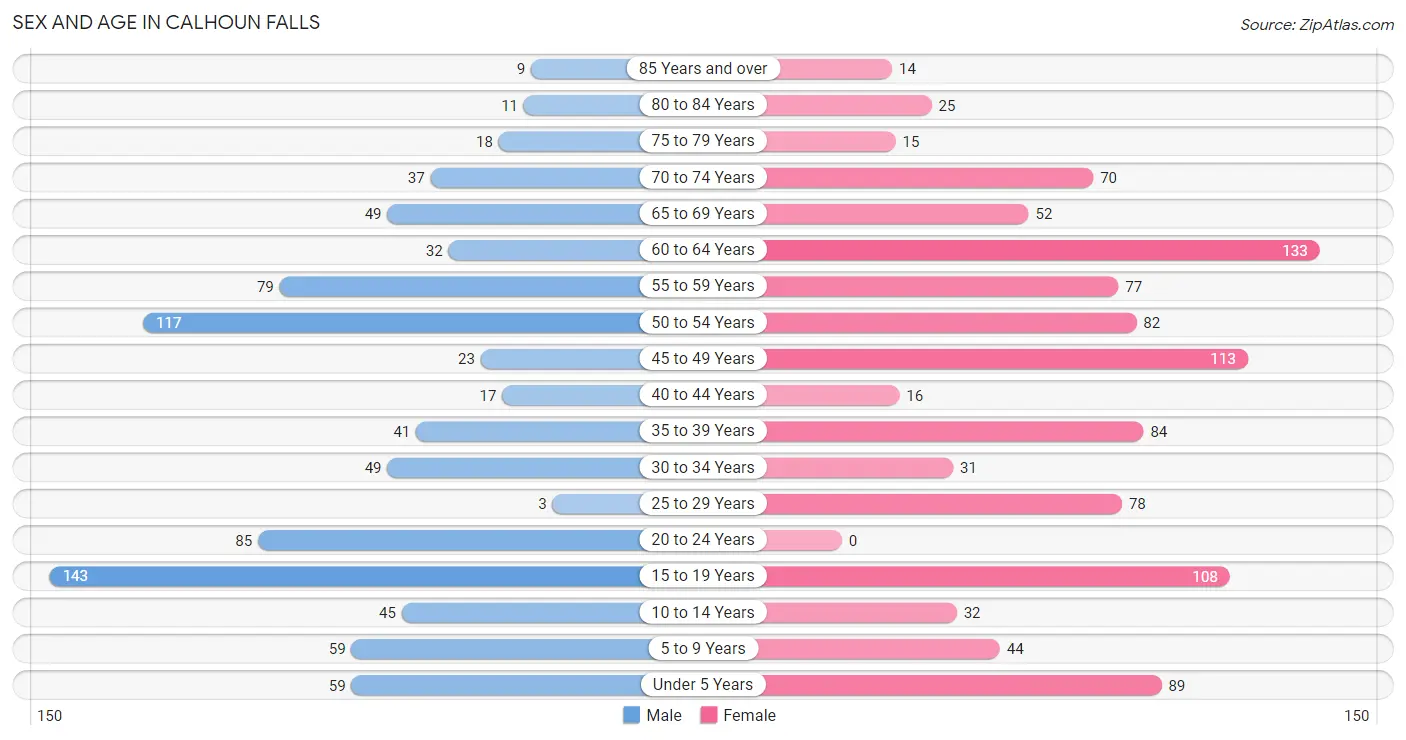
Sex and Age in Calhoun Falls
Sex and Age in Calhoun Falls
The most populous age groups in Calhoun Falls are 15 to 19 Years (143 | 16.3%) for men and 60 to 64 Years (133 | 12.5%) for women.
| Age Bracket | Male | Female |
| Under 5 Years | 59 (6.7%) | 89 (8.4%) |
| 5 to 9 Years | 59 (6.7%) | 44 (4.1%) |
| 10 to 14 Years | 45 (5.1%) | 32 (3.0%) |
| 15 to 19 Years | 143 (16.3%) | 108 (10.2%) |
| 20 to 24 Years | 85 (9.7%) | 0 (0.0%) |
| 25 to 29 Years | 3 (0.3%) | 78 (7.3%) |
| 30 to 34 Years | 49 (5.6%) | 31 (2.9%) |
| 35 to 39 Years | 41 (4.7%) | 84 (7.9%) |
| 40 to 44 Years | 17 (1.9%) | 16 (1.5%) |
| 45 to 49 Years | 23 (2.6%) | 113 (10.6%) |
| 50 to 54 Years | 117 (13.4%) | 82 (7.7%) |
| 55 to 59 Years | 79 (9.0%) | 77 (7.2%) |
| 60 to 64 Years | 32 (3.6%) | 133 (12.5%) |
| 65 to 69 Years | 49 (5.6%) | 52 (4.9%) |
| 70 to 74 Years | 37 (4.2%) | 70 (6.6%) |
| 75 to 79 Years | 18 (2.1%) | 15 (1.4%) |
| 80 to 84 Years | 11 (1.3%) | 25 (2.4%) |
| 85 Years and over | 9 (1.0%) | 14 (1.3%) |
| Total | 876 (100.0%) | 1,063 (100.0%) |
Families and Households in Calhoun Falls
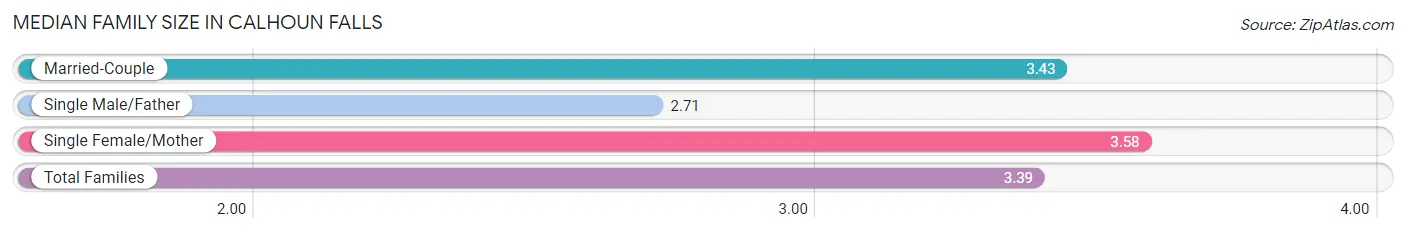
Median Family Size in Calhoun Falls
The median family size in Calhoun Falls is 3.39 persons per family, with single female/mother families (186 | 45.4%) accounting for the largest median family size of 3.58 persons per family. On the other hand, single male/father families (62 | 15.1%) represent the smallest median family size with 2.71 persons per family.
| Family Type | # Families | Family Size |
| Married-Couple | 162 (39.5%) | 3.43 |
| Single Male/Father | 62 (15.1%) | 2.71 |
| Single Female/Mother | 186 (45.4%) | 3.58 |
| Total Families | 410 (100.0%) | 3.39 |
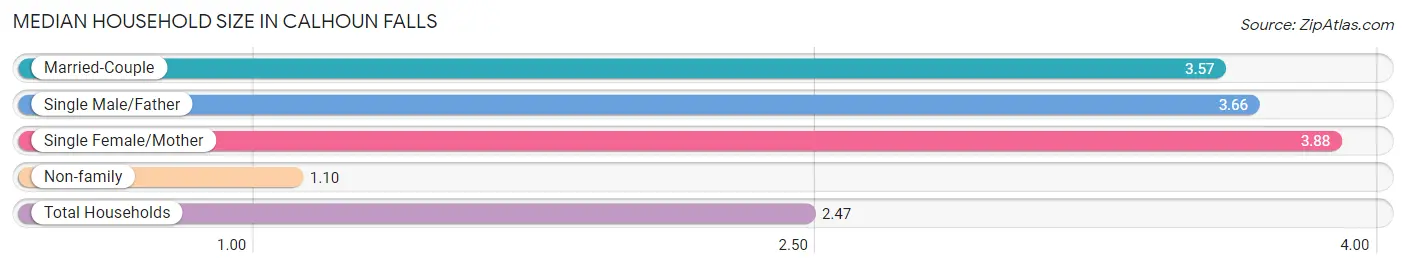
Median Household Size in Calhoun Falls
The median household size in Calhoun Falls is 2.47 persons per household, with single female/mother households (186 | 23.7%) accounting for the largest median household size of 3.88 persons per household. non-family households (375 | 47.8%) represent the smallest median household size with 1.10 persons per household.
| Household Type | # Households | Household Size |
| Married-Couple | 162 (20.6%) | 3.57 |
| Single Male/Father | 62 (7.9%) | 3.66 |
| Single Female/Mother | 186 (23.7%) | 3.88 |
| Non-family | 375 (47.8%) | 1.10 |
| Total Households | 785 (100.0%) | 2.47 |
Household Size by Marriage Status in Calhoun Falls
Out of a total of 785 households in Calhoun Falls, 410 (52.2%) are family households, while 375 (47.8%) are nonfamily households. The most numerous type of family households are 4-person households, comprising 175, and the most common type of nonfamily households are 1-person households, comprising 336.
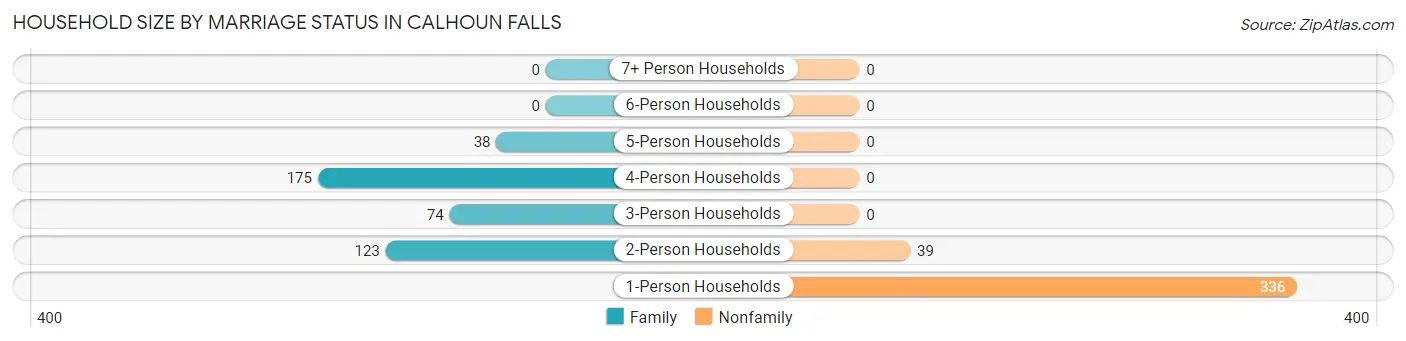
| Household Size | Family Households | Nonfamily Households |
| 1-Person Households | - | 336 (42.8%) |
| 2-Person Households | 123 (15.7%) | 39 (5.0%) |
| 3-Person Households | 74 (9.4%) | 0 (0.0%) |
| 4-Person Households | 175 (22.3%) | 0 (0.0%) |
| 5-Person Households | 38 (4.8%) | 0 (0.0%) |
| 6-Person Households | 0 (0.0%) | 0 (0.0%) |
| 7+ Person Households | 0 (0.0%) | 0 (0.0%) |
| Total | 410 (52.2%) | 375 (47.8%) |
Female Fertility in Calhoun Falls
Fertility by Age in Calhoun Falls
Average fertility rate in Calhoun Falls is 11.0 births per 1,000 women. Women in the age bracket of 20 to 34 years have the highest fertility rate with 46.0 births per 1,000 women. Women in the age bracket of 20 to 34 years acount for 100.0% of all women with births.
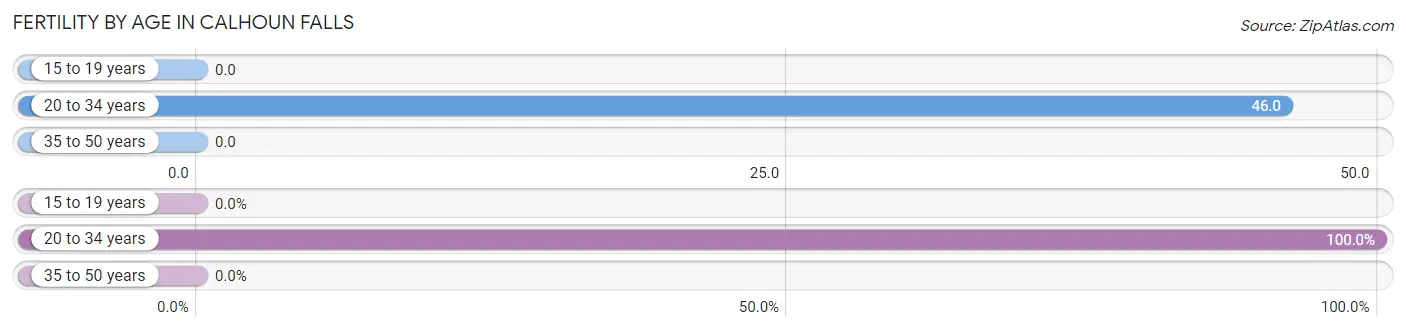
| Age Bracket | Women with Births | Births / 1,000 Women |
| 15 to 19 years | 0 (0.0%) | 0.0 |
| 20 to 34 years | 5 (100.0%) | 46.0 |
| 35 to 50 years | 0 (0.0%) | 0.0 |
| Total | 5 (100.0%) | 11.0 |
Fertility by Age by Marriage Status in Calhoun Falls
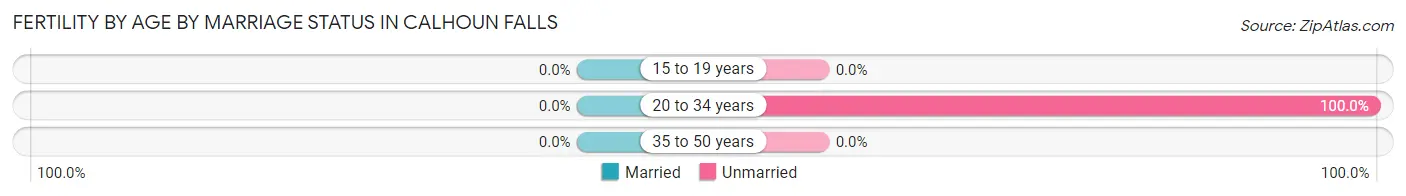
| Age Bracket | Married | Unmarried |
| 15 to 19 years | 0 (0.0%) | 0 (0.0%) |
| 20 to 34 years | 0 (0.0%) | 5 (100.0%) |
| 35 to 50 years | 0 (0.0%) | 0 (0.0%) |
| Total | 0 (0.0%) | 5 (100.0%) |
Fertility by Education in Calhoun Falls
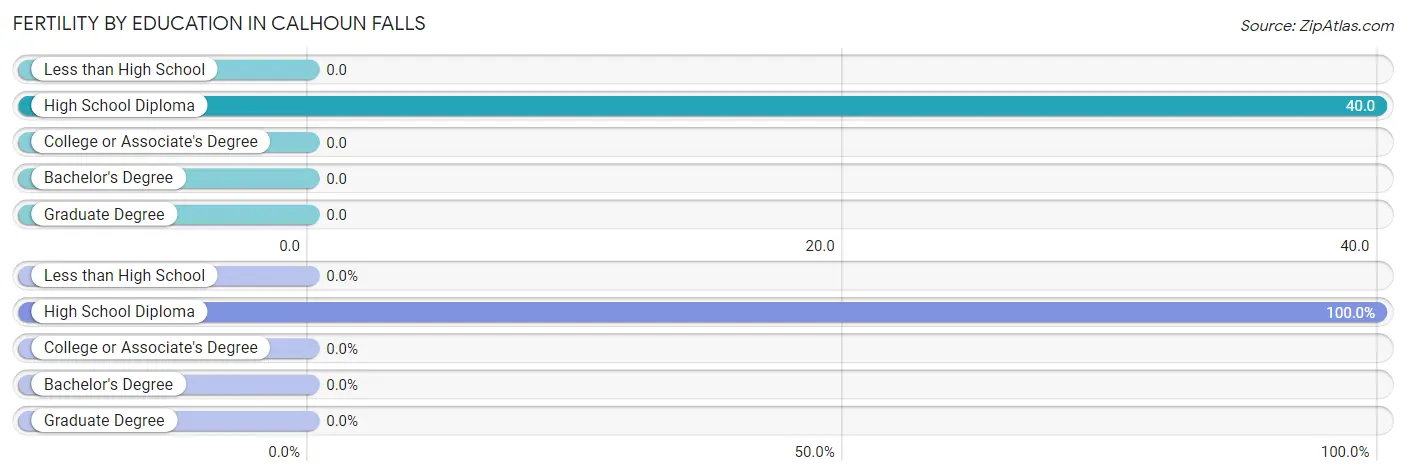
| Educational Attainment | Women with Births | Births / 1,000 Women |
| Less than High School | 0 (0.0%) | 0.0 |
| High School Diploma | 5 (100.0%) | 40.0 |
| College or Associate's Degree | 0 (0.0%) | 0.0 |
| Bachelor's Degree | 0 (0.0%) | 0.0 |
| Graduate Degree | 0 (0.0%) | 0.0 |
| Total | 5 (100.0%) | 11.0 |
Fertility by Education by Marriage Status in Calhoun Falls
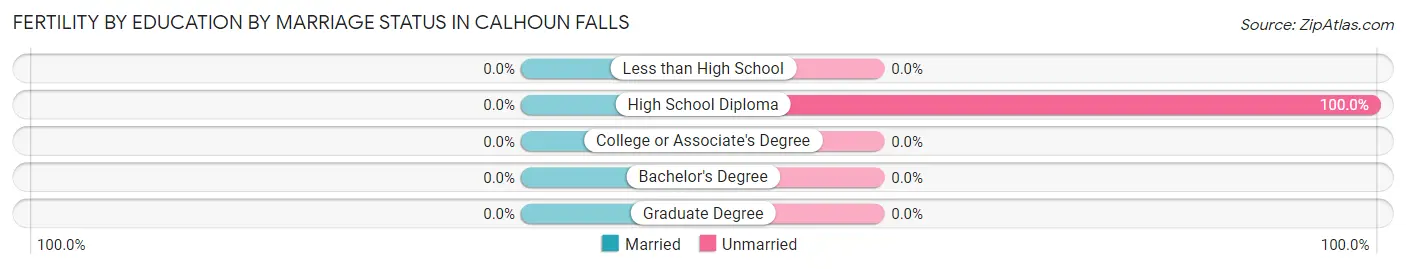
| Educational Attainment | Married | Unmarried |
| Less than High School | 0 (0.0%) | 0 (0.0%) |
| High School Diploma | 0 (0.0%) | 5 (100.0%) |
| College or Associate's Degree | 0 (0.0%) | 0 (0.0%) |
| Bachelor's Degree | 0 (0.0%) | 0 (0.0%) |
| Graduate Degree | 0 (0.0%) | 0 (0.0%) |
| Total | 0 (0.0%) | 5 (100.0%) |
Employment Characteristics in Calhoun Falls
Employment by Class of Employer in Calhoun Falls
Among the 756 employed individuals in Calhoun Falls, private company employees (525 | 69.4%), state government employees (147 | 19.4%), and not-for-profit organizations (38 | 5.0%) make up the most common classes of employment.
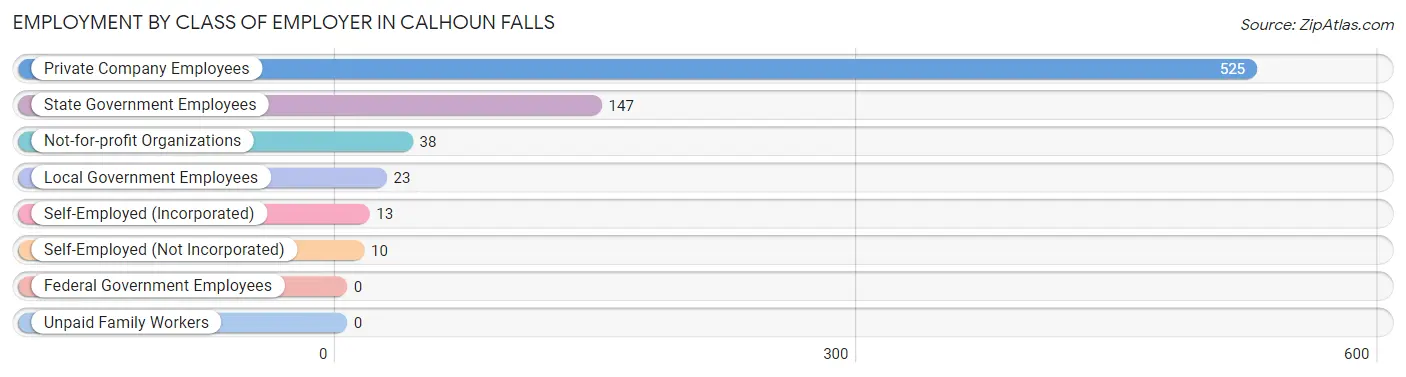
| Employer Class | # Employees | % Employees |
| Private Company Employees | 525 | 69.4% |
| Self-Employed (Incorporated) | 13 | 1.7% |
| Self-Employed (Not Incorporated) | 10 | 1.3% |
| Not-for-profit Organizations | 38 | 5.0% |
| Local Government Employees | 23 | 3.0% |
| State Government Employees | 147 | 19.4% |
| Federal Government Employees | 0 | 0.0% |
| Unpaid Family Workers | 0 | 0.0% |
| Total | 756 | 100.0% |
Employment Status by Age in Calhoun Falls
According to the labor force statistics for Calhoun Falls, out of the total population over 16 years of age (1,608), 49.7% or 799 individuals are in the labor force, with 3.0% or 24 of them unemployed. The age group with the highest labor force participation rate is 35 to 44 years, with 91.1% or 144 individuals in the labor force. Within the labor force, the 35 to 44 years age range has the highest percentage of unemployed individuals, with 10.4% or 15 of them being unemployed.
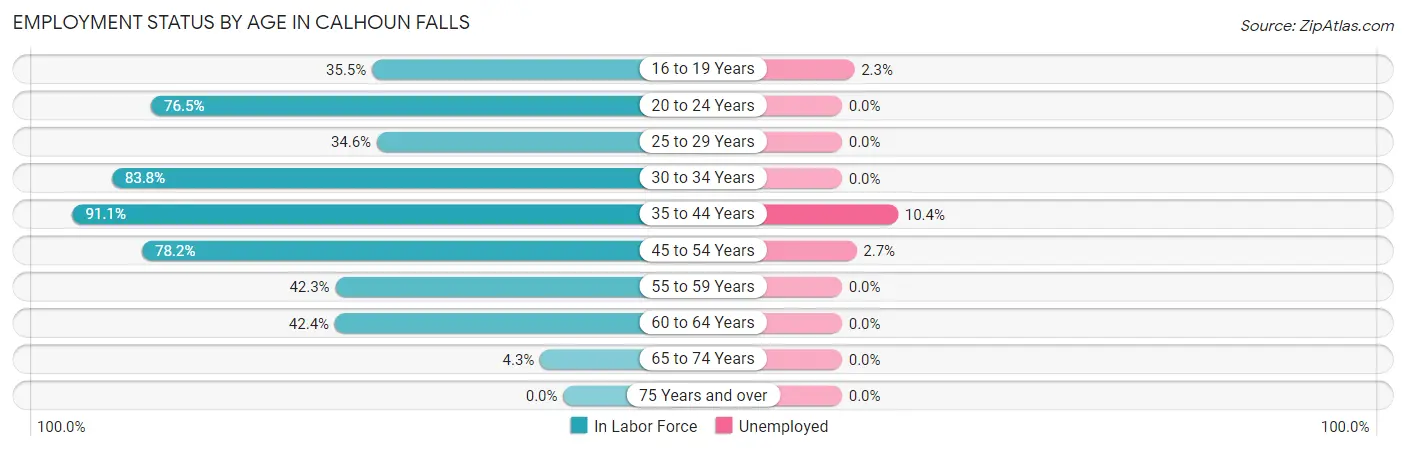
| Age Bracket | In Labor Force | Unemployed |
| 16 to 19 Years | 88 (35.5%) | 2 (2.3%) |
| 20 to 24 Years | 65 (76.5%) | 0 (0.0%) |
| 25 to 29 Years | 28 (34.6%) | 0 (0.0%) |
| 30 to 34 Years | 67 (83.8%) | 0 (0.0%) |
| 35 to 44 Years | 144 (91.1%) | 15 (10.4%) |
| 45 to 54 Years | 262 (78.2%) | 7 (2.7%) |
| 55 to 59 Years | 66 (42.3%) | 0 (0.0%) |
| 60 to 64 Years | 70 (42.4%) | 0 (0.0%) |
| 65 to 74 Years | 9 (4.3%) | 0 (0.0%) |
| 75 Years and over | 0 (0.0%) | 0 (0.0%) |
| Total | 799 (49.7%) | 24 (3.0%) |
Employment Status by Educational Attainment in Calhoun Falls
According to labor force statistics for Calhoun Falls, 65.3% of individuals (637) out of the total population between 25 and 64 years of age (975) are in the labor force, with 3.5% or 22 of them being unemployed. The group with the highest labor force participation rate are those with the educational attainment of bachelor's degree or higher, with 88.8% or 119 individuals in the labor force. Within the labor force, individuals with bachelor's degree or higher education have the highest percentage of unemployment, with 9.2% or 11 of them being unemployed.
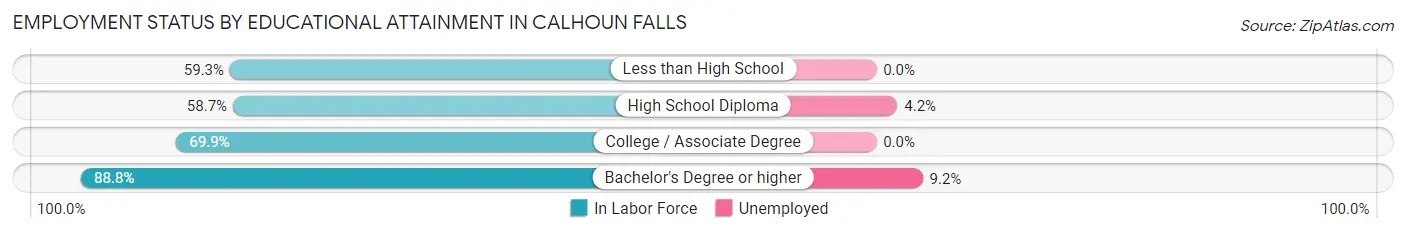
| Educational Attainment | In Labor Force | Unemployed |
| Less than High School | 108 (59.3%) | 0 (0.0%) |
| High School Diploma | 264 (58.7%) | 19 (4.2%) |
| College / Associate Degree | 146 (69.9%) | 0 (0.0%) |
| Bachelor's Degree or higher | 119 (88.8%) | 12 (9.2%) |
| Total | 637 (65.3%) | 34 (3.5%) |
Employment Occupations by Sex in Calhoun Falls
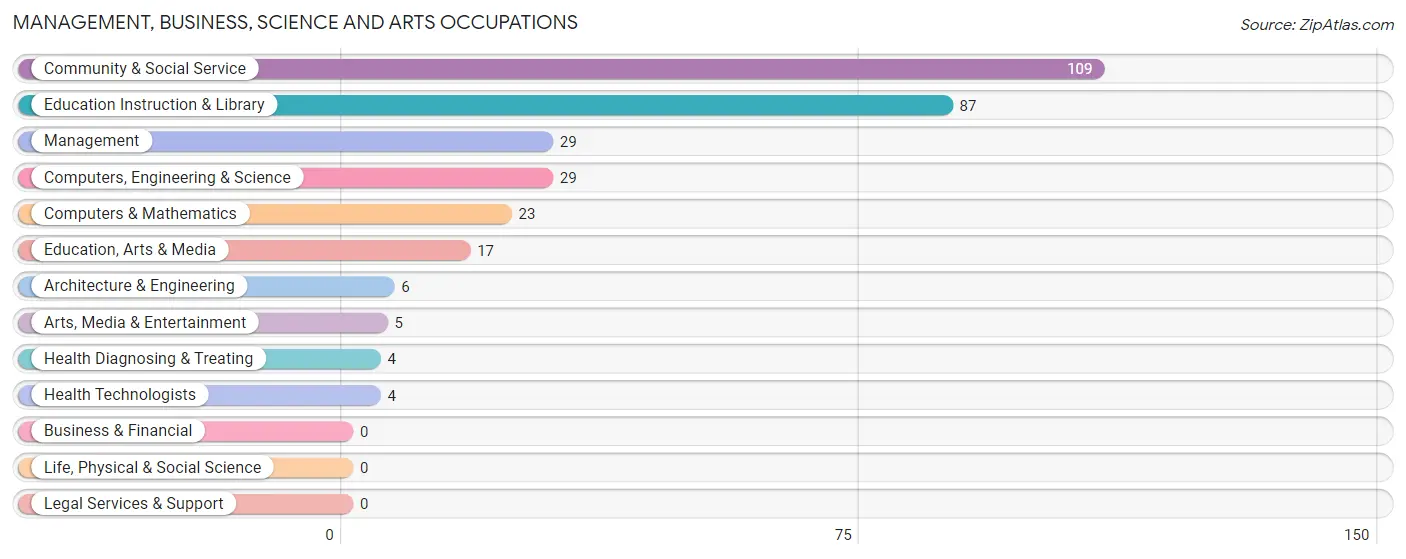
Management, Business, Science and Arts Occupations
The most common Management, Business, Science and Arts occupations in Calhoun Falls are Community & Social Service (109 | 14.1%), Education Instruction & Library (87 | 11.2%), Management (29 | 3.7%), Computers, Engineering & Science (29 | 3.7%), and Computers & Mathematics (23 | 3.0%).
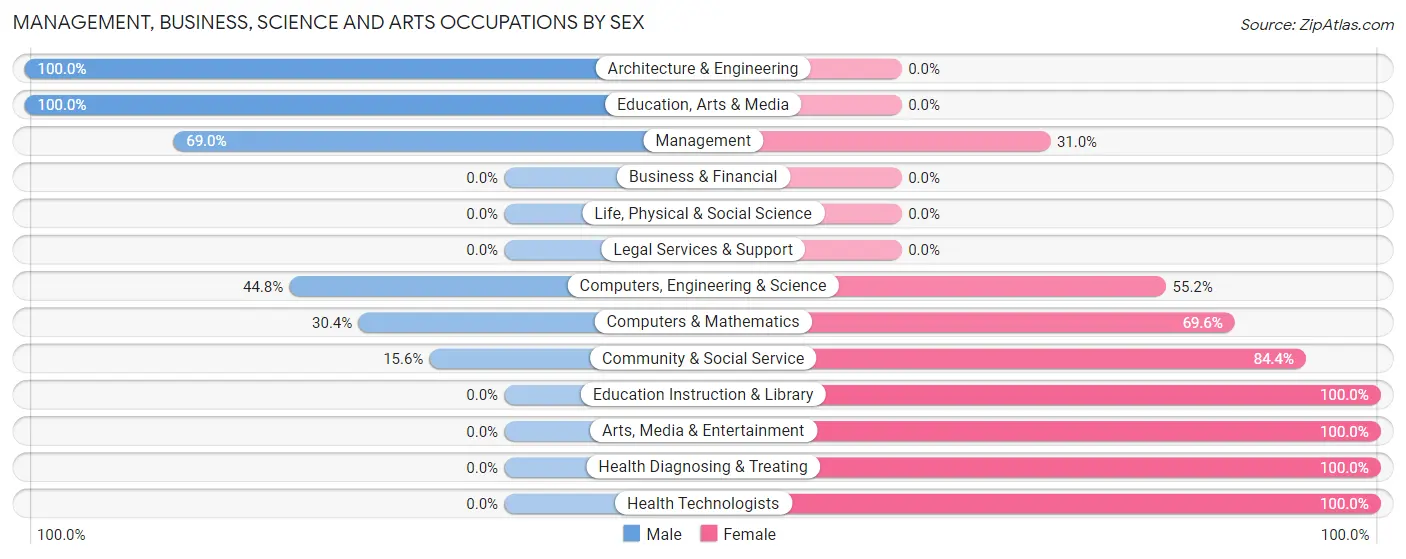
Management, Business, Science and Arts Occupations by Sex
Within the Management, Business, Science and Arts occupations in Calhoun Falls, the most male-oriented occupations are Architecture & Engineering (100.0%), Education, Arts & Media (100.0%), and Management (69.0%), while the most female-oriented occupations are Education Instruction & Library (100.0%), Arts, Media & Entertainment (100.0%), and Health Diagnosing & Treating (100.0%).
| Occupation | Male | Female |
| Management | 20 (69.0%) | 9 (31.0%) |
| Business & Financial | 0 (0.0%) | 0 (0.0%) |
| Computers, Engineering & Science | 13 (44.8%) | 16 (55.2%) |
| Computers & Mathematics | 7 (30.4%) | 16 (69.6%) |
| Architecture & Engineering | 6 (100.0%) | 0 (0.0%) |
| Life, Physical & Social Science | 0 (0.0%) | 0 (0.0%) |
| Community & Social Service | 17 (15.6%) | 92 (84.4%) |
| Education, Arts & Media | 17 (100.0%) | 0 (0.0%) |
| Legal Services & Support | 0 (0.0%) | 0 (0.0%) |
| Education Instruction & Library | 0 (0.0%) | 87 (100.0%) |
| Arts, Media & Entertainment | 0 (0.0%) | 5 (100.0%) |
| Health Diagnosing & Treating | 0 (0.0%) | 4 (100.0%) |
| Health Technologists | 0 (0.0%) | 4 (100.0%) |
| Total (Category) | 50 (29.2%) | 121 (70.8%) |
| Total (Overall) | 314 (40.5%) | 461 (59.5%) |
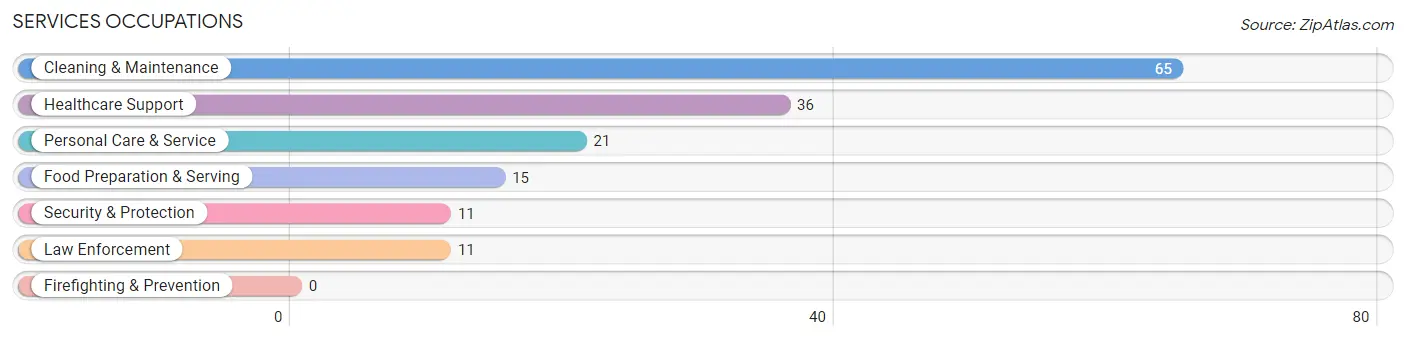
Services Occupations
The most common Services occupations in Calhoun Falls are Cleaning & Maintenance (65 | 8.4%), Healthcare Support (36 | 4.6%), Personal Care & Service (21 | 2.7%), Food Preparation & Serving (15 | 1.9%), and Security & Protection (11 | 1.4%).
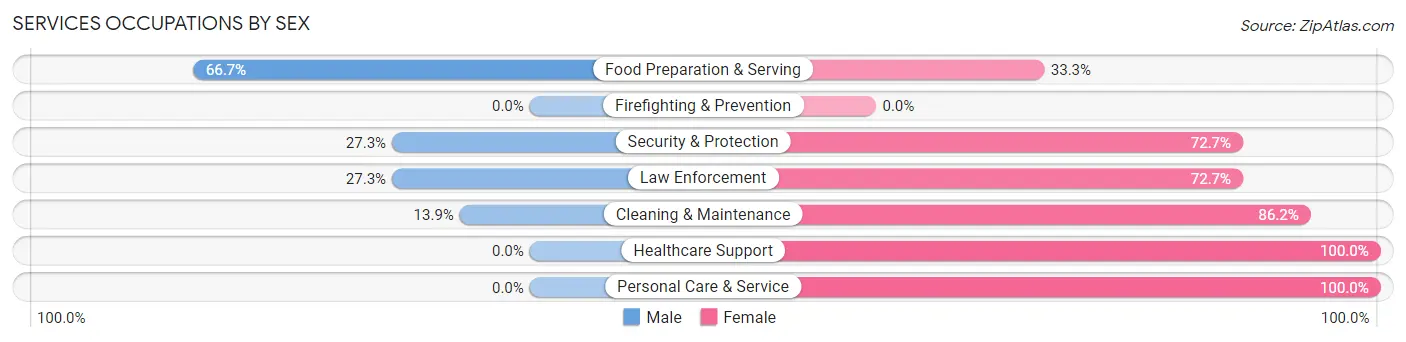
Services Occupations by Sex
Within the Services occupations in Calhoun Falls, the most male-oriented occupations are Food Preparation & Serving (66.7%), Security & Protection (27.3%), and Law Enforcement (27.3%), while the most female-oriented occupations are Healthcare Support (100.0%), Personal Care & Service (100.0%), and Cleaning & Maintenance (86.2%).
| Occupation | Male | Female |
| Healthcare Support | 0 (0.0%) | 36 (100.0%) |
| Security & Protection | 3 (27.3%) | 8 (72.7%) |
| Firefighting & Prevention | 0 (0.0%) | 0 (0.0%) |
| Law Enforcement | 3 (27.3%) | 8 (72.7%) |
| Food Preparation & Serving | 10 (66.7%) | 5 (33.3%) |
| Cleaning & Maintenance | 9 (13.9%) | 56 (86.2%) |
| Personal Care & Service | 0 (0.0%) | 21 (100.0%) |
| Total (Category) | 22 (14.9%) | 126 (85.1%) |
| Total (Overall) | 314 (40.5%) | 461 (59.5%) |
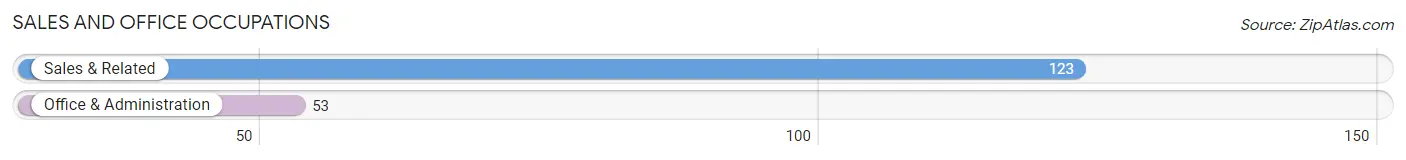
Sales and Office Occupations
The most common Sales and Office occupations in Calhoun Falls are Sales & Related (123 | 15.9%), and Office & Administration (53 | 6.8%).
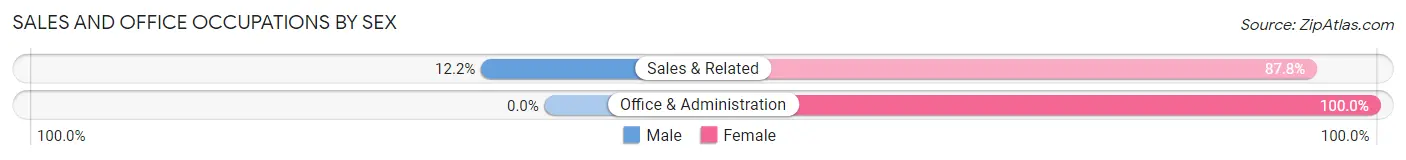
Sales and Office Occupations by Sex
| Occupation | Male | Female |
| Sales & Related | 15 (12.2%) | 108 (87.8%) |
| Office & Administration | 0 (0.0%) | 53 (100.0%) |
| Total (Category) | 15 (8.5%) | 161 (91.5%) |
| Total (Overall) | 314 (40.5%) | 461 (59.5%) |
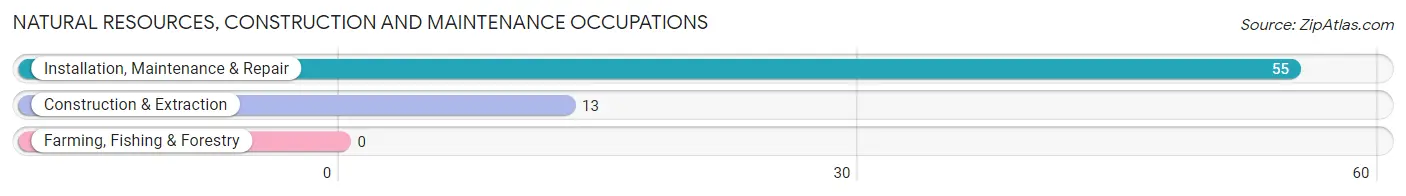
Natural Resources, Construction and Maintenance Occupations
The most common Natural Resources, Construction and Maintenance occupations in Calhoun Falls are Installation, Maintenance & Repair (55 | 7.1%), and Construction & Extraction (13 | 1.7%).
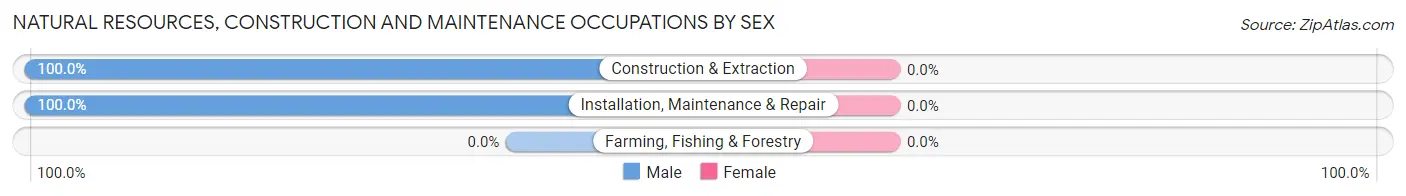
Natural Resources, Construction and Maintenance Occupations by Sex
| Occupation | Male | Female |
| Farming, Fishing & Forestry | 0 (0.0%) | 0 (0.0%) |
| Construction & Extraction | 13 (100.0%) | 0 (0.0%) |
| Installation, Maintenance & Repair | 55 (100.0%) | 0 (0.0%) |
| Total (Category) | 68 (100.0%) | 0 (0.0%) |
| Total (Overall) | 314 (40.5%) | 461 (59.5%) |
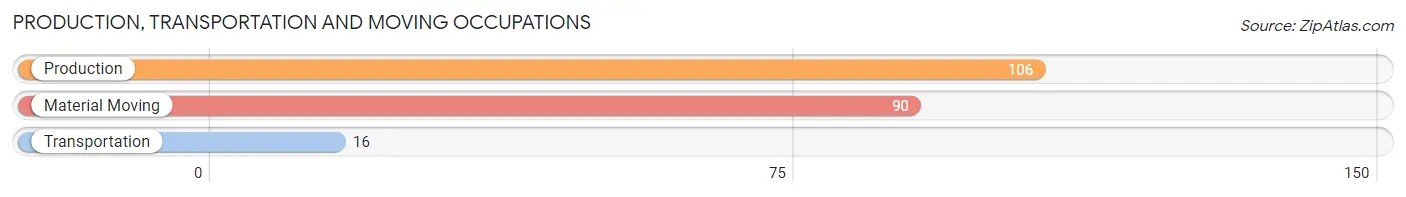
Production, Transportation and Moving Occupations
The most common Production, Transportation and Moving occupations in Calhoun Falls are Production (106 | 13.7%), Material Moving (90 | 11.6%), and Transportation (16 | 2.1%).
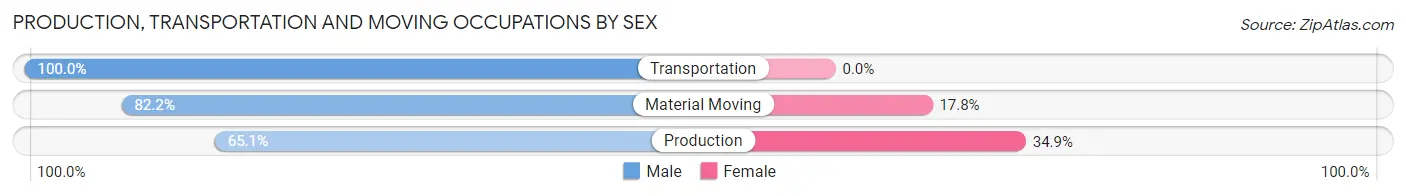
Production, Transportation and Moving Occupations by Sex
| Occupation | Male | Female |
| Production | 69 (65.1%) | 37 (34.9%) |
| Transportation | 16 (100.0%) | 0 (0.0%) |
| Material Moving | 74 (82.2%) | 16 (17.8%) |
| Total (Category) | 159 (75.0%) | 53 (25.0%) |
| Total (Overall) | 314 (40.5%) | 461 (59.5%) |
Employment Industries by Sex in Calhoun Falls
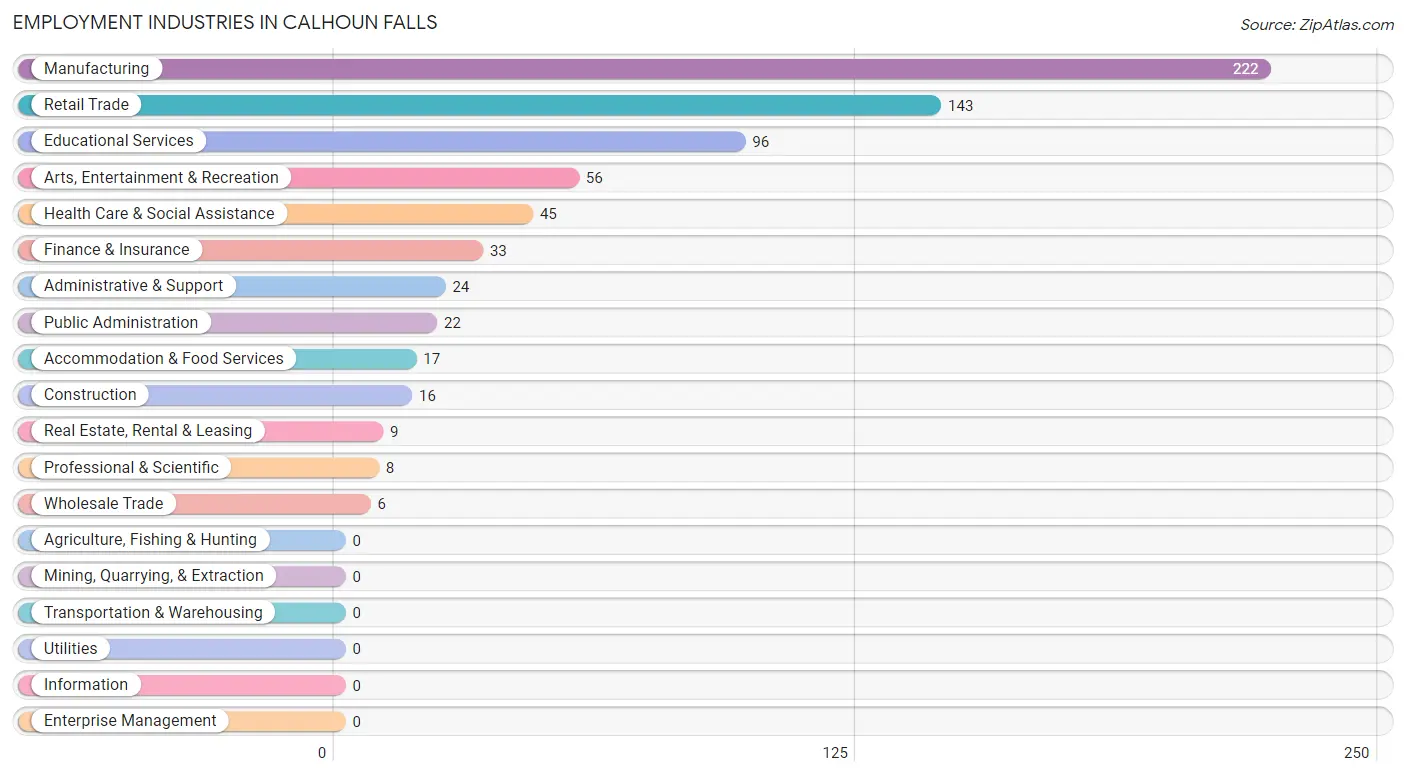
Employment Industries in Calhoun Falls
The major employment industries in Calhoun Falls include Manufacturing (222 | 28.6%), Retail Trade (143 | 18.4%), Educational Services (96 | 12.4%), Arts, Entertainment & Recreation (56 | 7.2%), and Health Care & Social Assistance (45 | 5.8%).
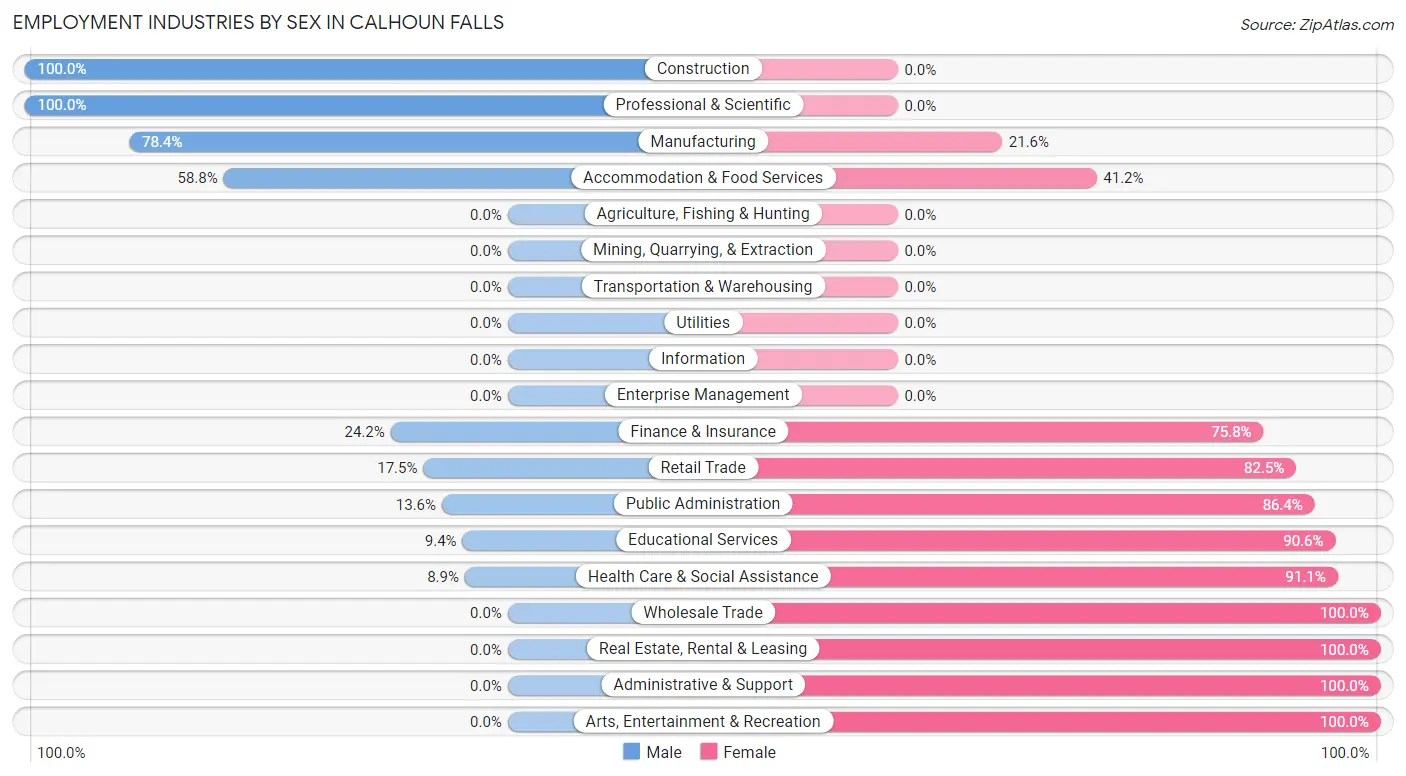
Employment Industries by Sex in Calhoun Falls
The Calhoun Falls industries that see more men than women are Construction (100.0%), Professional & Scientific (100.0%), and Manufacturing (78.4%), whereas the industries that tend to have a higher number of women are Wholesale Trade (100.0%), Real Estate, Rental & Leasing (100.0%), and Administrative & Support (100.0%).
| Industry | Male | Female |
| Agriculture, Fishing & Hunting | 0 (0.0%) | 0 (0.0%) |
| Mining, Quarrying, & Extraction | 0 (0.0%) | 0 (0.0%) |
| Construction | 16 (100.0%) | 0 (0.0%) |
| Manufacturing | 174 (78.4%) | 48 (21.6%) |
| Wholesale Trade | 0 (0.0%) | 6 (100.0%) |
| Retail Trade | 25 (17.5%) | 118 (82.5%) |
| Transportation & Warehousing | 0 (0.0%) | 0 (0.0%) |
| Utilities | 0 (0.0%) | 0 (0.0%) |
| Information | 0 (0.0%) | 0 (0.0%) |
| Finance & Insurance | 8 (24.2%) | 25 (75.8%) |
| Real Estate, Rental & Leasing | 0 (0.0%) | 9 (100.0%) |
| Professional & Scientific | 8 (100.0%) | 0 (0.0%) |
| Enterprise Management | 0 (0.0%) | 0 (0.0%) |
| Administrative & Support | 0 (0.0%) | 24 (100.0%) |
| Educational Services | 9 (9.4%) | 87 (90.6%) |
| Health Care & Social Assistance | 4 (8.9%) | 41 (91.1%) |
| Arts, Entertainment & Recreation | 0 (0.0%) | 56 (100.0%) |
| Accommodation & Food Services | 10 (58.8%) | 7 (41.2%) |
| Public Administration | 3 (13.6%) | 19 (86.4%) |
| Total | 314 (40.5%) | 461 (59.5%) |
Education in Calhoun Falls
School Enrollment in Calhoun Falls
The most common levels of schooling among the 484 students in Calhoun Falls are high school (241 | 49.8%), college / undergraduate (68 | 14.1%), and elementary school (66 | 13.6%).
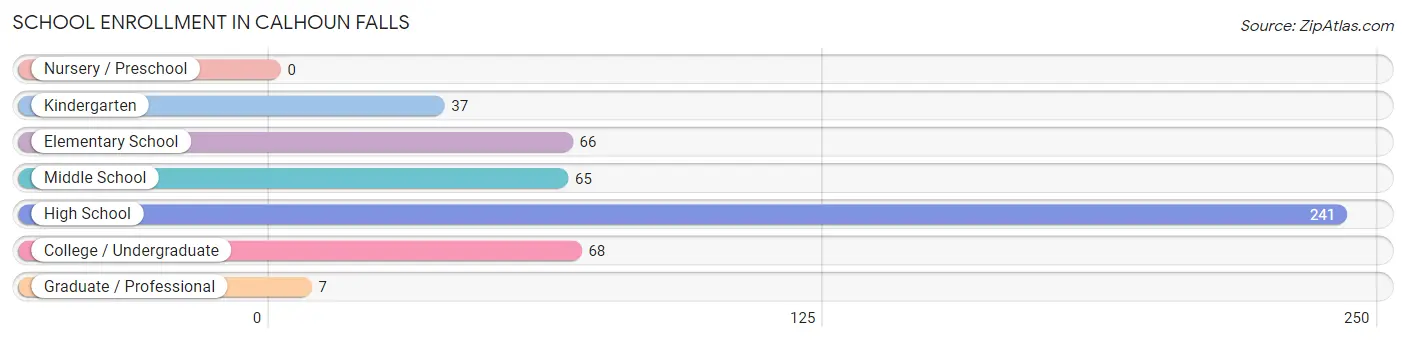
| School Level | # Students | % Students |
| Nursery / Preschool | 0 | 0.0% |
| Kindergarten | 37 | 7.6% |
| Elementary School | 66 | 13.6% |
| Middle School | 65 | 13.4% |
| High School | 241 | 49.8% |
| College / Undergraduate | 68 | 14.1% |
| Graduate / Professional | 7 | 1.5% |
| Total | 484 | 100.0% |
School Enrollment by Age by Funding Source in Calhoun Falls
Out of a total of 484 students who are enrolled in schools in Calhoun Falls, 46 (9.5%) attend a private institution, while the remaining 438 (90.5%) are enrolled in public schools. The age group of 25 to 34 year olds has the highest likelihood of being enrolled in private schools, with 6 (100.0% in the age bracket) enrolled. Conversely, the age group of 15 to 17 year olds has the lowest likelihood of being enrolled in a private school, with 38 (100.0% in the age bracket) attending a public institution.
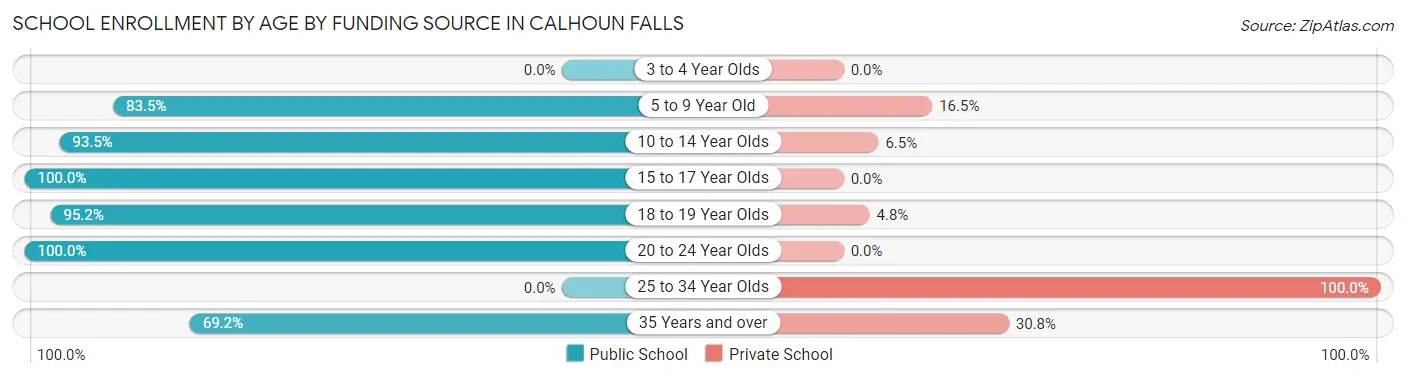
| Age Bracket | Public School | Private School |
| 3 to 4 Year Olds | 0 (0.0%) | 0 (0.0%) |
| 5 to 9 Year Old | 86 (83.5%) | 17 (16.5%) |
| 10 to 14 Year Olds | 72 (93.5%) | 5 (6.5%) |
| 15 to 17 Year Olds | 38 (100.0%) | 0 (0.0%) |
| 18 to 19 Year Olds | 197 (95.2%) | 10 (4.8%) |
| 20 to 24 Year Olds | 27 (100.0%) | 0 (0.0%) |
| 25 to 34 Year Olds | 0 (0.0%) | 6 (100.0%) |
| 35 Years and over | 18 (69.2%) | 8 (30.8%) |
| Total | 438 (90.5%) | 46 (9.5%) |
Educational Attainment by Field of Study in Calhoun Falls
Education (114 | 69.5%), social sciences (16 | 9.8%), bio, nature & agricultural (9 | 5.5%), science & technology (9 | 5.5%), and arts & humanities (7 | 4.3%) are the most common fields of study among 164 individuals in Calhoun Falls who have obtained a bachelor's degree or higher.
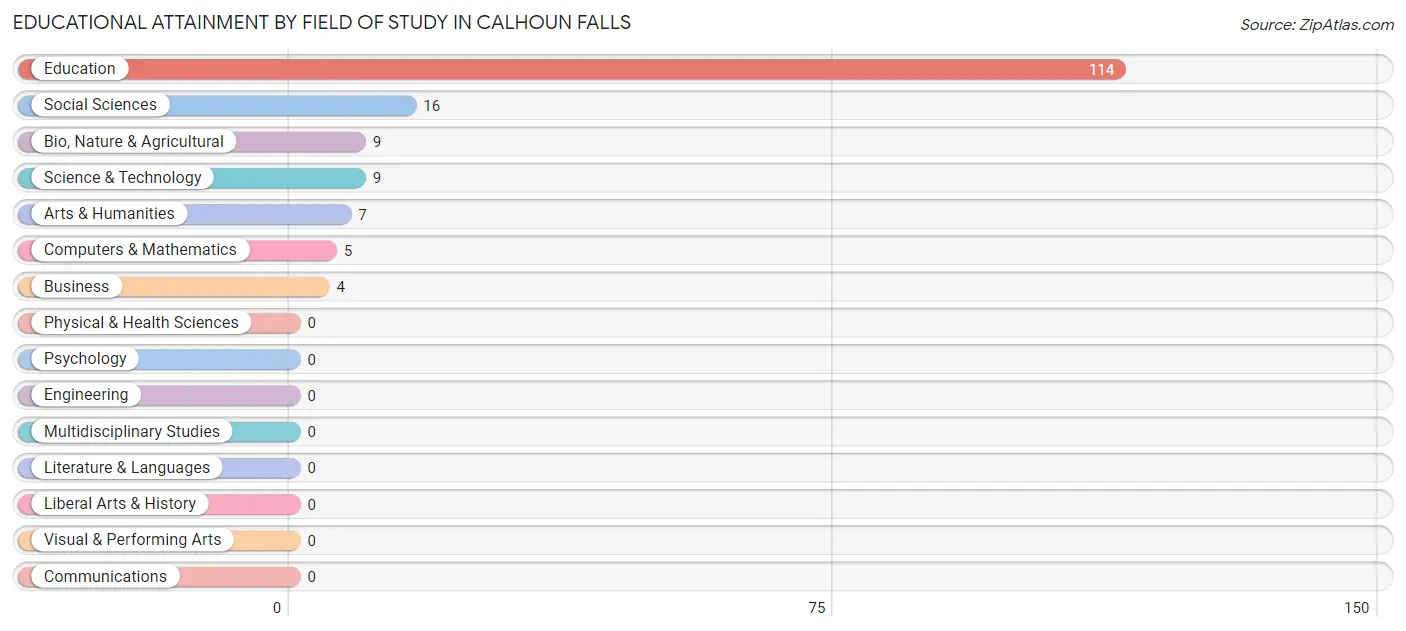
| Field of Study | # Graduates | % Graduates |
| Computers & Mathematics | 5 | 3.0% |
| Bio, Nature & Agricultural | 9 | 5.5% |
| Physical & Health Sciences | 0 | 0.0% |
| Psychology | 0 | 0.0% |
| Social Sciences | 16 | 9.8% |
| Engineering | 0 | 0.0% |
| Multidisciplinary Studies | 0 | 0.0% |
| Science & Technology | 9 | 5.5% |
| Business | 4 | 2.4% |
| Education | 114 | 69.5% |
| Literature & Languages | 0 | 0.0% |
| Liberal Arts & History | 0 | 0.0% |
| Visual & Performing Arts | 0 | 0.0% |
| Communications | 0 | 0.0% |
| Arts & Humanities | 7 | 4.3% |
| Total | 164 | 100.0% |
Transportation & Commute in Calhoun Falls
Vehicle Availability by Sex in Calhoun Falls
The most prevalent vehicle ownership categories in Calhoun Falls are males with 2 vehicles (120, accounting for 39.0%) and females with 2 vehicles (130, making up 26.8%).
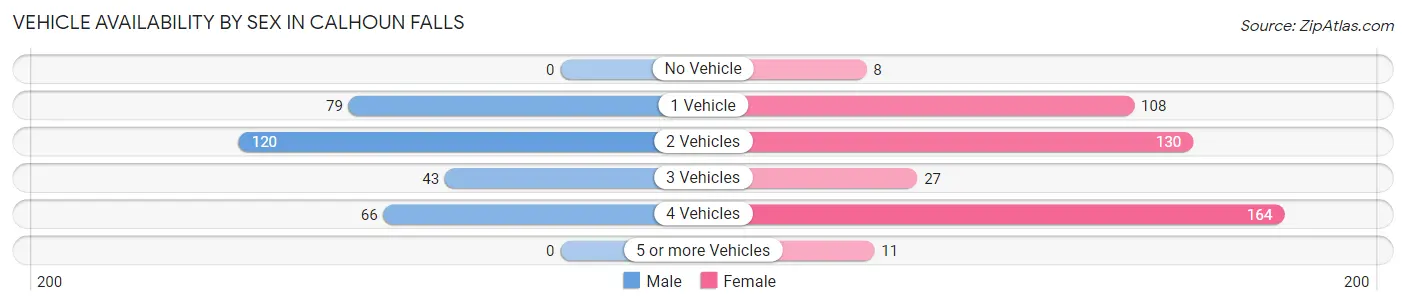
| Vehicles Available | Male | Female |
| No Vehicle | 0 (0.0%) | 8 (1.8%) |
| 1 Vehicle | 79 (25.7%) | 108 (24.1%) |
| 2 Vehicles | 120 (39.0%) | 130 (29.0%) |
| 3 Vehicles | 43 (14.0%) | 27 (6.0%) |
| 4 Vehicles | 66 (21.4%) | 164 (36.6%) |
| 5 or more Vehicles | 0 (0.0%) | 11 (2.5%) |
| Total | 308 (100.0%) | 448 (100.0%) |
Commute Time in Calhoun Falls
The most frequently occuring commute durations in Calhoun Falls are 45 to 59 minutes (191 commuters, 26.2%), 15 to 19 minutes (148 commuters, 20.3%), and 20 to 24 minutes (107 commuters, 14.7%).
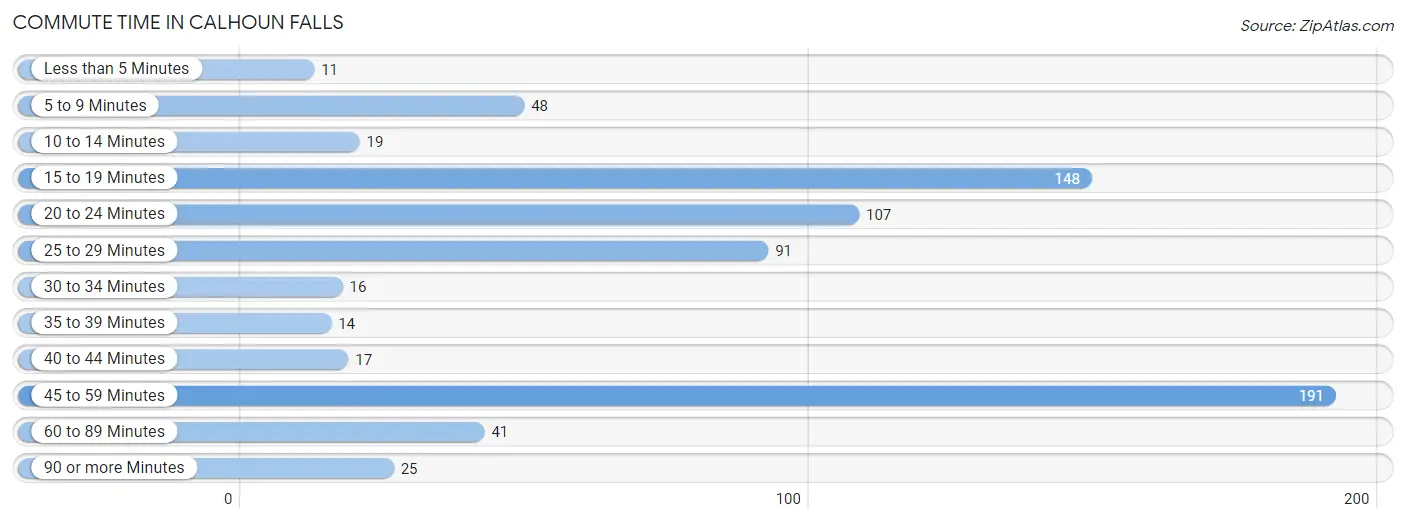
| Commute Time | # Commuters | % Commuters |
| Less than 5 Minutes | 11 | 1.5% |
| 5 to 9 Minutes | 48 | 6.6% |
| 10 to 14 Minutes | 19 | 2.6% |
| 15 to 19 Minutes | 148 | 20.3% |
| 20 to 24 Minutes | 107 | 14.7% |
| 25 to 29 Minutes | 91 | 12.5% |
| 30 to 34 Minutes | 16 | 2.2% |
| 35 to 39 Minutes | 14 | 1.9% |
| 40 to 44 Minutes | 17 | 2.3% |
| 45 to 59 Minutes | 191 | 26.2% |
| 60 to 89 Minutes | 41 | 5.6% |
| 90 or more Minutes | 25 | 3.4% |
Commute Time by Sex in Calhoun Falls
The most common commute times in Calhoun Falls are 45 to 59 minutes (128 commuters, 41.6%) for males and 20 to 24 minutes (95 commuters, 22.6%) for females.
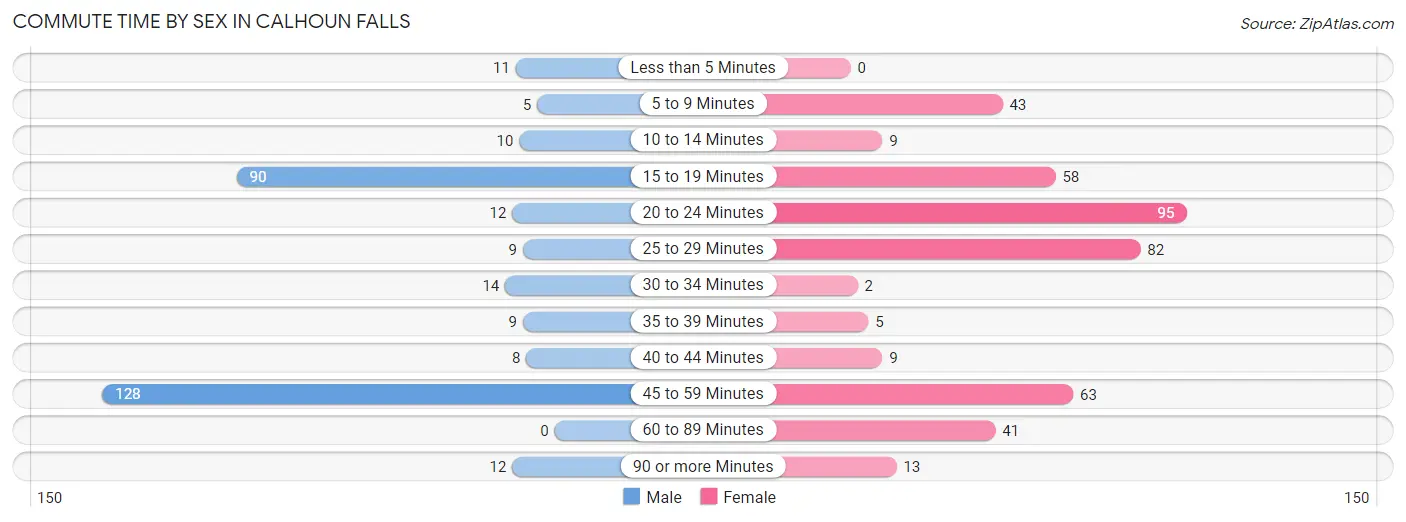
| Commute Time | Male | Female |
| Less than 5 Minutes | 11 (3.6%) | 0 (0.0%) |
| 5 to 9 Minutes | 5 (1.6%) | 43 (10.2%) |
| 10 to 14 Minutes | 10 (3.3%) | 9 (2.1%) |
| 15 to 19 Minutes | 90 (29.2%) | 58 (13.8%) |
| 20 to 24 Minutes | 12 (3.9%) | 95 (22.6%) |
| 25 to 29 Minutes | 9 (2.9%) | 82 (19.5%) |
| 30 to 34 Minutes | 14 (4.5%) | 2 (0.5%) |
| 35 to 39 Minutes | 9 (2.9%) | 5 (1.2%) |
| 40 to 44 Minutes | 8 (2.6%) | 9 (2.1%) |
| 45 to 59 Minutes | 128 (41.6%) | 63 (15.0%) |
| 60 to 89 Minutes | 0 (0.0%) | 41 (9.8%) |
| 90 or more Minutes | 12 (3.9%) | 13 (3.1%) |
Time of Departure to Work by Sex in Calhoun Falls
The most frequent times of departure to work in Calhoun Falls are 7:30 AM to 7:59 AM (64, 20.8%) for males and 7:00 AM to 7:29 AM (137, 32.6%) for females.
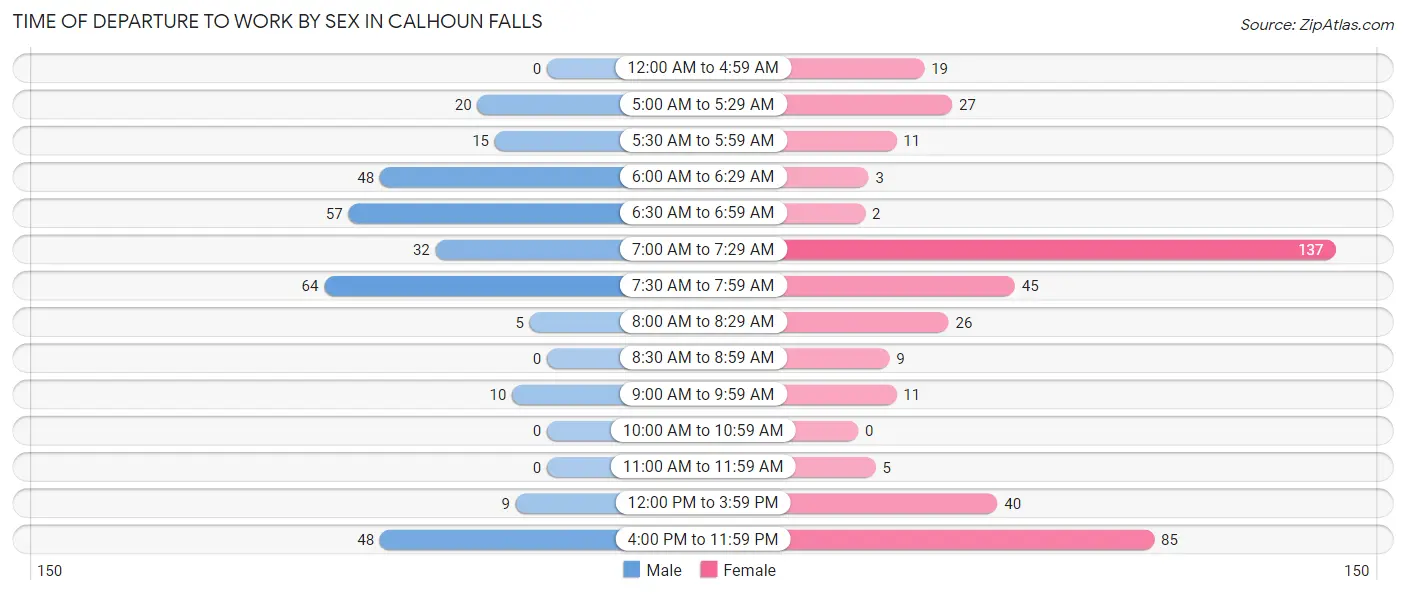
| Time of Departure | Male | Female |
| 12:00 AM to 4:59 AM | 0 (0.0%) | 19 (4.5%) |
| 5:00 AM to 5:29 AM | 20 (6.5%) | 27 (6.4%) |
| 5:30 AM to 5:59 AM | 15 (4.9%) | 11 (2.6%) |
| 6:00 AM to 6:29 AM | 48 (15.6%) | 3 (0.7%) |
| 6:30 AM to 6:59 AM | 57 (18.5%) | 2 (0.5%) |
| 7:00 AM to 7:29 AM | 32 (10.4%) | 137 (32.6%) |
| 7:30 AM to 7:59 AM | 64 (20.8%) | 45 (10.7%) |
| 8:00 AM to 8:29 AM | 5 (1.6%) | 26 (6.2%) |
| 8:30 AM to 8:59 AM | 0 (0.0%) | 9 (2.1%) |
| 9:00 AM to 9:59 AM | 10 (3.3%) | 11 (2.6%) |
| 10:00 AM to 10:59 AM | 0 (0.0%) | 0 (0.0%) |
| 11:00 AM to 11:59 AM | 0 (0.0%) | 5 (1.2%) |
| 12:00 PM to 3:59 PM | 9 (2.9%) | 40 (9.5%) |
| 4:00 PM to 11:59 PM | 48 (15.6%) | 85 (20.2%) |
| Total | 308 (100.0%) | 420 (100.0%) |
Housing Occupancy in Calhoun Falls
Occupancy by Ownership in Calhoun Falls
Of the total 785 dwellings in Calhoun Falls, owner-occupied units account for 430 (54.8%), while renter-occupied units make up 355 (45.2%).
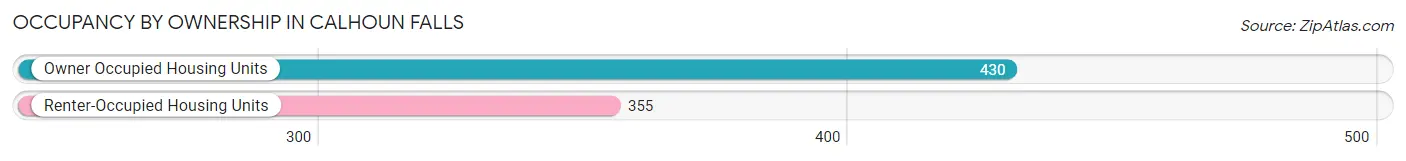
| Occupancy | # Housing Units | % Housing Units |
| Owner Occupied Housing Units | 430 | 54.8% |
| Renter-Occupied Housing Units | 355 | 45.2% |
| Total Occupied Housing Units | 785 | 100.0% |
Occupancy by Household Size in Calhoun Falls
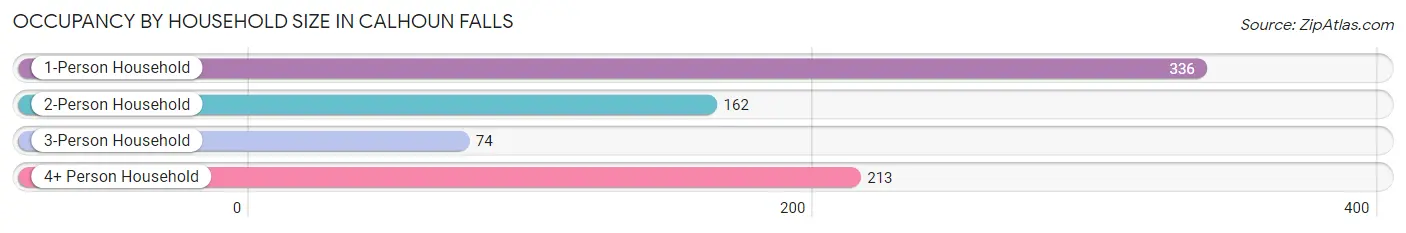
| Household Size | # Housing Units | % Housing Units |
| 1-Person Household | 336 | 42.8% |
| 2-Person Household | 162 | 20.6% |
| 3-Person Household | 74 | 9.4% |
| 4+ Person Household | 213 | 27.1% |
| Total Housing Units | 785 | 100.0% |
Occupancy by Ownership by Household Size in Calhoun Falls
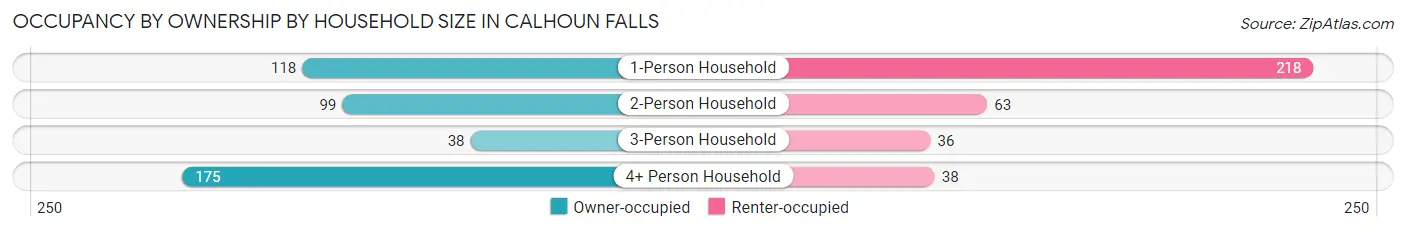
| Household Size | Owner-occupied | Renter-occupied |
| 1-Person Household | 118 (35.1%) | 218 (64.9%) |
| 2-Person Household | 99 (61.1%) | 63 (38.9%) |
| 3-Person Household | 38 (51.3%) | 36 (48.6%) |
| 4+ Person Household | 175 (82.2%) | 38 (17.8%) |
| Total Housing Units | 430 (54.8%) | 355 (45.2%) |
Occupancy by Educational Attainment in Calhoun Falls
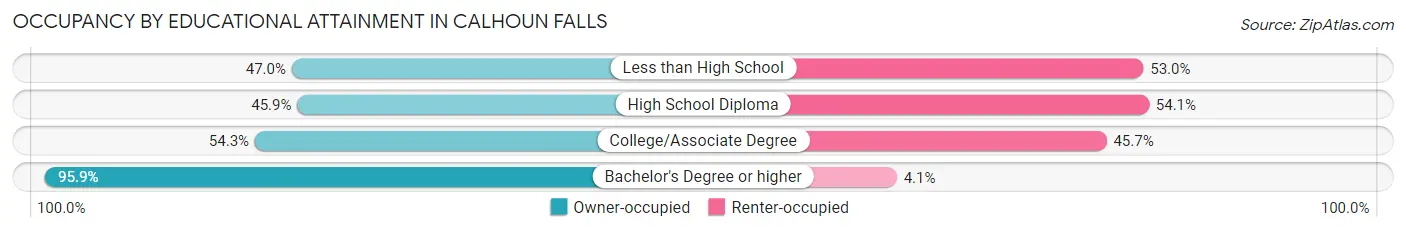
| Household Size | Owner-occupied | Renter-occupied |
| Less than High School | 87 (47.0%) | 98 (53.0%) |
| High School Diploma | 130 (45.9%) | 153 (54.1%) |
| College/Associate Degree | 119 (54.3%) | 100 (45.7%) |
| Bachelor's Degree or higher | 94 (95.9%) | 4 (4.1%) |
Occupancy by Age of Householder in Calhoun Falls
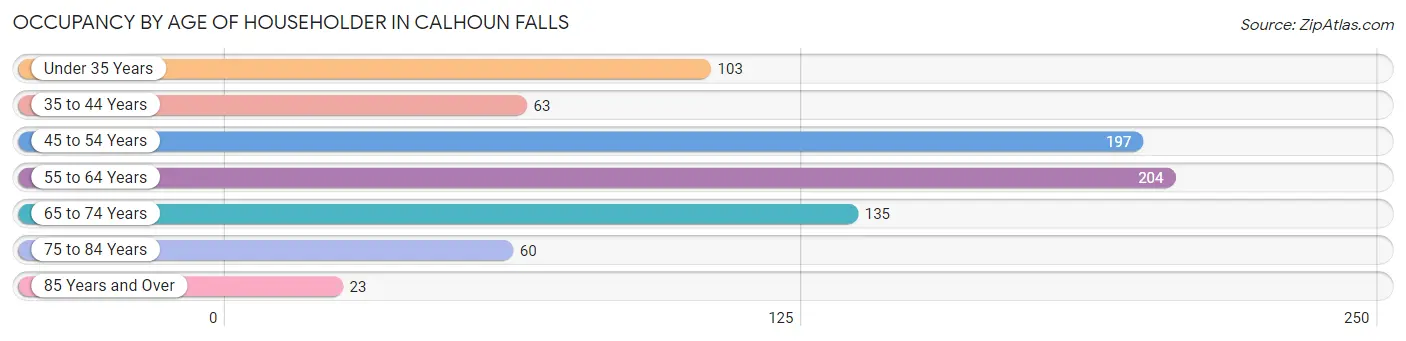
| Age Bracket | # Households | % Households |
| Under 35 Years | 103 | 13.1% |
| 35 to 44 Years | 63 | 8.0% |
| 45 to 54 Years | 197 | 25.1% |
| 55 to 64 Years | 204 | 26.0% |
| 65 to 74 Years | 135 | 17.2% |
| 75 to 84 Years | 60 | 7.6% |
| 85 Years and Over | 23 | 2.9% |
| Total | 785 | 100.0% |
Housing Finances in Calhoun Falls
Median Income by Occupancy in Calhoun Falls
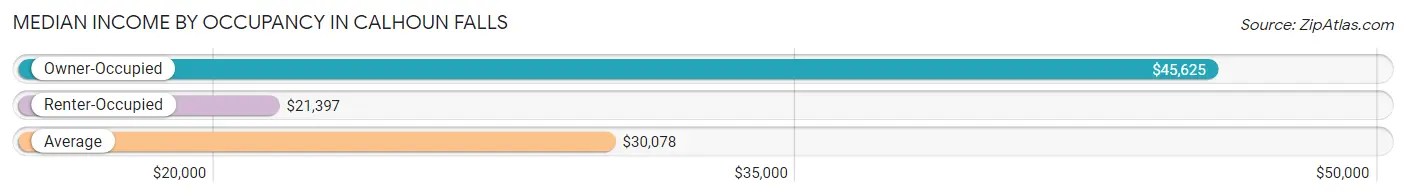
| Occupancy Type | # Households | Median Income |
| Owner-Occupied | 430 (54.8%) | $45,625 |
| Renter-Occupied | 355 (45.2%) | $21,397 |
| Average | 785 (100.0%) | $30,078 |
Occupancy by Householder Income Bracket in Calhoun Falls
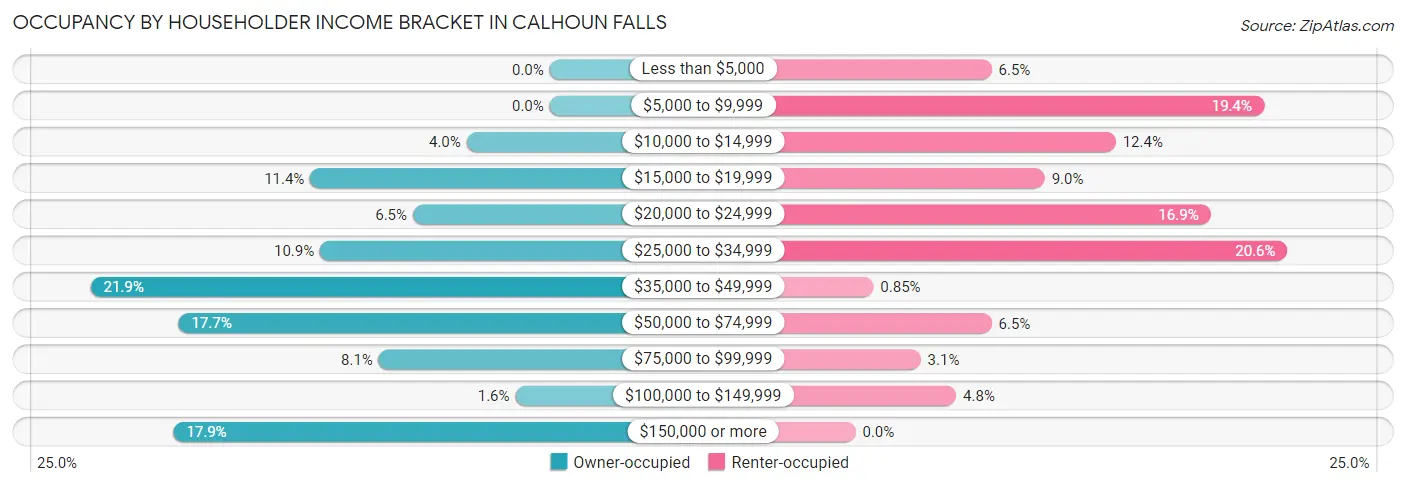
| Income Bracket | Owner-occupied | Renter-occupied |
| Less than $5,000 | 0 (0.0%) | 23 (6.5%) |
| $5,000 to $9,999 | 0 (0.0%) | 69 (19.4%) |
| $10,000 to $14,999 | 17 (4.0%) | 44 (12.4%) |
| $15,000 to $19,999 | 49 (11.4%) | 32 (9.0%) |
| $20,000 to $24,999 | 28 (6.5%) | 60 (16.9%) |
| $25,000 to $34,999 | 47 (10.9%) | 73 (20.6%) |
| $35,000 to $49,999 | 94 (21.9%) | 3 (0.9%) |
| $50,000 to $74,999 | 76 (17.7%) | 23 (6.5%) |
| $75,000 to $99,999 | 35 (8.1%) | 11 (3.1%) |
| $100,000 to $149,999 | 7 (1.6%) | 17 (4.8%) |
| $150,000 or more | 77 (17.9%) | 0 (0.0%) |
| Total | 430 (100.0%) | 355 (100.0%) |
Monthly Housing Cost Tiers in Calhoun Falls
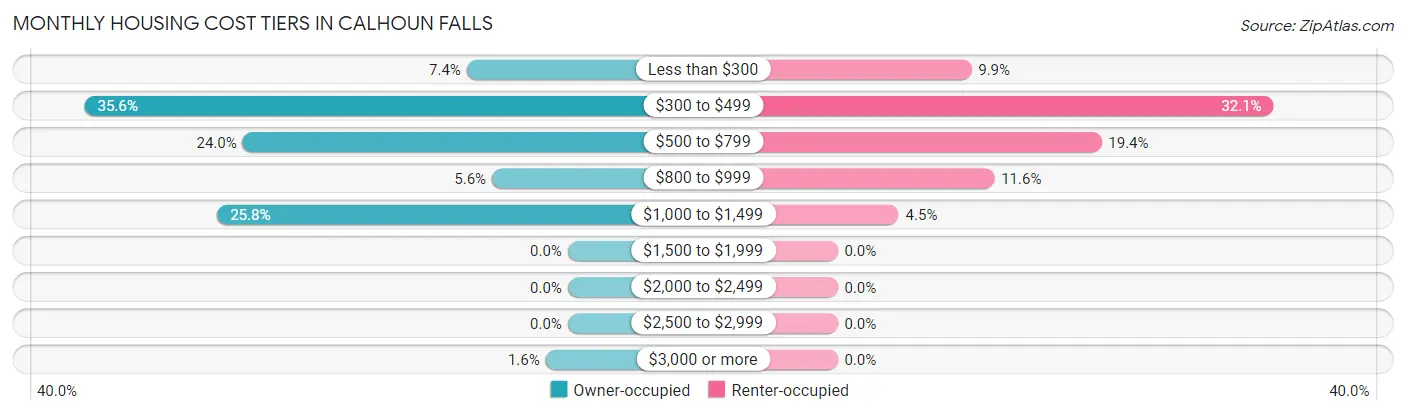
| Monthly Cost | Owner-occupied | Renter-occupied |
| Less than $300 | 32 (7.4%) | 35 (9.9%) |
| $300 to $499 | 153 (35.6%) | 114 (32.1%) |
| $500 to $799 | 103 (23.9%) | 69 (19.4%) |
| $800 to $999 | 24 (5.6%) | 41 (11.6%) |
| $1,000 to $1,499 | 111 (25.8%) | 16 (4.5%) |
| $1,500 to $1,999 | 0 (0.0%) | 0 (0.0%) |
| $2,000 to $2,499 | 0 (0.0%) | 0 (0.0%) |
| $2,500 to $2,999 | 0 (0.0%) | 0 (0.0%) |
| $3,000 or more | 7 (1.6%) | 0 (0.0%) |
| Total | 430 (100.0%) | 355 (100.0%) |
Physical Housing Characteristics in Calhoun Falls
Housing Structures in Calhoun Falls
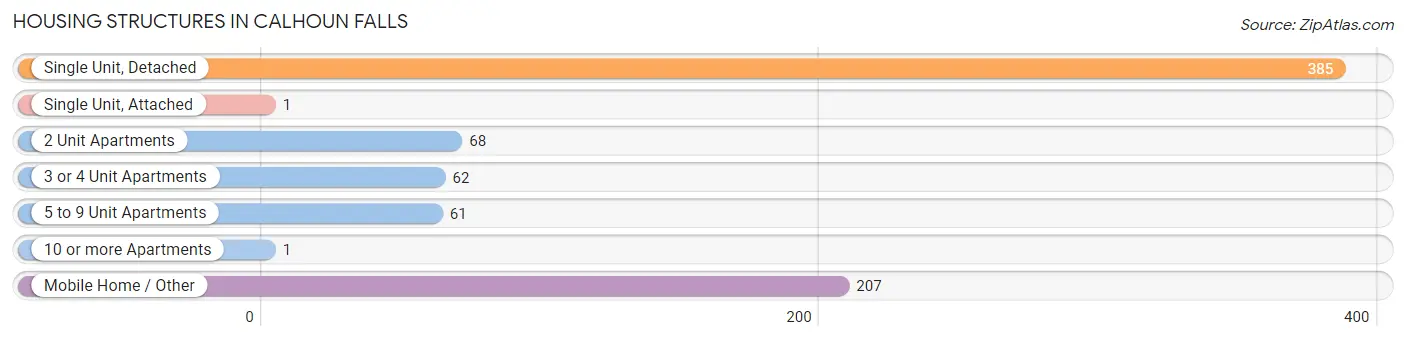
| Structure Type | # Housing Units | % Housing Units |
| Single Unit, Detached | 385 | 49.0% |
| Single Unit, Attached | 1 | 0.1% |
| 2 Unit Apartments | 68 | 8.7% |
| 3 or 4 Unit Apartments | 62 | 7.9% |
| 5 to 9 Unit Apartments | 61 | 7.8% |
| 10 or more Apartments | 1 | 0.1% |
| Mobile Home / Other | 207 | 26.4% |
| Total | 785 | 100.0% |
Housing Structures by Occupancy in Calhoun Falls
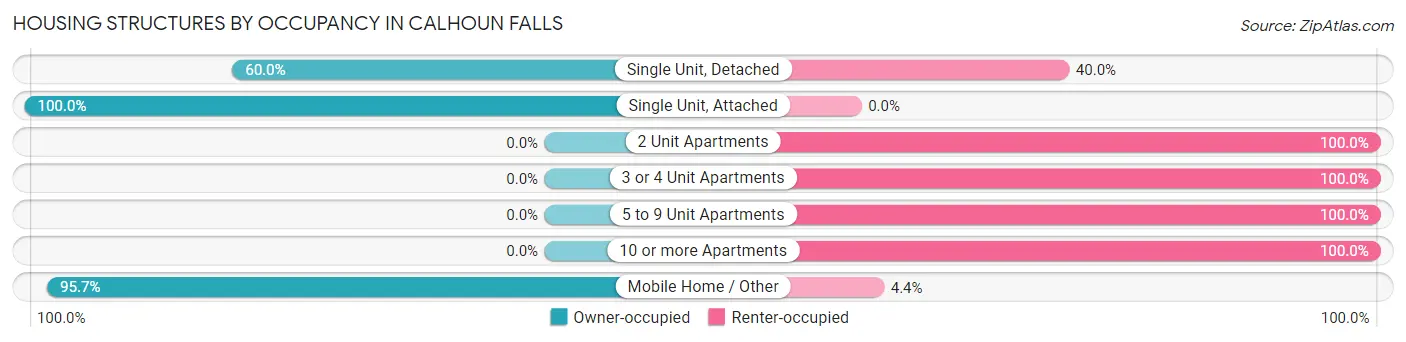
| Structure Type | Owner-occupied | Renter-occupied |
| Single Unit, Detached | 231 (60.0%) | 154 (40.0%) |
| Single Unit, Attached | 1 (100.0%) | 0 (0.0%) |
| 2 Unit Apartments | 0 (0.0%) | 68 (100.0%) |
| 3 or 4 Unit Apartments | 0 (0.0%) | 62 (100.0%) |
| 5 to 9 Unit Apartments | 0 (0.0%) | 61 (100.0%) |
| 10 or more Apartments | 0 (0.0%) | 1 (100.0%) |
| Mobile Home / Other | 198 (95.7%) | 9 (4.3%) |
| Total | 430 (54.8%) | 355 (45.2%) |
Housing Structures by Number of Rooms in Calhoun Falls
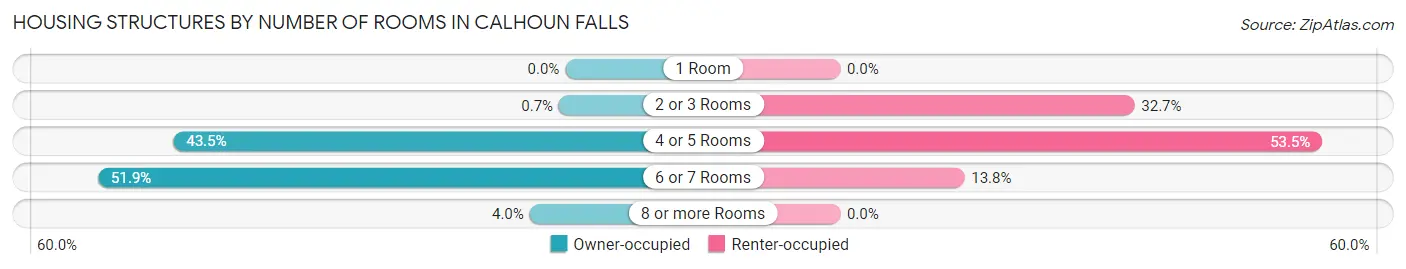
| Number of Rooms | Owner-occupied | Renter-occupied |
| 1 Room | 0 (0.0%) | 0 (0.0%) |
| 2 or 3 Rooms | 3 (0.7%) | 116 (32.7%) |
| 4 or 5 Rooms | 187 (43.5%) | 190 (53.5%) |
| 6 or 7 Rooms | 223 (51.9%) | 49 (13.8%) |
| 8 or more Rooms | 17 (4.0%) | 0 (0.0%) |
| Total | 430 (100.0%) | 355 (100.0%) |
Housing Structure by Heating Type in Calhoun Falls
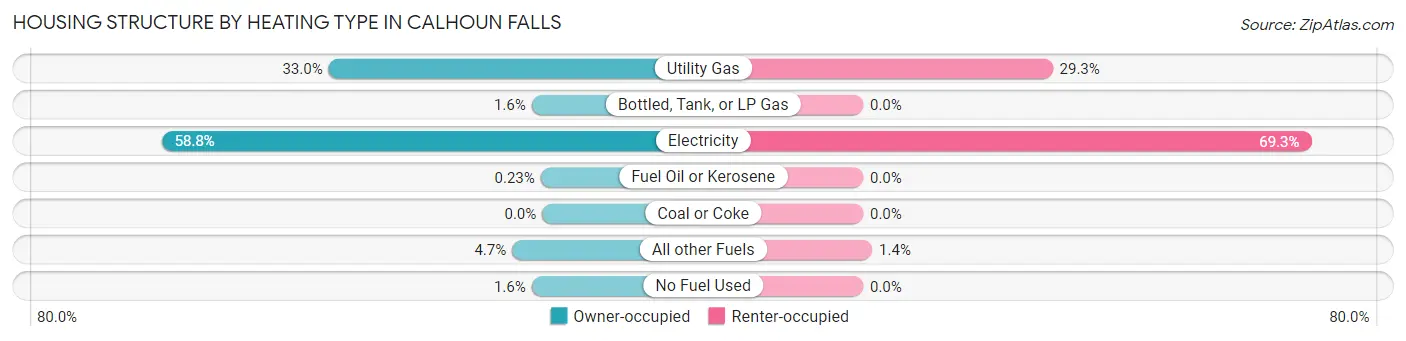
| Heating Type | Owner-occupied | Renter-occupied |
| Utility Gas | 142 (33.0%) | 104 (29.3%) |
| Bottled, Tank, or LP Gas | 7 (1.6%) | 0 (0.0%) |
| Electricity | 253 (58.8%) | 246 (69.3%) |
| Fuel Oil or Kerosene | 1 (0.2%) | 0 (0.0%) |
| Coal or Coke | 0 (0.0%) | 0 (0.0%) |
| All other Fuels | 20 (4.6%) | 5 (1.4%) |
| No Fuel Used | 7 (1.6%) | 0 (0.0%) |
| Total | 430 (100.0%) | 355 (100.0%) |
Household Vehicle Usage in Calhoun Falls
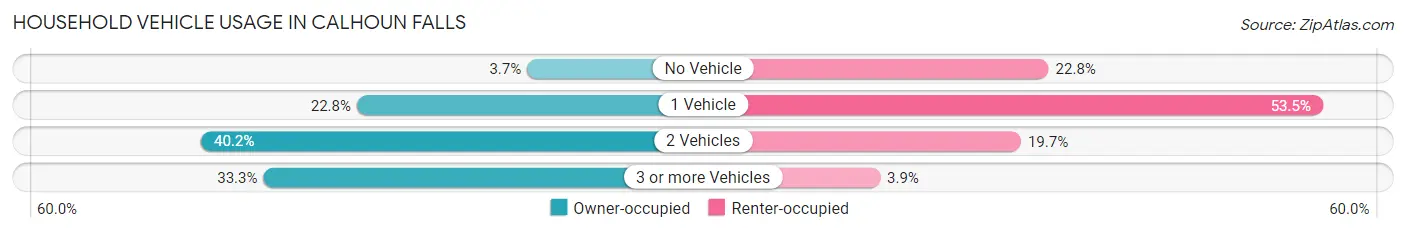
| Vehicles per Household | Owner-occupied | Renter-occupied |
| No Vehicle | 16 (3.7%) | 81 (22.8%) |
| 1 Vehicle | 98 (22.8%) | 190 (53.5%) |
| 2 Vehicles | 173 (40.2%) | 70 (19.7%) |
| 3 or more Vehicles | 143 (33.3%) | 14 (3.9%) |
| Total | 430 (100.0%) | 355 (100.0%) |
Real Estate & Mortgages in Calhoun Falls
Real Estate and Mortgage Overview in Calhoun Falls
| Characteristic | Without Mortgage | With Mortgage |
| Housing Units | 251 | 179 |
| Median Property Value | $50,800 | $85,200 |
| Median Household Income | $36,991 | $77 |
| Monthly Housing Costs | $398 | $0 |
| Real Estate Taxes | $356 | $17 |
Property Value by Mortgage Status in Calhoun Falls
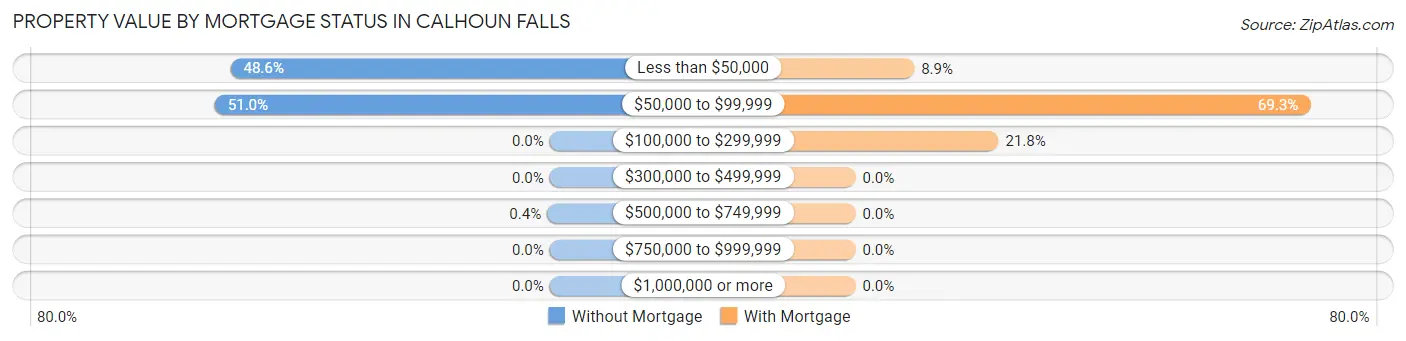
| Property Value | Without Mortgage | With Mortgage |
| Less than $50,000 | 122 (48.6%) | 16 (8.9%) |
| $50,000 to $99,999 | 128 (51.0%) | 124 (69.3%) |
| $100,000 to $299,999 | 0 (0.0%) | 39 (21.8%) |
| $300,000 to $499,999 | 0 (0.0%) | 0 (0.0%) |
| $500,000 to $749,999 | 1 (0.4%) | 0 (0.0%) |
| $750,000 to $999,999 | 0 (0.0%) | 0 (0.0%) |
| $1,000,000 or more | 0 (0.0%) | 0 (0.0%) |
| Total | 251 (100.0%) | 179 (100.0%) |
Household Income by Mortgage Status in Calhoun Falls
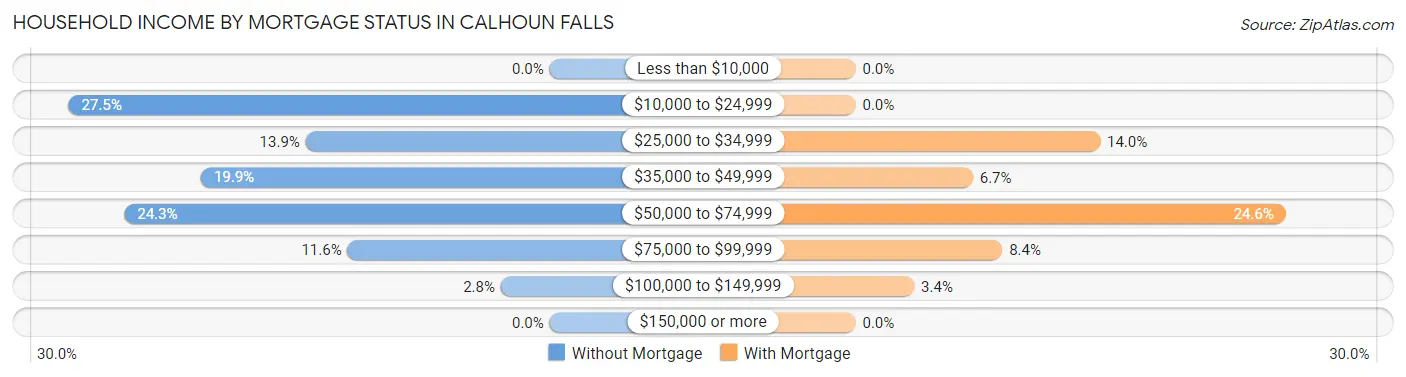
| Household Income | Without Mortgage | With Mortgage |
| Less than $10,000 | 0 (0.0%) | 0 (0.0%) |
| $10,000 to $24,999 | 69 (27.5%) | 0 (0.0%) |
| $25,000 to $34,999 | 35 (13.9%) | 25 (14.0%) |
| $35,000 to $49,999 | 50 (19.9%) | 12 (6.7%) |
| $50,000 to $74,999 | 61 (24.3%) | 44 (24.6%) |
| $75,000 to $99,999 | 29 (11.6%) | 15 (8.4%) |
| $100,000 to $149,999 | 7 (2.8%) | 6 (3.4%) |
| $150,000 or more | 0 (0.0%) | 0 (0.0%) |
| Total | 251 (100.0%) | 179 (100.0%) |
Property Value to Household Income Ratio in Calhoun Falls
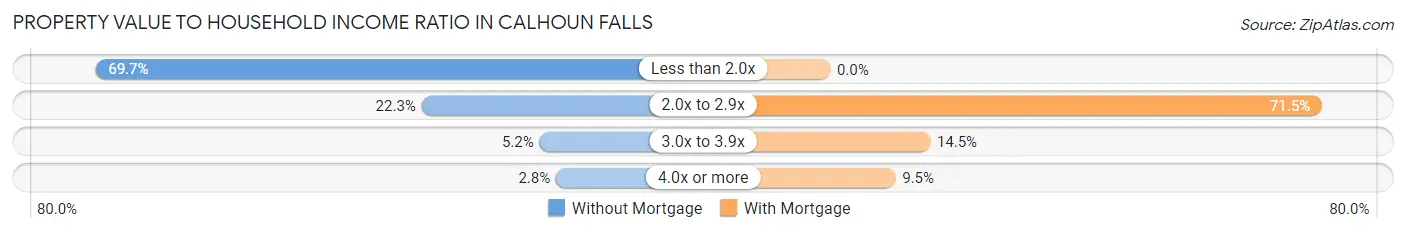
| Value-to-Income Ratio | Without Mortgage | With Mortgage |
| Less than 2.0x | 175 (69.7%) | 0 (0.0%) |
| 2.0x to 2.9x | 56 (22.3%) | 128 (71.5%) |
| 3.0x to 3.9x | 13 (5.2%) | 26 (14.5%) |
| 4.0x or more | 7 (2.8%) | 17 (9.5%) |
| Total | 251 (100.0%) | 179 (100.0%) |
Real Estate Taxes by Mortgage Status in Calhoun Falls
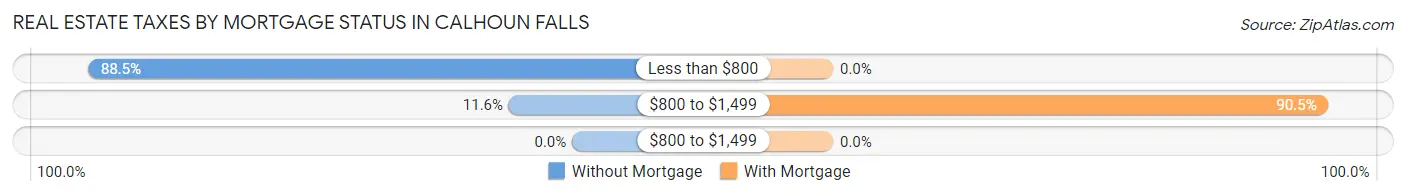
| Property Taxes | Without Mortgage | With Mortgage |
| Less than $800 | 222 (88.4%) | 0 (0.0%) |
| $800 to $1,499 | 29 (11.6%) | 162 (90.5%) |
| $800 to $1,499 | 0 (0.0%) | 0 (0.0%) |
| Total | 251 (100.0%) | 179 (100.0%) |
Health & Disability in Calhoun Falls
Health Insurance Coverage by Age in Calhoun Falls
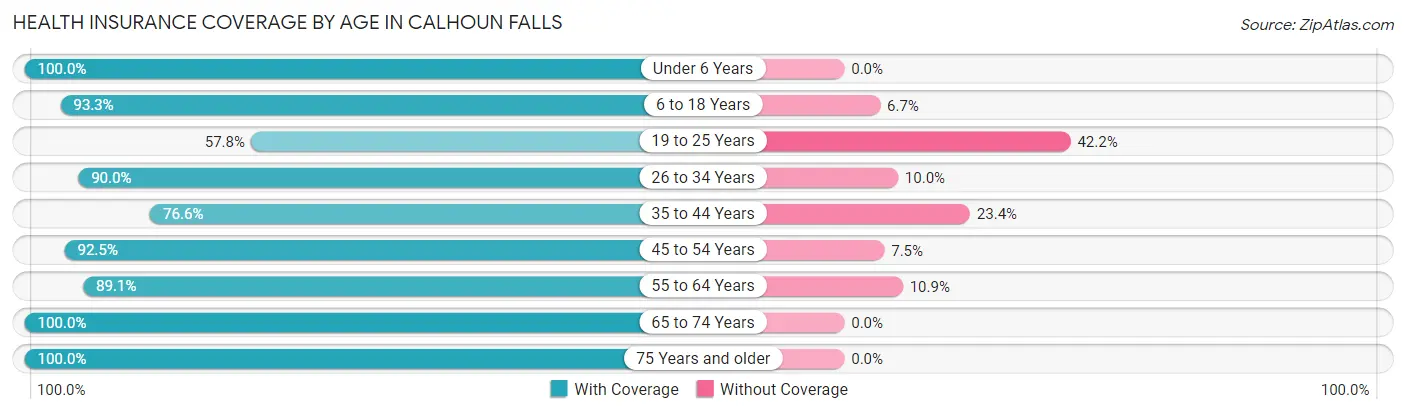
| Age Bracket | With Coverage | Without Coverage |
| Under 6 Years | 163 (100.0%) | 0 (0.0%) |
| 6 to 18 Years | 378 (93.3%) | 27 (6.7%) |
| 19 to 25 Years | 85 (57.8%) | 62 (42.2%) |
| 26 to 34 Years | 99 (90.0%) | 11 (10.0%) |
| 35 to 44 Years | 121 (76.6%) | 37 (23.4%) |
| 45 to 54 Years | 310 (92.5%) | 25 (7.5%) |
| 55 to 64 Years | 286 (89.1%) | 35 (10.9%) |
| 65 to 74 Years | 208 (100.0%) | 0 (0.0%) |
| 75 Years and older | 92 (100.0%) | 0 (0.0%) |
| Total | 1,742 (89.8%) | 197 (10.2%) |
Health Insurance Coverage by Citizenship Status in Calhoun Falls
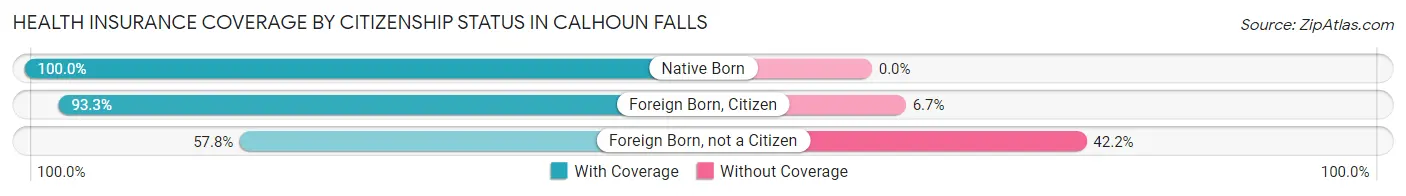
| Citizenship Status | With Coverage | Without Coverage |
| Native Born | 163 (100.0%) | 0 (0.0%) |
| Foreign Born, Citizen | 378 (93.3%) | 27 (6.7%) |
| Foreign Born, not a Citizen | 85 (57.8%) | 62 (42.2%) |
Health Insurance Coverage by Household Income in Calhoun Falls
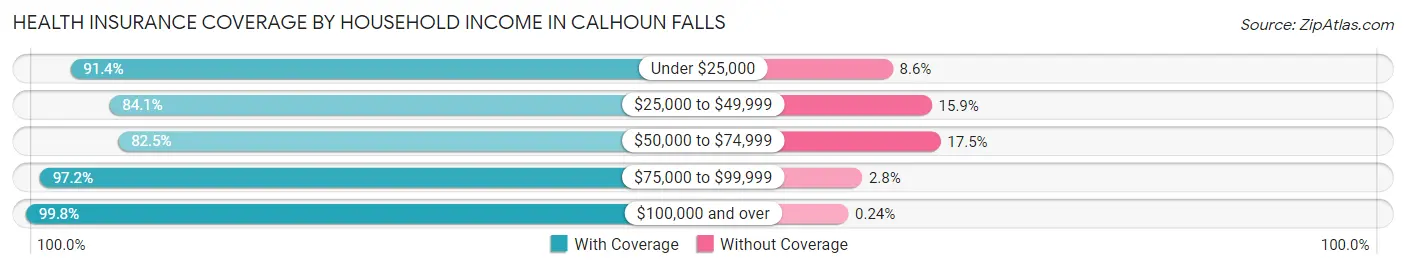
| Household Income | With Coverage | Without Coverage |
| Under $25,000 | 373 (91.4%) | 35 (8.6%) |
| $25,000 to $49,999 | 471 (84.1%) | 89 (15.9%) |
| $50,000 to $74,999 | 315 (82.5%) | 67 (17.5%) |
| $75,000 to $99,999 | 171 (97.2%) | 5 (2.8%) |
| $100,000 and over | 412 (99.8%) | 1 (0.2%) |
Public vs Private Health Insurance Coverage by Age in Calhoun Falls
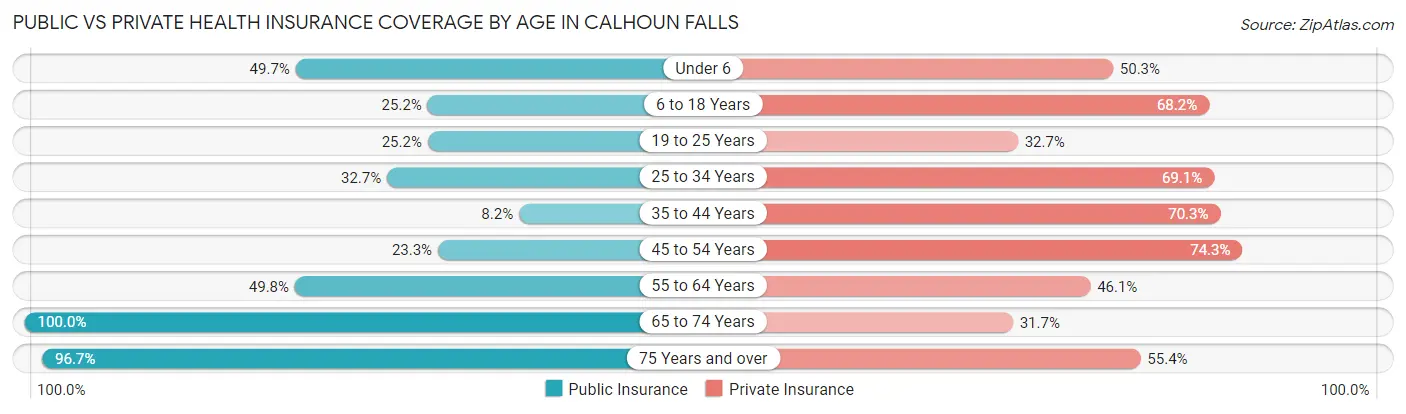
| Age Bracket | Public Insurance | Private Insurance |
| Under 6 | 81 (49.7%) | 82 (50.3%) |
| 6 to 18 Years | 102 (25.2%) | 276 (68.1%) |
| 19 to 25 Years | 37 (25.2%) | 48 (32.7%) |
| 25 to 34 Years | 36 (32.7%) | 76 (69.1%) |
| 35 to 44 Years | 13 (8.2%) | 111 (70.3%) |
| 45 to 54 Years | 78 (23.3%) | 249 (74.3%) |
| 55 to 64 Years | 160 (49.8%) | 148 (46.1%) |
| 65 to 74 Years | 208 (100.0%) | 66 (31.7%) |
| 75 Years and over | 89 (96.7%) | 51 (55.4%) |
| Total | 804 (41.5%) | 1,107 (57.1%) |
Disability Status by Sex by Age in Calhoun Falls
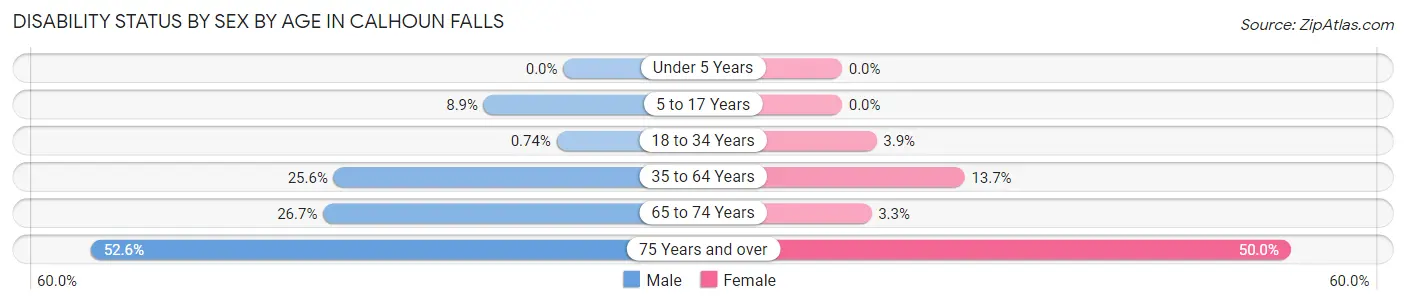
| Age Bracket | Male | Female |
| Under 5 Years | 0 (0.0%) | 0 (0.0%) |
| 5 to 17 Years | 10 (8.8%) | 0 (0.0%) |
| 18 to 34 Years | 2 (0.7%) | 7 (3.8%) |
| 35 to 64 Years | 79 (25.6%) | 69 (13.7%) |
| 65 to 74 Years | 23 (26.7%) | 4 (3.3%) |
| 75 Years and over | 20 (52.6%) | 27 (50.0%) |
Disability Class by Sex by Age in Calhoun Falls
Disability Class: Hearing Difficulty
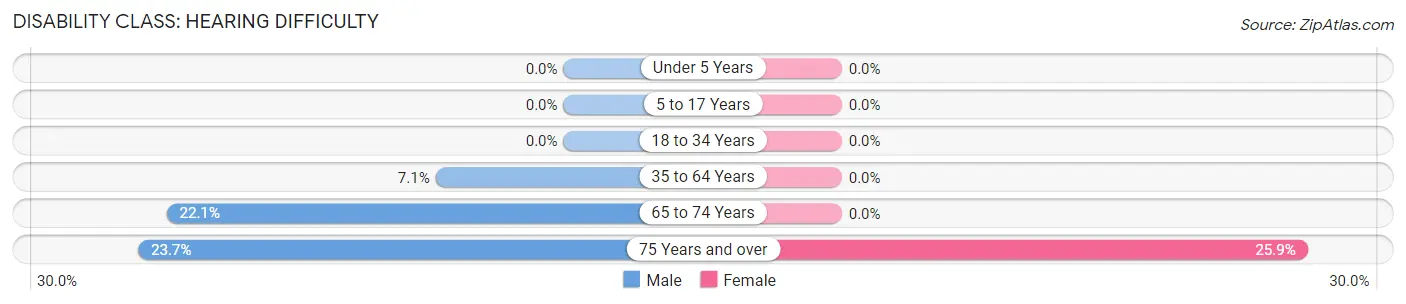
| Age Bracket | Male | Female |
| Under 5 Years | 0 (0.0%) | 0 (0.0%) |
| 5 to 17 Years | 0 (0.0%) | 0 (0.0%) |
| 18 to 34 Years | 0 (0.0%) | 0 (0.0%) |
| 35 to 64 Years | 22 (7.1%) | 0 (0.0%) |
| 65 to 74 Years | 19 (22.1%) | 0 (0.0%) |
| 75 Years and over | 9 (23.7%) | 14 (25.9%) |
Disability Class: Vision Difficulty
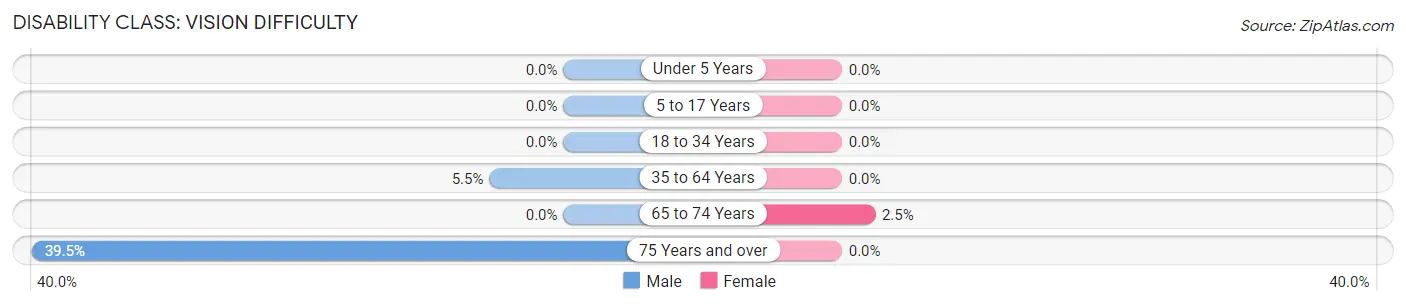
| Age Bracket | Male | Female |
| Under 5 Years | 0 (0.0%) | 0 (0.0%) |
| 5 to 17 Years | 0 (0.0%) | 0 (0.0%) |
| 18 to 34 Years | 0 (0.0%) | 0 (0.0%) |
| 35 to 64 Years | 17 (5.5%) | 0 (0.0%) |
| 65 to 74 Years | 0 (0.0%) | 3 (2.5%) |
| 75 Years and over | 15 (39.5%) | 0 (0.0%) |
Disability Class: Cognitive Difficulty
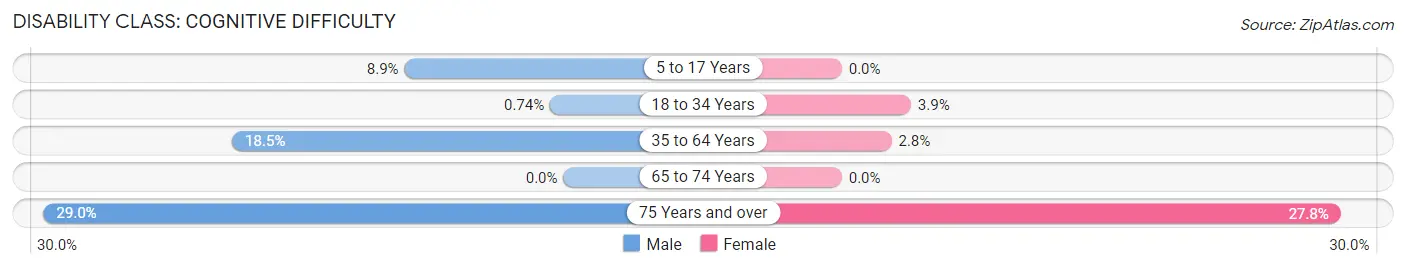
| Age Bracket | Male | Female |
| 5 to 17 Years | 10 (8.8%) | 0 (0.0%) |
| 18 to 34 Years | 2 (0.7%) | 7 (3.8%) |
| 35 to 64 Years | 57 (18.4%) | 14 (2.8%) |
| 65 to 74 Years | 0 (0.0%) | 0 (0.0%) |
| 75 Years and over | 11 (28.9%) | 15 (27.8%) |
Disability Class: Ambulatory Difficulty
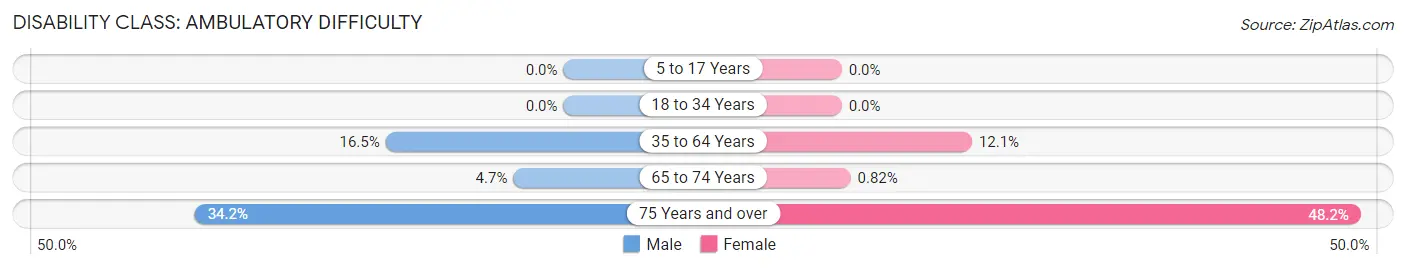
| Age Bracket | Male | Female |
| 5 to 17 Years | 0 (0.0%) | 0 (0.0%) |
| 18 to 34 Years | 0 (0.0%) | 0 (0.0%) |
| 35 to 64 Years | 51 (16.5%) | 61 (12.1%) |
| 65 to 74 Years | 4 (4.6%) | 1 (0.8%) |
| 75 Years and over | 13 (34.2%) | 26 (48.1%) |
Disability Class: Self-Care Difficulty
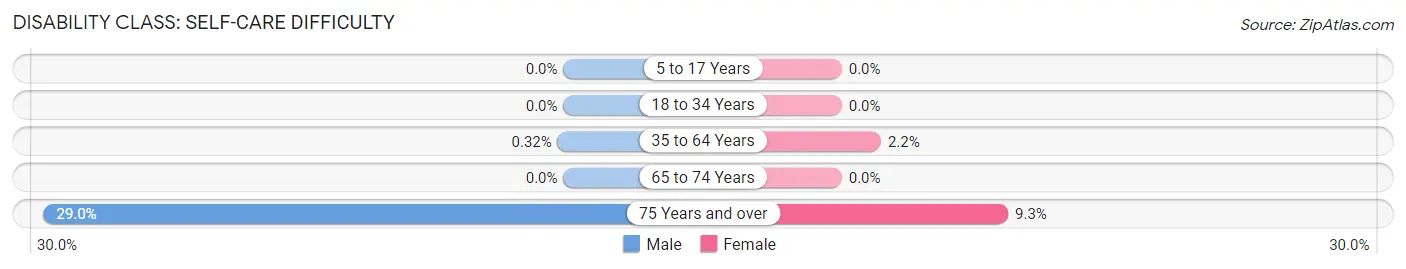
| Age Bracket | Male | Female |
| 5 to 17 Years | 0 (0.0%) | 0 (0.0%) |
| 18 to 34 Years | 0 (0.0%) | 0 (0.0%) |
| 35 to 64 Years | 1 (0.3%) | 11 (2.2%) |
| 65 to 74 Years | 0 (0.0%) | 0 (0.0%) |
| 75 Years and over | 11 (28.9%) | 5 (9.3%) |
Technology Access in Calhoun Falls
Computing Device Access in Calhoun Falls
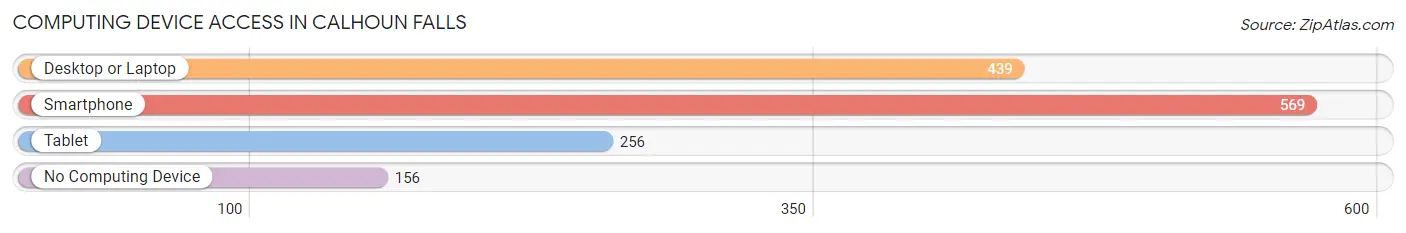
| Device Type | # Households | % Households |
| Desktop or Laptop | 439 | 55.9% |
| Smartphone | 569 | 72.5% |
| Tablet | 256 | 32.6% |
| No Computing Device | 156 | 19.9% |
| Total | 785 | 100.0% |
Internet Access in Calhoun Falls
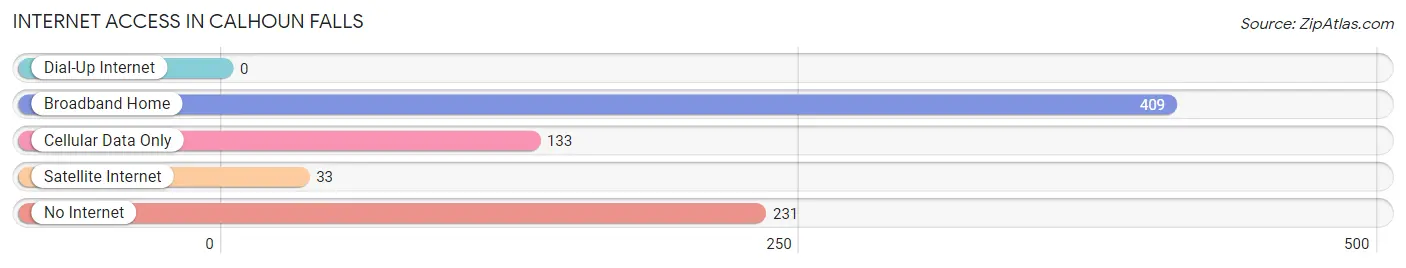
| Internet Type | # Households | % Households |
| Dial-Up Internet | 0 | 0.0% |
| Broadband Home | 409 | 52.1% |
| Cellular Data Only | 133 | 16.9% |
| Satellite Internet | 33 | 4.2% |
| No Internet | 231 | 29.4% |
| Total | 785 | 100.0% |
Calhoun Falls Summary
Calhoun Falls, South Carolina is a small town located in Abbeville County, South Carolina. It is situated on the banks of the Savannah River, approximately 25 miles from the Georgia border. The town was founded in 1820 and named after John C. Calhoun, a prominent South Carolina politician. The population of Calhoun Falls was 1,845 at the 2010 census.
History
Calhoun Falls was founded in 1820 and named after John C. Calhoun, a prominent South Carolina politician. The town was originally a trading post and ferry crossing on the Savannah River. In 1825, the town was incorporated and the first post office was established.
In the late 19th century, Calhoun Falls became a popular tourist destination due to its proximity to the Savannah River. The town was home to several resorts, including the Calhoun Falls Hotel, which was built in 1887. The hotel was a popular destination for wealthy tourists from the North.
In the early 20th century, Calhoun Falls became a center for the textile industry. Several mills were built in the town, including the Calhoun Falls Cotton Mill, which opened in 1910. The mill was the largest employer in the town and provided jobs for hundreds of people.
In the 1950s, the town began to decline as the textile industry moved away from the area. The Calhoun Falls Cotton Mill closed in 1957 and the town's population began to decline.
Geography
Calhoun Falls is located in Abbeville County, South Carolina. It is situated on the banks of the Savannah River, approximately 25 miles from the Georgia border. The town is located in the Piedmont region of South Carolina and is surrounded by rolling hills and forests.
The climate in Calhoun Falls is humid subtropical, with hot, humid summers and mild winters. The average annual temperature is around 70 degrees Fahrenheit.
Economy
Calhoun Falls is a small town with a population of 1,845 at the 2010 census. The town's economy is largely based on agriculture and tourism. The town is home to several farms, including the Calhoun Falls Farm, which produces corn, soybeans, and wheat.
The town is also home to several tourist attractions, including the Calhoun Falls State Park, which offers camping, fishing, and hiking. The town is also home to several restaurants, shops, and other businesses.
Demographics
As of the 2010 census, the population of Calhoun Falls was 1,845. The racial makeup of the town was 79.3% White, 17.2% African American, 0.3% Native American, 0.3% Asian, 0.1% Pacific Islander, and 2.8% from other races. The median household income was $30,938 and the median family income was $37,813.
The town is home to several churches, including the Calhoun Falls Baptist Church, the Calhoun Falls Methodist Church, and the Calhoun Falls Presbyterian Church. The town is also home to several schools, including the Calhoun Falls Elementary School, the Calhoun Falls Middle School, and the Calhoun Falls High School.
Common Questions
What is Per Capita Income in Calhoun Falls?
Per Capita income in Calhoun Falls is $20,539.
What is the Median Family Income in Calhoun Falls?
Median Family Income in Calhoun Falls is $55,357.
What is the Median Household income in Calhoun Falls?
Median Household Income in Calhoun Falls is $30,078.
What is Income or Wage Gap in Calhoun Falls?
Income or Wage Gap in Calhoun Falls is 16.8%.
Women in Calhoun Falls earn 83.2 cents for every dollar earned by a man.
What is Inequality or Gini Index in Calhoun Falls?
Inequality or Gini Index in Calhoun Falls is 0.52.
What is the Total Population of Calhoun Falls?
Total Population of Calhoun Falls is 1,939.
What is the Total Male Population of Calhoun Falls?
Total Male Population of Calhoun Falls is 876.
What is the Total Female Population of Calhoun Falls?
Total Female Population of Calhoun Falls is 1,063.
What is the Ratio of Males per 100 Females in Calhoun Falls?
There are 82.41 Males per 100 Females in Calhoun Falls.
What is the Ratio of Females per 100 Males in Calhoun Falls?
There are 121.35 Females per 100 Males in Calhoun Falls.
What is the Median Population Age in Calhoun Falls?
Median Population Age in Calhoun Falls is 42.0 Years.
What is the Average Family Size in Calhoun Falls
Average Family Size in Calhoun Falls is 3.4 People.
What is the Average Household Size in Calhoun Falls
Average Household Size in Calhoun Falls is 2.5 People.
How Large is the Labor Force in Calhoun Falls?
There are 799 People in the Labor Forcein in Calhoun Falls.
What is the Percentage of People in the Labor Force in Calhoun Falls?
49.7% of People are in the Labor Force in Calhoun Falls.
What is the Unemployment Rate in Calhoun Falls?
Unemployment Rate in Calhoun Falls is 3.0%.