Aynor, SC Map & Demographics
Aynor Map
Aynor Overview
$30,755
PER CAPITA INCOME
$76,042
AVG FAMILY INCOME
$70,227
AVG HOUSEHOLD INCOME
8.4%
WAGE / INCOME GAP [ % ]
91.6¢/ $1
WAGE / INCOME GAP [ $ ]
0.35
INEQUALITY / GINI INDEX
989
TOTAL POPULATION
445
MALE POPULATION
544
FEMALE POPULATION
81.80
MALES / 100 FEMALES
122.25
FEMALES / 100 MALES
39.9
MEDIAN AGE
3.0
AVG FAMILY SIZE
2.7
AVG HOUSEHOLD SIZE
507
LABOR FORCE [ PEOPLE ]
64.8%
PERCENT IN LABOR FORCE
2.2%
UNEMPLOYMENT RATE
Aynor Zip Codes
Aynor Area Codes
Income in Aynor
Income Overview in Aynor
Per Capita Income in Aynor is $30,755, while median incomes of families and households are $76,042 and $70,227 respectively.
| Characteristic | Number | Measure |
| Per Capita Income | 989 | $30,755 |
| Median Family Income | 270 | $76,042 |
| Mean Family Income | 270 | $81,031 |
| Median Household Income | 370 | $70,227 |
| Mean Household Income | 370 | $75,216 |
| Income Deficit | 270 | $0 |
| Wage / Income Gap (%) | 989 | 8.39% |
| Wage / Income Gap ($) | 989 | 91.61¢ per $1 |
| Gini / Inequality Index | 989 | 0.35 |
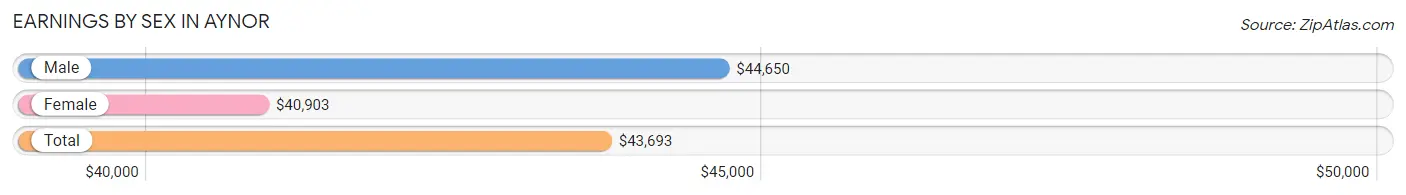
Earnings by Sex in Aynor
Average Earnings in Aynor are $43,693, $44,650 for men and $40,903 for women, a difference of 8.4%.
| Sex | Number | Average Earnings |
| Male | 272 (52.8%) | $44,650 |
| Female | 243 (47.2%) | $40,903 |
| Total | 515 (100.0%) | $43,693 |
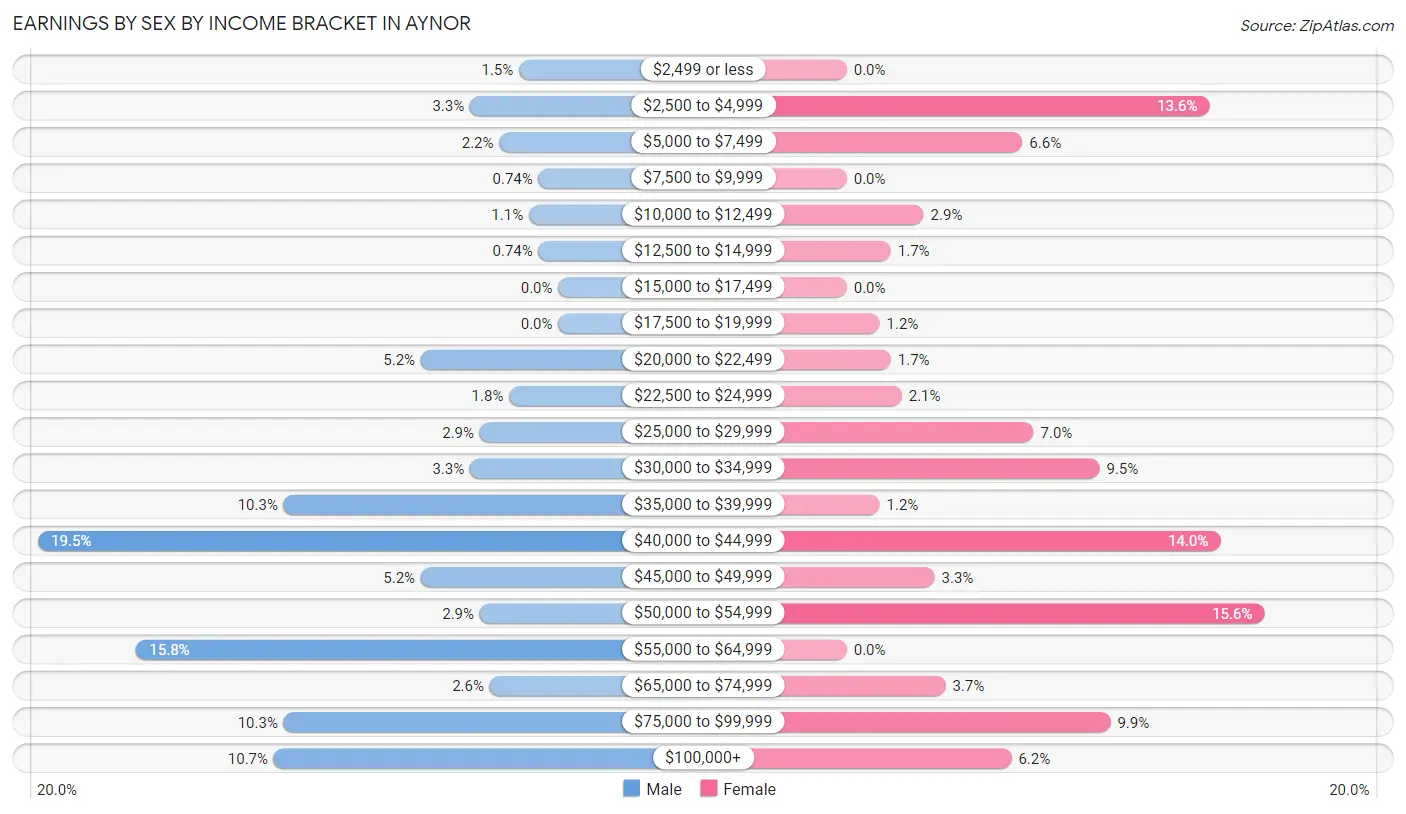
Earnings by Sex by Income Bracket in Aynor
The most common earnings brackets in Aynor are $40,000 to $44,999 for men (53 | 19.5%) and $50,000 to $54,999 for women (38 | 15.6%).
| Income | Male | Female |
| $2,499 or less | 4 (1.5%) | 0 (0.0%) |
| $2,500 to $4,999 | 9 (3.3%) | 33 (13.6%) |
| $5,000 to $7,499 | 6 (2.2%) | 16 (6.6%) |
| $7,500 to $9,999 | 2 (0.7%) | 0 (0.0%) |
| $10,000 to $12,499 | 3 (1.1%) | 7 (2.9%) |
| $12,500 to $14,999 | 2 (0.7%) | 4 (1.7%) |
| $15,000 to $17,499 | 0 (0.0%) | 0 (0.0%) |
| $17,500 to $19,999 | 0 (0.0%) | 3 (1.2%) |
| $20,000 to $22,499 | 14 (5.1%) | 4 (1.7%) |
| $22,500 to $24,999 | 5 (1.8%) | 5 (2.1%) |
| $25,000 to $29,999 | 8 (2.9%) | 17 (7.0%) |
| $30,000 to $34,999 | 9 (3.3%) | 23 (9.5%) |
| $35,000 to $39,999 | 28 (10.3%) | 3 (1.2%) |
| $40,000 to $44,999 | 53 (19.5%) | 34 (14.0%) |
| $45,000 to $49,999 | 14 (5.1%) | 8 (3.3%) |
| $50,000 to $54,999 | 8 (2.9%) | 38 (15.6%) |
| $55,000 to $64,999 | 43 (15.8%) | 0 (0.0%) |
| $65,000 to $74,999 | 7 (2.6%) | 9 (3.7%) |
| $75,000 to $99,999 | 28 (10.3%) | 24 (9.9%) |
| $100,000+ | 29 (10.7%) | 15 (6.2%) |
| Total | 272 (100.0%) | 243 (100.0%) |
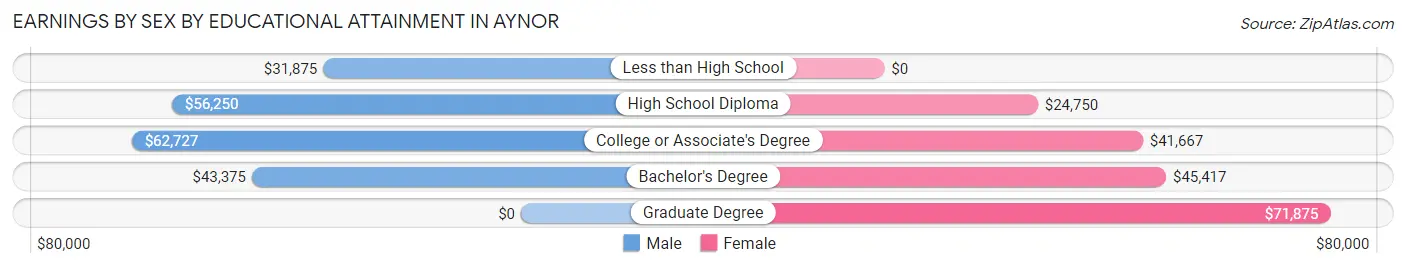
Earnings by Sex by Educational Attainment in Aynor
Average earnings in Aynor are $44,775 for men and $41,250 for women, a difference of 7.9%. Men with an educational attainment of college or associate's degree enjoy the highest average annual earnings of $62,727, while those with less than high school education earn the least with $31,875. Women with an educational attainment of graduate degree earn the most with the average annual earnings of $71,875, while those with high school diploma education have the smallest earnings of $24,750.
| Educational Attainment | Male Income | Female Income |
| Less than High School | $31,875 | $0 |
| High School Diploma | $56,250 | $24,750 |
| College or Associate's Degree | $62,727 | $41,667 |
| Bachelor's Degree | $43,375 | $45,417 |
| Graduate Degree | - | - |
| Total | $44,775 | $41,250 |
Family Income in Aynor
Family Income Brackets in Aynor
According to the Aynor family income data, there are 71 families falling into the $75,000 to $99,999 income range, which is the most common income bracket and makes up 26.3% of all families.
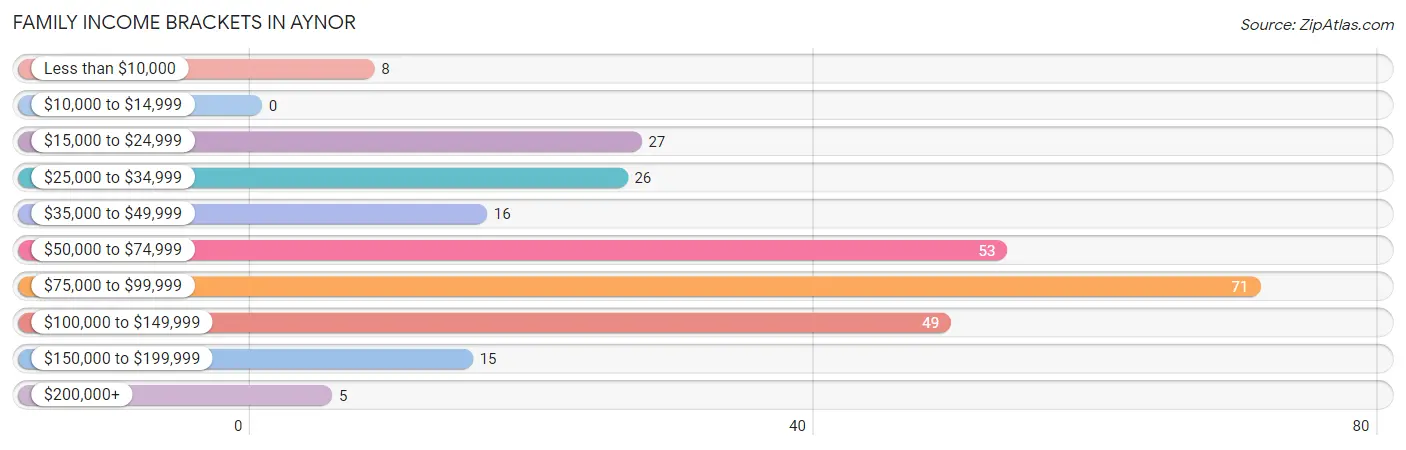
| Income Bracket | # Families | % Families |
| Less than $10,000 | 8 | 3.0% |
| $10,000 to $14,999 | 0 | 0.0% |
| $15,000 to $24,999 | 27 | 10.0% |
| $25,000 to $34,999 | 26 | 9.6% |
| $35,000 to $49,999 | 16 | 5.9% |
| $50,000 to $74,999 | 53 | 19.6% |
| $75,000 to $99,999 | 71 | 26.3% |
| $100,000 to $149,999 | 49 | 18.1% |
| $150,000 to $199,999 | 15 | 5.6% |
| $200,000+ | 5 | 1.9% |
Family Income by Famaliy Size in Aynor
5-person families (9 | 3.3%) account for the highest median family income in Aynor with $145,250 per family, while 3-person families (50 | 18.5%) have the highest median income of $36,250 per family member.
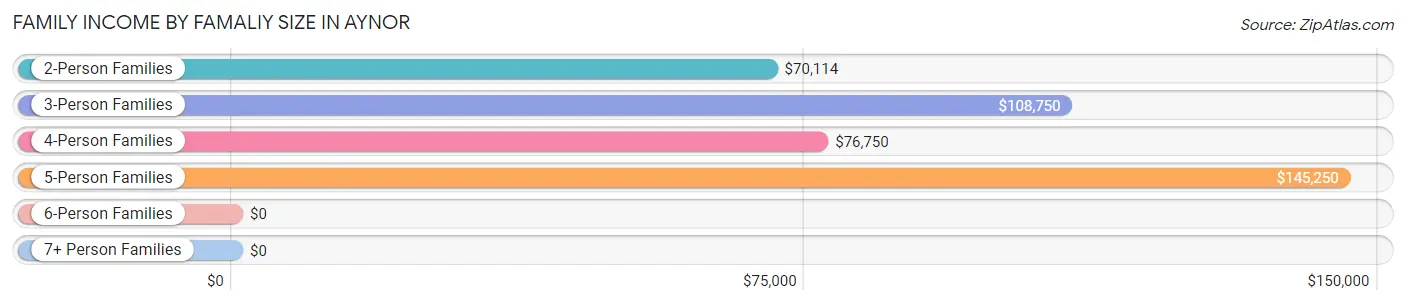
| Income Bracket | # Families | Median Income |
| 2-Person Families | 163 (60.4%) | $70,114 |
| 3-Person Families | 50 (18.5%) | $108,750 |
| 4-Person Families | 39 (14.4%) | $76,750 |
| 5-Person Families | 9 (3.3%) | $145,250 |
| 6-Person Families | 3 (1.1%) | $0 |
| 7+ Person Families | 6 (2.2%) | $0 |
| Total | 270 (100.0%) | $76,042 |
Family Income by Number of Earners in Aynor
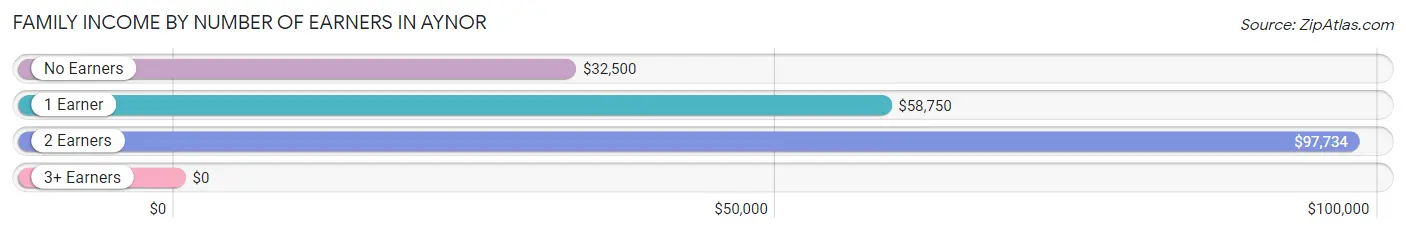
| Number of Earners | # Families | Median Income |
| No Earners | 38 (14.1%) | $32,500 |
| 1 Earner | 101 (37.4%) | $58,750 |
| 2 Earners | 124 (45.9%) | $97,734 |
| 3+ Earners | 7 (2.6%) | $0 |
| Total | 270 (100.0%) | $76,042 |
Household Income in Aynor
Household Income Brackets in Aynor
With 82 households falling in the category, the $75,000 to $99,999 income range is the most frequent in Aynor, accounting for 22.2% of all households. In contrast, only 5 households (1.3%) fall into the $200,000+ income bracket, making it the least populous group.
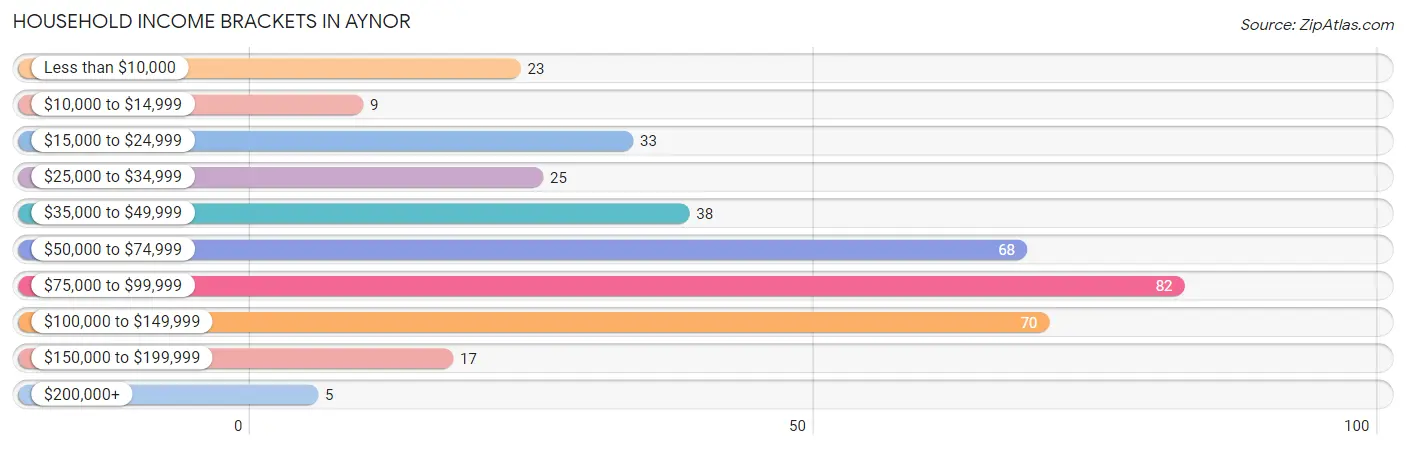
| Income Bracket | # Households | % Households |
| Less than $10,000 | 23 | 6.2% |
| $10,000 to $14,999 | 9 | 2.4% |
| $15,000 to $24,999 | 33 | 8.9% |
| $25,000 to $34,999 | 25 | 6.8% |
| $35,000 to $49,999 | 38 | 10.3% |
| $50,000 to $74,999 | 68 | 18.4% |
| $75,000 to $99,999 | 82 | 22.2% |
| $100,000 to $149,999 | 70 | 18.9% |
| $150,000 to $199,999 | 17 | 4.6% |
| $200,000+ | 5 | 1.4% |
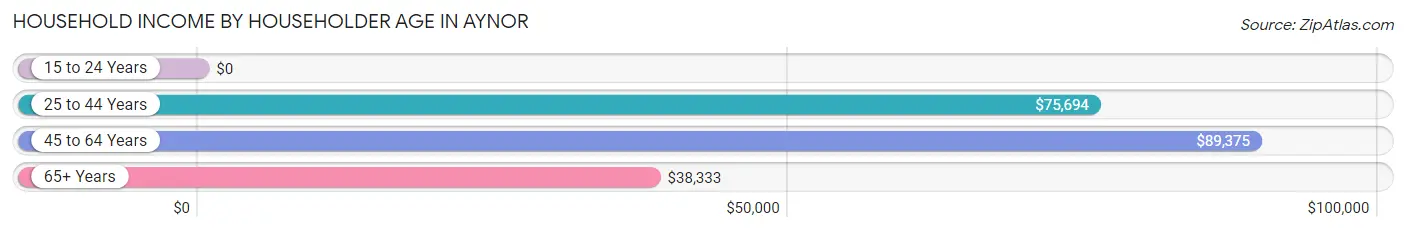
Household Income by Householder Age in Aynor
The median household income in Aynor is $70,227, with the highest median household income of $89,375 found in the 45 to 64 years age bracket for the primary householder. A total of 139 households (37.6%) fall into this category. Meanwhile, the 15 to 24 years age bracket for the primary householder has the lowest median household income of $0, with 2 households (0.5%) in this group.
| Income Bracket | # Households | Median Income |
| 15 to 24 Years | 2 (0.5%) | $0 |
| 25 to 44 Years | 139 (37.6%) | $75,694 |
| 45 to 64 Years | 139 (37.6%) | $89,375 |
| 65+ Years | 90 (24.3%) | $38,333 |
| Total | 370 (100.0%) | $70,227 |
Poverty in Aynor
Income Below Poverty by Sex and Age in Aynor
With 6.7% poverty level for males and 11.2% for females among the residents of Aynor, 18 to 24 year old males and 18 to 24 year old females are the most vulnerable to poverty, with 5 males (21.7%) and 5 females (62.5%) in their respective age groups living below the poverty level.
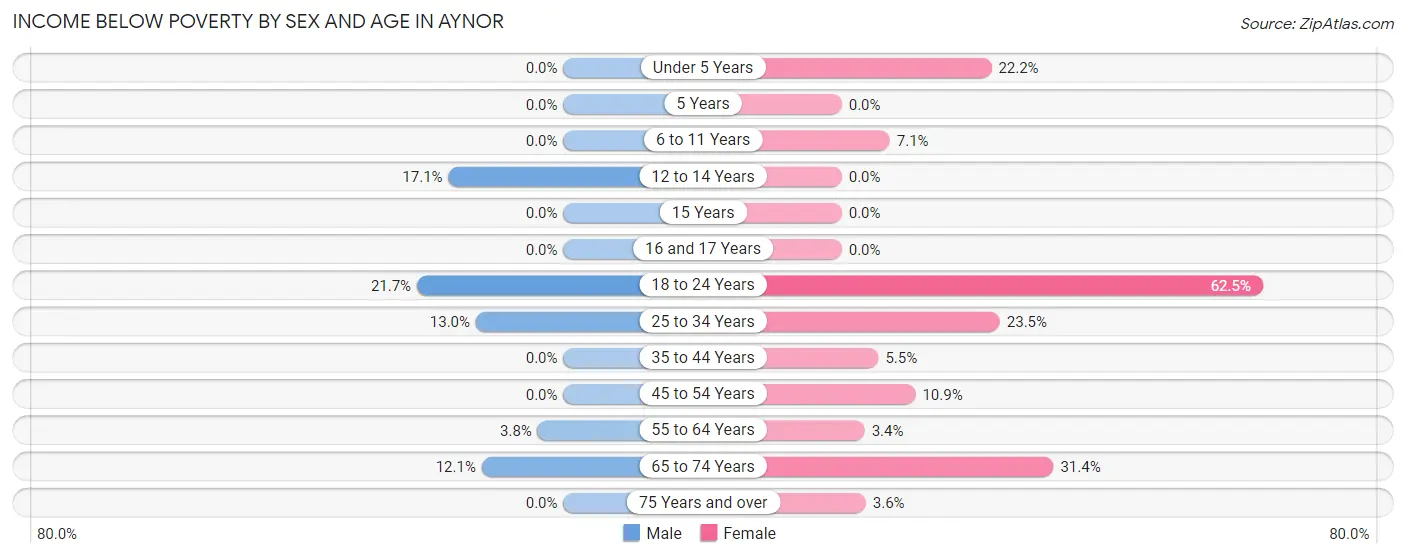
| Age Bracket | Male | Female |
| Under 5 Years | 0 (0.0%) | 4 (22.2%) |
| 5 Years | 0 (0.0%) | 0 (0.0%) |
| 6 to 11 Years | 0 (0.0%) | 3 (7.1%) |
| 12 to 14 Years | 7 (17.1%) | 0 (0.0%) |
| 15 Years | 0 (0.0%) | 0 (0.0%) |
| 16 and 17 Years | 0 (0.0%) | 0 (0.0%) |
| 18 to 24 Years | 5 (21.7%) | 5 (62.5%) |
| 25 to 34 Years | 10 (13.0%) | 23 (23.5%) |
| 35 to 44 Years | 0 (0.0%) | 3 (5.4%) |
| 45 to 54 Years | 0 (0.0%) | 7 (10.9%) |
| 55 to 64 Years | 4 (3.8%) | 3 (3.4%) |
| 65 to 74 Years | 4 (12.1%) | 11 (31.4%) |
| 75 Years and over | 0 (0.0%) | 2 (3.6%) |
| Total | 30 (6.7%) | 61 (11.2%) |
Income Above Poverty by Sex and Age in Aynor
According to the poverty statistics in Aynor, males aged under 5 years and females aged 5 years are the age groups that are most secure financially, with 100.0% of males and 100.0% of females in these age groups living above the poverty line.
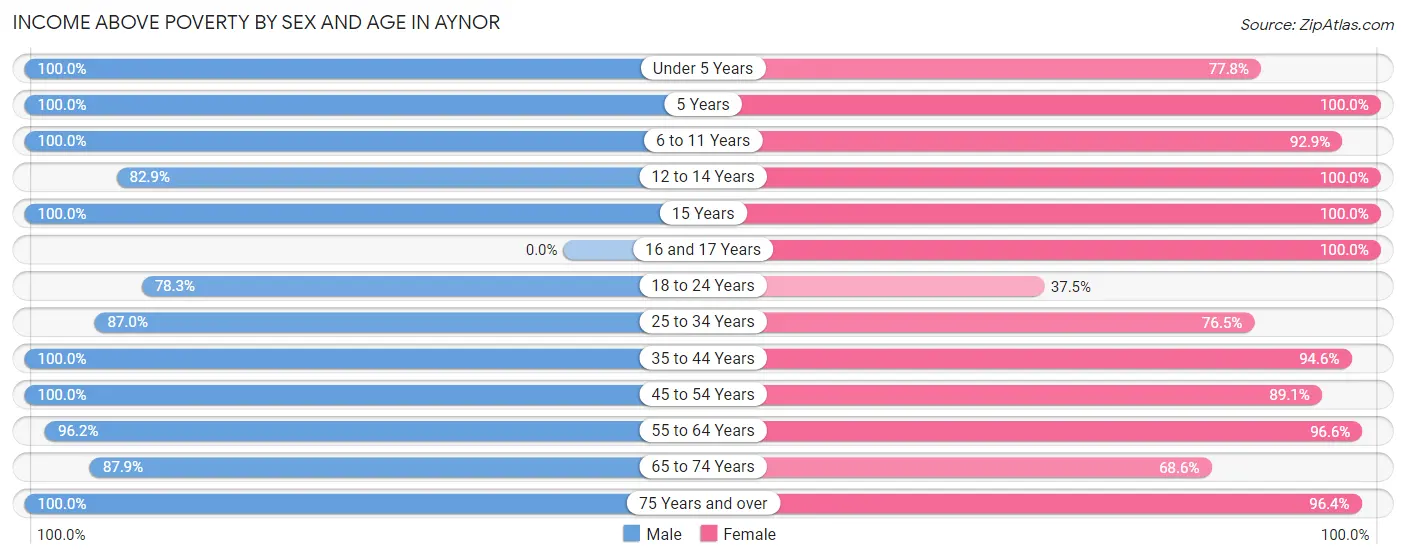
| Age Bracket | Male | Female |
| Under 5 Years | 8 (100.0%) | 14 (77.8%) |
| 5 Years | 7 (100.0%) | 16 (100.0%) |
| 6 to 11 Years | 25 (100.0%) | 39 (92.9%) |
| 12 to 14 Years | 34 (82.9%) | 33 (100.0%) |
| 15 Years | 6 (100.0%) | 10 (100.0%) |
| 16 and 17 Years | 0 (0.0%) | 21 (100.0%) |
| 18 to 24 Years | 18 (78.3%) | 3 (37.5%) |
| 25 to 34 Years | 67 (87.0%) | 75 (76.5%) |
| 35 to 44 Years | 33 (100.0%) | 52 (94.6%) |
| 45 to 54 Years | 78 (100.0%) | 57 (89.1%) |
| 55 to 64 Years | 101 (96.2%) | 85 (96.6%) |
| 65 to 74 Years | 29 (87.9%) | 24 (68.6%) |
| 75 Years and over | 9 (100.0%) | 54 (96.4%) |
| Total | 415 (93.3%) | 483 (88.8%) |
Income Below Poverty Among Married-Couple Families in Aynor
The poverty statistics for married-couple families in Aynor show that 1.9% or 4 of the total 208 families live below the poverty line. Families with 1 or 2 children have the highest poverty rate of 3.8%, comprising of 2 families. On the other hand, families with 3 or 4 children have the lowest poverty rate of 0.0%, which includes 0 families.

| Children | Above Poverty | Below Poverty |
| No Children | 137 (98.6%) | 2 (1.4%) |
| 1 or 2 Children | 50 (96.2%) | 2 (3.8%) |
| 3 or 4 Children | 11 (100.0%) | 0 (0.0%) |
| 5 or more Children | 6 (100.0%) | 0 (0.0%) |
| Total | 204 (98.1%) | 4 (1.9%) |
Income Below Poverty Among Single-Parent Households in Aynor
According to the poverty data in Aynor, 12.5% or 1 single-father households and 16.7% or 9 single-mother households are living below the poverty line. Among single-father households, those with no children have the highest poverty rate, with 1 households (16.7%) experiencing poverty. Likewise, among single-mother households, those with 1 or 2 children have the highest poverty rate, with 9 households (34.6%) falling below the poverty line.
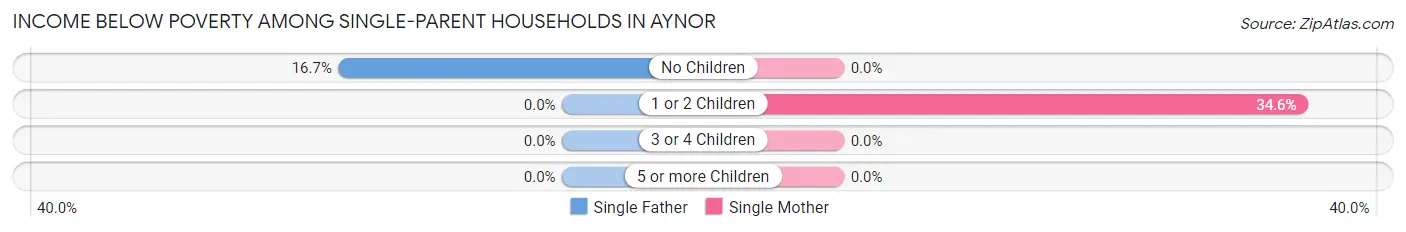
| Children | Single Father | Single Mother |
| No Children | 1 (16.7%) | 0 (0.0%) |
| 1 or 2 Children | 0 (0.0%) | 9 (34.6%) |
| 3 or 4 Children | 0 (0.0%) | 0 (0.0%) |
| 5 or more Children | 0 (0.0%) | 0 (0.0%) |
| Total | 1 (12.5%) | 9 (16.7%) |
Income Below Poverty Among Married-Couple vs Single-Parent Households in Aynor
The poverty data for Aynor shows that 4 of the married-couple family households (1.9%) and 10 of the single-parent households (16.1%) are living below the poverty level. Within the married-couple family households, those with 1 or 2 children have the highest poverty rate, with 2 households (3.8%) falling below the poverty line. Among the single-parent households, those with 1 or 2 children have the highest poverty rate, with 9 household (32.1%) living below poverty.
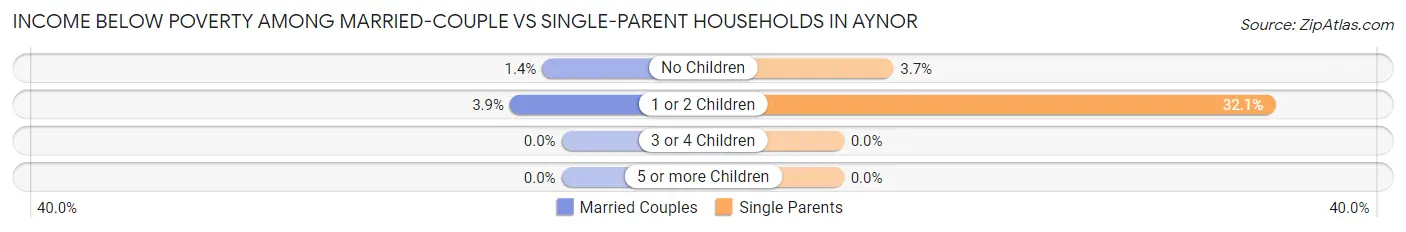
| Children | Married-Couple Families | Single-Parent Households |
| No Children | 2 (1.4%) | 1 (3.7%) |
| 1 or 2 Children | 2 (3.8%) | 9 (32.1%) |
| 3 or 4 Children | 0 (0.0%) | 0 (0.0%) |
| 5 or more Children | 0 (0.0%) | 0 (0.0%) |
| Total | 4 (1.9%) | 10 (16.1%) |
Race in Aynor
The most populous races in Aynor are White / Caucasian (832 | 84.1%), Black / African American (116 | 11.7%), and Two or more Races (34 | 3.4%).
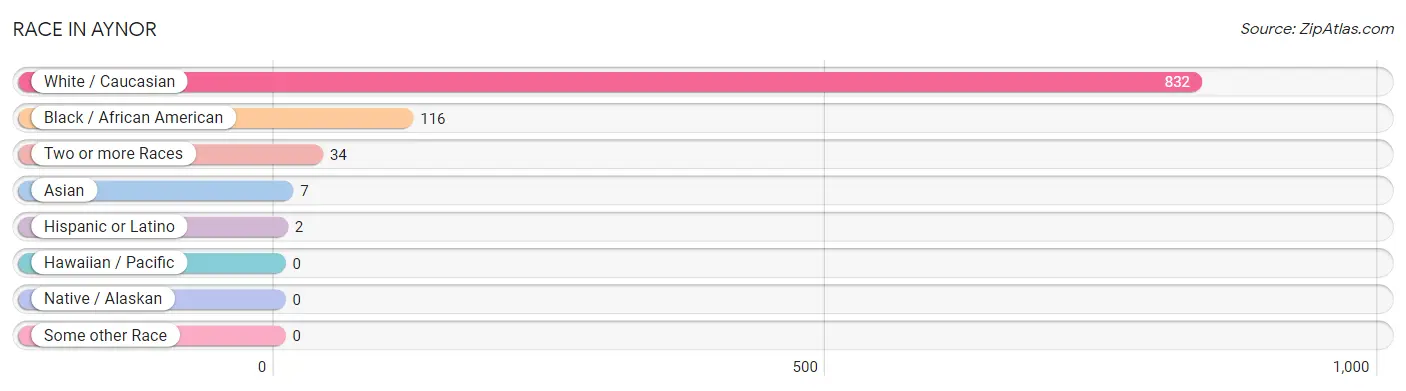
| Race | # Population | % Population |
| Asian | 7 | 0.7% |
| Black / African American | 116 | 11.7% |
| Hawaiian / Pacific | 0 | 0.0% |
| Hispanic or Latino | 2 | 0.2% |
| Native / Alaskan | 0 | 0.0% |
| White / Caucasian | 832 | 84.1% |
| Two or more Races | 34 | 3.4% |
| Some other Race | 0 | 0.0% |
| Total | 989 | 100.0% |
Ancestry in Aynor
The most populous ancestries reported in Aynor are American (254 | 25.7%), English (183 | 18.5%), Irish (65 | 6.6%), German (53 | 5.4%), and Italian (47 | 4.8%), together accounting for 60.9% of all Aynor residents.
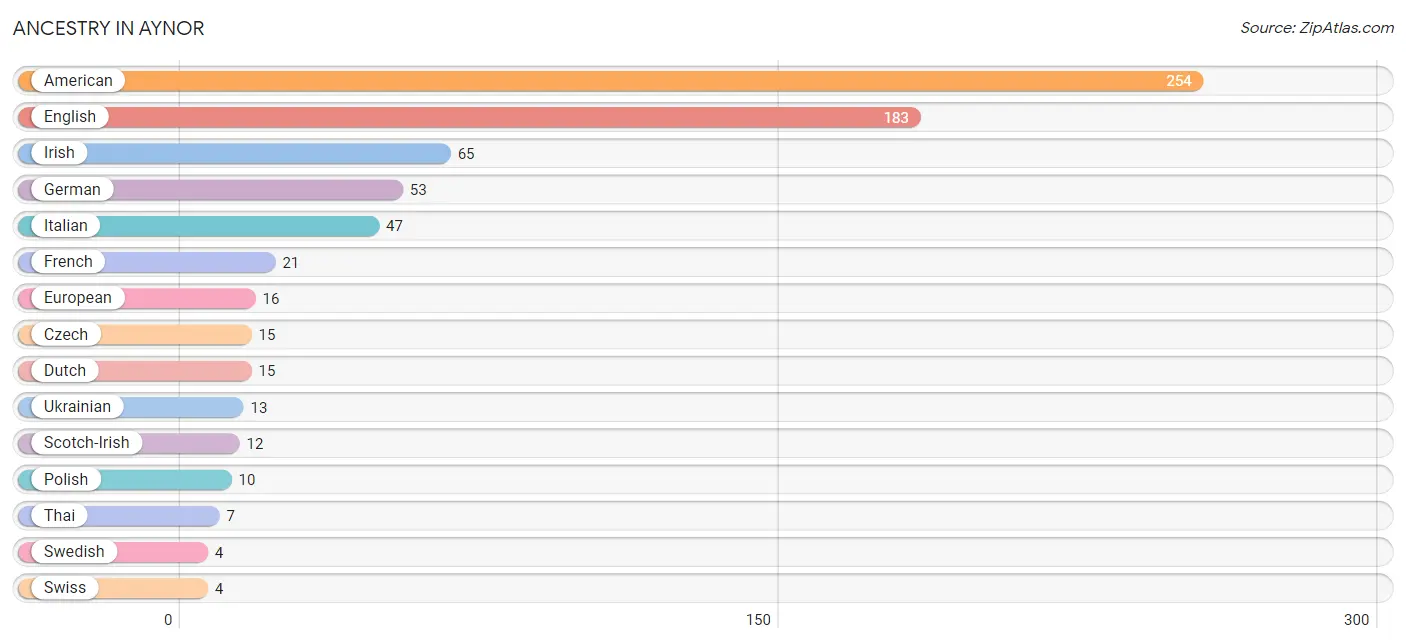
| Ancestry | # Population | % Population |
| American | 254 | 25.7% |
| Czech | 15 | 1.5% |
| Danish | 1 | 0.1% |
| Dutch | 15 | 1.5% |
| English | 183 | 18.5% |
| European | 16 | 1.6% |
| French | 21 | 2.1% |
| German | 53 | 5.4% |
| German Russian | 3 | 0.3% |
| Greek | 2 | 0.2% |
| Irish | 65 | 6.6% |
| Italian | 47 | 4.8% |
| Polish | 10 | 1.0% |
| Portuguese | 2 | 0.2% |
| Scotch-Irish | 12 | 1.2% |
| Scottish | 2 | 0.2% |
| Spaniard | 2 | 0.2% |
| Swedish | 4 | 0.4% |
| Swiss | 4 | 0.4% |
| Thai | 7 | 0.7% |
| Ukrainian | 13 | 1.3% | View All 21 Rows |
Immigrants in Aynor
The most numerous immigrant groups reported in Aynor came from Europe (2 | 0.2%), Greece (2 | 0.2%), and Southern Europe (2 | 0.2%), together accounting for 0.6% of all Aynor residents.
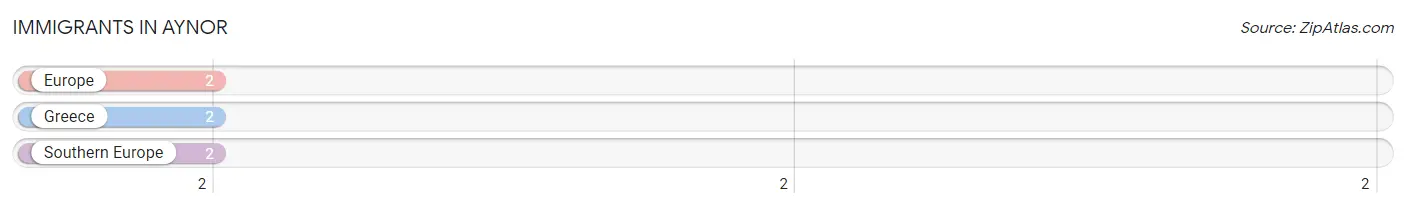
| Immigration Origin | # Population | % Population |
| Europe | 2 | 0.2% |
| Greece | 2 | 0.2% |
| Southern Europe | 2 | 0.2% | View All 3 Rows |
Sex and Age in Aynor
Sex and Age in Aynor
The most populous age groups in Aynor are 10 to 14 Years (53 | 11.9%) for men and 30 to 34 Years (56 | 10.3%) for women.
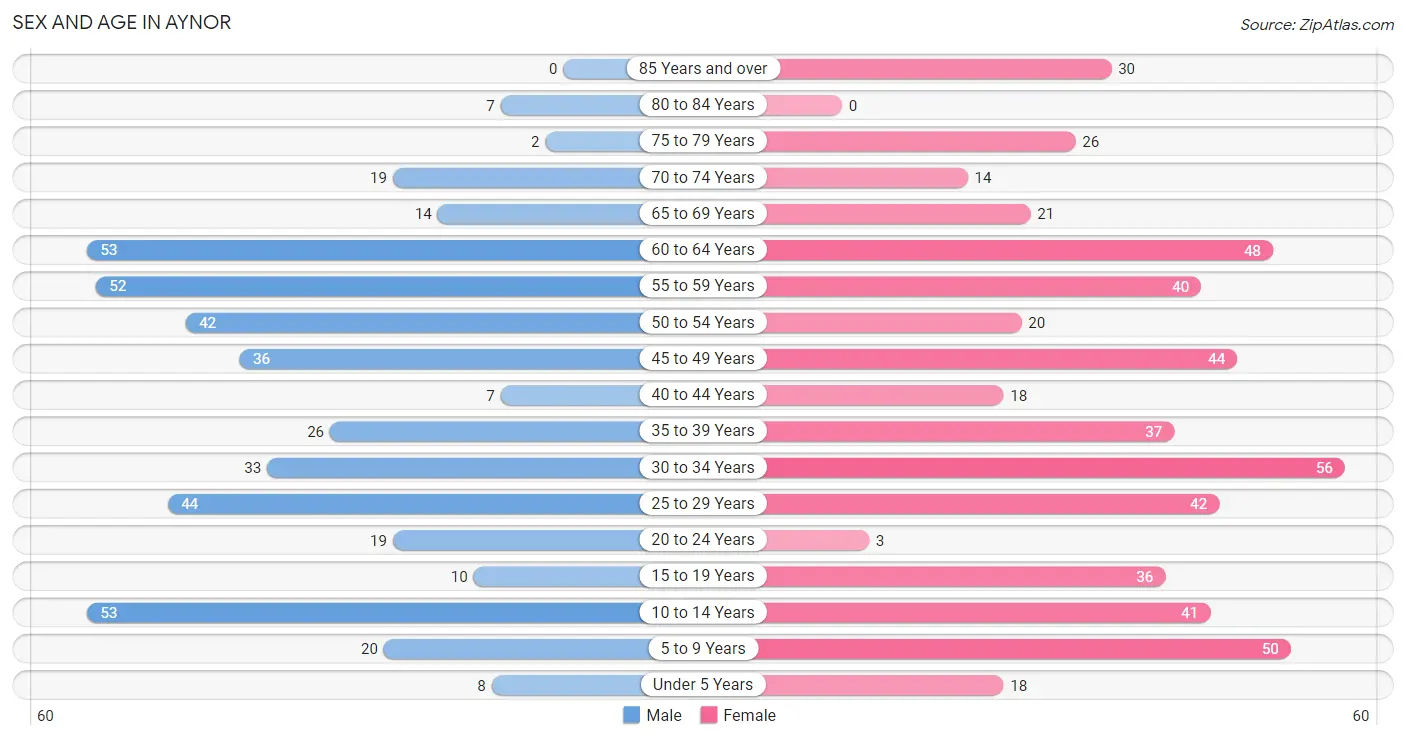
| Age Bracket | Male | Female |
| Under 5 Years | 8 (1.8%) | 18 (3.3%) |
| 5 to 9 Years | 20 (4.5%) | 50 (9.2%) |
| 10 to 14 Years | 53 (11.9%) | 41 (7.5%) |
| 15 to 19 Years | 10 (2.2%) | 36 (6.6%) |
| 20 to 24 Years | 19 (4.3%) | 3 (0.5%) |
| 25 to 29 Years | 44 (9.9%) | 42 (7.7%) |
| 30 to 34 Years | 33 (7.4%) | 56 (10.3%) |
| 35 to 39 Years | 26 (5.8%) | 37 (6.8%) |
| 40 to 44 Years | 7 (1.6%) | 18 (3.3%) |
| 45 to 49 Years | 36 (8.1%) | 44 (8.1%) |
| 50 to 54 Years | 42 (9.4%) | 20 (3.7%) |
| 55 to 59 Years | 52 (11.7%) | 40 (7.3%) |
| 60 to 64 Years | 53 (11.9%) | 48 (8.8%) |
| 65 to 69 Years | 14 (3.2%) | 21 (3.9%) |
| 70 to 74 Years | 19 (4.3%) | 14 (2.6%) |
| 75 to 79 Years | 2 (0.4%) | 26 (4.8%) |
| 80 to 84 Years | 7 (1.6%) | 0 (0.0%) |
| 85 Years and over | 0 (0.0%) | 30 (5.5%) |
| Total | 445 (100.0%) | 544 (100.0%) |
Families and Households in Aynor
Median Family Size in Aynor
The median family size in Aynor is 3.01 persons per family, with single female/mother families (54 | 20.0%) accounting for the largest median family size of 3.07 persons per family. On the other hand, single male/father families (8 | 3.0%) represent the smallest median family size with 2.75 persons per family.
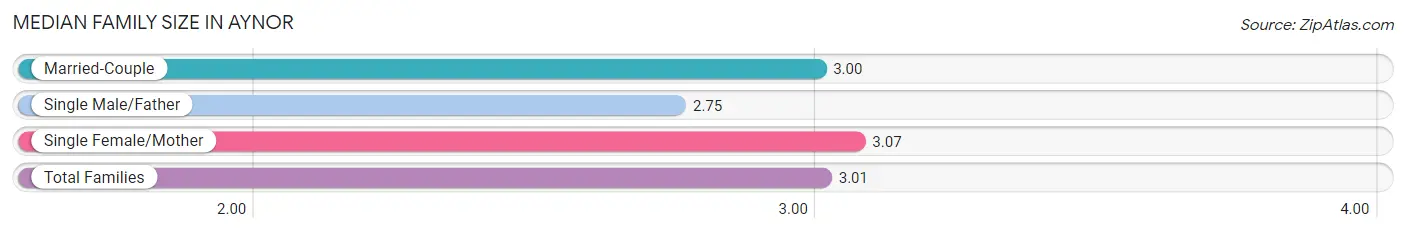
| Family Type | # Families | Family Size |
| Married-Couple | 208 (77.0%) | 3.00 |
| Single Male/Father | 8 (3.0%) | 2.75 |
| Single Female/Mother | 54 (20.0%) | 3.07 |
| Total Families | 270 (100.0%) | 3.01 |
Median Household Size in Aynor
The median household size in Aynor is 2.67 persons per household, with single female/mother households (54 | 14.6%) accounting for the largest median household size of 3.28 persons per household. non-family households (100 | 27.0%) represent the smallest median household size with 1.42 persons per household.
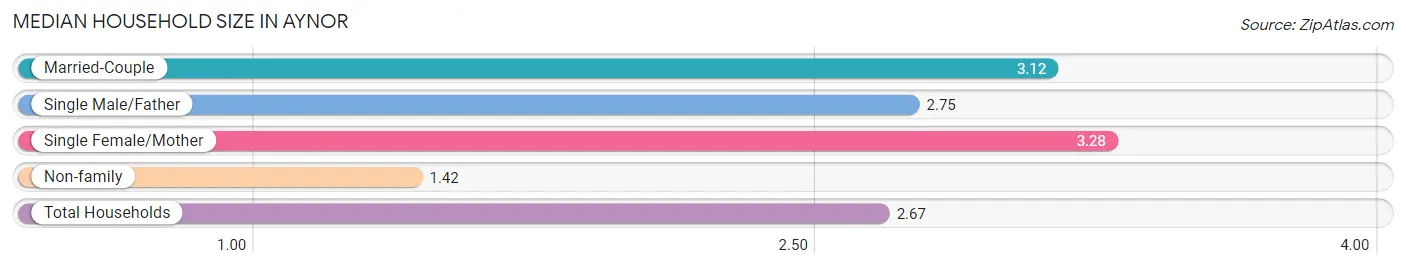
| Household Type | # Households | Household Size |
| Married-Couple | 208 (56.2%) | 3.12 |
| Single Male/Father | 8 (2.2%) | 2.75 |
| Single Female/Mother | 54 (14.6%) | 3.28 |
| Non-family | 100 (27.0%) | 1.42 |
| Total Households | 370 (100.0%) | 2.67 |
Household Size by Marriage Status in Aynor
Out of a total of 370 households in Aynor, 270 (73.0%) are family households, while 100 (27.0%) are nonfamily households. The most numerous type of family households are 2-person households, comprising 154, and the most common type of nonfamily households are 1-person households, comprising 62.
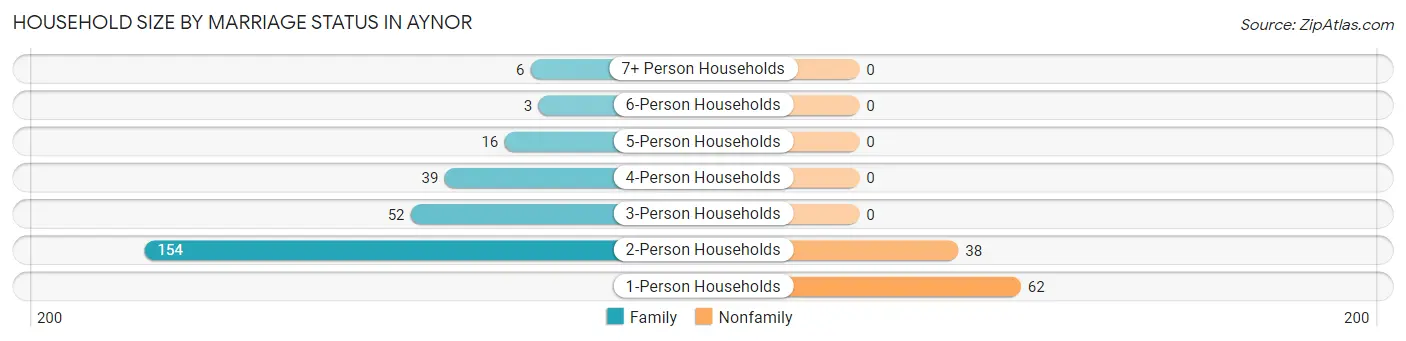
| Household Size | Family Households | Nonfamily Households |
| 1-Person Households | - | 62 (16.8%) |
| 2-Person Households | 154 (41.6%) | 38 (10.3%) |
| 3-Person Households | 52 (14.1%) | 0 (0.0%) |
| 4-Person Households | 39 (10.5%) | 0 (0.0%) |
| 5-Person Households | 16 (4.3%) | 0 (0.0%) |
| 6-Person Households | 3 (0.8%) | 0 (0.0%) |
| 7+ Person Households | 6 (1.6%) | 0 (0.0%) |
| Total | 270 (73.0%) | 100 (27.0%) |
Female Fertility in Aynor
Fertility by Age in Aynor
Average fertility rate in Aynor is 25.0 births per 1,000 women. Women in the age bracket of 20 to 34 years have the highest fertility rate with 59.0 births per 1,000 women. Women in the age bracket of 20 to 34 years acount for 100.0% of all women with births.
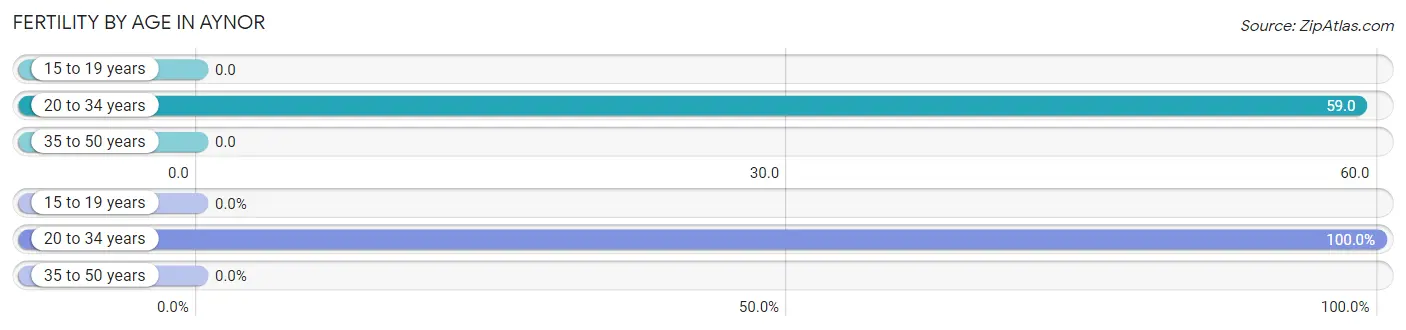
| Age Bracket | Women with Births | Births / 1,000 Women |
| 15 to 19 years | 0 (0.0%) | 0.0 |
| 20 to 34 years | 6 (100.0%) | 59.0 |
| 35 to 50 years | 0 (0.0%) | 0.0 |
| Total | 6 (100.0%) | 25.0 |
Fertility by Age by Marriage Status in Aynor
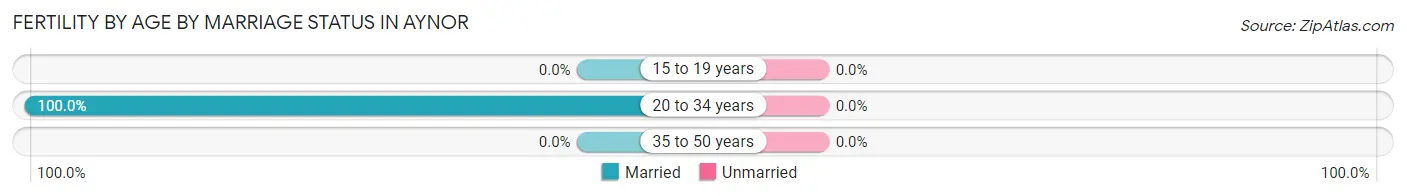
| Age Bracket | Married | Unmarried |
| 15 to 19 years | 0 (0.0%) | 0 (0.0%) |
| 20 to 34 years | 6 (100.0%) | 0 (0.0%) |
| 35 to 50 years | 0 (0.0%) | 0 (0.0%) |
| Total | 6 (100.0%) | 0 (0.0%) |
Fertility by Education in Aynor
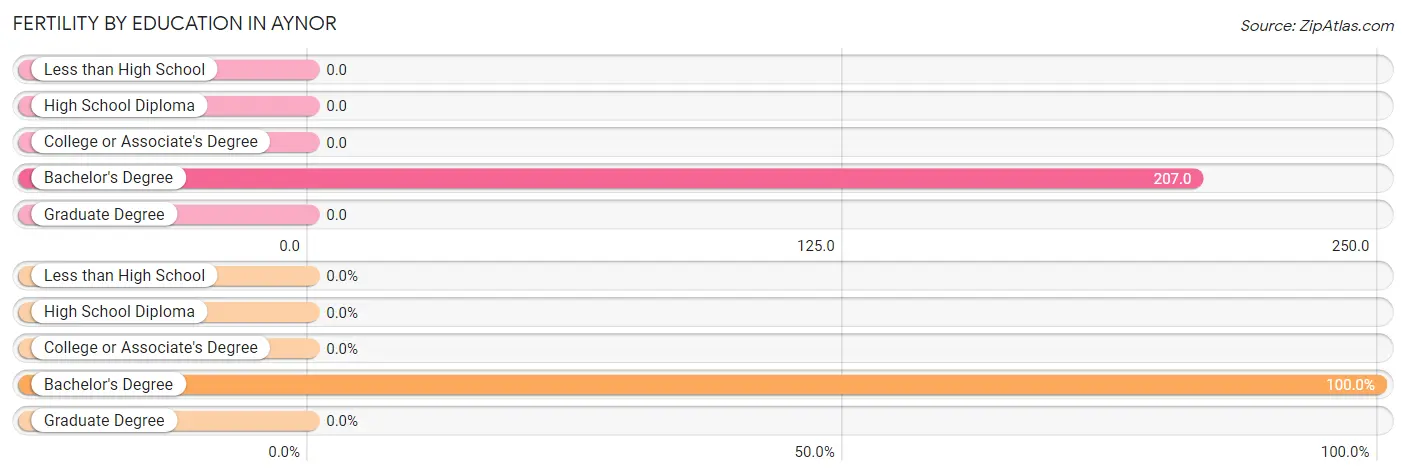
| Educational Attainment | Women with Births | Births / 1,000 Women |
| Less than High School | 0 (0.0%) | 0.0 |
| High School Diploma | 0 (0.0%) | 0.0 |
| College or Associate's Degree | 0 (0.0%) | 0.0 |
| Bachelor's Degree | 6 (100.0%) | 207.0 |
| Graduate Degree | 0 (0.0%) | 0.0 |
| Total | 6 (100.0%) | 25.0 |
Fertility by Education by Marriage Status in Aynor
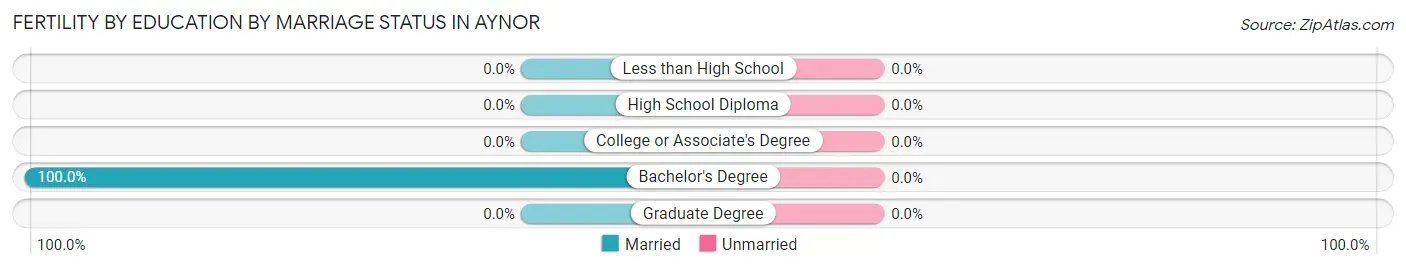
| Educational Attainment | Married | Unmarried |
| Less than High School | 0 (0.0%) | 0 (0.0%) |
| High School Diploma | 0 (0.0%) | 0 (0.0%) |
| College or Associate's Degree | 0 (0.0%) | 0 (0.0%) |
| Bachelor's Degree | 6 (100.0%) | 0 (0.0%) |
| Graduate Degree | 0 (0.0%) | 0 (0.0%) |
| Total | 6 (100.0%) | 0 (0.0%) |
Employment Characteristics in Aynor
Employment by Class of Employer in Aynor
Among the 493 employed individuals in Aynor, private company employees (268 | 54.4%), federal government employees (87 | 17.6%), and not-for-profit organizations (35 | 7.1%) make up the most common classes of employment.
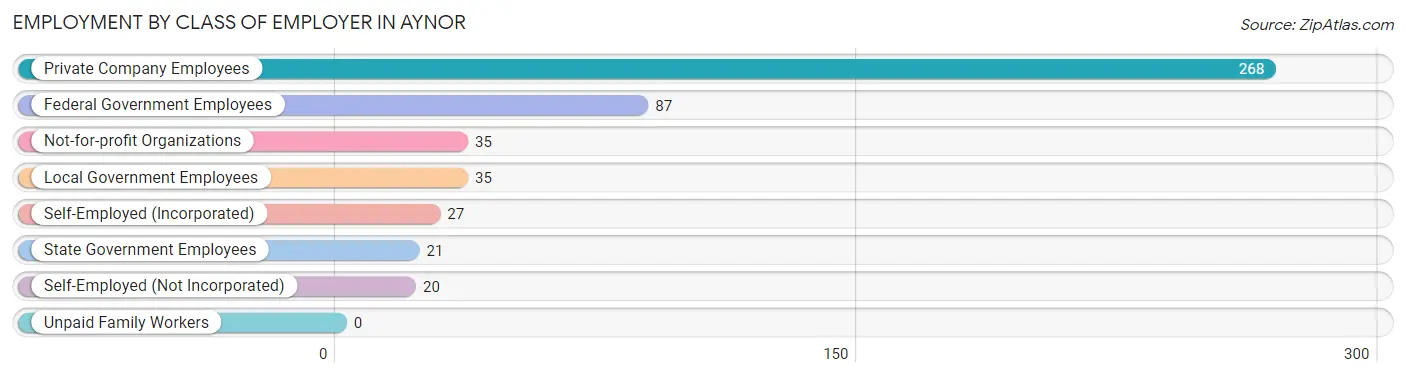
| Employer Class | # Employees | % Employees |
| Private Company Employees | 268 | 54.4% |
| Self-Employed (Incorporated) | 27 | 5.5% |
| Self-Employed (Not Incorporated) | 20 | 4.1% |
| Not-for-profit Organizations | 35 | 7.1% |
| Local Government Employees | 35 | 7.1% |
| State Government Employees | 21 | 4.3% |
| Federal Government Employees | 87 | 17.6% |
| Unpaid Family Workers | 0 | 0.0% |
| Total | 493 | 100.0% |
Employment Status by Age in Aynor
According to the labor force statistics for Aynor, out of the total population over 16 years of age (783), 64.8% or 507 individuals are in the labor force, with 2.2% or 11 of them unemployed. The age group with the highest labor force participation rate is 30 to 34 years, with 96.6% or 86 individuals in the labor force. Within the labor force, the 16 to 19 years age range has the highest percentage of unemployed individuals, with 33.3% or 3 of them being unemployed.
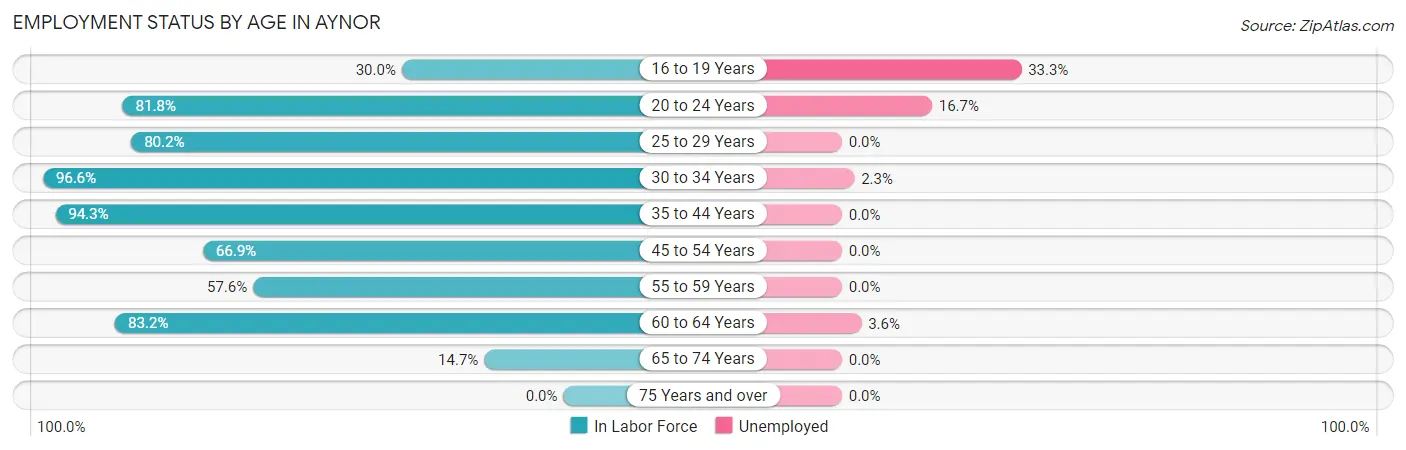
| Age Bracket | In Labor Force | Unemployed |
| 16 to 19 Years | 9 (30.0%) | 3 (33.3%) |
| 20 to 24 Years | 18 (81.8%) | 3 (16.7%) |
| 25 to 29 Years | 69 (80.2%) | 0 (0.0%) |
| 30 to 34 Years | 86 (96.6%) | 2 (2.3%) |
| 35 to 44 Years | 83 (94.3%) | 0 (0.0%) |
| 45 to 54 Years | 95 (66.9%) | 0 (0.0%) |
| 55 to 59 Years | 53 (57.6%) | 0 (0.0%) |
| 60 to 64 Years | 84 (83.2%) | 3 (3.6%) |
| 65 to 74 Years | 10 (14.7%) | 0 (0.0%) |
| 75 Years and over | 0 (0.0%) | 0 (0.0%) |
| Total | 507 (64.8%) | 11 (2.2%) |
Employment Status by Educational Attainment in Aynor
According to labor force statistics for Aynor, 78.6% of individuals (470) out of the total population between 25 and 64 years of age (598) are in the labor force, with 1.1% or 5 of them being unemployed. The group with the highest labor force participation rate are those with the educational attainment of bachelor's degree or higher, with 88.0% or 139 individuals in the labor force. Within the labor force, individuals with bachelor's degree or higher education have the highest percentage of unemployment, with 2.2% or 3 of them being unemployed.
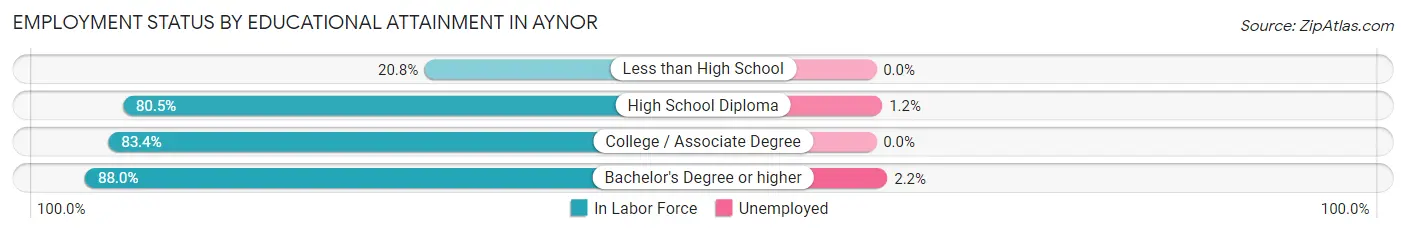
| Educational Attainment | In Labor Force | Unemployed |
| Less than High School | 10 (20.8%) | 0 (0.0%) |
| High School Diploma | 165 (80.5%) | 2 (1.2%) |
| College / Associate Degree | 156 (83.4%) | 0 (0.0%) |
| Bachelor's Degree or higher | 139 (88.0%) | 3 (2.2%) |
| Total | 470 (78.6%) | 7 (1.1%) |
Employment Occupations by Sex in Aynor
Management, Business, Science and Arts Occupations
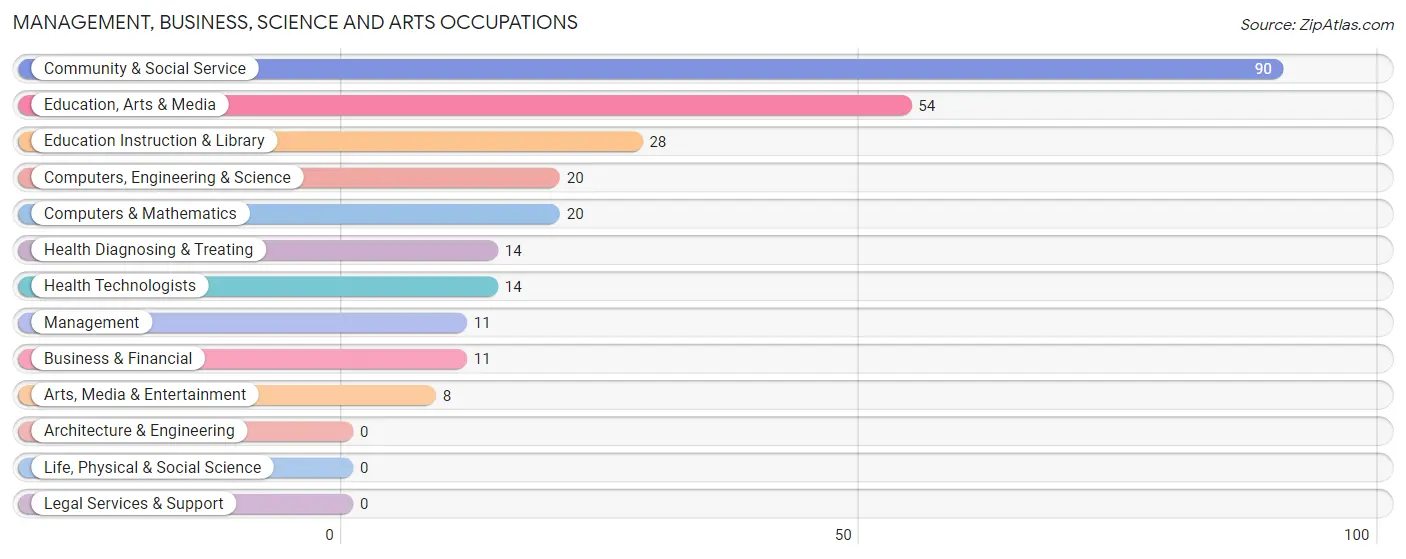
The most common Management, Business, Science and Arts occupations in Aynor are Community & Social Service (90 | 18.1%), Education, Arts & Media (54 | 10.9%), Education Instruction & Library (28 | 5.7%), Computers, Engineering & Science (20 | 4.0%), and Computers & Mathematics (20 | 4.0%).
Management, Business, Science and Arts Occupations by Sex
Within the Management, Business, Science and Arts occupations in Aynor, the most male-oriented occupations are Computers, Engineering & Science (100.0%), Computers & Mathematics (100.0%), and Education, Arts & Media (92.6%), while the most female-oriented occupations are Health Diagnosing & Treating (100.0%), Health Technologists (100.0%), and Management (81.8%).
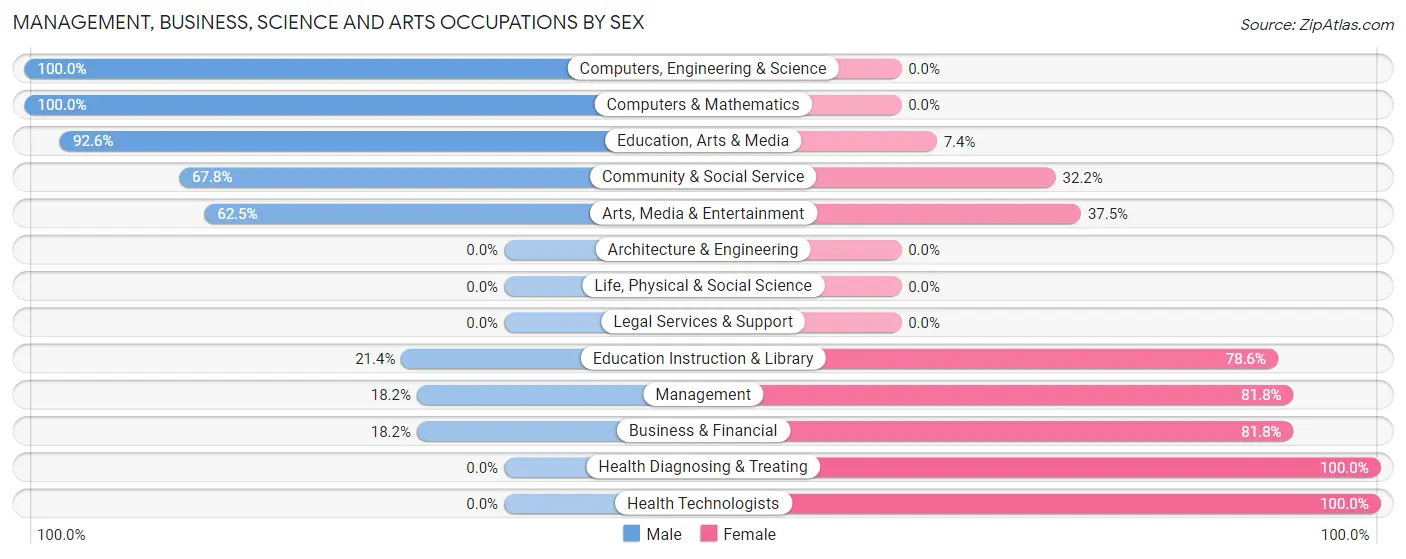
| Occupation | Male | Female |
| Management | 2 (18.2%) | 9 (81.8%) |
| Business & Financial | 2 (18.2%) | 9 (81.8%) |
| Computers, Engineering & Science | 20 (100.0%) | 0 (0.0%) |
| Computers & Mathematics | 20 (100.0%) | 0 (0.0%) |
| Architecture & Engineering | 0 (0.0%) | 0 (0.0%) |
| Life, Physical & Social Science | 0 (0.0%) | 0 (0.0%) |
| Community & Social Service | 61 (67.8%) | 29 (32.2%) |
| Education, Arts & Media | 50 (92.6%) | 4 (7.4%) |
| Legal Services & Support | 0 (0.0%) | 0 (0.0%) |
| Education Instruction & Library | 6 (21.4%) | 22 (78.6%) |
| Arts, Media & Entertainment | 5 (62.5%) | 3 (37.5%) |
| Health Diagnosing & Treating | 0 (0.0%) | 14 (100.0%) |
| Health Technologists | 0 (0.0%) | 14 (100.0%) |
| Total (Category) | 85 (58.2%) | 61 (41.8%) |
| Total (Overall) | 258 (52.0%) | 238 (48.0%) |
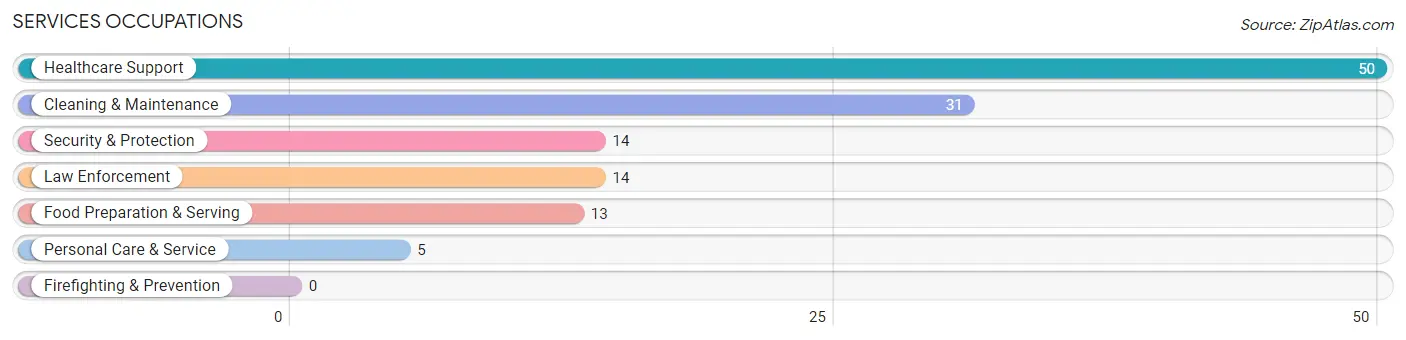
Services Occupations
The most common Services occupations in Aynor are Healthcare Support (50 | 10.1%), Cleaning & Maintenance (31 | 6.2%), Security & Protection (14 | 2.8%), Law Enforcement (14 | 2.8%), and Food Preparation & Serving (13 | 2.6%).
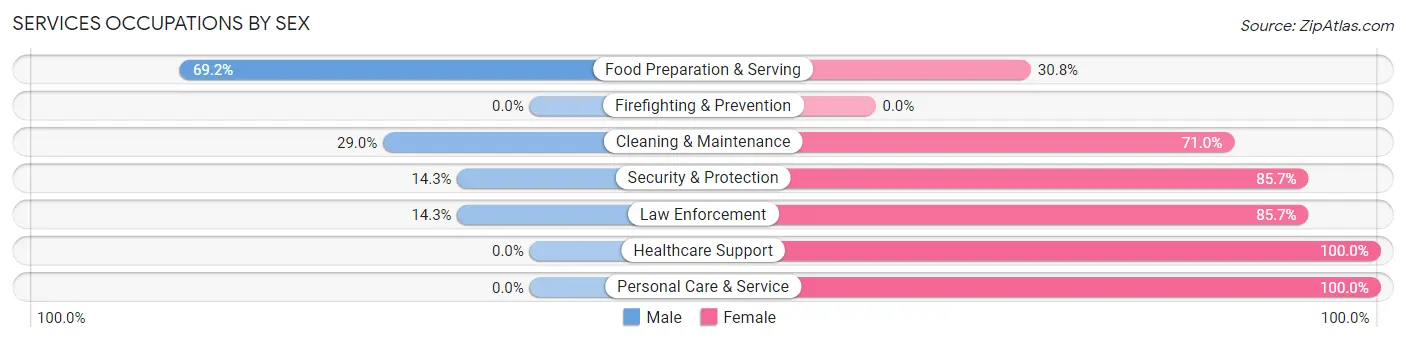
Services Occupations by Sex
Within the Services occupations in Aynor, the most male-oriented occupations are Food Preparation & Serving (69.2%), Cleaning & Maintenance (29.0%), and Security & Protection (14.3%), while the most female-oriented occupations are Healthcare Support (100.0%), Personal Care & Service (100.0%), and Security & Protection (85.7%).
| Occupation | Male | Female |
| Healthcare Support | 0 (0.0%) | 50 (100.0%) |
| Security & Protection | 2 (14.3%) | 12 (85.7%) |
| Firefighting & Prevention | 0 (0.0%) | 0 (0.0%) |
| Law Enforcement | 2 (14.3%) | 12 (85.7%) |
| Food Preparation & Serving | 9 (69.2%) | 4 (30.8%) |
| Cleaning & Maintenance | 9 (29.0%) | 22 (71.0%) |
| Personal Care & Service | 0 (0.0%) | 5 (100.0%) |
| Total (Category) | 20 (17.7%) | 93 (82.3%) |
| Total (Overall) | 258 (52.0%) | 238 (48.0%) |
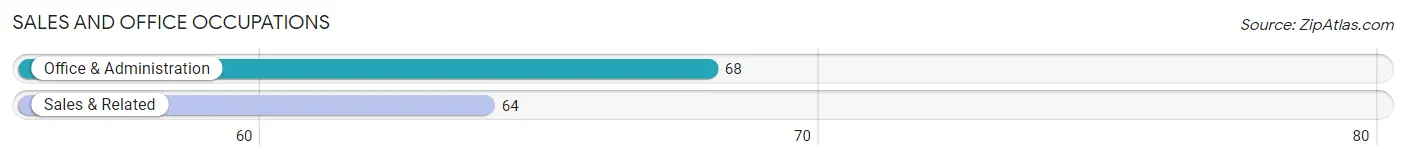
Sales and Office Occupations
The most common Sales and Office occupations in Aynor are Office & Administration (68 | 13.7%), and Sales & Related (64 | 12.9%).
Sales and Office Occupations by Sex
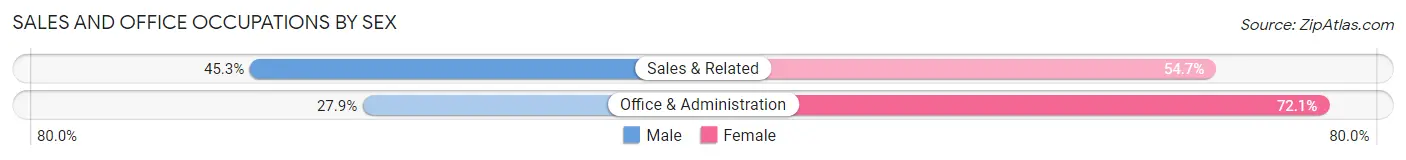
| Occupation | Male | Female |
| Sales & Related | 29 (45.3%) | 35 (54.7%) |
| Office & Administration | 19 (27.9%) | 49 (72.1%) |
| Total (Category) | 48 (36.4%) | 84 (63.6%) |
| Total (Overall) | 258 (52.0%) | 238 (48.0%) |
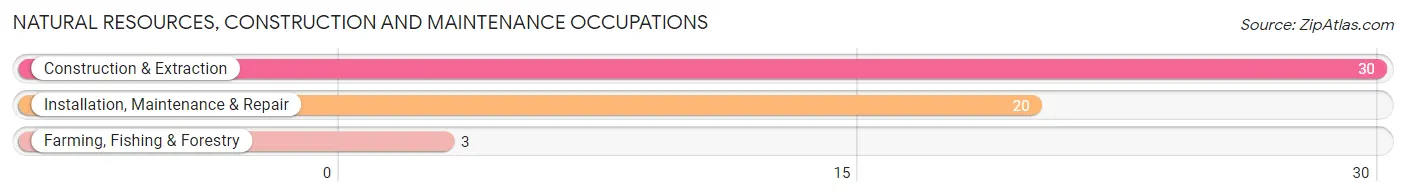
Natural Resources, Construction and Maintenance Occupations
The most common Natural Resources, Construction and Maintenance occupations in Aynor are Construction & Extraction (30 | 6.0%), Installation, Maintenance & Repair (20 | 4.0%), and Farming, Fishing & Forestry (3 | 0.6%).
Natural Resources, Construction and Maintenance Occupations by Sex
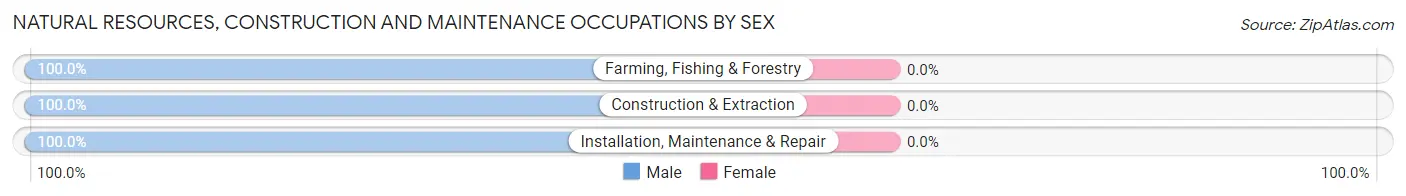
| Occupation | Male | Female |
| Farming, Fishing & Forestry | 3 (100.0%) | 0 (0.0%) |
| Construction & Extraction | 30 (100.0%) | 0 (0.0%) |
| Installation, Maintenance & Repair | 20 (100.0%) | 0 (0.0%) |
| Total (Category) | 53 (100.0%) | 0 (0.0%) |
| Total (Overall) | 258 (52.0%) | 238 (48.0%) |
Production, Transportation and Moving Occupations
The most common Production, Transportation and Moving occupations in Aynor are Production (30 | 6.0%), Material Moving (14 | 2.8%), and Transportation (8 | 1.6%).
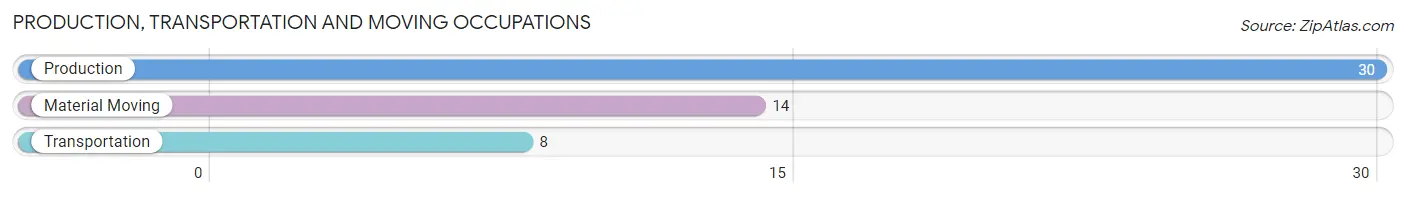
Production, Transportation and Moving Occupations by Sex
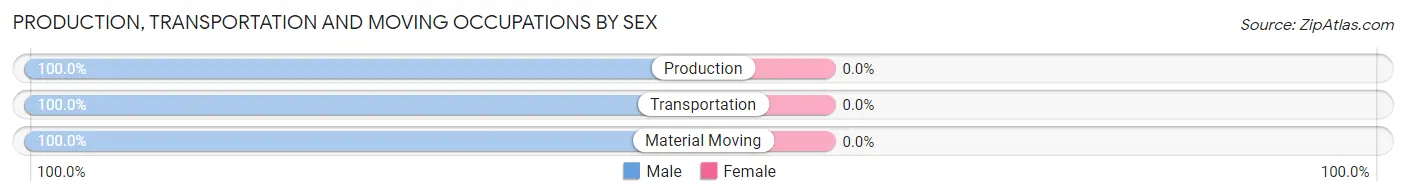
| Occupation | Male | Female |
| Production | 30 (100.0%) | 0 (0.0%) |
| Transportation | 8 (100.0%) | 0 (0.0%) |
| Material Moving | 14 (100.0%) | 0 (0.0%) |
| Total (Category) | 52 (100.0%) | 0 (0.0%) |
| Total (Overall) | 258 (52.0%) | 238 (48.0%) |
Employment Industries by Sex in Aynor
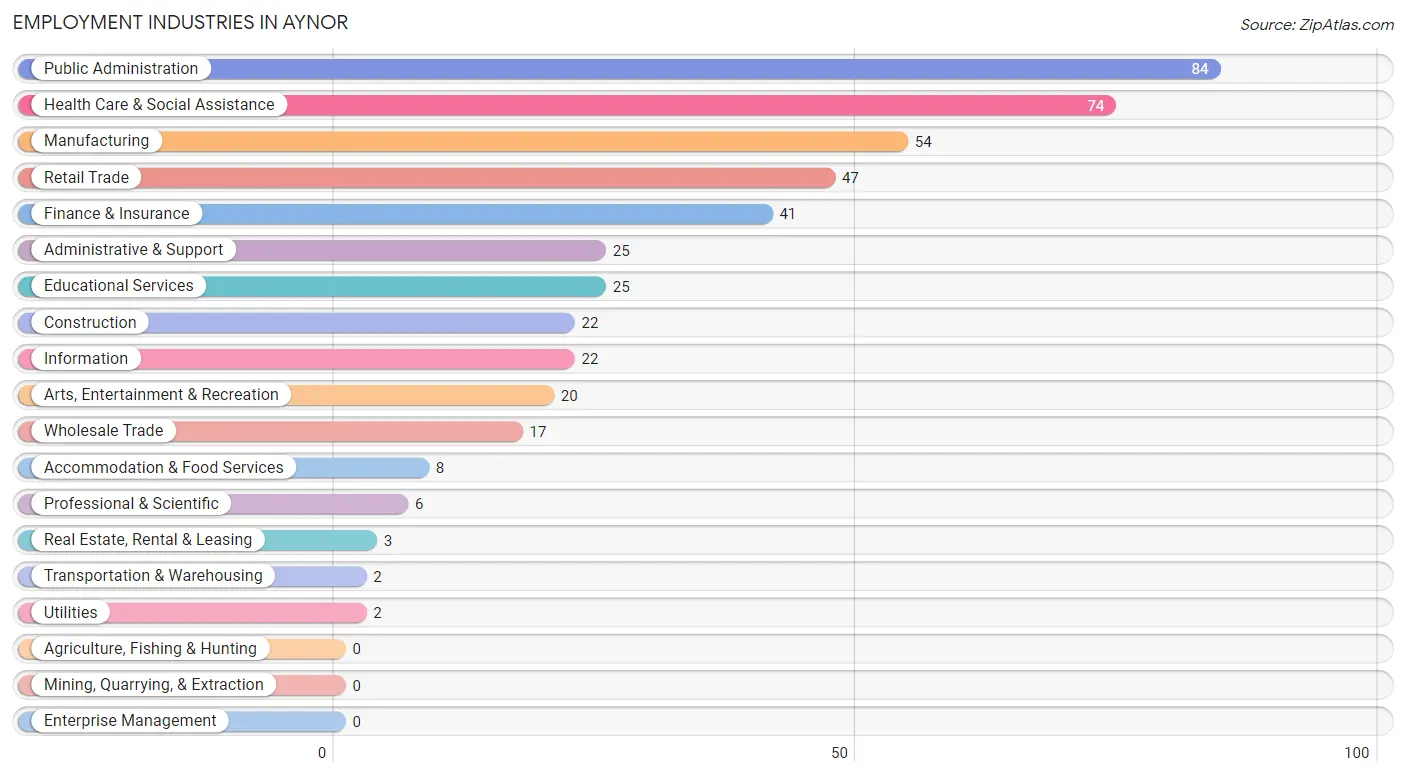
Employment Industries in Aynor
The major employment industries in Aynor include Public Administration (84 | 16.9%), Health Care & Social Assistance (74 | 14.9%), Manufacturing (54 | 10.9%), Retail Trade (47 | 9.5%), and Finance & Insurance (41 | 8.3%).
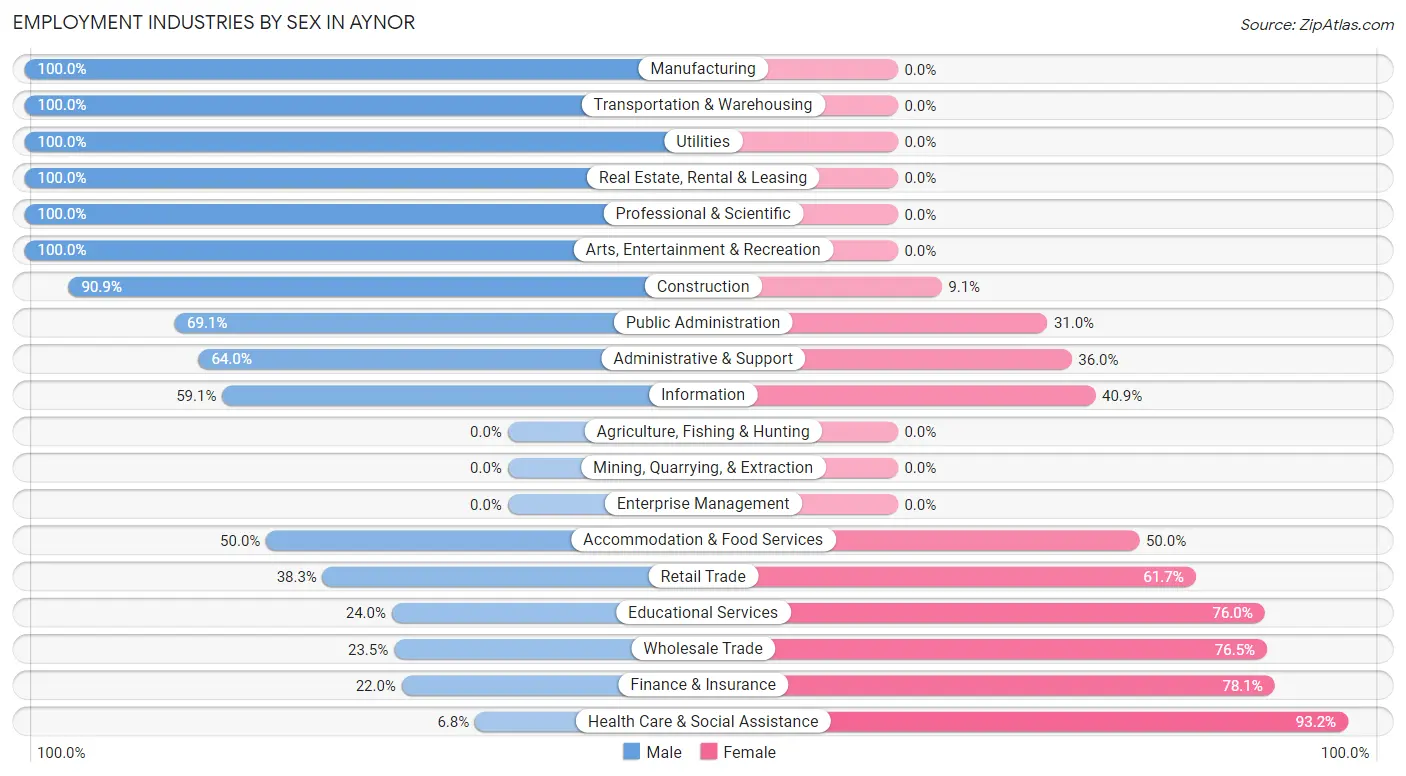
Employment Industries by Sex in Aynor
The Aynor industries that see more men than women are Manufacturing (100.0%), Transportation & Warehousing (100.0%), and Utilities (100.0%), whereas the industries that tend to have a higher number of women are Health Care & Social Assistance (93.2%), Finance & Insurance (78.0%), and Wholesale Trade (76.5%).
| Industry | Male | Female |
| Agriculture, Fishing & Hunting | 0 (0.0%) | 0 (0.0%) |
| Mining, Quarrying, & Extraction | 0 (0.0%) | 0 (0.0%) |
| Construction | 20 (90.9%) | 2 (9.1%) |
| Manufacturing | 54 (100.0%) | 0 (0.0%) |
| Wholesale Trade | 4 (23.5%) | 13 (76.5%) |
| Retail Trade | 18 (38.3%) | 29 (61.7%) |
| Transportation & Warehousing | 2 (100.0%) | 0 (0.0%) |
| Utilities | 2 (100.0%) | 0 (0.0%) |
| Information | 13 (59.1%) | 9 (40.9%) |
| Finance & Insurance | 9 (22.0%) | 32 (78.0%) |
| Real Estate, Rental & Leasing | 3 (100.0%) | 0 (0.0%) |
| Professional & Scientific | 6 (100.0%) | 0 (0.0%) |
| Enterprise Management | 0 (0.0%) | 0 (0.0%) |
| Administrative & Support | 16 (64.0%) | 9 (36.0%) |
| Educational Services | 6 (24.0%) | 19 (76.0%) |
| Health Care & Social Assistance | 5 (6.8%) | 69 (93.2%) |
| Arts, Entertainment & Recreation | 20 (100.0%) | 0 (0.0%) |
| Accommodation & Food Services | 4 (50.0%) | 4 (50.0%) |
| Public Administration | 58 (69.1%) | 26 (30.9%) |
| Total | 258 (52.0%) | 238 (48.0%) |
Education in Aynor
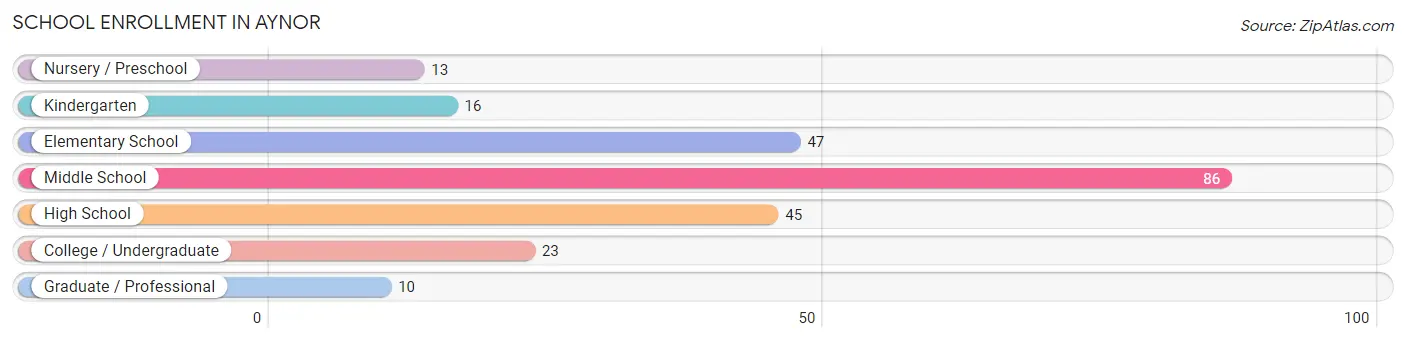
School Enrollment in Aynor
The most common levels of schooling among the 240 students in Aynor are middle school (86 | 35.8%), elementary school (47 | 19.6%), and high school (45 | 18.8%).
| School Level | # Students | % Students |
| Nursery / Preschool | 13 | 5.4% |
| Kindergarten | 16 | 6.7% |
| Elementary School | 47 | 19.6% |
| Middle School | 86 | 35.8% |
| High School | 45 | 18.8% |
| College / Undergraduate | 23 | 9.6% |
| Graduate / Professional | 10 | 4.2% |
| Total | 240 | 100.0% |
School Enrollment by Age by Funding Source in Aynor
Out of a total of 240 students who are enrolled in schools in Aynor, 14 (5.8%) attend a private institution, while the remaining 226 (94.2%) are enrolled in public schools. The age group of 25 to 34 year olds has the highest likelihood of being enrolled in private schools, with 8 (57.1% in the age bracket) enrolled. Conversely, the age group of 5 to 9 year old has the lowest likelihood of being enrolled in a private school, with 70 (100.0% in the age bracket) attending a public institution.
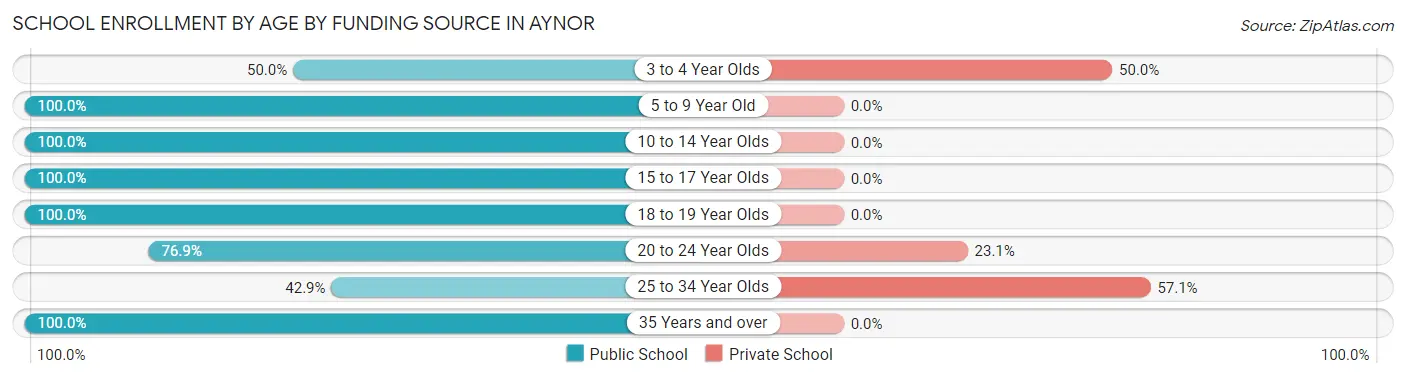
| Age Bracket | Public School | Private School |
| 3 to 4 Year Olds | 3 (50.0%) | 3 (50.0%) |
| 5 to 9 Year Old | 70 (100.0%) | 0 (0.0%) |
| 10 to 14 Year Olds | 94 (100.0%) | 0 (0.0%) |
| 15 to 17 Year Olds | 37 (100.0%) | 0 (0.0%) |
| 18 to 19 Year Olds | 4 (100.0%) | 0 (0.0%) |
| 20 to 24 Year Olds | 10 (76.9%) | 3 (23.1%) |
| 25 to 34 Year Olds | 6 (42.9%) | 8 (57.1%) |
| 35 Years and over | 2 (100.0%) | 0 (0.0%) |
| Total | 226 (94.2%) | 14 (5.8%) |
Educational Attainment by Field of Study in Aynor
Business (68 | 36.8%), education (25 | 13.5%), science & technology (22 | 11.9%), bio, nature & agricultural (17 | 9.2%), and social sciences (14 | 7.6%) are the most common fields of study among 185 individuals in Aynor who have obtained a bachelor's degree or higher.
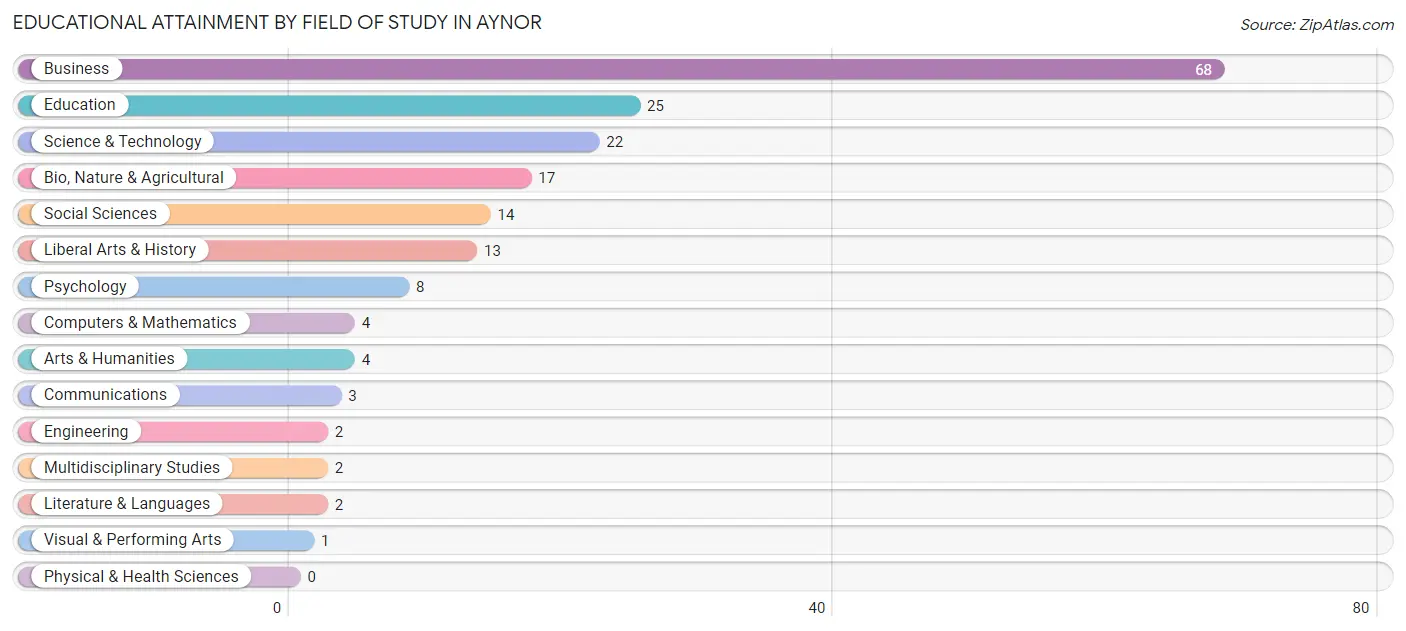
| Field of Study | # Graduates | % Graduates |
| Computers & Mathematics | 4 | 2.2% |
| Bio, Nature & Agricultural | 17 | 9.2% |
| Physical & Health Sciences | 0 | 0.0% |
| Psychology | 8 | 4.3% |
| Social Sciences | 14 | 7.6% |
| Engineering | 2 | 1.1% |
| Multidisciplinary Studies | 2 | 1.1% |
| Science & Technology | 22 | 11.9% |
| Business | 68 | 36.8% |
| Education | 25 | 13.5% |
| Literature & Languages | 2 | 1.1% |
| Liberal Arts & History | 13 | 7.0% |
| Visual & Performing Arts | 1 | 0.5% |
| Communications | 3 | 1.6% |
| Arts & Humanities | 4 | 2.2% |
| Total | 185 | 100.0% |
Transportation & Commute in Aynor
Vehicle Availability by Sex in Aynor
The most prevalent vehicle ownership categories in Aynor are males with 2 vehicles (169, accounting for 66.3%) and females with 2 vehicles (132, making up 71.0%).
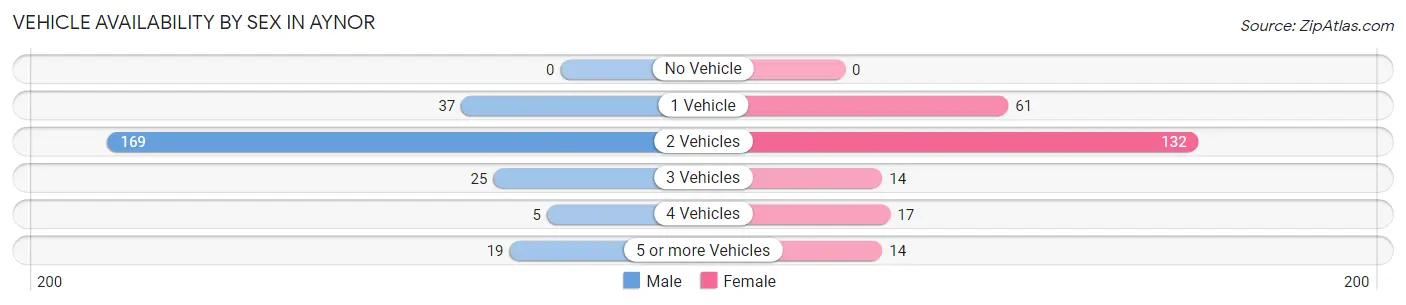
| Vehicles Available | Male | Female |
| No Vehicle | 0 (0.0%) | 0 (0.0%) |
| 1 Vehicle | 37 (14.5%) | 61 (25.6%) |
| 2 Vehicles | 169 (66.3%) | 132 (55.5%) |
| 3 Vehicles | 25 (9.8%) | 14 (5.9%) |
| 4 Vehicles | 5 (2.0%) | 17 (7.1%) |
| 5 or more Vehicles | 19 (7.4%) | 14 (5.9%) |
| Total | 255 (100.0%) | 238 (100.0%) |
Commute Time in Aynor
The most frequently occuring commute durations in Aynor are 30 to 34 minutes (83 commuters, 18.7%), 20 to 24 minutes (82 commuters, 18.5%), and 45 to 59 minutes (74 commuters, 16.7%).
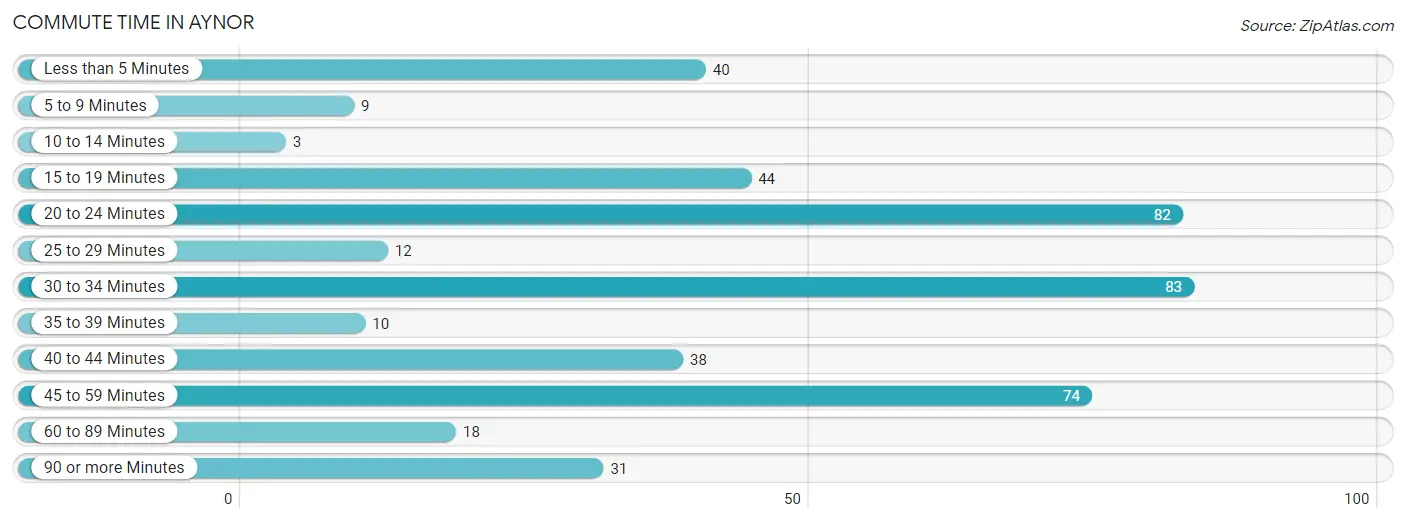
| Commute Time | # Commuters | % Commuters |
| Less than 5 Minutes | 40 | 9.0% |
| 5 to 9 Minutes | 9 | 2.0% |
| 10 to 14 Minutes | 3 | 0.7% |
| 15 to 19 Minutes | 44 | 9.9% |
| 20 to 24 Minutes | 82 | 18.5% |
| 25 to 29 Minutes | 12 | 2.7% |
| 30 to 34 Minutes | 83 | 18.7% |
| 35 to 39 Minutes | 10 | 2.2% |
| 40 to 44 Minutes | 38 | 8.6% |
| 45 to 59 Minutes | 74 | 16.7% |
| 60 to 89 Minutes | 18 | 4.1% |
| 90 or more Minutes | 31 | 7.0% |
Commute Time by Sex in Aynor
The most common commute times in Aynor are 30 to 34 minutes (72 commuters, 33.2%) for males and 20 to 24 minutes (50 commuters, 22.0%) for females.
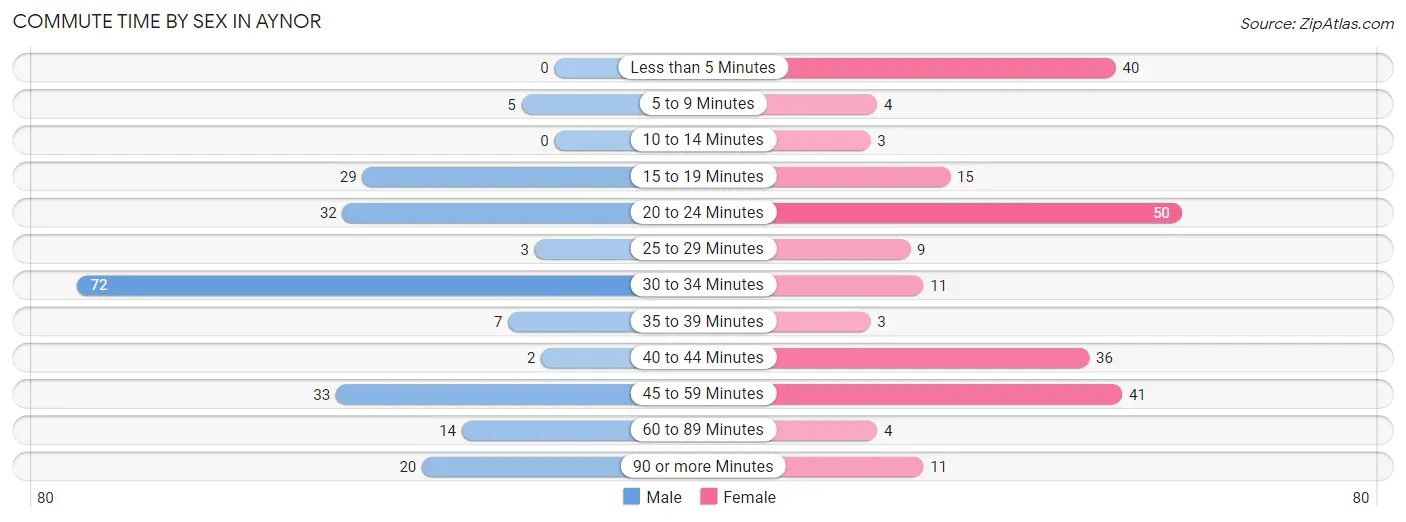
| Commute Time | Male | Female |
| Less than 5 Minutes | 0 (0.0%) | 40 (17.6%) |
| 5 to 9 Minutes | 5 (2.3%) | 4 (1.8%) |
| 10 to 14 Minutes | 0 (0.0%) | 3 (1.3%) |
| 15 to 19 Minutes | 29 (13.4%) | 15 (6.6%) |
| 20 to 24 Minutes | 32 (14.7%) | 50 (22.0%) |
| 25 to 29 Minutes | 3 (1.4%) | 9 (4.0%) |
| 30 to 34 Minutes | 72 (33.2%) | 11 (4.9%) |
| 35 to 39 Minutes | 7 (3.2%) | 3 (1.3%) |
| 40 to 44 Minutes | 2 (0.9%) | 36 (15.9%) |
| 45 to 59 Minutes | 33 (15.2%) | 41 (18.1%) |
| 60 to 89 Minutes | 14 (6.5%) | 4 (1.8%) |
| 90 or more Minutes | 20 (9.2%) | 11 (4.9%) |
Time of Departure to Work by Sex in Aynor
The most frequent times of departure to work in Aynor are 7:00 AM to 7:29 AM (61, 28.1%) for males and 7:30 AM to 7:59 AM (93, 41.0%) for females.
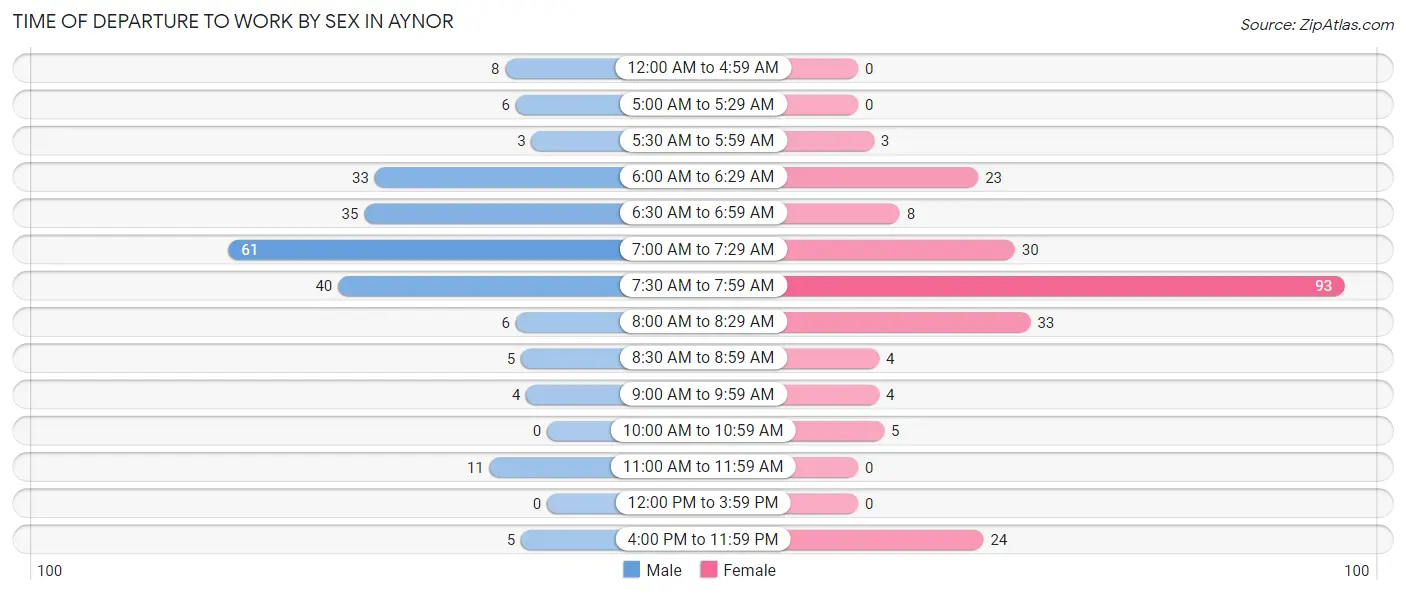
| Time of Departure | Male | Female |
| 12:00 AM to 4:59 AM | 8 (3.7%) | 0 (0.0%) |
| 5:00 AM to 5:29 AM | 6 (2.8%) | 0 (0.0%) |
| 5:30 AM to 5:59 AM | 3 (1.4%) | 3 (1.3%) |
| 6:00 AM to 6:29 AM | 33 (15.2%) | 23 (10.1%) |
| 6:30 AM to 6:59 AM | 35 (16.1%) | 8 (3.5%) |
| 7:00 AM to 7:29 AM | 61 (28.1%) | 30 (13.2%) |
| 7:30 AM to 7:59 AM | 40 (18.4%) | 93 (41.0%) |
| 8:00 AM to 8:29 AM | 6 (2.8%) | 33 (14.5%) |
| 8:30 AM to 8:59 AM | 5 (2.3%) | 4 (1.8%) |
| 9:00 AM to 9:59 AM | 4 (1.8%) | 4 (1.8%) |
| 10:00 AM to 10:59 AM | 0 (0.0%) | 5 (2.2%) |
| 11:00 AM to 11:59 AM | 11 (5.1%) | 0 (0.0%) |
| 12:00 PM to 3:59 PM | 0 (0.0%) | 0 (0.0%) |
| 4:00 PM to 11:59 PM | 5 (2.3%) | 24 (10.6%) |
| Total | 217 (100.0%) | 227 (100.0%) |
Housing Occupancy in Aynor
Occupancy by Ownership in Aynor
Of the total 370 dwellings in Aynor, owner-occupied units account for 253 (68.4%), while renter-occupied units make up 117 (31.6%).
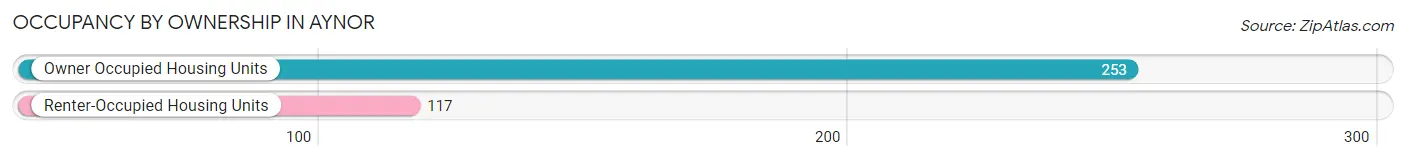
| Occupancy | # Housing Units | % Housing Units |
| Owner Occupied Housing Units | 253 | 68.4% |
| Renter-Occupied Housing Units | 117 | 31.6% |
| Total Occupied Housing Units | 370 | 100.0% |
Occupancy by Household Size in Aynor
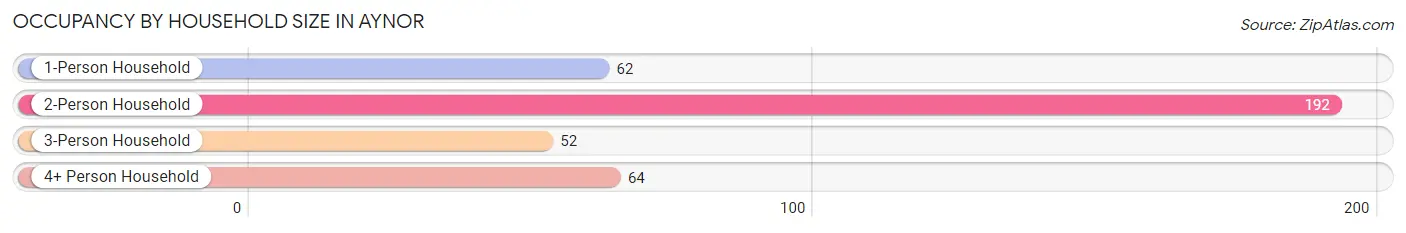
| Household Size | # Housing Units | % Housing Units |
| 1-Person Household | 62 | 16.8% |
| 2-Person Household | 192 | 51.9% |
| 3-Person Household | 52 | 14.1% |
| 4+ Person Household | 64 | 17.3% |
| Total Housing Units | 370 | 100.0% |
Occupancy by Ownership by Household Size in Aynor
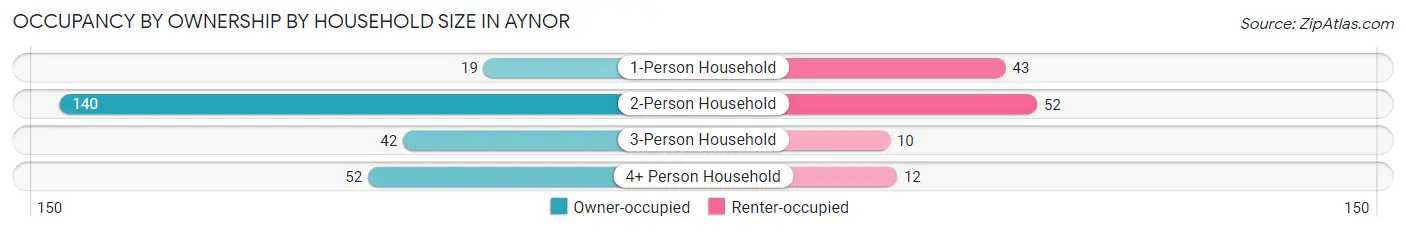
| Household Size | Owner-occupied | Renter-occupied |
| 1-Person Household | 19 (30.6%) | 43 (69.4%) |
| 2-Person Household | 140 (72.9%) | 52 (27.1%) |
| 3-Person Household | 42 (80.8%) | 10 (19.2%) |
| 4+ Person Household | 52 (81.2%) | 12 (18.8%) |
| Total Housing Units | 253 (68.4%) | 117 (31.6%) |
Occupancy by Educational Attainment in Aynor
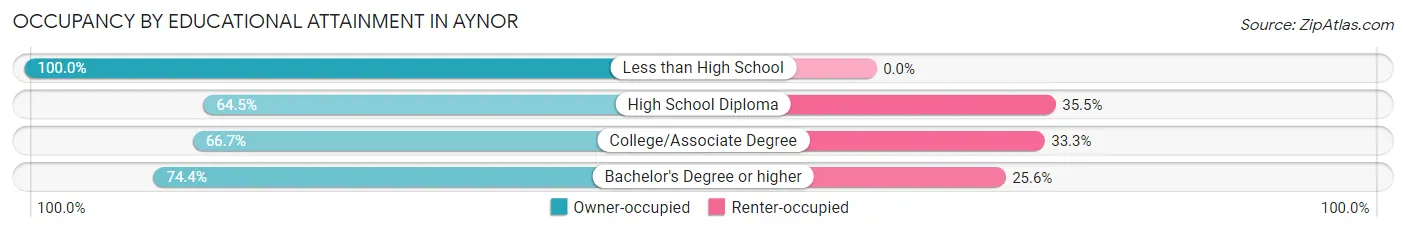
| Household Size | Owner-occupied | Renter-occupied |
| Less than High School | 8 (100.0%) | 0 (0.0%) |
| High School Diploma | 89 (64.5%) | 49 (35.5%) |
| College/Associate Degree | 92 (66.7%) | 46 (33.3%) |
| Bachelor's Degree or higher | 64 (74.4%) | 22 (25.6%) |
Occupancy by Age of Householder in Aynor
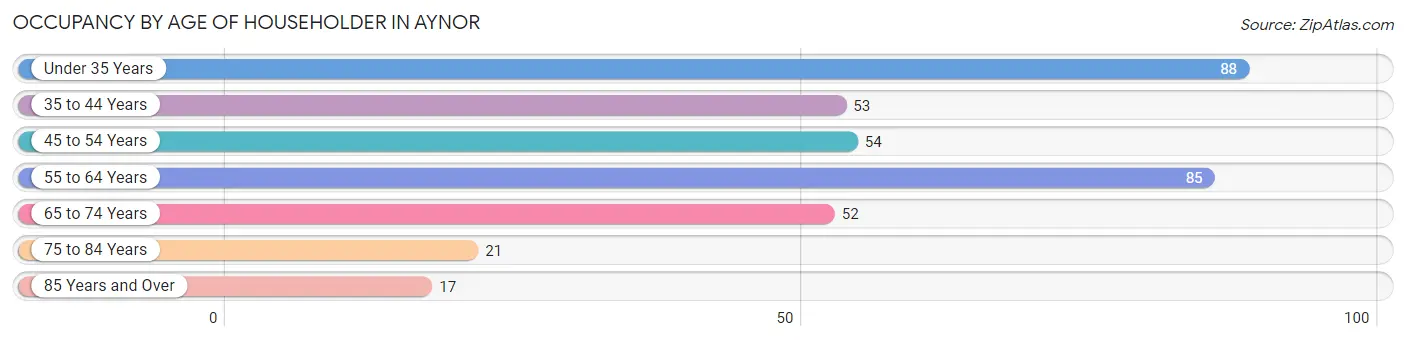
| Age Bracket | # Households | % Households |
| Under 35 Years | 88 | 23.8% |
| 35 to 44 Years | 53 | 14.3% |
| 45 to 54 Years | 54 | 14.6% |
| 55 to 64 Years | 85 | 23.0% |
| 65 to 74 Years | 52 | 14.1% |
| 75 to 84 Years | 21 | 5.7% |
| 85 Years and Over | 17 | 4.6% |
| Total | 370 | 100.0% |
Housing Finances in Aynor
Median Income by Occupancy in Aynor
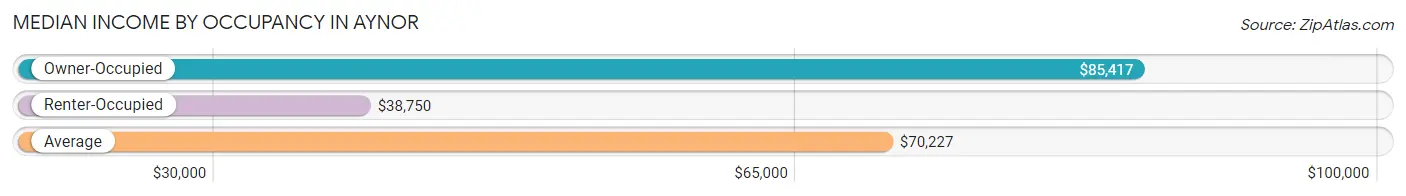
| Occupancy Type | # Households | Median Income |
| Owner-Occupied | 253 (68.4%) | $85,417 |
| Renter-Occupied | 117 (31.6%) | $38,750 |
| Average | 370 (100.0%) | $70,227 |
Occupancy by Householder Income Bracket in Aynor
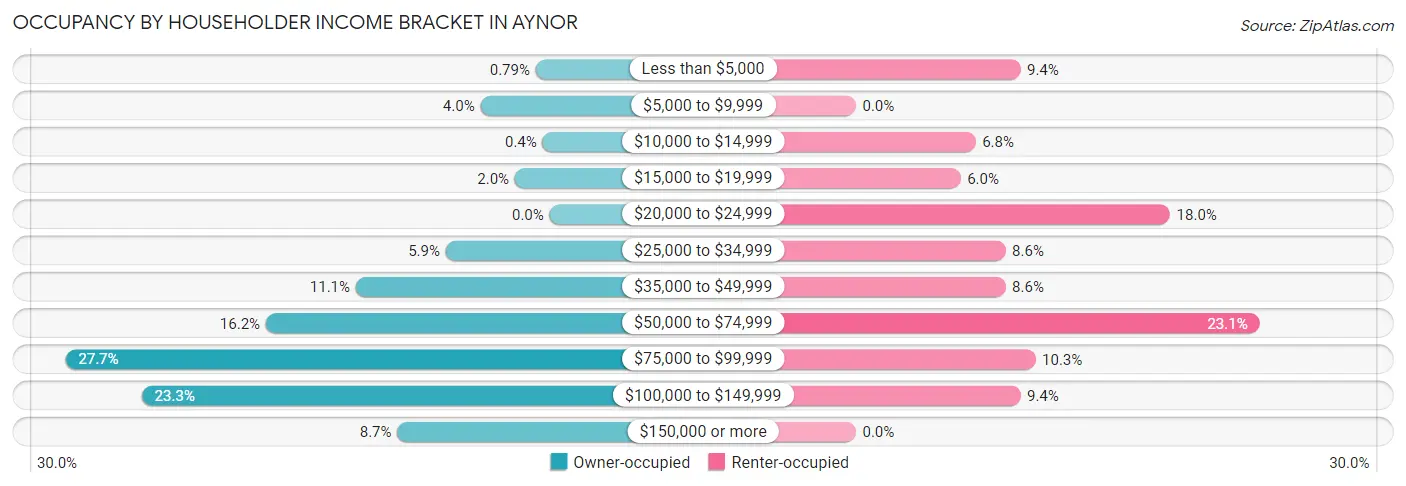
| Income Bracket | Owner-occupied | Renter-occupied |
| Less than $5,000 | 2 (0.8%) | 11 (9.4%) |
| $5,000 to $9,999 | 10 (4.0%) | 0 (0.0%) |
| $10,000 to $14,999 | 1 (0.4%) | 8 (6.8%) |
| $15,000 to $19,999 | 5 (2.0%) | 7 (6.0%) |
| $20,000 to $24,999 | 0 (0.0%) | 21 (17.9%) |
| $25,000 to $34,999 | 15 (5.9%) | 10 (8.6%) |
| $35,000 to $49,999 | 28 (11.1%) | 10 (8.6%) |
| $50,000 to $74,999 | 41 (16.2%) | 27 (23.1%) |
| $75,000 to $99,999 | 70 (27.7%) | 12 (10.3%) |
| $100,000 to $149,999 | 59 (23.3%) | 11 (9.4%) |
| $150,000 or more | 22 (8.7%) | 0 (0.0%) |
| Total | 253 (100.0%) | 117 (100.0%) |
Monthly Housing Cost Tiers in Aynor
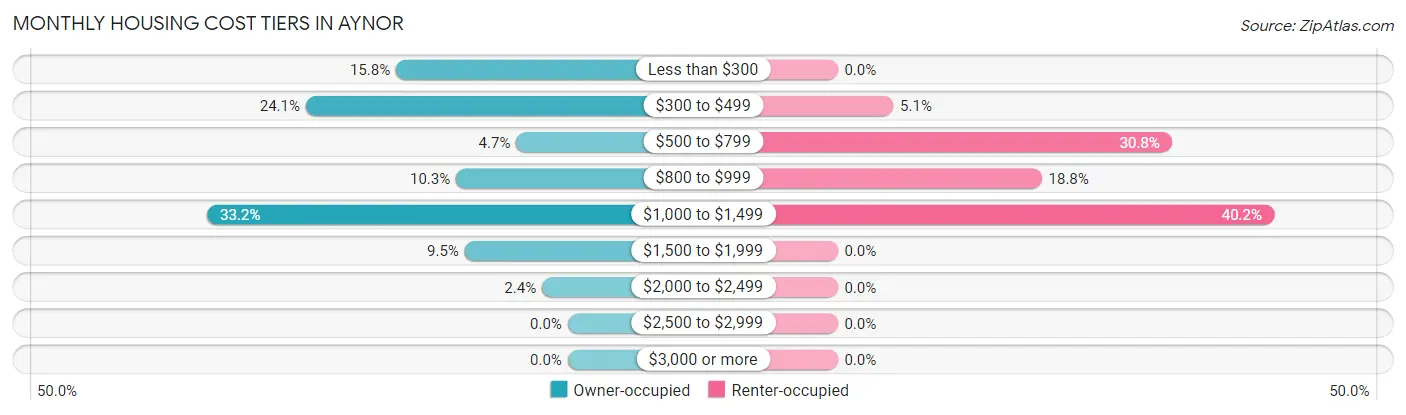
| Monthly Cost | Owner-occupied | Renter-occupied |
| Less than $300 | 40 (15.8%) | 0 (0.0%) |
| $300 to $499 | 61 (24.1%) | 6 (5.1%) |
| $500 to $799 | 12 (4.7%) | 36 (30.8%) |
| $800 to $999 | 26 (10.3%) | 22 (18.8%) |
| $1,000 to $1,499 | 84 (33.2%) | 47 (40.2%) |
| $1,500 to $1,999 | 24 (9.5%) | 0 (0.0%) |
| $2,000 to $2,499 | 6 (2.4%) | 0 (0.0%) |
| $2,500 to $2,999 | 0 (0.0%) | 0 (0.0%) |
| $3,000 or more | 0 (0.0%) | 0 (0.0%) |
| Total | 253 (100.0%) | 117 (100.0%) |
Physical Housing Characteristics in Aynor
Housing Structures in Aynor
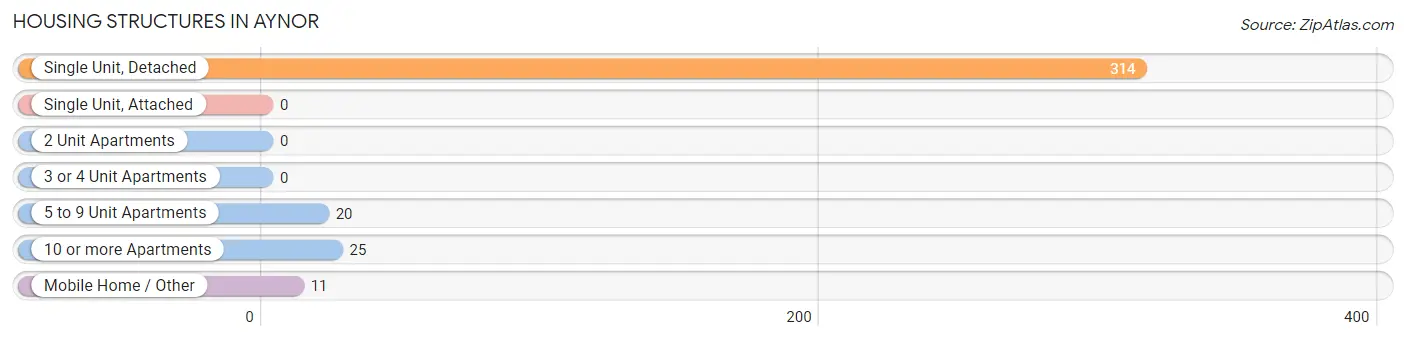
| Structure Type | # Housing Units | % Housing Units |
| Single Unit, Detached | 314 | 84.9% |
| Single Unit, Attached | 0 | 0.0% |
| 2 Unit Apartments | 0 | 0.0% |
| 3 or 4 Unit Apartments | 0 | 0.0% |
| 5 to 9 Unit Apartments | 20 | 5.4% |
| 10 or more Apartments | 25 | 6.8% |
| Mobile Home / Other | 11 | 3.0% |
| Total | 370 | 100.0% |
Housing Structures by Occupancy in Aynor
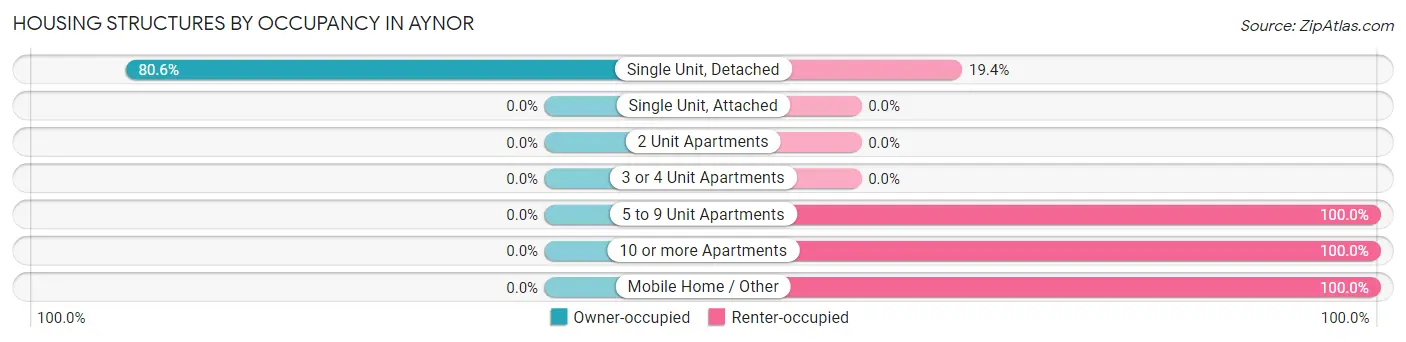
| Structure Type | Owner-occupied | Renter-occupied |
| Single Unit, Detached | 253 (80.6%) | 61 (19.4%) |
| Single Unit, Attached | 0 (0.0%) | 0 (0.0%) |
| 2 Unit Apartments | 0 (0.0%) | 0 (0.0%) |
| 3 or 4 Unit Apartments | 0 (0.0%) | 0 (0.0%) |
| 5 to 9 Unit Apartments | 0 (0.0%) | 20 (100.0%) |
| 10 or more Apartments | 0 (0.0%) | 25 (100.0%) |
| Mobile Home / Other | 0 (0.0%) | 11 (100.0%) |
| Total | 253 (68.4%) | 117 (31.6%) |
Housing Structures by Number of Rooms in Aynor
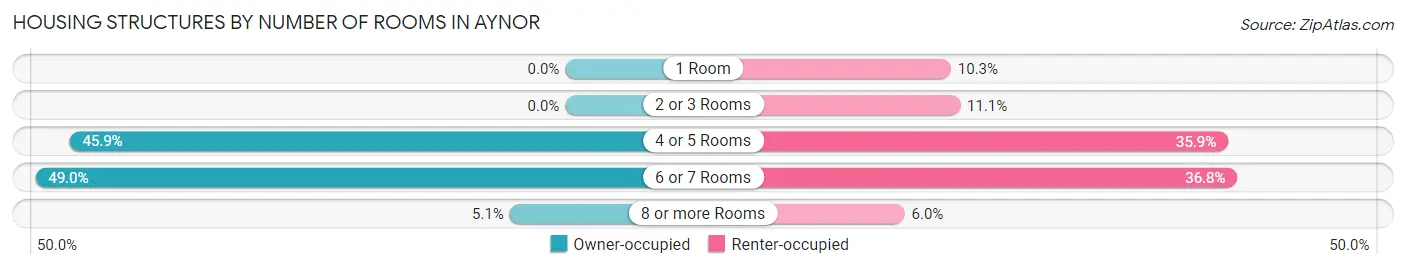
| Number of Rooms | Owner-occupied | Renter-occupied |
| 1 Room | 0 (0.0%) | 12 (10.3%) |
| 2 or 3 Rooms | 0 (0.0%) | 13 (11.1%) |
| 4 or 5 Rooms | 116 (45.9%) | 42 (35.9%) |
| 6 or 7 Rooms | 124 (49.0%) | 43 (36.7%) |
| 8 or more Rooms | 13 (5.1%) | 7 (6.0%) |
| Total | 253 (100.0%) | 117 (100.0%) |
Housing Structure by Heating Type in Aynor
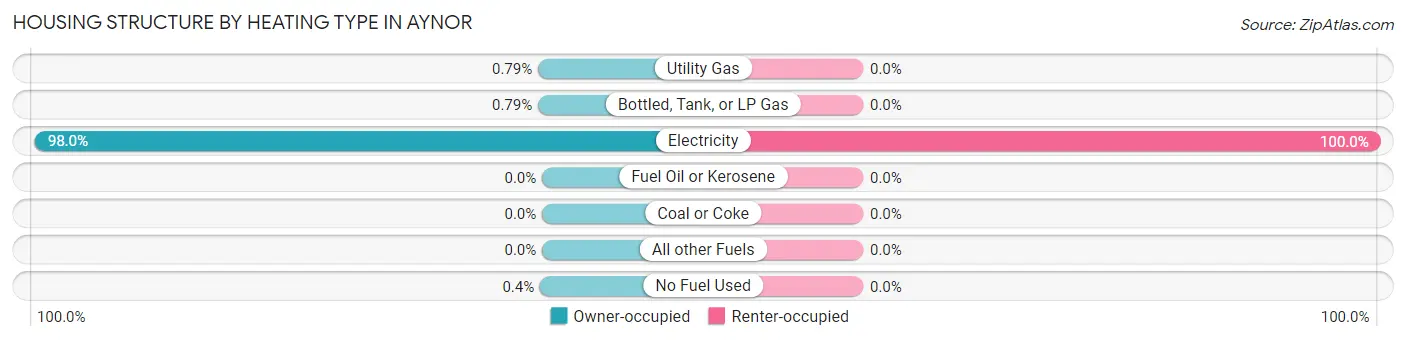
| Heating Type | Owner-occupied | Renter-occupied |
| Utility Gas | 2 (0.8%) | 0 (0.0%) |
| Bottled, Tank, or LP Gas | 2 (0.8%) | 0 (0.0%) |
| Electricity | 248 (98.0%) | 117 (100.0%) |
| Fuel Oil or Kerosene | 0 (0.0%) | 0 (0.0%) |
| Coal or Coke | 0 (0.0%) | 0 (0.0%) |
| All other Fuels | 0 (0.0%) | 0 (0.0%) |
| No Fuel Used | 1 (0.4%) | 0 (0.0%) |
| Total | 253 (100.0%) | 117 (100.0%) |
Household Vehicle Usage in Aynor
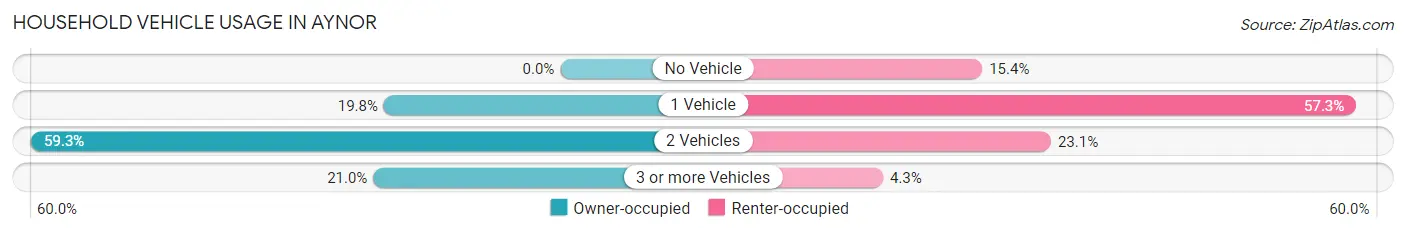
| Vehicles per Household | Owner-occupied | Renter-occupied |
| No Vehicle | 0 (0.0%) | 18 (15.4%) |
| 1 Vehicle | 50 (19.8%) | 67 (57.3%) |
| 2 Vehicles | 150 (59.3%) | 27 (23.1%) |
| 3 or more Vehicles | 53 (20.9%) | 5 (4.3%) |
| Total | 253 (100.0%) | 117 (100.0%) |
Real Estate & Mortgages in Aynor
Real Estate and Mortgage Overview in Aynor
| Characteristic | Without Mortgage | With Mortgage |
| Housing Units | 112 | 141 |
| Median Property Value | $244,000 | $208,200 |
| Median Household Income | $97,891 | $14 |
| Monthly Housing Costs | $383 | $0 |
| Real Estate Taxes | $838 | $0 |
Property Value by Mortgage Status in Aynor
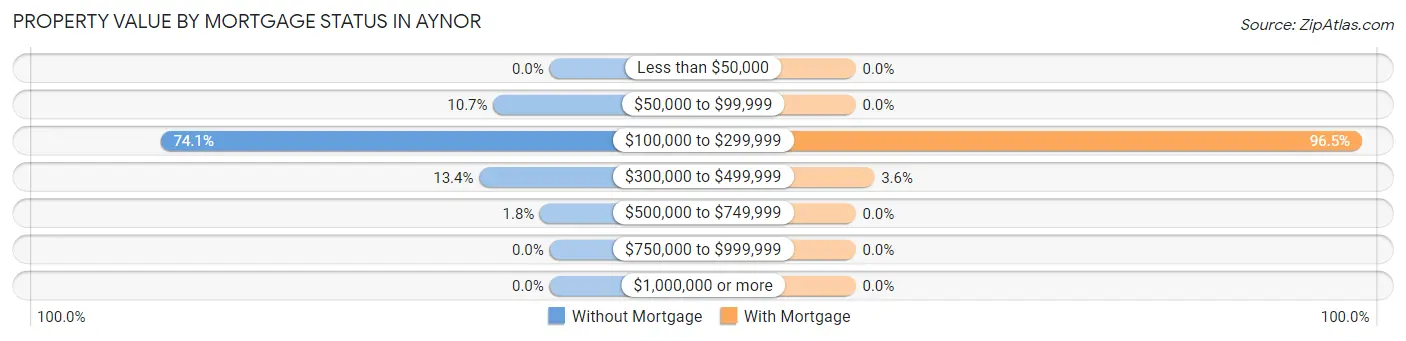
| Property Value | Without Mortgage | With Mortgage |
| Less than $50,000 | 0 (0.0%) | 0 (0.0%) |
| $50,000 to $99,999 | 12 (10.7%) | 0 (0.0%) |
| $100,000 to $299,999 | 83 (74.1%) | 136 (96.5%) |
| $300,000 to $499,999 | 15 (13.4%) | 5 (3.5%) |
| $500,000 to $749,999 | 2 (1.8%) | 0 (0.0%) |
| $750,000 to $999,999 | 0 (0.0%) | 0 (0.0%) |
| $1,000,000 or more | 0 (0.0%) | 0 (0.0%) |
| Total | 112 (100.0%) | 141 (100.0%) |
Household Income by Mortgage Status in Aynor
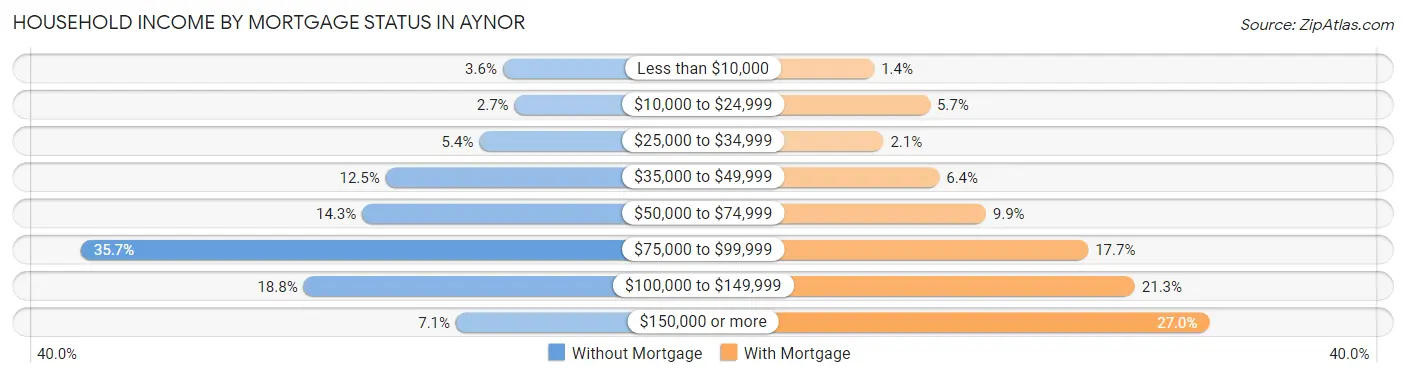
| Household Income | Without Mortgage | With Mortgage |
| Less than $10,000 | 4 (3.6%) | 2 (1.4%) |
| $10,000 to $24,999 | 3 (2.7%) | 8 (5.7%) |
| $25,000 to $34,999 | 6 (5.4%) | 3 (2.1%) |
| $35,000 to $49,999 | 14 (12.5%) | 9 (6.4%) |
| $50,000 to $74,999 | 16 (14.3%) | 14 (9.9%) |
| $75,000 to $99,999 | 40 (35.7%) | 25 (17.7%) |
| $100,000 to $149,999 | 21 (18.8%) | 30 (21.3%) |
| $150,000 or more | 8 (7.1%) | 38 (27.0%) |
| Total | 112 (100.0%) | 141 (100.0%) |
Property Value to Household Income Ratio in Aynor
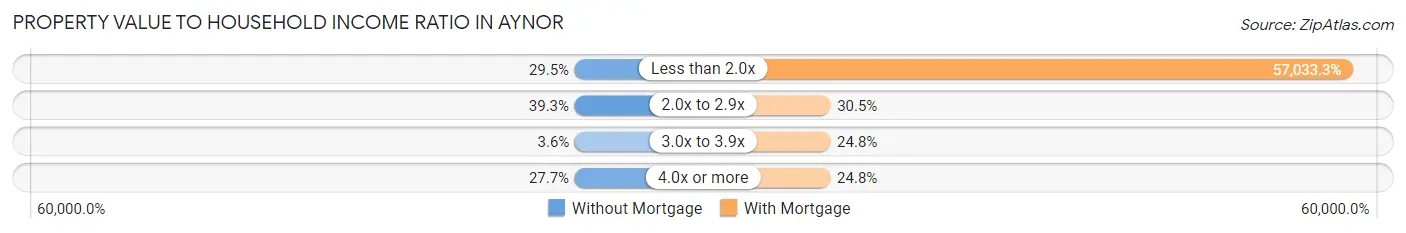
| Value-to-Income Ratio | Without Mortgage | With Mortgage |
| Less than 2.0x | 33 (29.5%) | 80,417 (57,033.3%) |
| 2.0x to 2.9x | 44 (39.3%) | 43 (30.5%) |
| 3.0x to 3.9x | 4 (3.6%) | 35 (24.8%) |
| 4.0x or more | 31 (27.7%) | 35 (24.8%) |
| Total | 112 (100.0%) | 141 (100.0%) |
Real Estate Taxes by Mortgage Status in Aynor
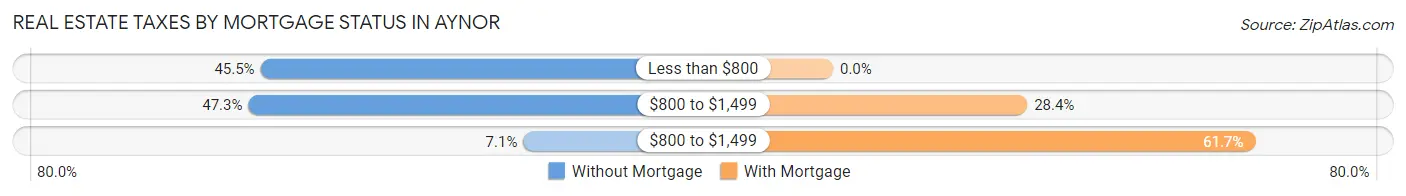
| Property Taxes | Without Mortgage | With Mortgage |
| Less than $800 | 51 (45.5%) | 0 (0.0%) |
| $800 to $1,499 | 53 (47.3%) | 40 (28.4%) |
| $800 to $1,499 | 8 (7.1%) | 87 (61.7%) |
| Total | 112 (100.0%) | 141 (100.0%) |
Health & Disability in Aynor
Health Insurance Coverage by Age in Aynor
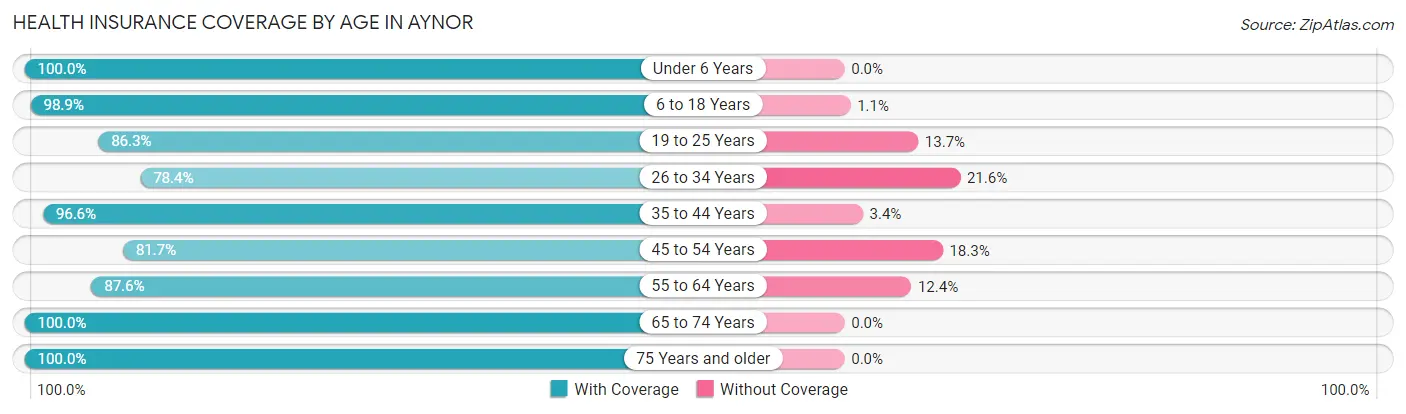
| Age Bracket | With Coverage | Without Coverage |
| Under 6 Years | 49 (100.0%) | 0 (0.0%) |
| 6 to 18 Years | 178 (98.9%) | 2 (1.1%) |
| 19 to 25 Years | 44 (86.3%) | 7 (13.7%) |
| 26 to 34 Years | 120 (78.4%) | 33 (21.6%) |
| 35 to 44 Years | 85 (96.6%) | 3 (3.4%) |
| 45 to 54 Years | 116 (81.7%) | 26 (18.3%) |
| 55 to 64 Years | 169 (87.6%) | 24 (12.4%) |
| 65 to 74 Years | 68 (100.0%) | 0 (0.0%) |
| 75 Years and older | 65 (100.0%) | 0 (0.0%) |
| Total | 894 (90.4%) | 95 (9.6%) |
Health Insurance Coverage by Citizenship Status in Aynor
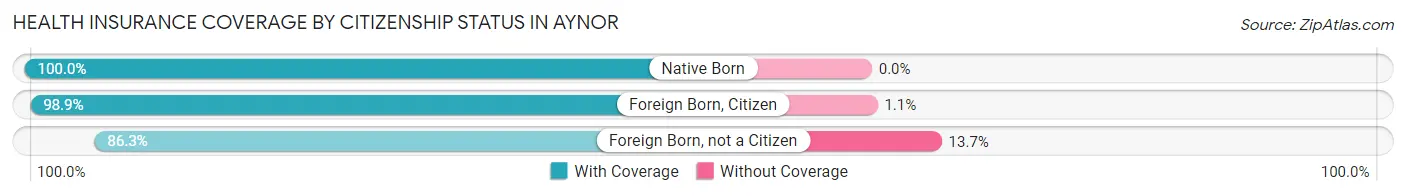
| Citizenship Status | With Coverage | Without Coverage |
| Native Born | 49 (100.0%) | 0 (0.0%) |
| Foreign Born, Citizen | 178 (98.9%) | 2 (1.1%) |
| Foreign Born, not a Citizen | 44 (86.3%) | 7 (13.7%) |
Health Insurance Coverage by Household Income in Aynor
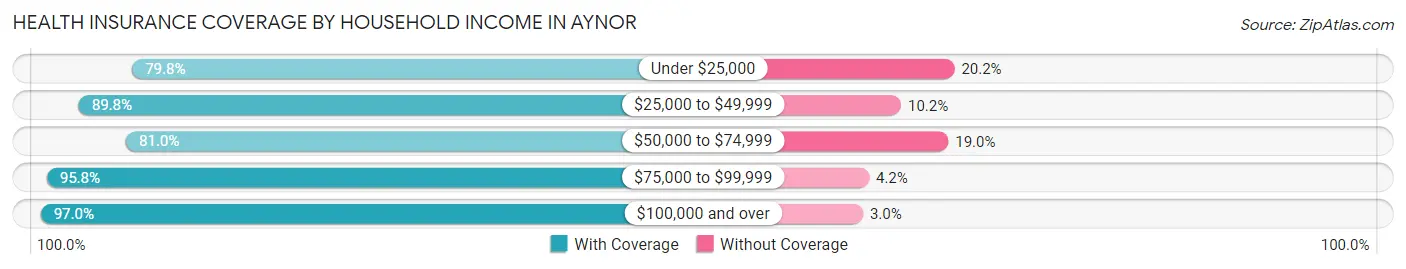
| Household Income | With Coverage | Without Coverage |
| Under $25,000 | 95 (79.8%) | 24 (20.2%) |
| $25,000 to $49,999 | 115 (89.8%) | 13 (10.2%) |
| $50,000 to $74,999 | 166 (81.0%) | 39 (19.0%) |
| $75,000 to $99,999 | 230 (95.8%) | 10 (4.2%) |
| $100,000 and over | 288 (97.0%) | 9 (3.0%) |
Public vs Private Health Insurance Coverage by Age in Aynor
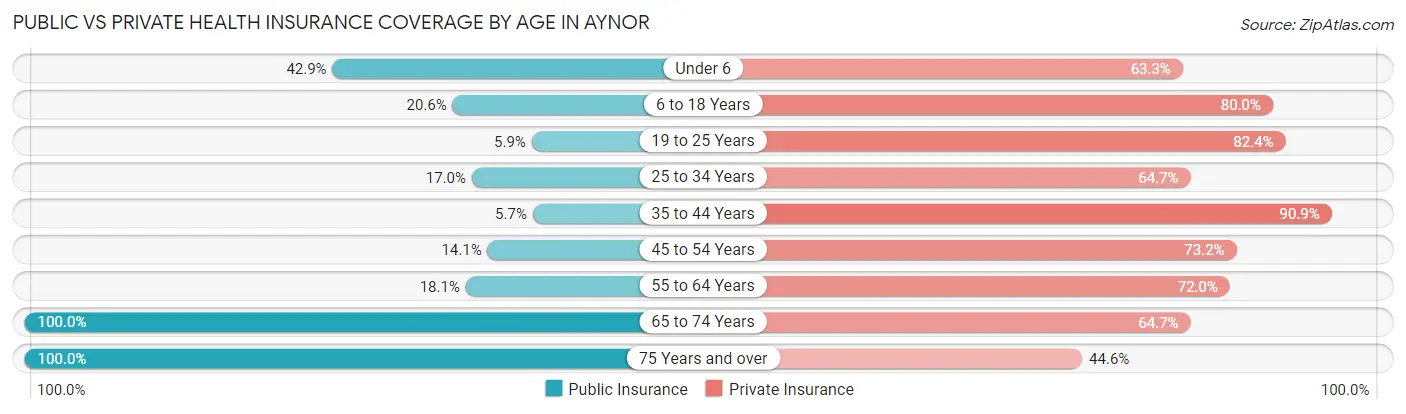
| Age Bracket | Public Insurance | Private Insurance |
| Under 6 | 21 (42.9%) | 31 (63.3%) |
| 6 to 18 Years | 37 (20.6%) | 144 (80.0%) |
| 19 to 25 Years | 3 (5.9%) | 42 (82.4%) |
| 25 to 34 Years | 26 (17.0%) | 99 (64.7%) |
| 35 to 44 Years | 5 (5.7%) | 80 (90.9%) |
| 45 to 54 Years | 20 (14.1%) | 104 (73.2%) |
| 55 to 64 Years | 35 (18.1%) | 139 (72.0%) |
| 65 to 74 Years | 68 (100.0%) | 44 (64.7%) |
| 75 Years and over | 65 (100.0%) | 29 (44.6%) |
| Total | 280 (28.3%) | 712 (72.0%) |
Disability Status by Sex by Age in Aynor
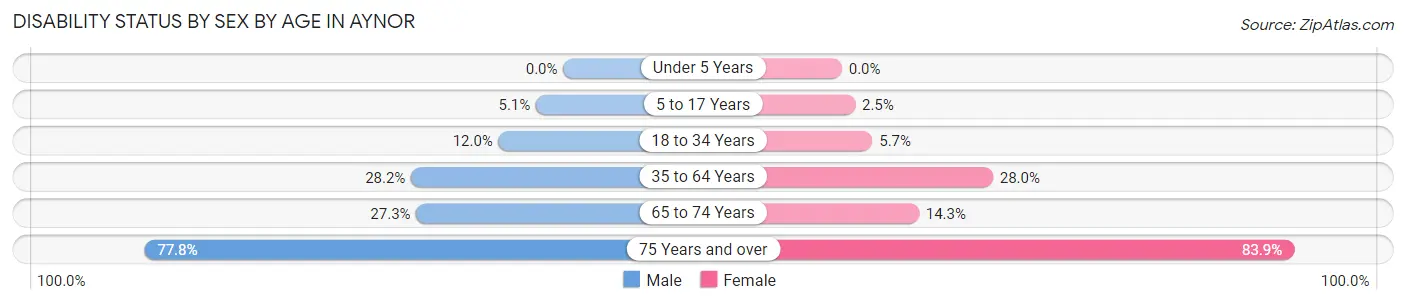
| Age Bracket | Male | Female |
| Under 5 Years | 0 (0.0%) | 0 (0.0%) |
| 5 to 17 Years | 4 (5.1%) | 3 (2.5%) |
| 18 to 34 Years | 12 (12.0%) | 6 (5.7%) |
| 35 to 64 Years | 61 (28.2%) | 58 (28.0%) |
| 65 to 74 Years | 9 (27.3%) | 5 (14.3%) |
| 75 Years and over | 7 (77.8%) | 47 (83.9%) |
Disability Class by Sex by Age in Aynor
Disability Class: Hearing Difficulty
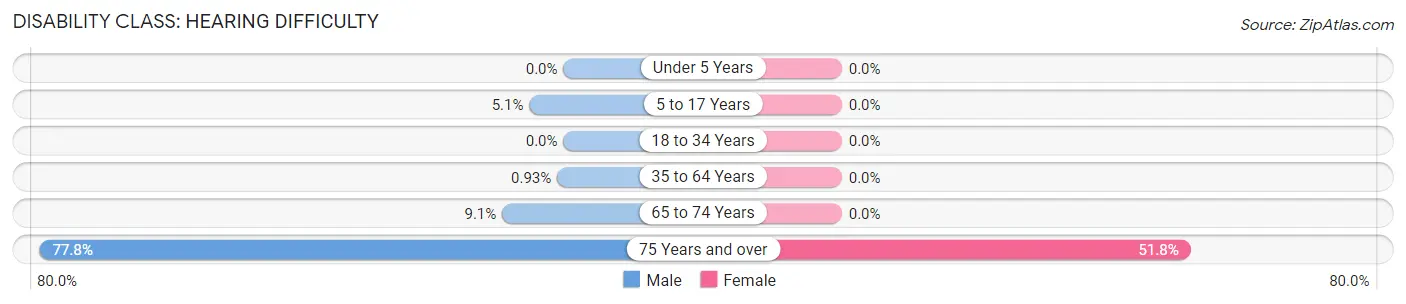
| Age Bracket | Male | Female |
| Under 5 Years | 0 (0.0%) | 0 (0.0%) |
| 5 to 17 Years | 4 (5.1%) | 0 (0.0%) |
| 18 to 34 Years | 0 (0.0%) | 0 (0.0%) |
| 35 to 64 Years | 2 (0.9%) | 0 (0.0%) |
| 65 to 74 Years | 3 (9.1%) | 0 (0.0%) |
| 75 Years and over | 7 (77.8%) | 29 (51.8%) |
Disability Class: Vision Difficulty
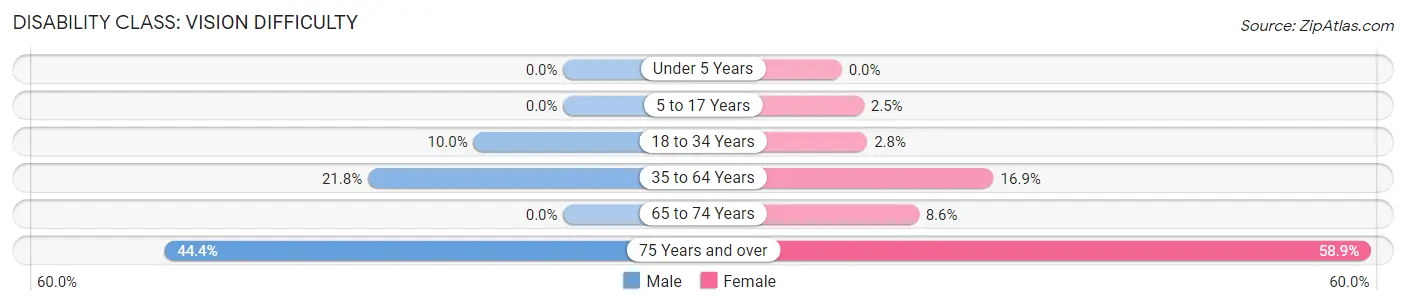
| Age Bracket | Male | Female |
| Under 5 Years | 0 (0.0%) | 0 (0.0%) |
| 5 to 17 Years | 0 (0.0%) | 3 (2.5%) |
| 18 to 34 Years | 10 (10.0%) | 3 (2.8%) |
| 35 to 64 Years | 47 (21.8%) | 35 (16.9%) |
| 65 to 74 Years | 0 (0.0%) | 3 (8.6%) |
| 75 Years and over | 4 (44.4%) | 33 (58.9%) |
Disability Class: Cognitive Difficulty
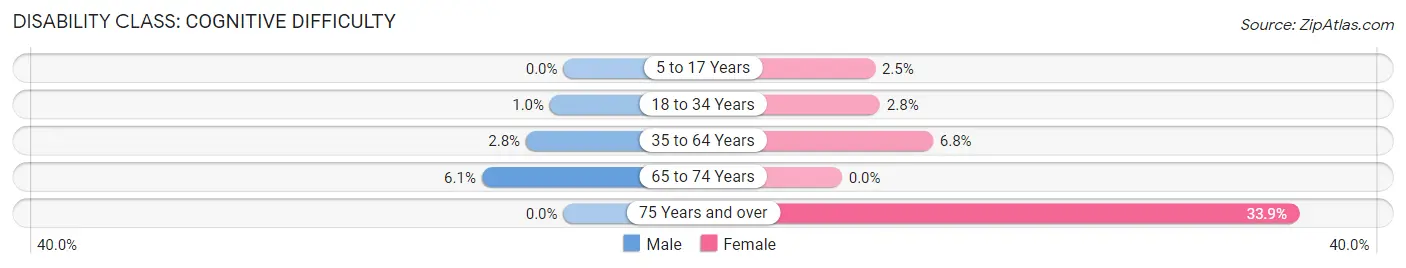
| Age Bracket | Male | Female |
| 5 to 17 Years | 0 (0.0%) | 3 (2.5%) |
| 18 to 34 Years | 1 (1.0%) | 3 (2.8%) |
| 35 to 64 Years | 6 (2.8%) | 14 (6.8%) |
| 65 to 74 Years | 2 (6.1%) | 0 (0.0%) |
| 75 Years and over | 0 (0.0%) | 19 (33.9%) |
Disability Class: Ambulatory Difficulty
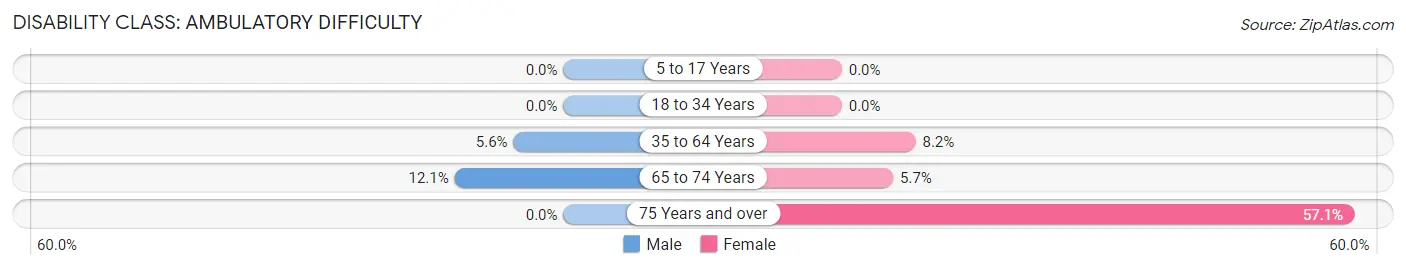
| Age Bracket | Male | Female |
| 5 to 17 Years | 0 (0.0%) | 0 (0.0%) |
| 18 to 34 Years | 0 (0.0%) | 0 (0.0%) |
| 35 to 64 Years | 12 (5.6%) | 17 (8.2%) |
| 65 to 74 Years | 4 (12.1%) | 2 (5.7%) |
| 75 Years and over | 0 (0.0%) | 32 (57.1%) |
Disability Class: Self-Care Difficulty
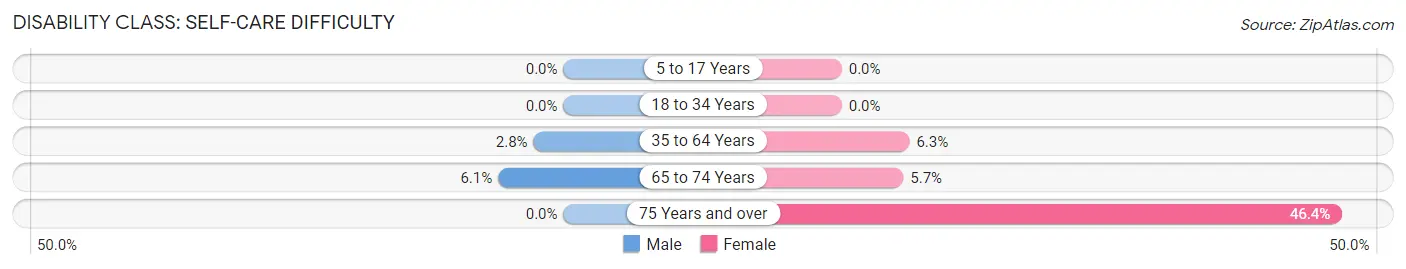
| Age Bracket | Male | Female |
| 5 to 17 Years | 0 (0.0%) | 0 (0.0%) |
| 18 to 34 Years | 0 (0.0%) | 0 (0.0%) |
| 35 to 64 Years | 6 (2.8%) | 13 (6.3%) |
| 65 to 74 Years | 2 (6.1%) | 2 (5.7%) |
| 75 Years and over | 0 (0.0%) | 26 (46.4%) |
Technology Access in Aynor
Computing Device Access in Aynor
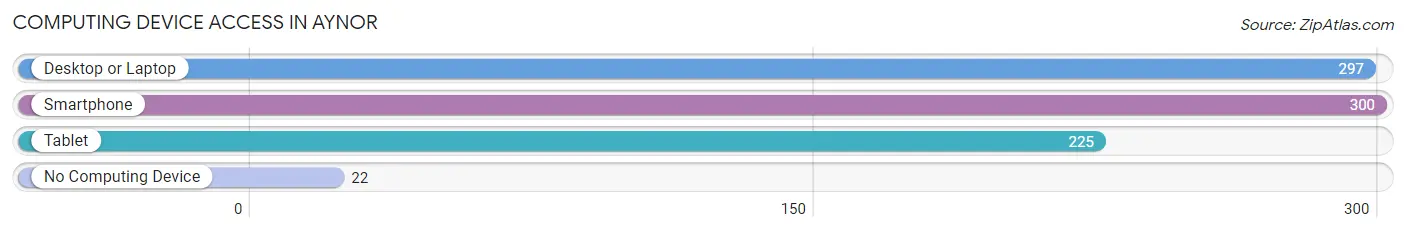
| Device Type | # Households | % Households |
| Desktop or Laptop | 297 | 80.3% |
| Smartphone | 300 | 81.1% |
| Tablet | 225 | 60.8% |
| No Computing Device | 22 | 5.9% |
| Total | 370 | 100.0% |
Internet Access in Aynor
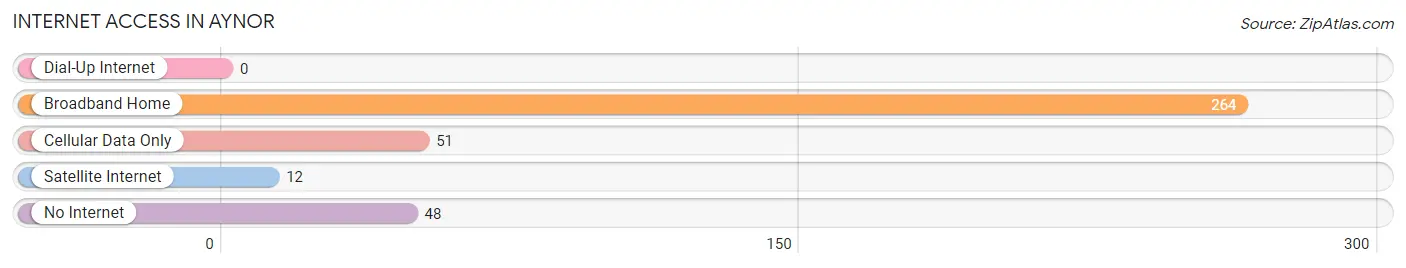
| Internet Type | # Households | % Households |
| Dial-Up Internet | 0 | 0.0% |
| Broadband Home | 264 | 71.4% |
| Cellular Data Only | 51 | 13.8% |
| Satellite Internet | 12 | 3.2% |
| No Internet | 48 | 13.0% |
| Total | 370 | 100.0% |
Aynor Summary
Aynor is a small town located in Horry County, South Carolina. It is situated in the southeastern part of the state, approximately 15 miles west of the Atlantic Ocean. The town has a population of 1,845 people, according to the 2010 census.
Geography
Aynor is located in the Pee Dee region of South Carolina, which is known for its flat terrain and sandy soil. The town is situated on the banks of the Waccamaw River, which flows through the area. The town is surrounded by forests and wetlands, and is home to a variety of wildlife. The climate in Aynor is humid subtropical, with hot summers and mild winters.
Economy
Aynor’s economy is largely based on agriculture. The town is home to several farms, which produce a variety of crops, including corn, soybeans, cotton, and tobacco. The town also has a number of small businesses, including restaurants, retail stores, and service providers.
Demographics
As of the 2010 census, Aynor had a population of 1,845 people. The racial makeup of the town was 87.3% White, 8.7% African American, 0.3% Native American, 0.7% Asian, and 2.9% from other races. The median household income was $35,938, and the median family income was $41,938.
History
Aynor was founded in 1883 by William Aynor, a local farmer. The town was named after him, and was originally a small farming community. In the early 1900s, the town began to grow, and by the 1950s, it had become a popular tourist destination. The town was incorporated in 1959, and has since become a popular place to live and work.
Aynor is a small town with a rich history and a vibrant economy. It is home to a diverse population, and offers a variety of activities and attractions. The town is a great place to live, work, and play, and is sure to continue to grow and thrive in the years to come.
Common Questions
What is Per Capita Income in Aynor?
Per Capita income in Aynor is $30,755.
What is the Median Family Income in Aynor?
Median Family Income in Aynor is $76,042.
What is the Median Household income in Aynor?
Median Household Income in Aynor is $70,227.
What is Income or Wage Gap in Aynor?
Income or Wage Gap in Aynor is 8.4%.
Women in Aynor earn 91.6 cents for every dollar earned by a man.
What is Inequality or Gini Index in Aynor?
Inequality or Gini Index in Aynor is 0.35.
What is the Total Population of Aynor?
Total Population of Aynor is 989.
What is the Total Male Population of Aynor?
Total Male Population of Aynor is 445.
What is the Total Female Population of Aynor?
Total Female Population of Aynor is 544.
What is the Ratio of Males per 100 Females in Aynor?
There are 81.80 Males per 100 Females in Aynor.
What is the Ratio of Females per 100 Males in Aynor?
There are 122.25 Females per 100 Males in Aynor.
What is the Median Population Age in Aynor?
Median Population Age in Aynor is 39.9 Years.
What is the Average Family Size in Aynor
Average Family Size in Aynor is 3.0 People.
What is the Average Household Size in Aynor
Average Household Size in Aynor is 2.7 People.
How Large is the Labor Force in Aynor?
There are 507 People in the Labor Forcein in Aynor.
What is the Percentage of People in the Labor Force in Aynor?
64.8% of People are in the Labor Force in Aynor.
What is the Unemployment Rate in Aynor?
Unemployment Rate in Aynor is 2.2%.