Zip Codes with the Highest Percentage of Population Employed in Transportation in Bayamon, PR
RELATED REPORTS & OPTIONS
Transportation
Bayamon
Compare Zip Codes
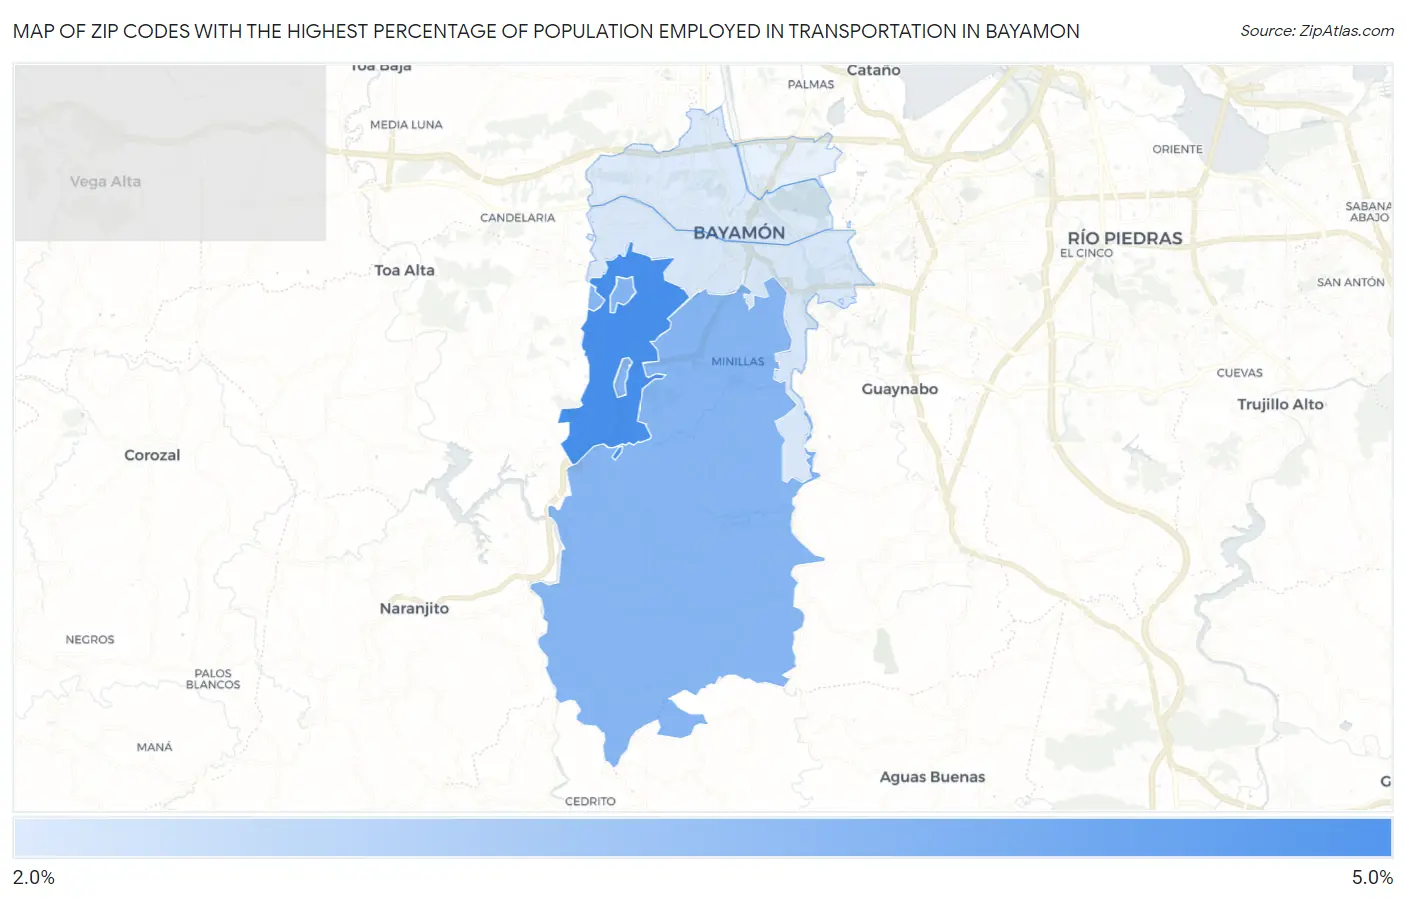
Map of Zip Codes with the Highest Percentage of Population Employed in Transportation in Bayamon
0.0%
5.0%
Zip Codes with the Highest Percentage of Population Employed in Transportation in Bayamon, PR
| Zip Code | % Employed | vs State | vs National | |
| 1. | 00957 | 4.1% | 3.0%(+1.09)#29 | 3.8%(+0.305)#13,806 |
| 2. | 00956 | 3.4% | 3.0%(+0.372)#48 | 3.8%(-0.417)#17,332 |
| 3. | 00959 | 2.4% | 3.0%(-0.607)#83 | 3.8%(-1.40)#21,931 |
| 4. | 00961 | 2.4% | 3.0%(-0.658)#87 | 3.8%(-1.45)#22,168 |
1
Common Questions
What are the Top 3 Zip Codes with the Highest Percentage of Population Employed in Transportation in Bayamon, PR?
Top 3 Zip Codes with the Highest Percentage of Population Employed in Transportation in Bayamon, PR are:
What zip code has the Highest Percentage of Population Employed in Transportation in Bayamon, PR?
00957 has the Highest Percentage of Population Employed in Transportation in Bayamon, PR with 4.1%.
What is the Percentage of Population Employed in Transportation in Puerto Rico?
Percentage of Population Employed in Transportation in Puerto Rico is 3.0%.
What is the Percentage of Population Employed in Transportation in the United States?
Percentage of Population Employed in Transportation in the United States is 3.8%.