Zimbabwean vs Immigrants from Malaysia Single Father Poverty
COMPARE
Zimbabwean
Immigrants from Malaysia
Single Father Poverty
Single Father Poverty Comparison
Zimbabweans
Immigrants from Malaysia
15.6%
SINGLE FATHER POVERTY
98.1/ 100
METRIC RATING
98th/ 347
METRIC RANK
15.2%
SINGLE FATHER POVERTY
99.8/ 100
METRIC RATING
65th/ 347
METRIC RANK
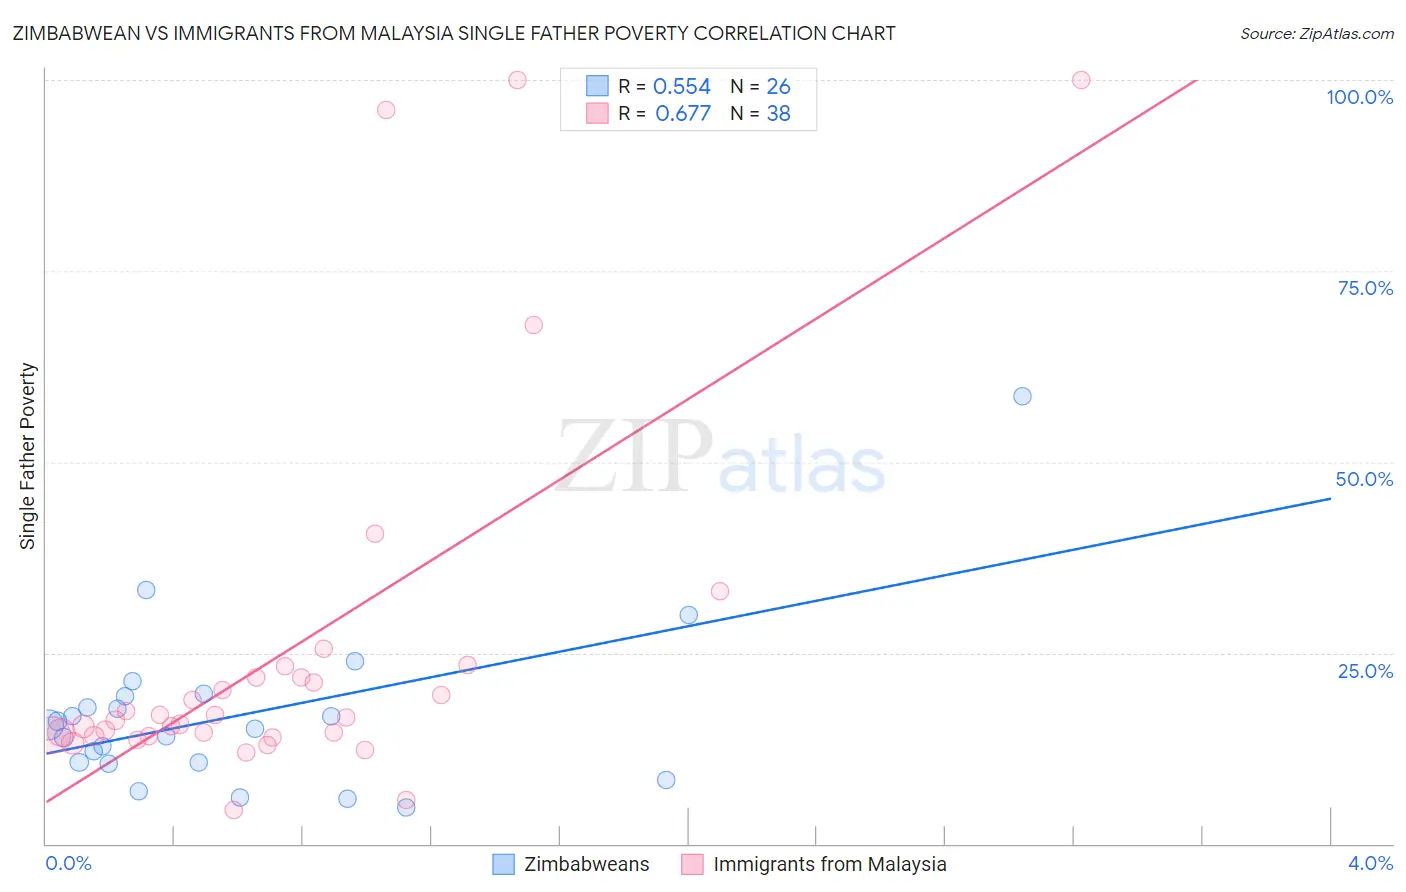
Zimbabwean vs Immigrants from Malaysia Single Father Poverty Correlation Chart
The statistical analysis conducted on geographies consisting of 64,763,564 people shows a substantial positive correlation between the proportion of Zimbabweans and poverty level among single fathers in the United States with a correlation coefficient (R) of 0.554 and weighted average of 15.6%. Similarly, the statistical analysis conducted on geographies consisting of 167,066,405 people shows a significant positive correlation between the proportion of Immigrants from Malaysia and poverty level among single fathers in the United States with a correlation coefficient (R) of 0.677 and weighted average of 15.2%, a difference of 2.5%.
Single Father Poverty Correlation Summary
| Measurement | Zimbabwean | Immigrants from Malaysia |
| Minimum | 4.8% | 4.4% |
| Maximum | 58.6% | 100.0% |
| Range | 53.8% | 95.6% |
| Mean | 16.8% | 25.0% |
| Median | 15.3% | 16.4% |
| Interquartile 25% (IQ1) | 10.6% | 14.2% |
| Interquartile 75% (IQ3) | 19.3% | 21.7% |
| Interquartile Range (IQR) | 8.7% | 7.6% |
| Standard Deviation (Sample) | 11.0% | 24.2% |
| Standard Deviation (Population) | 10.7% | 23.9% |
Similar Demographics by Single Father Poverty
Demographics Similar to Zimbabweans by Single Father Poverty
In terms of single father poverty, the demographic groups most similar to Zimbabweans are Yaqui (15.6%, a difference of 0.010%), Immigrants from Belgium (15.6%, a difference of 0.020%), Immigrants from Kazakhstan (15.6%, a difference of 0.030%), Immigrants from Uruguay (15.6%, a difference of 0.080%), and Basque (15.5%, a difference of 0.22%).
| Demographics | Rating | Rank | Single Father Poverty |
| Immigrants | Romania | 98.6 /100 | #91 | Exceptional 15.5% |
| Immigrants | Serbia | 98.5 /100 | #92 | Exceptional 15.5% |
| Basques | 98.4 /100 | #93 | Exceptional 15.5% |
| Immigrants | Uruguay | 98.2 /100 | #94 | Exceptional 15.6% |
| Immigrants | Kazakhstan | 98.2 /100 | #95 | Exceptional 15.6% |
| Immigrants | Belgium | 98.1 /100 | #96 | Exceptional 15.6% |
| Yaqui | 98.1 /100 | #97 | Exceptional 15.6% |
| Zimbabweans | 98.1 /100 | #98 | Exceptional 15.6% |
| Immigrants | Middle Africa | 97.4 /100 | #99 | Exceptional 15.6% |
| Immigrants | Chile | 96.9 /100 | #100 | Exceptional 15.7% |
| Fijians | 96.8 /100 | #101 | Exceptional 15.7% |
| Chileans | 96.4 /100 | #102 | Exceptional 15.7% |
| South American Indians | 96.2 /100 | #103 | Exceptional 15.7% |
| Australians | 96.1 /100 | #104 | Exceptional 15.7% |
| Immigrants | Australia | 96.1 /100 | #105 | Exceptional 15.7% |
Demographics Similar to Immigrants from Malaysia by Single Father Poverty
In terms of single father poverty, the demographic groups most similar to Immigrants from Malaysia are Immigrants from Moldova (15.2%, a difference of 0.020%), Bangladeshi (15.2%, a difference of 0.090%), Paraguayan (15.2%, a difference of 0.11%), Immigrants from Sweden (15.2%, a difference of 0.16%), and Immigrants from Cameroon (15.2%, a difference of 0.20%).
| Demographics | Rating | Rank | Single Father Poverty |
| Hawaiians | 99.9 /100 | #58 | Exceptional 15.1% |
| Guamanians/Chamorros | 99.9 /100 | #59 | Exceptional 15.1% |
| Puget Sound Salish | 99.8 /100 | #60 | Exceptional 15.2% |
| Immigrants | Bosnia and Herzegovina | 99.8 /100 | #61 | Exceptional 15.2% |
| Immigrants | Armenia | 99.8 /100 | #62 | Exceptional 15.2% |
| Immigrants | Sweden | 99.8 /100 | #63 | Exceptional 15.2% |
| Bangladeshis | 99.8 /100 | #64 | Exceptional 15.2% |
| Immigrants | Malaysia | 99.8 /100 | #65 | Exceptional 15.2% |
| Immigrants | Moldova | 99.8 /100 | #66 | Exceptional 15.2% |
| Paraguayans | 99.7 /100 | #67 | Exceptional 15.2% |
| Immigrants | Cameroon | 99.7 /100 | #68 | Exceptional 15.2% |
| Japanese | 99.7 /100 | #69 | Exceptional 15.2% |
| Mongolians | 99.7 /100 | #70 | Exceptional 15.3% |
| Immigrants | Brazil | 99.6 /100 | #71 | Exceptional 15.3% |
| Immigrants | Lithuania | 99.6 /100 | #72 | Exceptional 15.3% |