Yup'ik vs Central American Indian Child Poverty Among Girls Under 16
COMPARE
Yup'ik
Central American Indian
Child Poverty Among Girls Under 16
Child Poverty Among Girls Under 16 Comparison
Yup'ik
Central American Indians
25.8%
CHILD POVERTY AMONG GIRLS UNDER 16
0.0/ 100
METRIC RATING
337th/ 347
METRIC RANK
22.8%
CHILD POVERTY AMONG GIRLS UNDER 16
0.0/ 100
METRIC RATING
327th/ 347
METRIC RANK
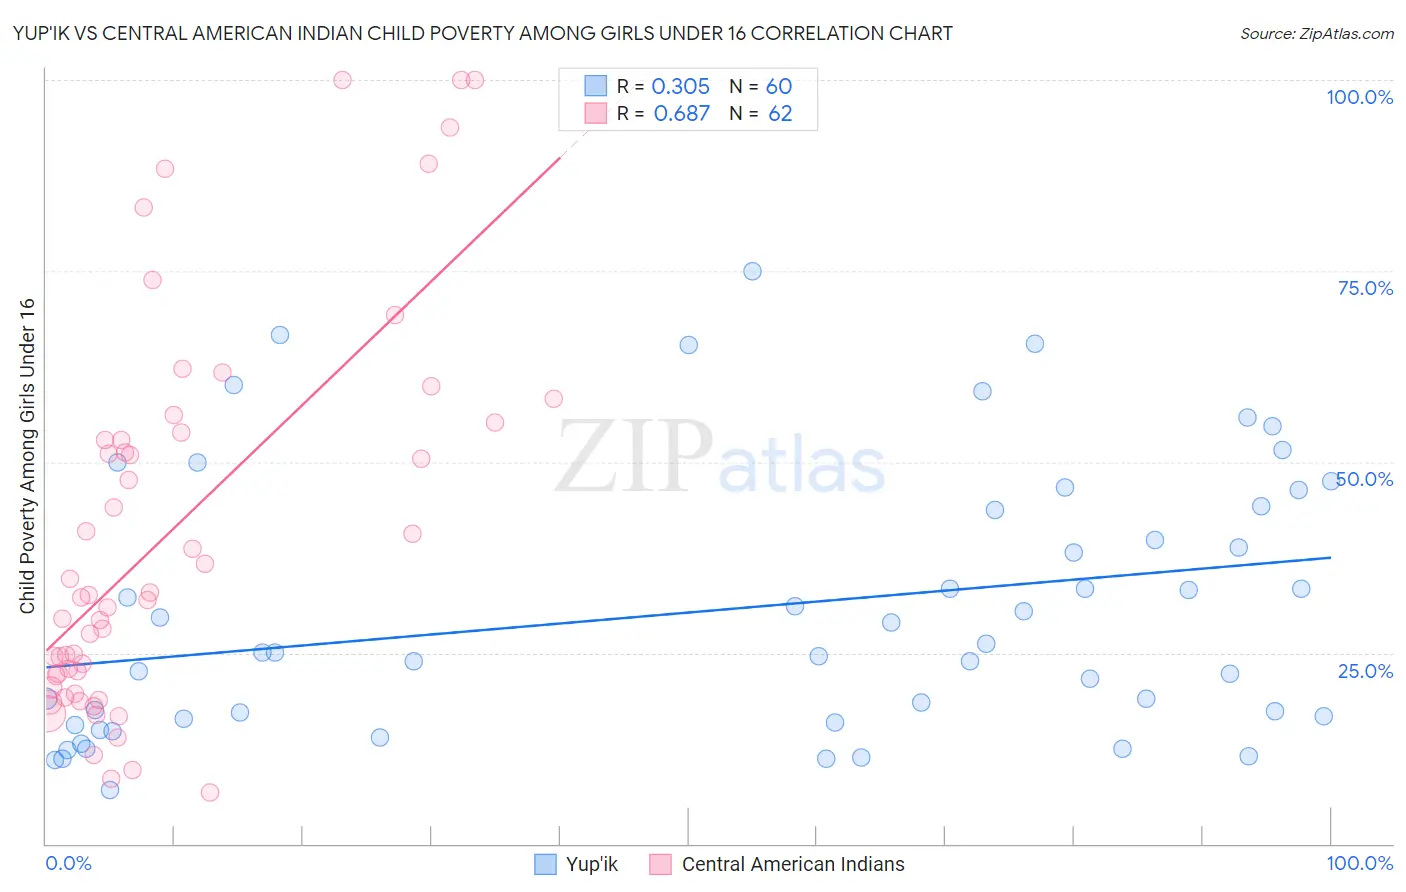
Yup'ik vs Central American Indian Child Poverty Among Girls Under 16 Correlation Chart
The statistical analysis conducted on geographies consisting of 39,851,220 people shows a mild positive correlation between the proportion of Yup'ik and poverty level among girls under the age of 16 in the United States with a correlation coefficient (R) of 0.305 and weighted average of 25.8%. Similarly, the statistical analysis conducted on geographies consisting of 323,193,354 people shows a significant positive correlation between the proportion of Central American Indians and poverty level among girls under the age of 16 in the United States with a correlation coefficient (R) of 0.687 and weighted average of 22.8%, a difference of 13.2%.
Child Poverty Among Girls Under 16 Correlation Summary
| Measurement | Yup'ik | Central American Indian |
| Minimum | 7.1% | 6.7% |
| Maximum | 75.0% | 100.0% |
| Range | 67.9% | 93.3% |
| Mean | 30.5% | 40.6% |
| Median | 25.0% | 32.4% |
| Interquartile 25% (IQ1) | 16.1% | 22.0% |
| Interquartile 75% (IQ3) | 43.9% | 53.8% |
| Interquartile Range (IQR) | 27.8% | 31.8% |
| Standard Deviation (Sample) | 17.4% | 25.0% |
| Standard Deviation (Population) | 17.3% | 24.8% |
Demographics Similar to Yup'ik and Central American Indians by Child Poverty Among Girls Under 16
In terms of child poverty among girls under 16, the demographic groups most similar to Yup'ik are Sioux (25.6%, a difference of 0.93%), Cheyenne (26.3%, a difference of 1.8%), Crow (26.4%, a difference of 2.1%), Pueblo (25.2%, a difference of 2.4%), and Menominee (25.0%, a difference of 3.1%). Similarly, the demographic groups most similar to Central American Indians are Immigrants from Honduras (22.8%, a difference of 0.14%), Immigrants from Congo (22.7%, a difference of 0.27%), Paiute (22.6%, a difference of 0.77%), Cajun (22.6%, a difference of 1.1%), and Yakama (22.6%, a difference of 1.1%).
| Demographics | Rating | Rank | Child Poverty Among Girls Under 16 |
| Yakama | 0.0 /100 | #322 | Tragic 22.6% |
| Cajuns | 0.0 /100 | #323 | Tragic 22.6% |
| Paiute | 0.0 /100 | #324 | Tragic 22.6% |
| Immigrants | Congo | 0.0 /100 | #325 | Tragic 22.7% |
| Immigrants | Honduras | 0.0 /100 | #326 | Tragic 22.8% |
| Central American Indians | 0.0 /100 | #327 | Tragic 22.8% |
| Dominicans | 0.0 /100 | #328 | Tragic 23.7% |
| Kiowa | 0.0 /100 | #329 | Tragic 23.7% |
| Immigrants | Dominican Republic | 0.0 /100 | #330 | Tragic 23.8% |
| Apache | 0.0 /100 | #331 | Tragic 23.8% |
| Natives/Alaskans | 0.0 /100 | #332 | Tragic 24.0% |
| Blacks/African Americans | 0.0 /100 | #333 | Tragic 24.7% |
| Menominee | 0.0 /100 | #334 | Tragic 25.0% |
| Pueblo | 0.0 /100 | #335 | Tragic 25.2% |
| Sioux | 0.0 /100 | #336 | Tragic 25.6% |
| Yup'ik | 0.0 /100 | #337 | Tragic 25.8% |
| Cheyenne | 0.0 /100 | #338 | Tragic 26.3% |
| Crow | 0.0 /100 | #339 | Tragic 26.4% |
| Yuman | 0.0 /100 | #340 | Tragic 27.1% |
| Hopi | 0.0 /100 | #341 | Tragic 27.9% |
| Pima | 0.0 /100 | #342 | Tragic 28.2% |