Yaqui vs Cape Verdean Child Poverty Among Girls Under 16
COMPARE
Yaqui
Cape Verdean
Child Poverty Among Girls Under 16
Child Poverty Among Girls Under 16 Comparison
Yaqui
Cape Verdeans
20.3%
CHILD POVERTY AMONG GIRLS UNDER 16
0.0/ 100
METRIC RATING
284th/ 347
METRIC RANK
19.2%
CHILD POVERTY AMONG GIRLS UNDER 16
0.3/ 100
METRIC RATING
250th/ 347
METRIC RANK
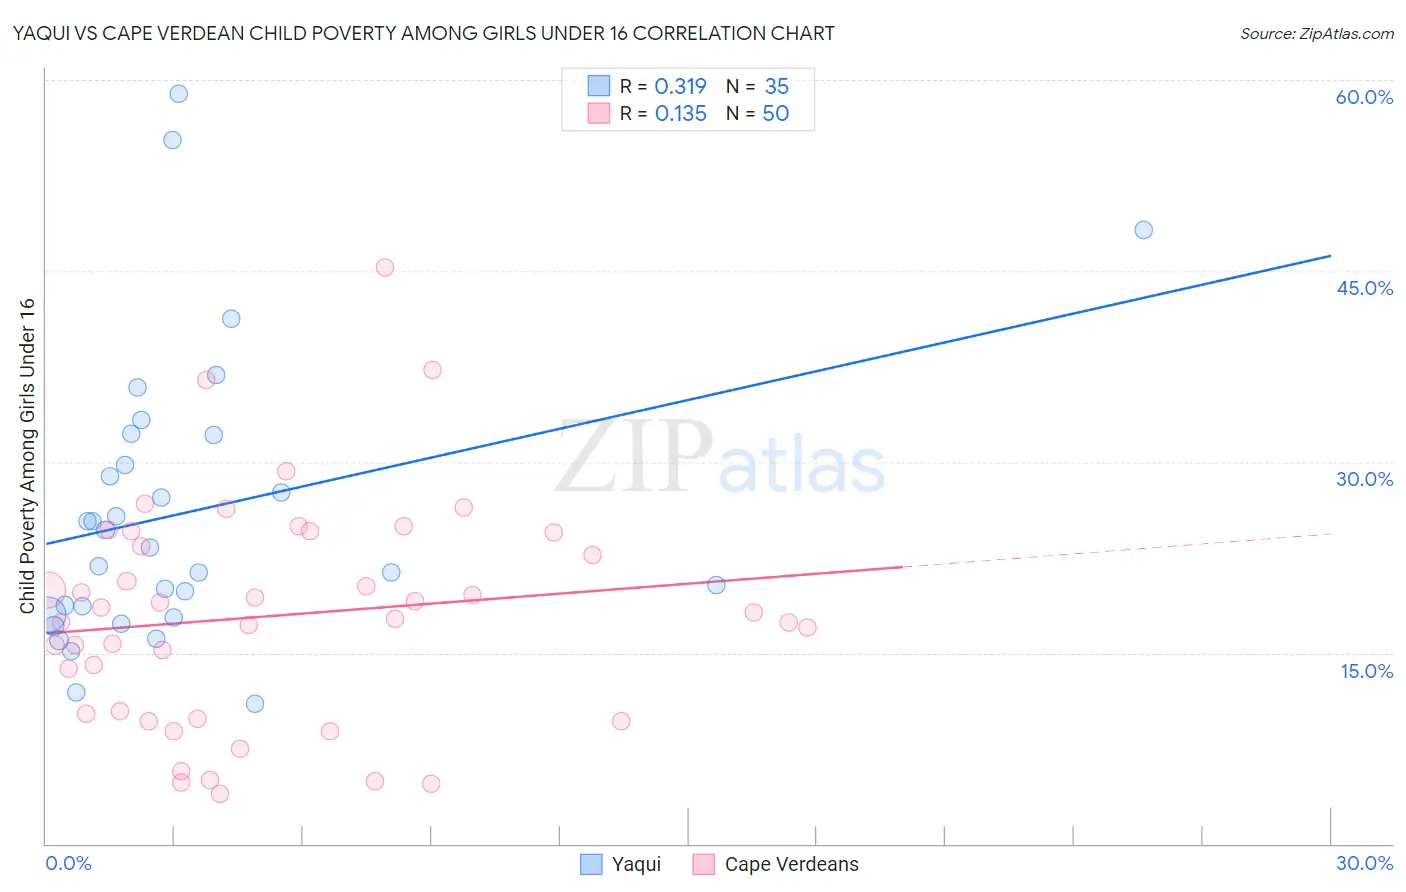
Yaqui vs Cape Verdean Child Poverty Among Girls Under 16 Correlation Chart
The statistical analysis conducted on geographies consisting of 107,293,356 people shows a mild positive correlation between the proportion of Yaqui and poverty level among girls under the age of 16 in the United States with a correlation coefficient (R) of 0.319 and weighted average of 20.3%. Similarly, the statistical analysis conducted on geographies consisting of 106,748,035 people shows a poor positive correlation between the proportion of Cape Verdeans and poverty level among girls under the age of 16 in the United States with a correlation coefficient (R) of 0.135 and weighted average of 19.2%, a difference of 5.8%.
Child Poverty Among Girls Under 16 Correlation Summary
| Measurement | Yaqui | Cape Verdean |
| Minimum | 11.0% | 3.9% |
| Maximum | 58.9% | 45.2% |
| Range | 47.9% | 41.3% |
| Mean | 26.1% | 17.9% |
| Median | 23.3% | 17.9% |
| Interquartile 25% (IQ1) | 18.0% | 10.2% |
| Interquartile 75% (IQ3) | 32.1% | 24.5% |
| Interquartile Range (IQR) | 14.2% | 14.3% |
| Standard Deviation (Sample) | 11.3% | 8.9% |
| Standard Deviation (Population) | 11.2% | 8.8% |
Similar Demographics by Child Poverty Among Girls Under 16
Demographics Similar to Yaqui by Child Poverty Among Girls Under 16
In terms of child poverty among girls under 16, the demographic groups most similar to Yaqui are Senegalese (20.3%, a difference of 0.030%), West Indian (20.3%, a difference of 0.080%), Immigrants from Cabo Verde (20.3%, a difference of 0.14%), Central American (20.2%, a difference of 0.36%), and Immigrants from Liberia (20.2%, a difference of 0.43%).
| Demographics | Rating | Rank | Child Poverty Among Girls Under 16 |
| Belizeans | 0.0 /100 | #277 | Tragic 20.2% |
| Barbadians | 0.0 /100 | #278 | Tragic 20.2% |
| Immigrants | Zaire | 0.0 /100 | #279 | Tragic 20.2% |
| Immigrants | Liberia | 0.0 /100 | #280 | Tragic 20.2% |
| Central Americans | 0.0 /100 | #281 | Tragic 20.2% |
| West Indians | 0.0 /100 | #282 | Tragic 20.3% |
| Senegalese | 0.0 /100 | #283 | Tragic 20.3% |
| Yaqui | 0.0 /100 | #284 | Tragic 20.3% |
| Immigrants | Cabo Verde | 0.0 /100 | #285 | Tragic 20.3% |
| Iroquois | 0.0 /100 | #286 | Tragic 20.4% |
| Blackfeet | 0.0 /100 | #287 | Tragic 20.5% |
| Haitians | 0.0 /100 | #288 | Tragic 20.5% |
| Immigrants | Belize | 0.0 /100 | #289 | Tragic 20.6% |
| Immigrants | Haiti | 0.0 /100 | #290 | Tragic 20.6% |
| Chippewa | 0.0 /100 | #291 | Tragic 20.6% |
Demographics Similar to Cape Verdeans by Child Poverty Among Girls Under 16
In terms of child poverty among girls under 16, the demographic groups most similar to Cape Verdeans are Potawatomi (19.2%, a difference of 0.030%), French American Indian (19.2%, a difference of 0.050%), Immigrants from Trinidad and Tobago (19.2%, a difference of 0.11%), Immigrants from Middle Africa (19.2%, a difference of 0.15%), and Immigrants from Guyana (19.3%, a difference of 0.35%).
| Demographics | Rating | Rank | Child Poverty Among Girls Under 16 |
| Immigrants | Nicaragua | 0.7 /100 | #243 | Tragic 18.8% |
| Ecuadorians | 0.7 /100 | #244 | Tragic 18.8% |
| Shoshone | 0.6 /100 | #245 | Tragic 18.9% |
| Immigrants | Laos | 0.6 /100 | #246 | Tragic 18.9% |
| Immigrants | Ghana | 0.5 /100 | #247 | Tragic 18.9% |
| French American Indians | 0.3 /100 | #248 | Tragic 19.2% |
| Potawatomi | 0.3 /100 | #249 | Tragic 19.2% |
| Cape Verdeans | 0.3 /100 | #250 | Tragic 19.2% |
| Immigrants | Trinidad and Tobago | 0.3 /100 | #251 | Tragic 19.2% |
| Immigrants | Middle Africa | 0.3 /100 | #252 | Tragic 19.2% |
| Immigrants | Guyana | 0.3 /100 | #253 | Tragic 19.3% |
| Immigrants | Western Africa | 0.3 /100 | #254 | Tragic 19.3% |
| Immigrants | Ecuador | 0.3 /100 | #255 | Tragic 19.3% |
| Trinidadians and Tobagonians | 0.2 /100 | #256 | Tragic 19.3% |
| Guyanese | 0.2 /100 | #257 | Tragic 19.4% |