White/Caucasian vs Samoan Child Poverty Among Girls Under 16
COMPARE
White/Caucasian
Samoan
Child Poverty Among Girls Under 16
Child Poverty Among Girls Under 16 Comparison
Whites/Caucasians
Samoans
16.6%
CHILD POVERTY AMONG GIRLS UNDER 16
43.6/ 100
METRIC RATING
178th/ 347
METRIC RANK
15.7%
CHILD POVERTY AMONG GIRLS UNDER 16
84.2/ 100
METRIC RATING
146th/ 347
METRIC RANK
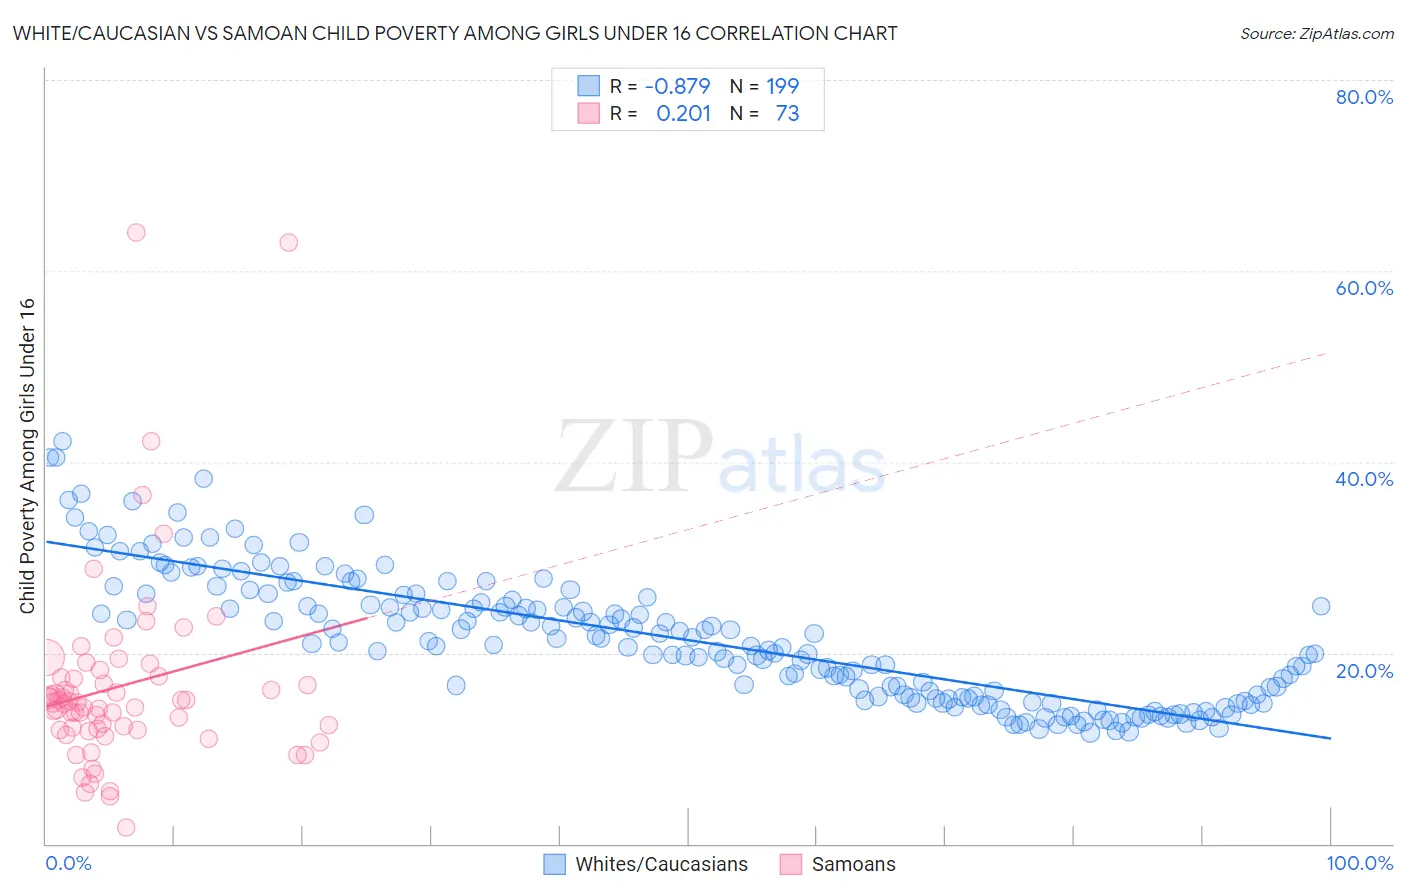
White/Caucasian vs Samoan Child Poverty Among Girls Under 16 Correlation Chart
The statistical analysis conducted on geographies consisting of 558,680,954 people shows a very strong negative correlation between the proportion of Whites/Caucasians and poverty level among girls under the age of 16 in the United States with a correlation coefficient (R) of -0.879 and weighted average of 16.6%. Similarly, the statistical analysis conducted on geographies consisting of 223,807,400 people shows a weak positive correlation between the proportion of Samoans and poverty level among girls under the age of 16 in the United States with a correlation coefficient (R) of 0.201 and weighted average of 15.7%, a difference of 5.8%.
Child Poverty Among Girls Under 16 Correlation Summary
| Measurement | White/Caucasian | Samoan |
| Minimum | 11.7% | 1.7% |
| Maximum | 42.2% | 64.0% |
| Range | 30.5% | 62.3% |
| Mean | 21.4% | 16.5% |
| Median | 20.7% | 14.8% |
| Interquartile 25% (IQ1) | 15.2% | 11.9% |
| Interquartile 75% (IQ3) | 25.5% | 17.5% |
| Interquartile Range (IQR) | 10.3% | 5.5% |
| Standard Deviation (Sample) | 6.8% | 10.3% |
| Standard Deviation (Population) | 6.7% | 10.3% |
Similar Demographics by Child Poverty Among Girls Under 16
Demographics Similar to Whites/Caucasians by Child Poverty Among Girls Under 16
In terms of child poverty among girls under 16, the demographic groups most similar to Whites/Caucasians are Hawaiian (16.6%, a difference of 0.030%), Immigrants from Syria (16.6%, a difference of 0.040%), Immigrants from Western Asia (16.6%, a difference of 0.060%), Immigrants from Iraq (16.6%, a difference of 0.060%), and Immigrants from Ethiopia (16.6%, a difference of 0.070%).
| Demographics | Rating | Rank | Child Poverty Among Girls Under 16 |
| Immigrants | Saudi Arabia | 64.0 /100 | #171 | Good 16.2% |
| Afghans | 62.3 /100 | #172 | Good 16.2% |
| Immigrants | South America | 55.1 /100 | #173 | Average 16.4% |
| Ethiopians | 50.0 /100 | #174 | Average 16.5% |
| Lebanese | 45.4 /100 | #175 | Average 16.6% |
| Hungarians | 45.1 /100 | #176 | Average 16.6% |
| Immigrants | Western Asia | 44.1 /100 | #177 | Average 16.6% |
| Whites/Caucasians | 43.6 /100 | #178 | Average 16.6% |
| Hawaiians | 43.4 /100 | #179 | Average 16.6% |
| Immigrants | Syria | 43.3 /100 | #180 | Average 16.6% |
| Immigrants | Iraq | 43.2 /100 | #181 | Average 16.6% |
| Immigrants | Ethiopia | 43.1 /100 | #182 | Average 16.6% |
| Immigrants | Portugal | 42.5 /100 | #183 | Average 16.6% |
| Scotch-Irish | 39.6 /100 | #184 | Fair 16.7% |
| Immigrants | Uruguay | 35.6 /100 | #185 | Fair 16.7% |
Demographics Similar to Samoans by Child Poverty Among Girls Under 16
In terms of child poverty among girls under 16, the demographic groups most similar to Samoans are Slavic (15.7%, a difference of 0.23%), Welsh (15.6%, a difference of 0.29%), Icelander (15.7%, a difference of 0.38%), Israeli (15.6%, a difference of 0.50%), and Immigrants from Peru (15.6%, a difference of 0.59%).
| Demographics | Rating | Rank | Child Poverty Among Girls Under 16 |
| Armenians | 87.9 /100 | #139 | Excellent 15.5% |
| New Zealanders | 87.2 /100 | #140 | Excellent 15.6% |
| Immigrants | Jordan | 87.2 /100 | #141 | Excellent 15.6% |
| Canadians | 87.1 /100 | #142 | Excellent 15.6% |
| Immigrants | Peru | 86.6 /100 | #143 | Excellent 15.6% |
| Israelis | 86.3 /100 | #144 | Excellent 15.6% |
| Welsh | 85.4 /100 | #145 | Excellent 15.6% |
| Samoans | 84.2 /100 | #146 | Excellent 15.7% |
| Slavs | 83.1 /100 | #147 | Excellent 15.7% |
| Icelanders | 82.4 /100 | #148 | Excellent 15.7% |
| Immigrants | Hungary | 80.9 /100 | #149 | Excellent 15.8% |
| Immigrants | Albania | 80.7 /100 | #150 | Excellent 15.8% |
| Venezuelans | 80.1 /100 | #151 | Excellent 15.8% |
| Immigrants | Kuwait | 79.4 /100 | #152 | Good 15.8% |
| Immigrants | Nepal | 78.5 /100 | #153 | Good 15.9% |