White/Caucasian vs Portuguese Child Poverty Among Girls Under 16
COMPARE
White/Caucasian
Portuguese
Child Poverty Among Girls Under 16
Child Poverty Among Girls Under 16 Comparison
Whites/Caucasians
Portuguese
16.6%
CHILD POVERTY AMONG GIRLS UNDER 16
43.6/ 100
METRIC RATING
178th/ 347
METRIC RANK
15.3%
CHILD POVERTY AMONG GIRLS UNDER 16
91.8/ 100
METRIC RATING
122nd/ 347
METRIC RANK
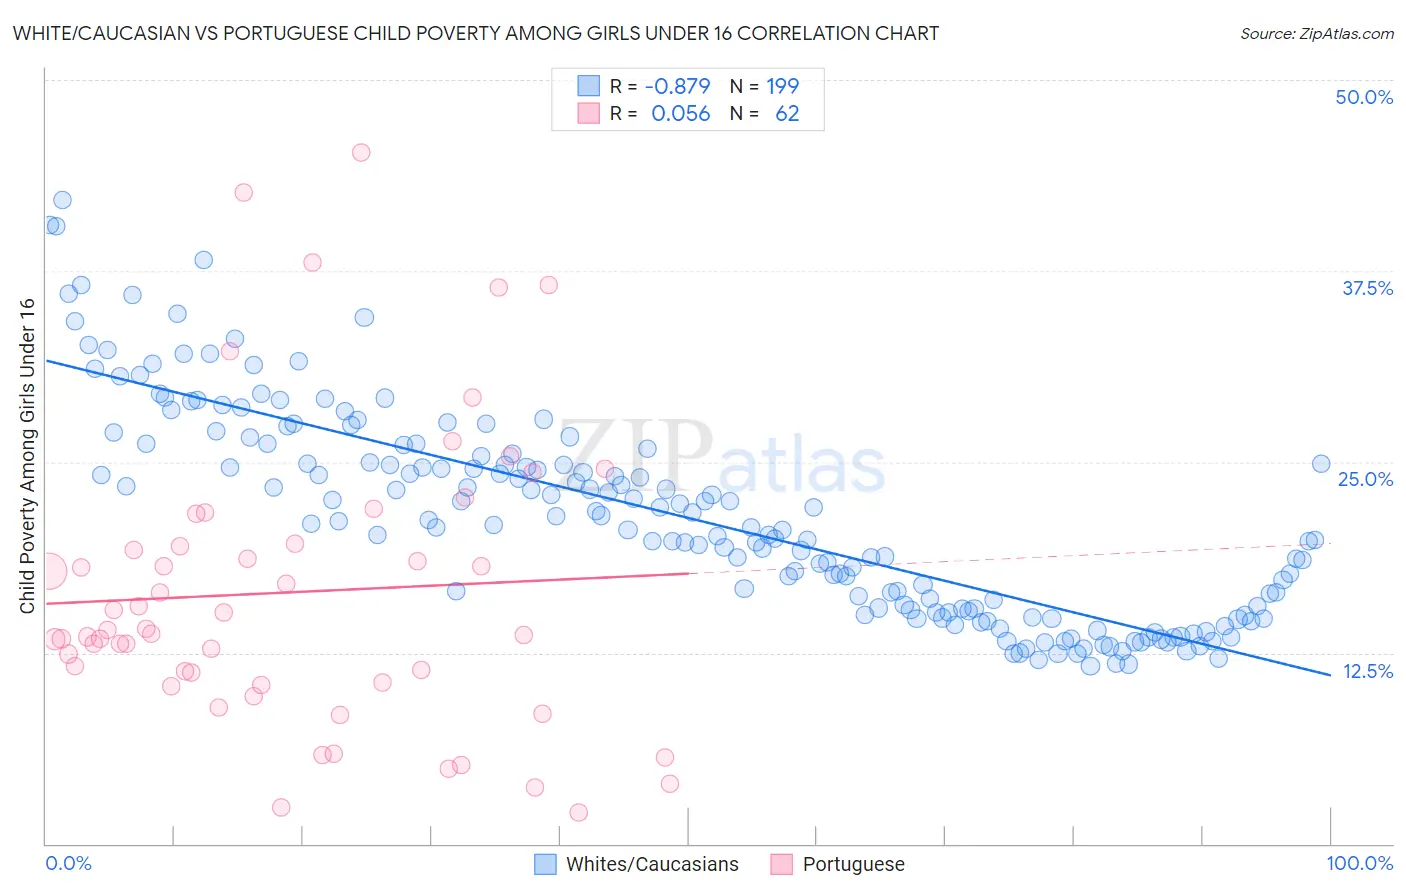
White/Caucasian vs Portuguese Child Poverty Among Girls Under 16 Correlation Chart
The statistical analysis conducted on geographies consisting of 558,680,954 people shows a very strong negative correlation between the proportion of Whites/Caucasians and poverty level among girls under the age of 16 in the United States with a correlation coefficient (R) of -0.879 and weighted average of 16.6%. Similarly, the statistical analysis conducted on geographies consisting of 438,899,993 people shows a slight positive correlation between the proportion of Portuguese and poverty level among girls under the age of 16 in the United States with a correlation coefficient (R) of 0.056 and weighted average of 15.3%, a difference of 8.2%.
Child Poverty Among Girls Under 16 Correlation Summary
| Measurement | White/Caucasian | Portuguese |
| Minimum | 11.7% | 2.0% |
| Maximum | 42.2% | 45.2% |
| Range | 30.5% | 43.2% |
| Mean | 21.4% | 16.5% |
| Median | 20.7% | 13.9% |
| Interquartile 25% (IQ1) | 15.2% | 10.6% |
| Interquartile 75% (IQ3) | 25.5% | 19.7% |
| Interquartile Range (IQR) | 10.3% | 9.1% |
| Standard Deviation (Sample) | 6.8% | 9.6% |
| Standard Deviation (Population) | 6.7% | 9.5% |
Similar Demographics by Child Poverty Among Girls Under 16
Demographics Similar to Whites/Caucasians by Child Poverty Among Girls Under 16
In terms of child poverty among girls under 16, the demographic groups most similar to Whites/Caucasians are Hawaiian (16.6%, a difference of 0.030%), Immigrants from Syria (16.6%, a difference of 0.040%), Immigrants from Western Asia (16.6%, a difference of 0.060%), Immigrants from Iraq (16.6%, a difference of 0.060%), and Immigrants from Ethiopia (16.6%, a difference of 0.070%).
| Demographics | Rating | Rank | Child Poverty Among Girls Under 16 |
| Immigrants | Saudi Arabia | 64.0 /100 | #171 | Good 16.2% |
| Afghans | 62.3 /100 | #172 | Good 16.2% |
| Immigrants | South America | 55.1 /100 | #173 | Average 16.4% |
| Ethiopians | 50.0 /100 | #174 | Average 16.5% |
| Lebanese | 45.4 /100 | #175 | Average 16.6% |
| Hungarians | 45.1 /100 | #176 | Average 16.6% |
| Immigrants | Western Asia | 44.1 /100 | #177 | Average 16.6% |
| Whites/Caucasians | 43.6 /100 | #178 | Average 16.6% |
| Hawaiians | 43.4 /100 | #179 | Average 16.6% |
| Immigrants | Syria | 43.3 /100 | #180 | Average 16.6% |
| Immigrants | Iraq | 43.2 /100 | #181 | Average 16.6% |
| Immigrants | Ethiopia | 43.1 /100 | #182 | Average 16.6% |
| Immigrants | Portugal | 42.5 /100 | #183 | Average 16.6% |
| Scotch-Irish | 39.6 /100 | #184 | Fair 16.7% |
| Immigrants | Uruguay | 35.6 /100 | #185 | Fair 16.7% |
Demographics Similar to Portuguese by Child Poverty Among Girls Under 16
In terms of child poverty among girls under 16, the demographic groups most similar to Portuguese are Irish (15.3%, a difference of 0.090%), Carpatho Rusyn (15.3%, a difference of 0.14%), English (15.3%, a difference of 0.19%), Pakistani (15.3%, a difference of 0.21%), and Peruvian (15.4%, a difference of 0.25%).
| Demographics | Rating | Rank | Child Poverty Among Girls Under 16 |
| Belgians | 93.9 /100 | #115 | Exceptional 15.2% |
| Immigrants | Denmark | 93.3 /100 | #116 | Exceptional 15.2% |
| Immigrants | North Macedonia | 93.1 /100 | #117 | Exceptional 15.2% |
| Immigrants | Southern Europe | 92.7 /100 | #118 | Exceptional 15.3% |
| Immigrants | Zimbabwe | 92.5 /100 | #119 | Exceptional 15.3% |
| Pakistanis | 92.3 /100 | #120 | Exceptional 15.3% |
| English | 92.2 /100 | #121 | Exceptional 15.3% |
| Portuguese | 91.8 /100 | #122 | Exceptional 15.3% |
| Irish | 91.5 /100 | #123 | Exceptional 15.3% |
| Carpatho Rusyns | 91.4 /100 | #124 | Exceptional 15.3% |
| Peruvians | 91.2 /100 | #125 | Exceptional 15.4% |
| Scottish | 91.0 /100 | #126 | Exceptional 15.4% |
| Immigrants | Norway | 90.8 /100 | #127 | Exceptional 15.4% |
| Albanians | 90.5 /100 | #128 | Exceptional 15.4% |
| Immigrants | South Eastern Asia | 90.5 /100 | #129 | Exceptional 15.4% |