White/Caucasian vs Immigrants from Kazakhstan Family Poverty
COMPARE
White/Caucasian
Immigrants from Kazakhstan
Family Poverty
Family Poverty Comparison
Whites/Caucasians
Immigrants from Kazakhstan
8.8%
FAMILY POVERTY
69.1/ 100
METRIC RATING
158th/ 347
METRIC RANK
8.5%
FAMILY POVERTY
84.1/ 100
METRIC RATING
140th/ 347
METRIC RANK
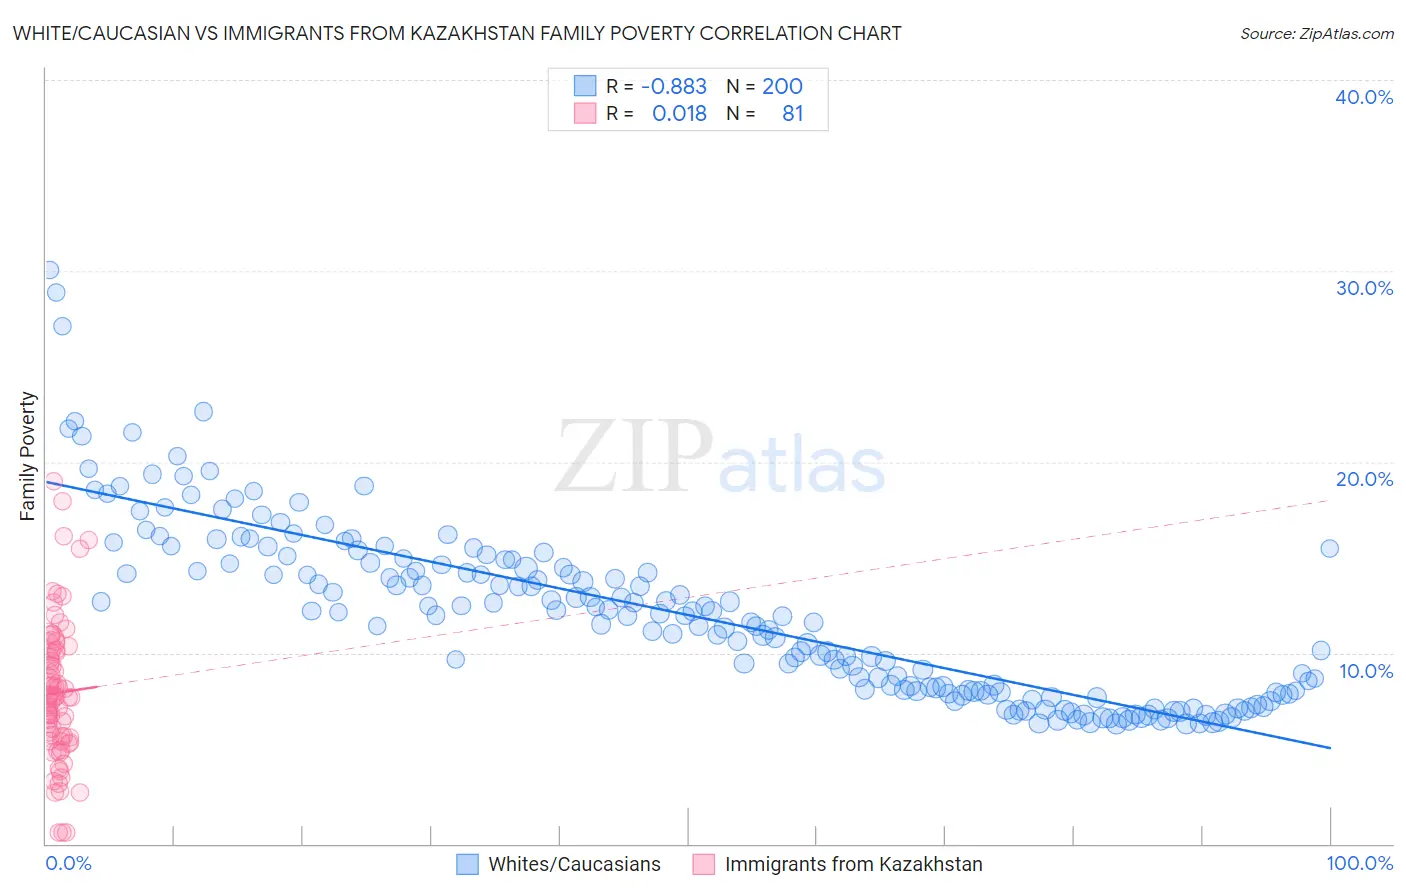
White/Caucasian vs Immigrants from Kazakhstan Family Poverty Correlation Chart
The statistical analysis conducted on geographies consisting of 578,762,373 people shows a very strong negative correlation between the proportion of Whites/Caucasians and poverty level among families in the United States with a correlation coefficient (R) of -0.883 and weighted average of 8.8%. Similarly, the statistical analysis conducted on geographies consisting of 124,352,430 people shows no correlation between the proportion of Immigrants from Kazakhstan and poverty level among families in the United States with a correlation coefficient (R) of 0.018 and weighted average of 8.5%, a difference of 3.0%.
Family Poverty Correlation Summary
| Measurement | White/Caucasian | Immigrants from Kazakhstan |
| Minimum | 6.3% | 0.57% |
| Maximum | 30.1% | 19.0% |
| Range | 23.8% | 18.4% |
| Mean | 12.0% | 7.9% |
| Median | 11.9% | 7.6% |
| Interquartile 25% (IQ1) | 7.9% | 5.5% |
| Interquartile 75% (IQ3) | 14.7% | 10.1% |
| Interquartile Range (IQR) | 6.7% | 4.6% |
| Standard Deviation (Sample) | 4.6% | 3.7% |
| Standard Deviation (Population) | 4.6% | 3.7% |
Demographics Similar to Whites/Caucasians and Immigrants from Kazakhstan by Family Poverty
In terms of family poverty, the demographic groups most similar to Whites/Caucasians are Tsimshian (8.8%, a difference of 0.040%), Peruvian (8.8%, a difference of 0.16%), Immigrants from Oceania (8.7%, a difference of 0.34%), Immigrants from Kuwait (8.7%, a difference of 0.74%), and Immigrants from Vietnam (8.7%, a difference of 1.1%). Similarly, the demographic groups most similar to Immigrants from Kazakhstan are Immigrants from Nepal (8.5%, a difference of 0.030%), Immigrants from Ukraine (8.5%, a difference of 0.030%), Yugoslavian (8.5%, a difference of 0.15%), Immigrants from Germany (8.5%, a difference of 0.18%), and Albanian (8.5%, a difference of 0.20%).
| Demographics | Rating | Rank | Family Poverty |
| Immigrants | Nepal | 84.2 /100 | #139 | Excellent 8.5% |
| Immigrants | Kazakhstan | 84.1 /100 | #140 | Excellent 8.5% |
| Immigrants | Ukraine | 83.9 /100 | #141 | Excellent 8.5% |
| Yugoslavians | 83.5 /100 | #142 | Excellent 8.5% |
| Immigrants | Germany | 83.3 /100 | #143 | Excellent 8.5% |
| Albanians | 83.3 /100 | #144 | Excellent 8.5% |
| Immigrants | South Eastern Asia | 83.2 /100 | #145 | Excellent 8.5% |
| Immigrants | Belarus | 83.2 /100 | #146 | Excellent 8.5% |
| Immigrants | Jordan | 83.0 /100 | #147 | Excellent 8.5% |
| Scotch-Irish | 82.2 /100 | #148 | Excellent 8.6% |
| Mongolians | 80.4 /100 | #149 | Excellent 8.6% |
| Syrians | 80.3 /100 | #150 | Excellent 8.6% |
| Brazilians | 80.1 /100 | #151 | Excellent 8.6% |
| Samoans | 79.8 /100 | #152 | Good 8.6% |
| Immigrants | Spain | 79.1 /100 | #153 | Good 8.6% |
| Immigrants | Vietnam | 75.4 /100 | #154 | Good 8.7% |
| Immigrants | Kuwait | 73.6 /100 | #155 | Good 8.7% |
| Immigrants | Oceania | 71.2 /100 | #156 | Good 8.7% |
| Tsimshian | 69.3 /100 | #157 | Good 8.8% |
| Whites/Caucasians | 69.1 /100 | #158 | Good 8.8% |
| Peruvians | 68.0 /100 | #159 | Good 8.8% |