White/Caucasian vs Bulgarian Female Poverty
COMPARE
White/Caucasian
Bulgarian
Female Poverty
Female Poverty Comparison
Whites/Caucasians
Bulgarians
13.4%
FEMALE POVERTY
54.6/ 100
METRIC RATING
171st/ 347
METRIC RANK
11.1%
FEMALE POVERTY
99.9/ 100
METRIC RATING
9th/ 347
METRIC RANK
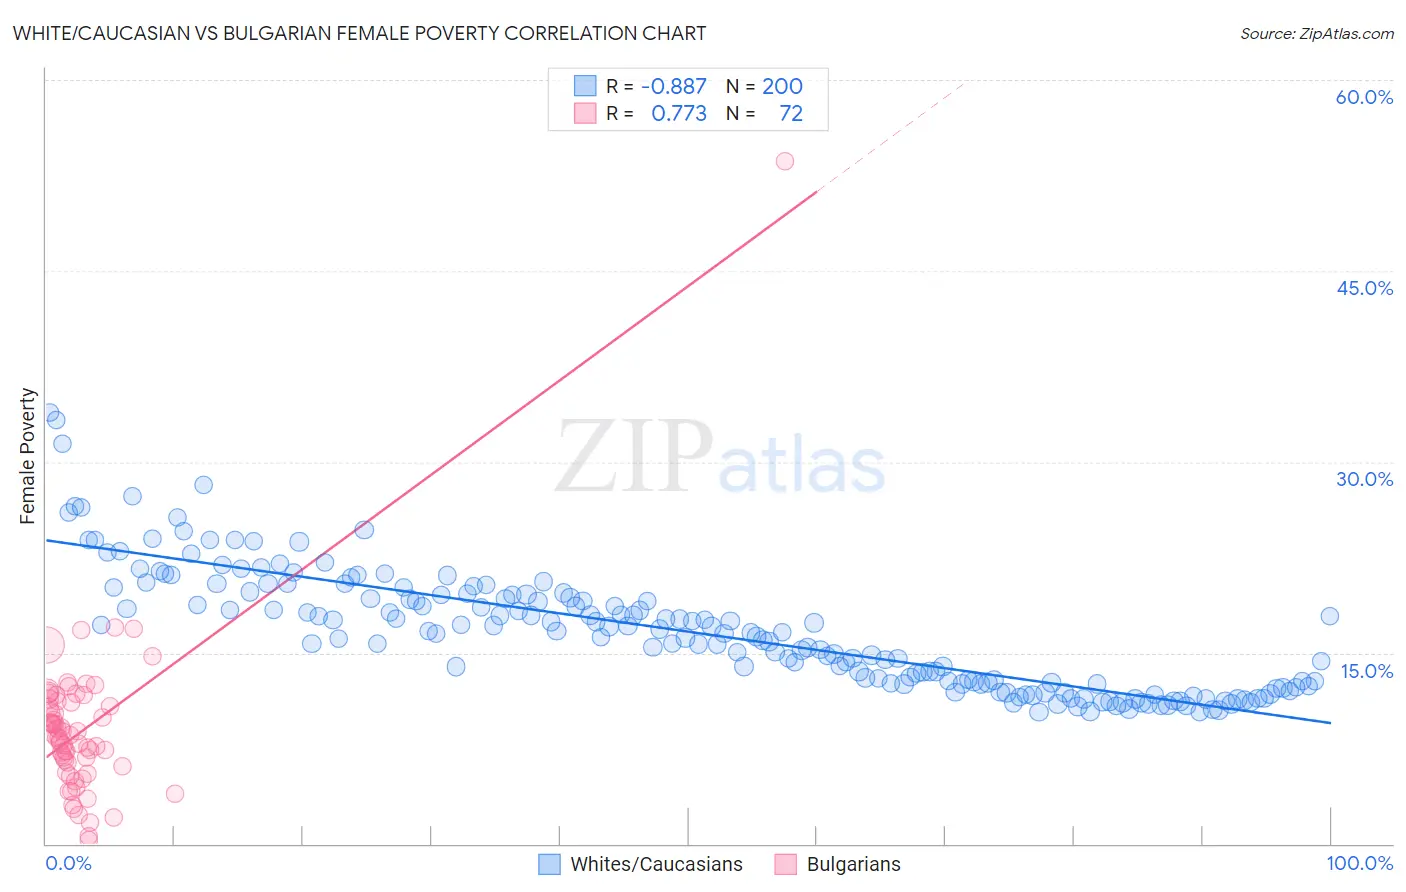
White/Caucasian vs Bulgarian Female Poverty Correlation Chart
The statistical analysis conducted on geographies consisting of 583,112,868 people shows a very strong negative correlation between the proportion of Whites/Caucasians and poverty level among females in the United States with a correlation coefficient (R) of -0.887 and weighted average of 13.4%. Similarly, the statistical analysis conducted on geographies consisting of 205,544,553 people shows a strong positive correlation between the proportion of Bulgarians and poverty level among females in the United States with a correlation coefficient (R) of 0.773 and weighted average of 11.1%, a difference of 20.2%.
Female Poverty Correlation Summary
| Measurement | White/Caucasian | Bulgarian |
| Minimum | 10.3% | 0.25% |
| Maximum | 33.9% | 53.6% |
| Range | 23.6% | 53.3% |
| Mean | 16.7% | 9.0% |
| Median | 16.5% | 8.5% |
| Interquartile 25% (IQ1) | 12.6% | 6.2% |
| Interquartile 75% (IQ3) | 19.6% | 11.1% |
| Interquartile Range (IQR) | 7.0% | 4.9% |
| Standard Deviation (Sample) | 4.7% | 6.5% |
| Standard Deviation (Population) | 4.7% | 6.4% |
Similar Demographics by Female Poverty
Demographics Similar to Whites/Caucasians by Female Poverty
In terms of female poverty, the demographic groups most similar to Whites/Caucasians are Mongolian (13.4%, a difference of 0.10%), Colombian (13.4%, a difference of 0.11%), Lebanese (13.4%, a difference of 0.13%), Aleut (13.4%, a difference of 0.21%), and Immigrants from Chile (13.3%, a difference of 0.27%).
| Demographics | Rating | Rank | Female Poverty |
| Ethiopians | 62.3 /100 | #164 | Good 13.3% |
| Scotch-Irish | 62.1 /100 | #165 | Good 13.3% |
| Immigrants | Oceania | 59.7 /100 | #166 | Average 13.3% |
| Immigrants | Chile | 57.4 /100 | #167 | Average 13.3% |
| Aleuts | 56.7 /100 | #168 | Average 13.4% |
| Lebanese | 55.9 /100 | #169 | Average 13.4% |
| Colombians | 55.7 /100 | #170 | Average 13.4% |
| Whites/Caucasians | 54.6 /100 | #171 | Average 13.4% |
| Mongolians | 53.6 /100 | #172 | Average 13.4% |
| Immigrants | Afghanistan | 50.8 /100 | #173 | Average 13.4% |
| Immigrants | Iraq | 50.0 /100 | #174 | Average 13.4% |
| Celtics | 49.9 /100 | #175 | Average 13.4% |
| Immigrants | Spain | 49.9 /100 | #176 | Average 13.4% |
| Immigrants | Morocco | 49.4 /100 | #177 | Average 13.4% |
| Israelis | 49.1 /100 | #178 | Average 13.5% |
Demographics Similar to Bulgarians by Female Poverty
In terms of female poverty, the demographic groups most similar to Bulgarians are Immigrants from South Central Asia (11.1%, a difference of 0.19%), Immigrants from Hong Kong (11.2%, a difference of 0.80%), Assyrian/Chaldean/Syriac (11.0%, a difference of 0.89%), Maltese (11.2%, a difference of 0.91%), and Immigrants from Ireland (11.0%, a difference of 1.3%).
| Demographics | Rating | Rank | Female Poverty |
| Chinese | 100.0 /100 | #2 | Exceptional 10.4% |
| Thais | 100.0 /100 | #3 | Exceptional 10.5% |
| Immigrants | Taiwan | 100.0 /100 | #4 | Exceptional 10.5% |
| Filipinos | 100.0 /100 | #5 | Exceptional 10.9% |
| Immigrants | Ireland | 99.9 /100 | #6 | Exceptional 11.0% |
| Assyrians/Chaldeans/Syriacs | 99.9 /100 | #7 | Exceptional 11.0% |
| Immigrants | South Central Asia | 99.9 /100 | #8 | Exceptional 11.1% |
| Bulgarians | 99.9 /100 | #9 | Exceptional 11.1% |
| Immigrants | Hong Kong | 99.9 /100 | #10 | Exceptional 11.2% |
| Maltese | 99.9 /100 | #11 | Exceptional 11.2% |
| Bhutanese | 99.9 /100 | #12 | Exceptional 11.3% |
| Immigrants | Lithuania | 99.9 /100 | #13 | Exceptional 11.3% |
| Lithuanians | 99.8 /100 | #14 | Exceptional 11.4% |
| Latvians | 99.8 /100 | #15 | Exceptional 11.4% |
| Immigrants | Bolivia | 99.8 /100 | #16 | Exceptional 11.5% |