West Indian vs Immigrants from El Salvador Receiving Food Stamps
COMPARE
West Indian
Immigrants from El Salvador
Receiving Food Stamps
Receiving Food Stamps Comparison
West Indians
Immigrants from El Salvador
16.3%
RECEIVING FOOD STAMPS
0.0/ 100
METRIC RATING
304th/ 347
METRIC RANK
13.5%
RECEIVING FOOD STAMPS
1.5/ 100
METRIC RATING
237th/ 347
METRIC RANK
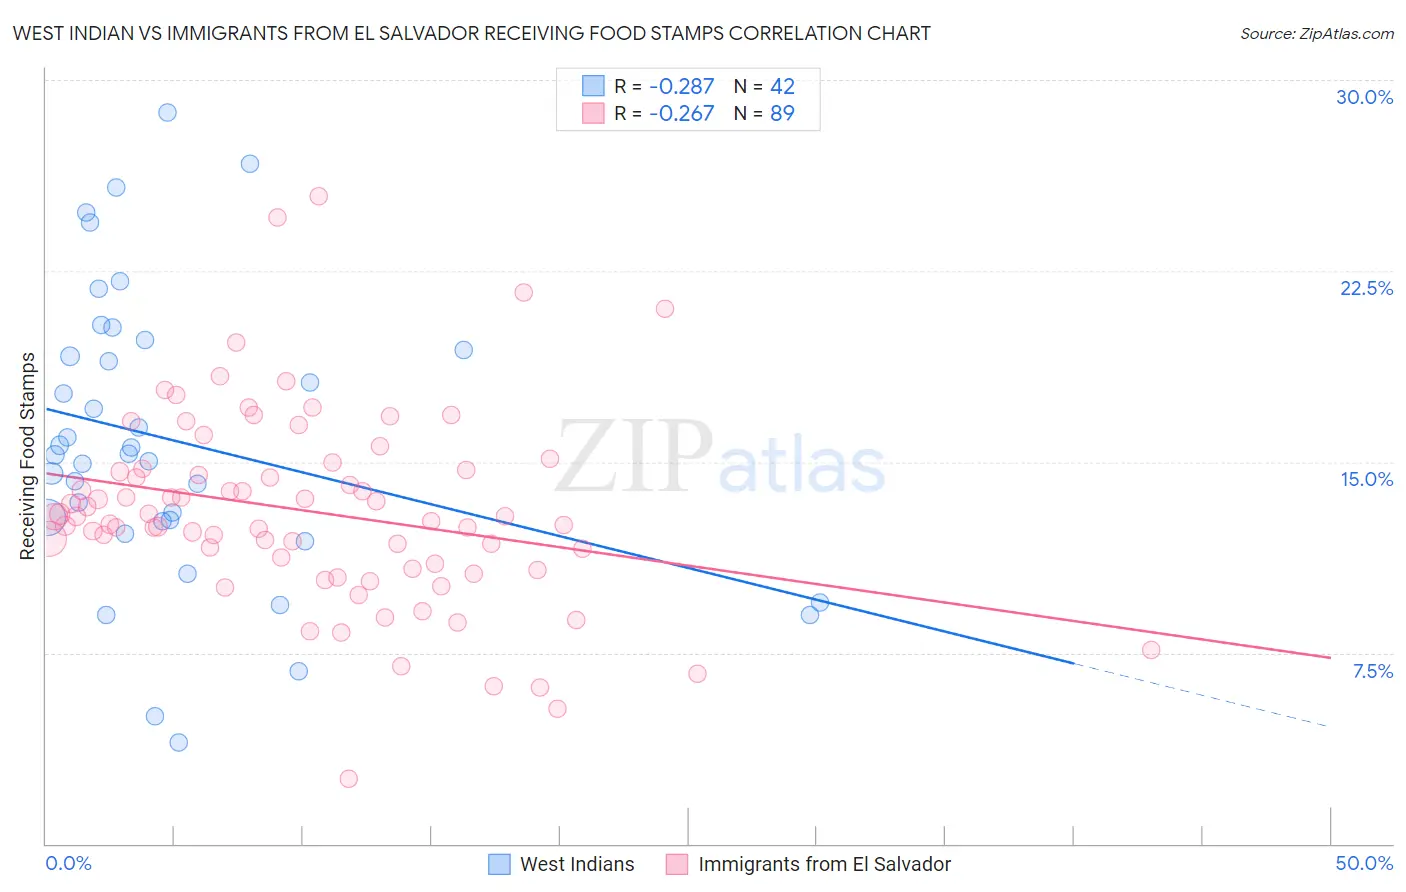
West Indian vs Immigrants from El Salvador Receiving Food Stamps Correlation Chart
The statistical analysis conducted on geographies consisting of 253,628,071 people shows a weak negative correlation between the proportion of West Indians and percentage of population receiving government assistance and/or food stamps in the United States with a correlation coefficient (R) of -0.287 and weighted average of 16.3%. Similarly, the statistical analysis conducted on geographies consisting of 357,240,396 people shows a weak negative correlation between the proportion of Immigrants from El Salvador and percentage of population receiving government assistance and/or food stamps in the United States with a correlation coefficient (R) of -0.267 and weighted average of 13.5%, a difference of 20.8%.
Receiving Food Stamps Correlation Summary
| Measurement | West Indian | Immigrants from El Salvador |
| Minimum | 4.0% | 2.5% |
| Maximum | 28.7% | 25.4% |
| Range | 24.7% | 22.9% |
| Mean | 15.8% | 13.1% |
| Median | 15.3% | 12.8% |
| Interquartile 25% (IQ1) | 12.7% | 10.9% |
| Interquartile 75% (IQ3) | 19.4% | 14.7% |
| Interquartile Range (IQR) | 6.7% | 3.8% |
| Standard Deviation (Sample) | 5.7% | 3.8% |
| Standard Deviation (Population) | 5.6% | 3.8% |
Similar Demographics by Receiving Food Stamps
Demographics Similar to West Indians by Receiving Food Stamps
In terms of receiving food stamps, the demographic groups most similar to West Indians are Nicaraguan (16.1%, a difference of 0.68%), Immigrants from West Indies (16.1%, a difference of 0.77%), Immigrants from the Azores (16.4%, a difference of 0.88%), Jamaican (16.4%, a difference of 0.94%), and Houma (16.5%, a difference of 1.2%).
| Demographics | Rating | Rank | Receiving Food Stamps |
| Immigrants | Bahamas | 0.0 /100 | #297 | Tragic 15.8% |
| Immigrants | Trinidad and Tobago | 0.0 /100 | #298 | Tragic 15.8% |
| Hispanics or Latinos | 0.0 /100 | #299 | Tragic 15.8% |
| Immigrants | Bangladesh | 0.0 /100 | #300 | Tragic 15.9% |
| Trinidadians and Tobagonians | 0.0 /100 | #301 | Tragic 16.0% |
| Immigrants | West Indies | 0.0 /100 | #302 | Tragic 16.1% |
| Nicaraguans | 0.0 /100 | #303 | Tragic 16.1% |
| West Indians | 0.0 /100 | #304 | Tragic 16.3% |
| Immigrants | Azores | 0.0 /100 | #305 | Tragic 16.4% |
| Jamaicans | 0.0 /100 | #306 | Tragic 16.4% |
| Houma | 0.0 /100 | #307 | Tragic 16.5% |
| Barbadians | 0.0 /100 | #308 | Tragic 16.5% |
| U.S. Virgin Islanders | 0.0 /100 | #309 | Tragic 16.5% |
| Immigrants | Barbados | 0.0 /100 | #310 | Tragic 16.6% |
| Guyanese | 0.0 /100 | #311 | Tragic 16.7% |
Demographics Similar to Immigrants from El Salvador by Receiving Food Stamps
In terms of receiving food stamps, the demographic groups most similar to Immigrants from El Salvador are French American Indian (13.5%, a difference of 0.20%), Crow (13.4%, a difference of 0.22%), Immigrants from Micronesia (13.5%, a difference of 0.42%), Immigrants from Zaire (13.4%, a difference of 0.67%), and Iroquois (13.5%, a difference of 0.72%).
| Demographics | Rating | Rank | Receiving Food Stamps |
| Puget Sound Salish | 3.4 /100 | #230 | Tragic 13.1% |
| Immigrants | Nigeria | 3.4 /100 | #231 | Tragic 13.1% |
| Salvadorans | 2.7 /100 | #232 | Tragic 13.2% |
| Cherokee | 2.5 /100 | #233 | Tragic 13.2% |
| Comanche | 2.4 /100 | #234 | Tragic 13.3% |
| Immigrants | Zaire | 1.9 /100 | #235 | Tragic 13.4% |
| Crow | 1.6 /100 | #236 | Tragic 13.4% |
| Immigrants | El Salvador | 1.5 /100 | #237 | Tragic 13.5% |
| French American Indians | 1.4 /100 | #238 | Tragic 13.5% |
| Immigrants | Micronesia | 1.3 /100 | #239 | Tragic 13.5% |
| Iroquois | 1.2 /100 | #240 | Tragic 13.5% |
| Choctaw | 1.0 /100 | #241 | Tragic 13.6% |
| Immigrants | Panama | 1.0 /100 | #242 | Tragic 13.6% |
| Somalis | 0.9 /100 | #243 | Tragic 13.7% |
| Cajuns | 0.9 /100 | #244 | Tragic 13.7% |