Vietnamese vs Immigrants from Armenia Poverty
COMPARE
Vietnamese
Immigrants from Armenia
Poverty
Poverty Comparison
Vietnamese
Immigrants from Armenia
15.0%
POVERTY
0.0/ 100
METRIC RATING
285th/ 347
METRIC RANK
13.9%
POVERTY
0.5/ 100
METRIC RATING
236th/ 347
METRIC RANK
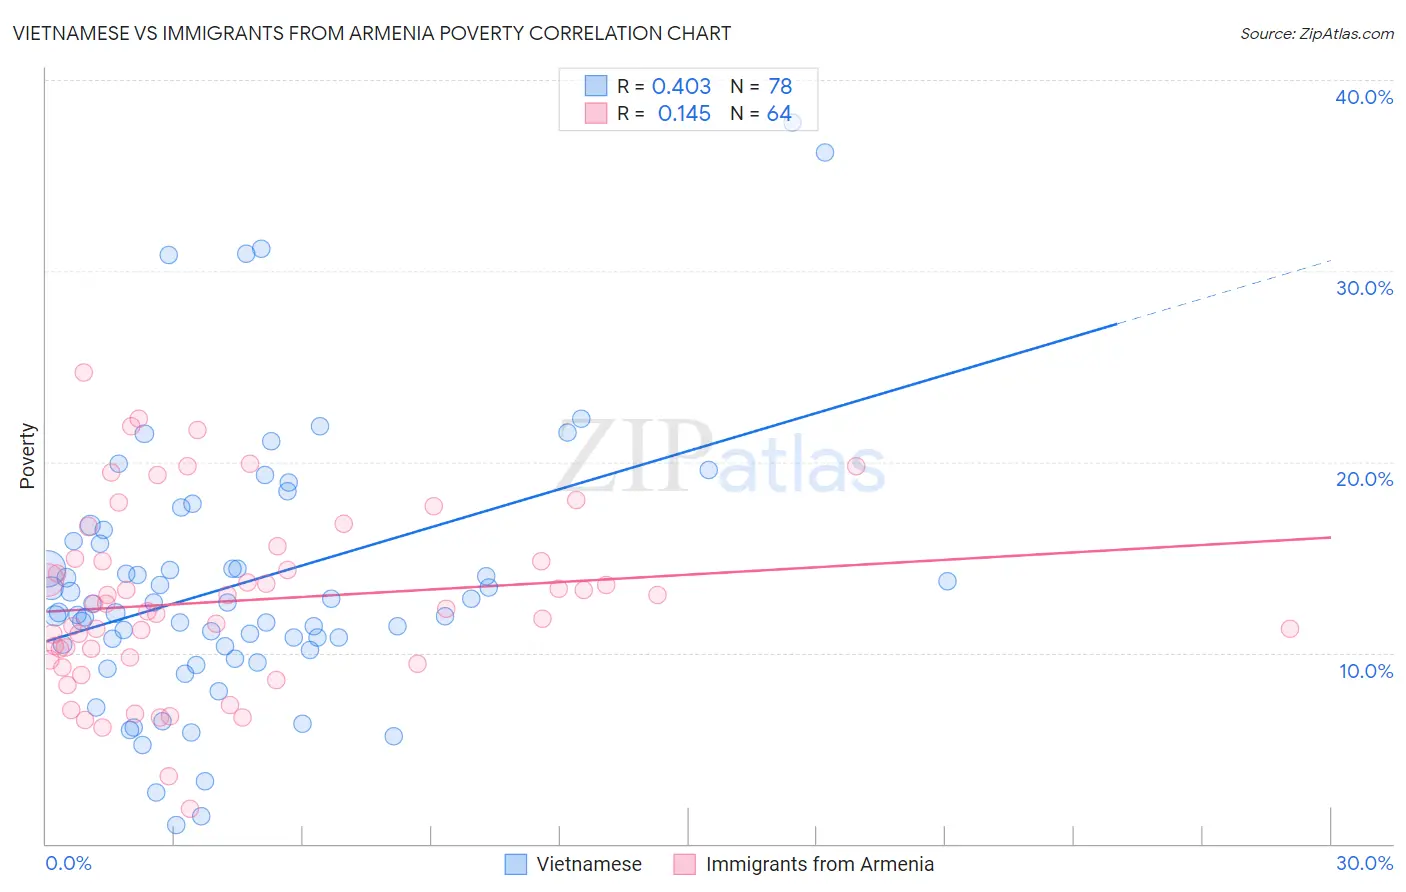
Vietnamese vs Immigrants from Armenia Poverty Correlation Chart
The statistical analysis conducted on geographies consisting of 170,677,568 people shows a moderate positive correlation between the proportion of Vietnamese and poverty level in the United States with a correlation coefficient (R) of 0.403 and weighted average of 15.0%. Similarly, the statistical analysis conducted on geographies consisting of 97,715,591 people shows a poor positive correlation between the proportion of Immigrants from Armenia and poverty level in the United States with a correlation coefficient (R) of 0.145 and weighted average of 13.9%, a difference of 8.1%.
Poverty Correlation Summary
| Measurement | Vietnamese | Immigrants from Armenia |
| Minimum | 1.0% | 1.8% |
| Maximum | 37.7% | 24.7% |
| Range | 36.7% | 22.8% |
| Mean | 13.6% | 12.7% |
| Median | 12.3% | 12.4% |
| Interquartile 25% (IQ1) | 10.4% | 9.7% |
| Interquartile 75% (IQ3) | 15.9% | 14.9% |
| Interquartile Range (IQR) | 5.5% | 5.2% |
| Standard Deviation (Sample) | 7.0% | 4.7% |
| Standard Deviation (Population) | 7.0% | 4.7% |
Similar Demographics by Poverty
Demographics Similar to Vietnamese by Poverty
In terms of poverty, the demographic groups most similar to Vietnamese are West Indian (15.0%, a difference of 0.050%), Immigrants from Haiti (15.0%, a difference of 0.16%), Immigrants from Latin America (15.0%, a difference of 0.26%), Comanche (15.0%, a difference of 0.28%), and Inupiat (15.1%, a difference of 0.47%).
| Demographics | Rating | Rank | Poverty |
| Belizeans | 0.0 /100 | #278 | Tragic 14.8% |
| Immigrants | St. Vincent and the Grenadines | 0.0 /100 | #279 | Tragic 14.9% |
| Haitians | 0.0 /100 | #280 | Tragic 14.9% |
| Immigrants | Barbados | 0.0 /100 | #281 | Tragic 14.9% |
| Comanche | 0.0 /100 | #282 | Tragic 15.0% |
| Immigrants | Haiti | 0.0 /100 | #283 | Tragic 15.0% |
| West Indians | 0.0 /100 | #284 | Tragic 15.0% |
| Vietnamese | 0.0 /100 | #285 | Tragic 15.0% |
| Immigrants | Latin America | 0.0 /100 | #286 | Tragic 15.0% |
| Inupiat | 0.0 /100 | #287 | Tragic 15.1% |
| Yaqui | 0.0 /100 | #288 | Tragic 15.1% |
| Immigrants | Belize | 0.0 /100 | #289 | Tragic 15.1% |
| Mexicans | 0.0 /100 | #290 | Tragic 15.1% |
| Immigrants | Cabo Verde | 0.0 /100 | #291 | Tragic 15.1% |
| Indonesians | 0.0 /100 | #292 | Tragic 15.1% |
Demographics Similar to Immigrants from Armenia by Poverty
In terms of poverty, the demographic groups most similar to Immigrants from Armenia are French American Indian (13.9%, a difference of 0.020%), Cuban (13.9%, a difference of 0.040%), Ghanaian (13.9%, a difference of 0.15%), Immigrants from Laos (13.8%, a difference of 0.47%), and Nicaraguan (13.9%, a difference of 0.50%).
| Demographics | Rating | Rank | Poverty |
| Osage | 1.5 /100 | #229 | Tragic 13.6% |
| Alaskan Athabascans | 1.5 /100 | #230 | Tragic 13.6% |
| Nigerians | 1.4 /100 | #231 | Tragic 13.6% |
| Fijians | 0.8 /100 | #232 | Tragic 13.7% |
| Immigrants | Saudi Arabia | 0.8 /100 | #233 | Tragic 13.8% |
| Immigrants | Laos | 0.7 /100 | #234 | Tragic 13.8% |
| Cubans | 0.6 /100 | #235 | Tragic 13.9% |
| Immigrants | Armenia | 0.5 /100 | #236 | Tragic 13.9% |
| French American Indians | 0.5 /100 | #237 | Tragic 13.9% |
| Ghanaians | 0.5 /100 | #238 | Tragic 13.9% |
| Nicaraguans | 0.4 /100 | #239 | Tragic 13.9% |
| Immigrants | Middle Africa | 0.4 /100 | #240 | Tragic 14.0% |
| Salvadorans | 0.4 /100 | #241 | Tragic 14.0% |
| Ecuadorians | 0.4 /100 | #242 | Tragic 14.0% |
| Sudanese | 0.3 /100 | #243 | Tragic 14.0% |