Vietnamese vs Immigrants from Armenia In Labor Force | Age 45-54

COMPARE

Vietnamese
Race
Ancestry
AfghanAfricanAlaska NativeAlaskan AthabascanAlbanianAleutAlsatianAmericanApacheArabArapahoArgentineanArmenianAssyrian/Chaldean/SyriacAustralianAustrianBahamianBangladeshiBarbadianBasqueBelgianBelizeanBermudanBhutaneseBlackfeetBolivianBrazilianBritishBritish West IndianBulgarianBurmeseCajunCambodianCanadianCape VerdeanCarpatho RusynCelticCentral AmericanCentral American IndianCherokeeCheyenneChickasawChileanChineseChippewaChoctawColombianColvilleComancheCosta RicanCreeCreekCroatianCrowCubanCypriotCzechCzechoslovakianDanishDelawareDominicanDutchDutch West IndianEastern EuropeanEcuadorianEgyptianEnglishEstonianEthiopianEuropeanFijianFilipinoFinnishFrenchFrench American IndianFrench CanadianGermanGerman RussianGhanaianGreekGuamanian/ChamorroGuatemalanGuyaneseHaitianHmongHonduranHopiHoumaHungarianIcelanderIndian (Asian)IndonesianInupiatIranianIraqiIrishIroquoisIsraeliItalianJamaicanJapaneseJordanianKenyanKiowaKoreanLaotianLatvianLebaneseLiberianLithuanianLumbeeLuxembourgerMacedonianMalaysianMalteseMarshalleseMenomineeMexicanMexican American IndianMongolianMoroccanNative HawaiianNavajoNepaleseNew ZealanderNicaraguanNigerianNorthern EuropeanNorwegianOkinawanOsageOttawaPaiutePakistaniPalestinianPanamanianParaguayanPennsylvania GermanPeruvianPimaPolishPortuguesePotawatomiPuebloPuerto RicanPuget Sound SalishRomanianRussianSalvadoranSamoanScandinavianScotch-IrishScottishSeminoleSenegaleseSerbianShoshoneSierra LeoneanSiouxSlavicSlovakSloveneSomaliSouth AfricanSouth AmericanSouth American IndianSoviet UnionSpaniardSpanishSpanish AmericanSpanish American IndianSri LankanSubsaharan AfricanSudaneseSwedishSwissSyrianTaiwaneseThaiTlingit-HaidaTohono O'OdhamTonganTrinidadian and TobagonianTsimshianTurkishU.S. Virgin IslanderUgandanUkrainianUruguayanUteVenezuelanVietnameseWelshWest IndianYakamaYaquiYugoslavianYumanYup'ikZimbabwean
Immigration
NonimmigrantsImmigrantsAfghanistanAfricaAlbaniaArgentinaAsiaAustraliaAustriaBahamasBangladeshBarbadosBelarusBelgiumBelizeBoliviaBosnia and HerzegovinaBrazilBulgariaBurma/MyanmarCabo VerdeCambodiaCameroonCanadaCaribbeanCentral AmericaChileChinaColombiaCongoCosta RicaCroatiaCubaCzechoslovakiaDenmarkDominicaDominican RepublicEastern AfricaEastern AsiaEastern EuropeEcuadorEgyptEl SalvadorEnglandEritreaEthiopiaEuropeFijiFranceGermanyGhanaGreeceGrenadaGuatemalaGuyanaHaitiHondurasHong KongHungaryIndiaIndonesiaIranIraqIrelandIsraelItalyJamaicaJapanJordanKazakhstanKenyaKoreaKuwaitLaosLatin AmericaLatviaLebanonLiberiaLithuaniaMalaysiaMexicoMicronesiaMiddle AfricaMoldovaMoroccoNepalNetherlandsNicaraguaNigeriaNorth AmericaNorth MacedoniaNorthern AfricaNorthern EuropeNorwayOceaniaPakistanPanamaPeruPhilippinesPolandPortugalRomaniaRussiaSaudi ArabiaScotlandSenegalSerbiaSierra LeoneSingaporeSomaliaSouth AfricaSouth AmericaSouth Central AsiaSouth Eastern AsiaSouthern EuropeSpainSri LankaSt. Vincent and the GrenadinesSudanSwedenSwitzerlandSyriaTaiwanThailandTrinidad and TobagoTurkeyUgandaUkraineUruguayUzbekistanVenezuelaVietnamWest IndiesWestern AfricaWestern AsiaWestern EuropeYemenZaireZimbabweAzores
Immigrants from Armenia
Race
Ancestry
AfghanAfricanAlaska NativeAlaskan AthabascanAlbanianAleutAlsatianAmericanApacheArabArapahoArgentineanArmenianAssyrian/Chaldean/SyriacAustralianAustrianBahamianBangladeshiBarbadianBasqueBelgianBelizeanBermudanBhutaneseBlackfeetBolivianBrazilianBritishBritish West IndianBulgarianBurmeseCajunCambodianCanadianCape VerdeanCarpatho RusynCelticCentral AmericanCentral American IndianCherokeeCheyenneChickasawChileanChineseChippewaChoctawColombianColvilleComancheCosta RicanCreeCreekCroatianCrowCubanCypriotCzechCzechoslovakianDanishDelawareDominicanDutchDutch West IndianEastern EuropeanEcuadorianEgyptianEnglishEstonianEthiopianEuropeanFijianFilipinoFinnishFrenchFrench American IndianFrench CanadianGermanGerman RussianGhanaianGreekGuamanian/ChamorroGuatemalanGuyaneseHaitianHmongHonduranHopiHoumaHungarianIcelanderIndian (Asian)IndonesianInupiatIranianIraqiIrishIroquoisIsraeliItalianJamaicanJapaneseJordanianKenyanKiowaKoreanLaotianLatvianLebaneseLiberianLithuanianLumbeeLuxembourgerMacedonianMalaysianMalteseMarshalleseMenomineeMexicanMexican American IndianMongolianMoroccanNative HawaiianNavajoNepaleseNew ZealanderNicaraguanNigerianNorthern EuropeanNorwegianOkinawanOsageOttawaPaiutePakistaniPalestinianPanamanianParaguayanPennsylvania GermanPeruvianPimaPolishPortuguesePotawatomiPuebloPuerto RicanPuget Sound SalishRomanianRussianSalvadoranSamoanScandinavianScotch-IrishScottishSeminoleSenegaleseSerbianShoshoneSierra LeoneanSiouxSlavicSlovakSloveneSomaliSouth AfricanSouth AmericanSouth American IndianSoviet UnionSpaniardSpanishSpanish AmericanSpanish American IndianSri LankanSubsaharan AfricanSudaneseSwedishSwissSyrianTaiwaneseThaiTlingit-HaidaTohono O'OdhamTonganTrinidadian and TobagonianTsimshianTurkishU.S. Virgin IslanderUgandanUkrainianUruguayanUteVenezuelanWelshWest IndianYakamaYaquiYugoslavianYumanYup'ikZimbabwean
Immigration
NonimmigrantsImmigrantsAfghanistanAfricaAlbaniaArgentinaArmeniaAsiaAustraliaAustriaBahamasBangladeshBarbadosBelarusBelgiumBelizeBoliviaBosnia and HerzegovinaBrazilBulgariaBurma/MyanmarCabo VerdeCambodiaCameroonCanadaCaribbeanCentral AmericaChileChinaColombiaCongoCosta RicaCroatiaCubaCzechoslovakiaDenmarkDominicaDominican RepublicEastern AfricaEastern AsiaEastern EuropeEcuadorEgyptEl SalvadorEnglandEritreaEthiopiaEuropeFijiFranceGermanyGhanaGreeceGrenadaGuatemalaGuyanaHaitiHondurasHong KongHungaryIndiaIndonesiaIranIraqIrelandIsraelItalyJamaicaJapanJordanKazakhstanKenyaKoreaKuwaitLaosLatin AmericaLatviaLebanonLiberiaLithuaniaMalaysiaMexicoMicronesiaMiddle AfricaMoldovaMoroccoNepalNetherlandsNicaraguaNigeriaNorth AmericaNorth MacedoniaNorthern AfricaNorthern EuropeNorwayOceaniaPakistanPanamaPeruPhilippinesPolandPortugalRomaniaRussiaSaudi ArabiaScotlandSenegalSerbiaSierra LeoneSingaporeSomaliaSouth AfricaSouth AmericaSouth Central AsiaSouth Eastern AsiaSouthern EuropeSpainSri LankaSt. Vincent and the GrenadinesSudanSwedenSwitzerlandSyriaTaiwanThailandTrinidad and TobagoTurkeyUgandaUkraineUruguayUzbekistanVenezuelaVietnamWest IndiesWestern AfricaWestern AsiaWestern EuropeYemenZaireZimbabweAzores
In Labor Force | Age 45-54
Income
Poverty
Unemployment
Labor Participation
Family Structure
Vehicle Availability
Education Level
Disability

In Labor Force | Age 45-54 Comparison

Vietnamese

Immigrants from Armenia

Tragic
Tragic
80.8%
IN LABOR FORCE | AGE 45-54
0.0/ 100
METRIC RATING
287th/ 347
METRIC RANK
81.7%
IN LABOR FORCE | AGE 45-54
0.2/ 100
METRIC RATING
250th/ 347
METRIC RANK

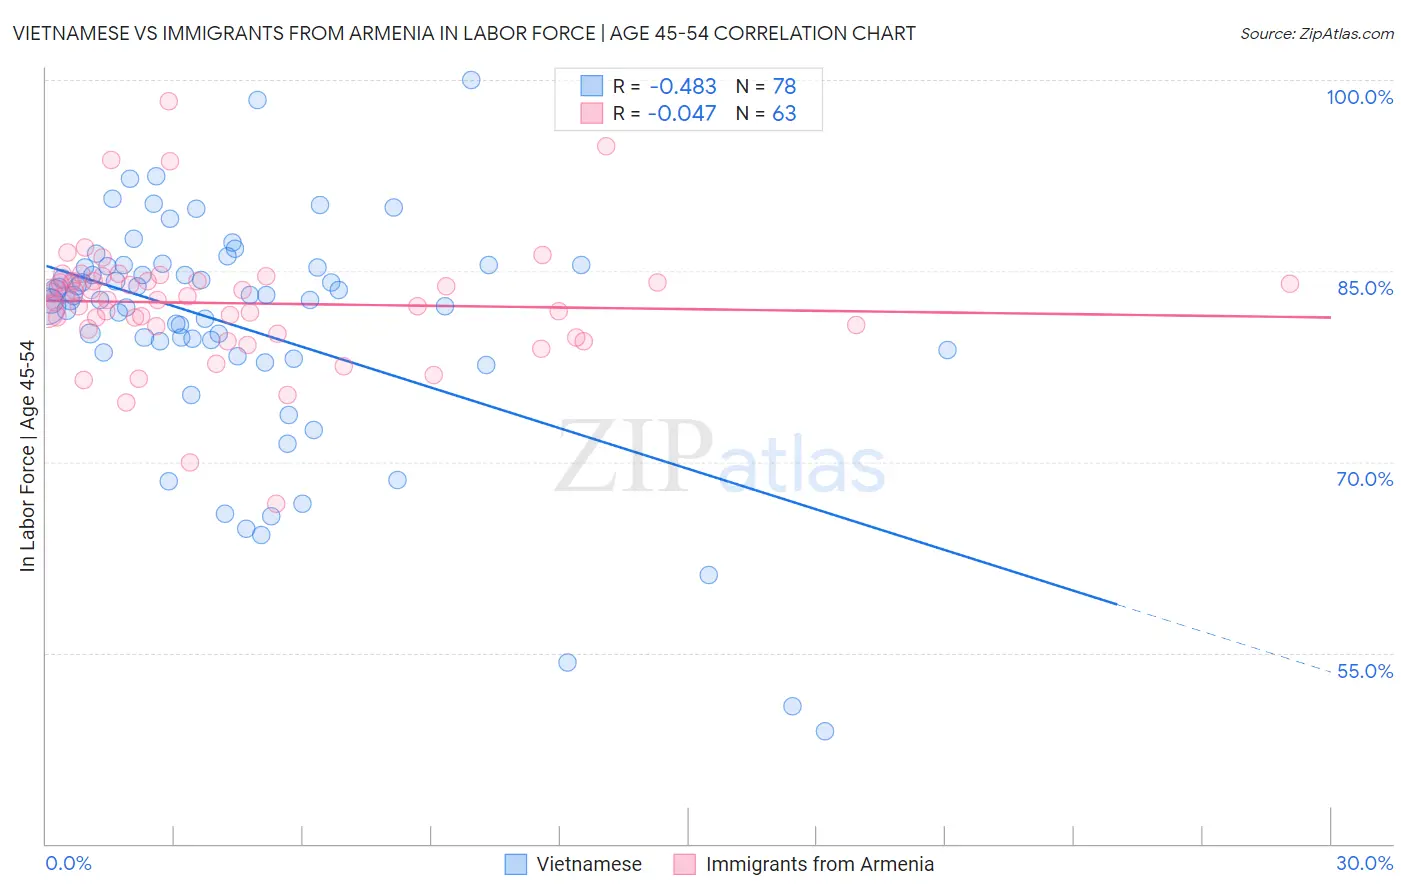
Vietnamese vs Immigrants from Armenia In Labor Force | Age 45-54 Correlation Chart

The statistical analysis conducted on geographies consisting of 170,653,074 people shows a moderate negative correlation between the proportion of Vietnamese and labor force participation rate among population between the ages 45 and 54 in the United States with a correlation coefficient (R) of -0.483 and weighted average of 80.8%. Similarly, the statistical analysis conducted on geographies consisting of 97,712,930 people shows no correlation between the proportion of Immigrants from Armenia and labor force participation rate among population between the ages 45 and 54 in the United States with a correlation coefficient (R) of -0.047 and weighted average of 81.7%, a difference of 1.1%.
Vietnamese vs Immigrants from Armenia In Labor Force | Age 45-54

In Labor Force | Age 45-54 Correlation Summary

MeasurementVietnameseImmigrants from Armenia
Minimum48.8%66.7%
Maximum100.0%98.3%
Range51.2%31.6%
Mean80.5%82.5%
Median82.7%82.7%
Interquartile 25% (IQ1)78.6%80.4%
Interquartile 75% (IQ3)85.3%84.2%
Interquartile Range (IQR)6.8%3.8%
Standard Deviation (Sample)9.4%4.9%
Standard Deviation (Population)9.3%4.9%

Similar Demographics by In Labor Force | Age 45-54

Demographics Similar to Vietnamese by In Labor Force | Age 45-54

In terms of in labor force | age 45-54, the demographic groups most similar to Vietnamese are Immigrants from Dominica (80.8%, a difference of 0.0%), Cree (80.8%, a difference of 0.0%), Delaware (80.8%, a difference of 0.010%), Belizean (80.8%, a difference of 0.020%), and Immigrants from Bangladesh (80.7%, a difference of 0.030%).
DemographicsRating | RankIn Labor Force | Age 45-54
Immigrants | Latin America
0.0
/100
|
#280
Tragic
81.0%
Immigrants | Grenada
0.0
/100
|
#281
Tragic
81.0%
Aleuts
0.0
/100
|
#282
Tragic
81.0%
French American Indians
0.0
/100
|
#283
Tragic
80.8%
Belizeans
0.0
/100
|
#284
Tragic
80.8%
Delaware
0.0
/100
|
#285
Tragic
80.8%
Immigrants | Dominica
0.0
/100
|
#286
Tragic
80.8%
Vietnamese
0.0
/100
|
#287
Tragic
80.8%
Cree
0.0
/100
|
#288
Tragic
80.8%
Immigrants | Bangladesh
0.0
/100
|
#289
Tragic
80.7%
Mexican American Indians
0.0
/100
|
#290
Tragic
80.7%
Immigrants | Belize
0.0
/100
|
#291
Tragic
80.6%
Iroquois
0.0
/100
|
#292
Tragic
80.6%
Osage
0.0
/100
|
#293
Tragic
80.6%
Yakama
0.0
/100
|
#294
Tragic
80.6%

Demographics Similar to Immigrants from Armenia by In Labor Force | Age 45-54

In terms of in labor force | age 45-54, the demographic groups most similar to Immigrants from Armenia are Guamanian/Chamorro (81.6%, a difference of 0.020%), Pennsylvania German (81.6%, a difference of 0.040%), Hmong (81.7%, a difference of 0.050%), Puget Sound Salish (81.7%, a difference of 0.070%), and Japanese (81.6%, a difference of 0.070%).
DemographicsRating | RankIn Labor Force | Age 45-54
Samoans
0.6
/100
|
#243
Tragic
81.8%
Celtics
0.4
/100
|
#244
Tragic
81.8%
Alaska Natives
0.4
/100
|
#245
Tragic
81.8%
Alaskan Athabascans
0.4
/100
|
#246
Tragic
81.8%
Central Americans
0.4
/100
|
#247
Tragic
81.7%
Puget Sound Salish
0.3
/100
|
#248
Tragic
81.7%
Hmong
0.3
/100
|
#249
Tragic
81.7%
Immigrants | Armenia
0.2
/100
|
#250
Tragic
81.7%
Guamanians/Chamorros
0.2
/100
|
#251
Tragic
81.6%
Pennsylvania Germans
0.2
/100
|
#252
Tragic
81.6%
Japanese
0.2
/100
|
#253
Tragic
81.6%
Immigrants | Laos
0.2
/100
|
#254
Tragic
81.6%
Scotch-Irish
0.2
/100
|
#255
Tragic
81.6%
Barbadians
0.1
/100
|
#256
Tragic
81.6%
Immigrants | Congo
0.1
/100
|
#257
Tragic
81.6%