Venezuelan vs Macedonian Female Poverty Among 18-24 Year Olds
COMPARE
Venezuelan
Macedonian
Female Poverty Among 18-24 Year Olds
Female Poverty Among 18-24 Year Olds Comparison
Venezuelans
Macedonians
17.7%
FEMALE POVERTY AMONG 18-24 YEAR OLDS
100.0/ 100
METRIC RATING
28th/ 347
METRIC RANK
18.1%
FEMALE POVERTY AMONG 18-24 YEAR OLDS
100.0/ 100
METRIC RATING
43rd/ 347
METRIC RANK
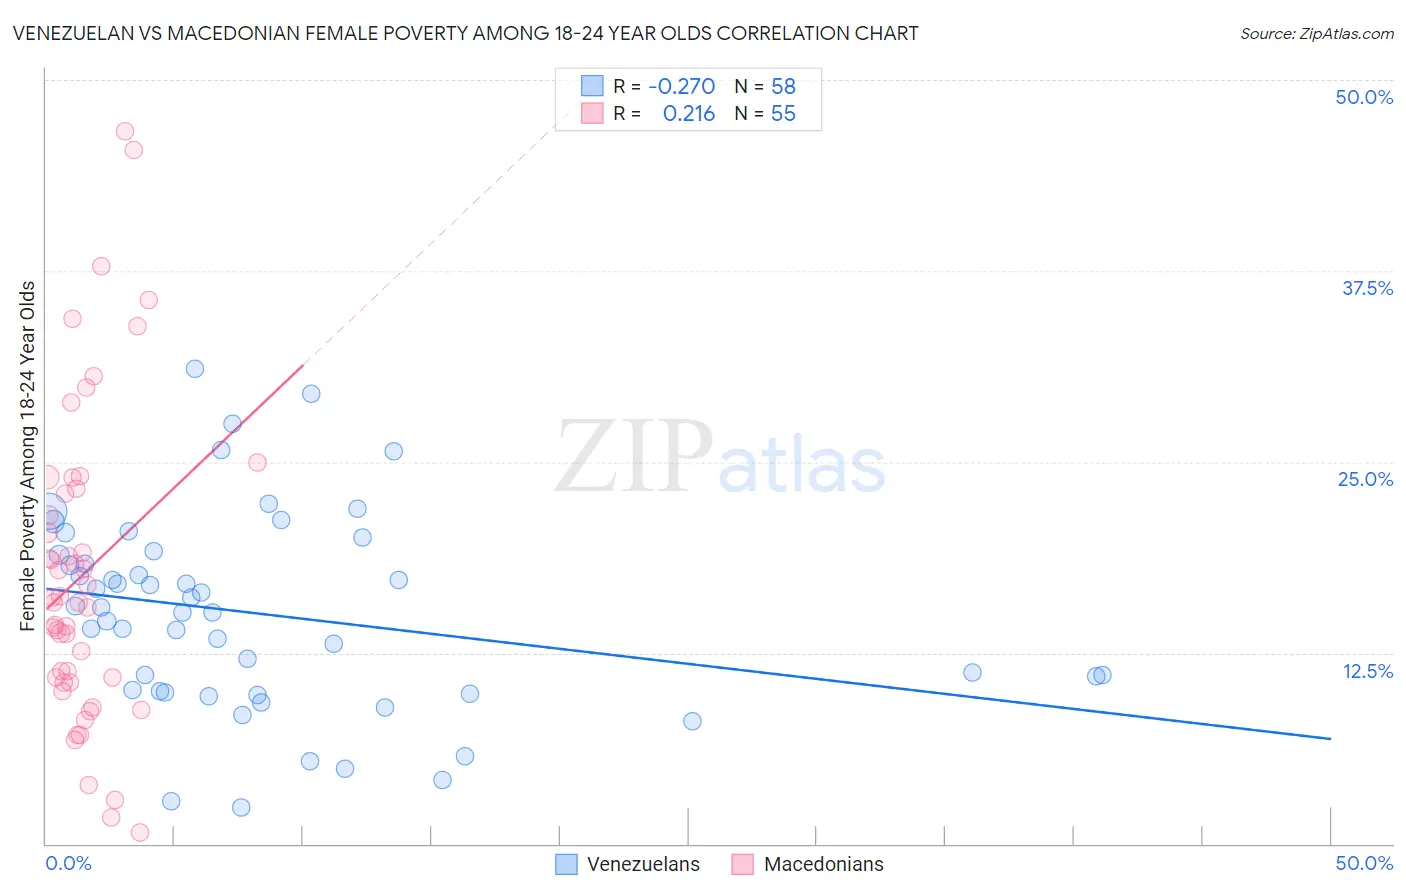
Venezuelan vs Macedonian Female Poverty Among 18-24 Year Olds Correlation Chart
The statistical analysis conducted on geographies consisting of 301,336,833 people shows a weak negative correlation between the proportion of Venezuelans and poverty level among females between the ages 18 and 24 in the United States with a correlation coefficient (R) of -0.270 and weighted average of 17.7%. Similarly, the statistical analysis conducted on geographies consisting of 130,973,657 people shows a weak positive correlation between the proportion of Macedonians and poverty level among females between the ages 18 and 24 in the United States with a correlation coefficient (R) of 0.216 and weighted average of 18.1%, a difference of 2.2%.
Female Poverty Among 18-24 Year Olds Correlation Summary
| Measurement | Venezuelan | Macedonian |
| Minimum | 2.4% | 0.76% |
| Maximum | 31.1% | 46.6% |
| Range | 28.7% | 45.9% |
| Mean | 15.1% | 17.6% |
| Median | 15.3% | 15.8% |
| Interquartile 25% (IQ1) | 9.9% | 10.6% |
| Interquartile 75% (IQ3) | 18.9% | 23.3% |
| Interquartile Range (IQR) | 9.0% | 12.7% |
| Standard Deviation (Sample) | 6.4% | 10.2% |
| Standard Deviation (Population) | 6.4% | 10.1% |
Demographics Similar to Venezuelans and Macedonians by Female Poverty Among 18-24 Year Olds
In terms of female poverty among 18-24 year olds, the demographic groups most similar to Venezuelans are Colombian (17.7%, a difference of 0.14%), Immigrants from Fiji (17.7%, a difference of 0.24%), Portuguese (17.8%, a difference of 0.33%), Immigrants from South Eastern Asia (17.8%, a difference of 0.50%), and Immigrants from South Central Asia (17.6%, a difference of 0.57%). Similarly, the demographic groups most similar to Macedonians are Bulgarian (18.1%, a difference of 0.010%), Nicaraguan (18.1%, a difference of 0.080%), Spanish American Indian (18.1%, a difference of 0.17%), Immigrants from Argentina (18.0%, a difference of 0.48%), and Immigrants from Romania (18.0%, a difference of 0.50%).
| Demographics | Rating | Rank | Female Poverty Among 18-24 Year Olds |
| Immigrants | South Central Asia | 100.0 /100 | #25 | Exceptional 17.6% |
| Immigrants | Fiji | 100.0 /100 | #26 | Exceptional 17.7% |
| Colombians | 100.0 /100 | #27 | Exceptional 17.7% |
| Venezuelans | 100.0 /100 | #28 | Exceptional 17.7% |
| Portuguese | 100.0 /100 | #29 | Exceptional 17.8% |
| Immigrants | South Eastern Asia | 100.0 /100 | #30 | Exceptional 17.8% |
| Immigrants | Vietnam | 100.0 /100 | #31 | Exceptional 17.8% |
| Immigrants | Moldova | 100.0 /100 | #32 | Exceptional 17.9% |
| Native Hawaiians | 100.0 /100 | #33 | Exceptional 17.9% |
| Immigrants | Nicaragua | 100.0 /100 | #34 | Exceptional 17.9% |
| Immigrants | Greece | 100.0 /100 | #35 | Exceptional 17.9% |
| Immigrants | South America | 100.0 /100 | #36 | Exceptional 17.9% |
| Immigrants | Croatia | 100.0 /100 | #37 | Exceptional 17.9% |
| South Americans | 100.0 /100 | #38 | Exceptional 18.0% |
| Puget Sound Salish | 100.0 /100 | #39 | Exceptional 18.0% |
| Immigrants | Romania | 100.0 /100 | #40 | Exceptional 18.0% |
| Immigrants | Argentina | 100.0 /100 | #41 | Exceptional 18.0% |
| Bulgarians | 100.0 /100 | #42 | Exceptional 18.1% |
| Macedonians | 100.0 /100 | #43 | Exceptional 18.1% |
| Nicaraguans | 100.0 /100 | #44 | Exceptional 18.1% |
| Spanish American Indians | 100.0 /100 | #45 | Exceptional 18.1% |