Venezuelan vs Immigrants from Sweden Female Poverty Among 18-24 Year Olds
COMPARE
Venezuelan
Immigrants from Sweden
Female Poverty Among 18-24 Year Olds
Female Poverty Among 18-24 Year Olds Comparison
Venezuelans
Immigrants from Sweden
17.7%
FEMALE POVERTY AMONG 18-24 YEAR OLDS
100.0/ 100
METRIC RATING
28th/ 347
METRIC RANK
20.7%
FEMALE POVERTY AMONG 18-24 YEAR OLDS
6.8/ 100
METRIC RATING
227th/ 347
METRIC RANK
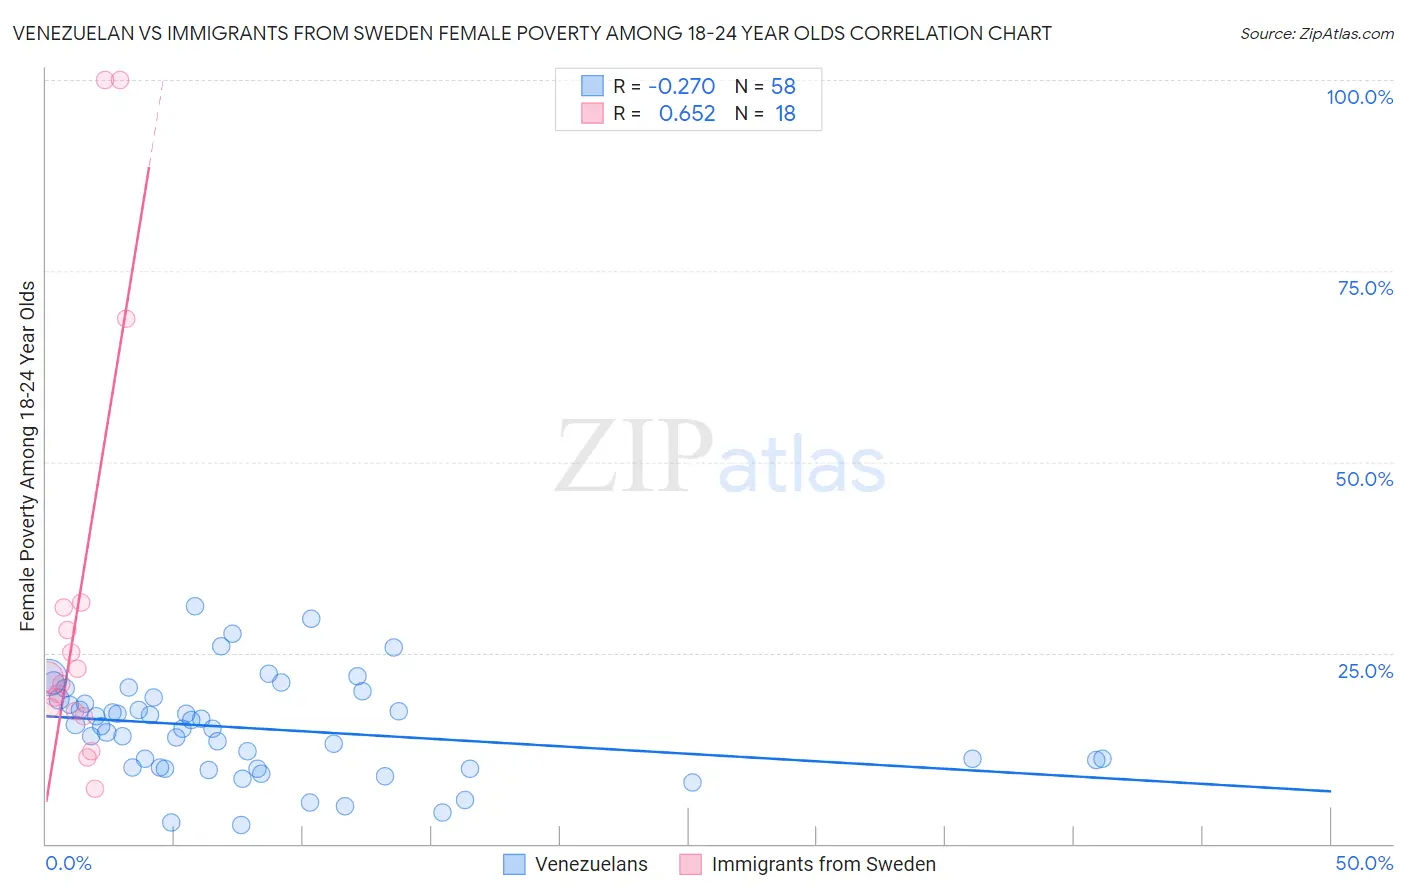
Venezuelan vs Immigrants from Sweden Female Poverty Among 18-24 Year Olds Correlation Chart
The statistical analysis conducted on geographies consisting of 301,336,833 people shows a weak negative correlation between the proportion of Venezuelans and poverty level among females between the ages 18 and 24 in the United States with a correlation coefficient (R) of -0.270 and weighted average of 17.7%. Similarly, the statistical analysis conducted on geographies consisting of 162,147,653 people shows a significant positive correlation between the proportion of Immigrants from Sweden and poverty level among females between the ages 18 and 24 in the United States with a correlation coefficient (R) of 0.652 and weighted average of 20.7%, a difference of 17.2%.
Female Poverty Among 18-24 Year Olds Correlation Summary
| Measurement | Venezuelan | Immigrants from Sweden |
| Minimum | 2.4% | 7.1% |
| Maximum | 31.1% | 100.0% |
| Range | 28.7% | 92.9% |
| Mean | 15.1% | 31.7% |
| Median | 15.3% | 21.3% |
| Interquartile 25% (IQ1) | 9.9% | 17.3% |
| Interquartile 75% (IQ3) | 18.9% | 30.9% |
| Interquartile Range (IQR) | 9.0% | 13.5% |
| Standard Deviation (Sample) | 6.4% | 28.1% |
| Standard Deviation (Population) | 6.4% | 27.3% |
Similar Demographics by Female Poverty Among 18-24 Year Olds
Demographics Similar to Venezuelans by Female Poverty Among 18-24 Year Olds
In terms of female poverty among 18-24 year olds, the demographic groups most similar to Venezuelans are Colombian (17.7%, a difference of 0.14%), Immigrants from Fiji (17.7%, a difference of 0.24%), Portuguese (17.8%, a difference of 0.33%), Immigrants from South Eastern Asia (17.8%, a difference of 0.50%), and Immigrants from South Central Asia (17.6%, a difference of 0.57%).
| Demographics | Rating | Rank | Female Poverty Among 18-24 Year Olds |
| Bolivians | 100.0 /100 | #21 | Exceptional 17.4% |
| Immigrants | Hong Kong | 100.0 /100 | #22 | Exceptional 17.5% |
| Immigrants | North Macedonia | 100.0 /100 | #23 | Exceptional 17.6% |
| Maltese | 100.0 /100 | #24 | Exceptional 17.6% |
| Immigrants | South Central Asia | 100.0 /100 | #25 | Exceptional 17.6% |
| Immigrants | Fiji | 100.0 /100 | #26 | Exceptional 17.7% |
| Colombians | 100.0 /100 | #27 | Exceptional 17.7% |
| Venezuelans | 100.0 /100 | #28 | Exceptional 17.7% |
| Portuguese | 100.0 /100 | #29 | Exceptional 17.8% |
| Immigrants | South Eastern Asia | 100.0 /100 | #30 | Exceptional 17.8% |
| Immigrants | Vietnam | 100.0 /100 | #31 | Exceptional 17.8% |
| Immigrants | Moldova | 100.0 /100 | #32 | Exceptional 17.9% |
| Native Hawaiians | 100.0 /100 | #33 | Exceptional 17.9% |
| Immigrants | Nicaragua | 100.0 /100 | #34 | Exceptional 17.9% |
| Immigrants | Greece | 100.0 /100 | #35 | Exceptional 17.9% |
Demographics Similar to Immigrants from Sweden by Female Poverty Among 18-24 Year Olds
In terms of female poverty among 18-24 year olds, the demographic groups most similar to Immigrants from Sweden are Ghanaian (20.8%, a difference of 0.060%), Estonian (20.7%, a difference of 0.070%), Norwegian (20.7%, a difference of 0.080%), Australian (20.8%, a difference of 0.13%), and White/Caucasian (20.8%, a difference of 0.13%).
| Demographics | Rating | Rank | Female Poverty Among 18-24 Year Olds |
| British | 9.4 /100 | #220 | Tragic 20.7% |
| Barbadians | 9.0 /100 | #221 | Tragic 20.7% |
| Guatemalans | 8.1 /100 | #222 | Tragic 20.7% |
| French | 7.9 /100 | #223 | Tragic 20.7% |
| Immigrants | Liberia | 7.6 /100 | #224 | Tragic 20.7% |
| Norwegians | 7.3 /100 | #225 | Tragic 20.7% |
| Estonians | 7.2 /100 | #226 | Tragic 20.7% |
| Immigrants | Sweden | 6.8 /100 | #227 | Tragic 20.7% |
| Ghanaians | 6.5 /100 | #228 | Tragic 20.8% |
| Australians | 6.1 /100 | #229 | Tragic 20.8% |
| Whites/Caucasians | 6.1 /100 | #230 | Tragic 20.8% |
| Immigrants | St. Vincent and the Grenadines | 6.0 /100 | #231 | Tragic 20.8% |
| Finns | 6.0 /100 | #232 | Tragic 20.8% |
| Immigrants | Denmark | 5.8 /100 | #233 | Tragic 20.8% |
| Welsh | 5.4 /100 | #234 | Tragic 20.8% |