Ute vs Kenyan Single Male Poverty
COMPARE
Ute
Kenyan
Single Male Poverty
Single Male Poverty Comparison
Ute
Kenyans
15.7%
SINGLE MALE POVERTY
0.0/ 100
METRIC RATING
307th/ 347
METRIC RANK
12.4%
SINGLE MALE POVERTY
93.3/ 100
METRIC RATING
112th/ 347
METRIC RANK
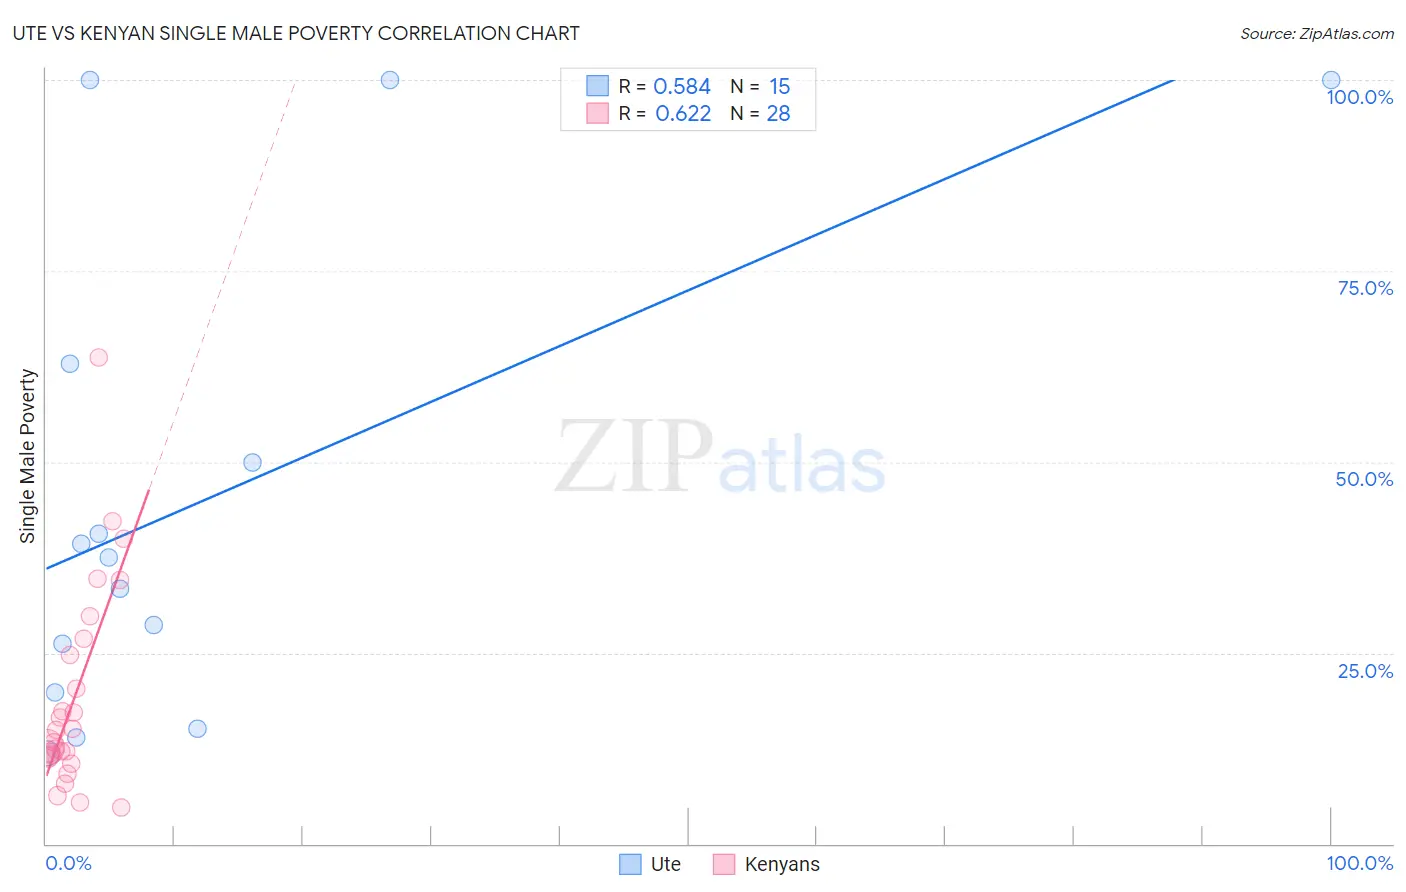
Ute vs Kenyan Single Male Poverty Correlation Chart
The statistical analysis conducted on geographies consisting of 54,243,903 people shows a substantial positive correlation between the proportion of Ute and poverty level among single males in the United States with a correlation coefficient (R) of 0.584 and weighted average of 15.7%. Similarly, the statistical analysis conducted on geographies consisting of 158,530,419 people shows a significant positive correlation between the proportion of Kenyans and poverty level among single males in the United States with a correlation coefficient (R) of 0.622 and weighted average of 12.4%, a difference of 26.9%.
Single Male Poverty Correlation Summary
| Measurement | Ute | Kenyan |
| Minimum | 11.8% | 4.8% |
| Maximum | 100.0% | 63.6% |
| Range | 88.2% | 58.9% |
| Mean | 45.2% | 19.3% |
| Median | 37.4% | 14.0% |
| Interquartile 25% (IQ1) | 19.9% | 11.5% |
| Interquartile 75% (IQ3) | 62.8% | 25.8% |
| Interquartile Range (IQR) | 42.9% | 14.3% |
| Standard Deviation (Sample) | 31.5% | 13.5% |
| Standard Deviation (Population) | 30.4% | 13.3% |
Similar Demographics by Single Male Poverty
Demographics Similar to Ute by Single Male Poverty
In terms of single male poverty, the demographic groups most similar to Ute are Potawatomi (15.8%, a difference of 0.57%), American (15.8%, a difference of 0.73%), Pennsylvania German (15.6%, a difference of 0.75%), Blackfeet (15.5%, a difference of 1.2%), and Yakama (15.9%, a difference of 1.6%).
| Demographics | Rating | Rank | Single Male Poverty |
| Cree | 0.0 /100 | #300 | Tragic 15.1% |
| Dominicans | 0.0 /100 | #301 | Tragic 15.2% |
| Alsatians | 0.0 /100 | #302 | Tragic 15.2% |
| Aleuts | 0.0 /100 | #303 | Tragic 15.4% |
| Alaska Natives | 0.0 /100 | #304 | Tragic 15.4% |
| Blackfeet | 0.0 /100 | #305 | Tragic 15.5% |
| Pennsylvania Germans | 0.0 /100 | #306 | Tragic 15.6% |
| Ute | 0.0 /100 | #307 | Tragic 15.7% |
| Potawatomi | 0.0 /100 | #308 | Tragic 15.8% |
| Americans | 0.0 /100 | #309 | Tragic 15.8% |
| Yakama | 0.0 /100 | #310 | Tragic 15.9% |
| Seminole | 0.0 /100 | #311 | Tragic 16.0% |
| Comanche | 0.0 /100 | #312 | Tragic 16.0% |
| Cherokee | 0.0 /100 | #313 | Tragic 16.1% |
| Alaskan Athabascans | 0.0 /100 | #314 | Tragic 16.1% |
Demographics Similar to Kenyans by Single Male Poverty
In terms of single male poverty, the demographic groups most similar to Kenyans are Immigrants from North Macedonia (12.3%, a difference of 0.060%), Immigrants from Portugal (12.3%, a difference of 0.070%), Pakistani (12.4%, a difference of 0.19%), Nicaraguan (12.4%, a difference of 0.23%), and Ugandan (12.3%, a difference of 0.30%).
| Demographics | Rating | Rank | Single Male Poverty |
| Jordanians | 95.9 /100 | #105 | Exceptional 12.3% |
| Immigrants | Morocco | 95.6 /100 | #106 | Exceptional 12.3% |
| Iraqis | 95.1 /100 | #107 | Exceptional 12.3% |
| Immigrants | Eastern Africa | 95.0 /100 | #108 | Exceptional 12.3% |
| Ugandans | 94.5 /100 | #109 | Exceptional 12.3% |
| Immigrants | Portugal | 93.6 /100 | #110 | Exceptional 12.3% |
| Immigrants | North Macedonia | 93.6 /100 | #111 | Exceptional 12.3% |
| Kenyans | 93.3 /100 | #112 | Exceptional 12.4% |
| Pakistanis | 92.4 /100 | #113 | Exceptional 12.4% |
| Nicaraguans | 92.1 /100 | #114 | Exceptional 12.4% |
| Immigrants | Southern Europe | 91.5 /100 | #115 | Exceptional 12.4% |
| Immigrants | Syria | 91.2 /100 | #116 | Exceptional 12.4% |
| Immigrants | Oceania | 91.1 /100 | #117 | Exceptional 12.4% |
| Albanians | 90.6 /100 | #118 | Exceptional 12.4% |
| Immigrants | Albania | 90.3 /100 | #119 | Exceptional 12.4% |