U.S. Virgin Islander vs Immigrants from Sweden Single Male Poverty

COMPARE

U.S. Virgin Islander
Race
Ancestry
AfghanAfricanAlaska NativeAlaskan AthabascanAlbanianAleutAlsatianAmericanApacheArabArapahoArgentineanArmenianAssyrian/Chaldean/SyriacAustralianAustrianBahamianBangladeshiBarbadianBasqueBelgianBelizeanBermudanBhutaneseBlackfeetBolivianBrazilianBritishBritish West IndianBulgarianBurmeseCajunCambodianCanadianCape VerdeanCarpatho RusynCelticCentral AmericanCentral American IndianCherokeeCheyenneChickasawChileanChineseChippewaChoctawColombianColvilleComancheCosta RicanCreeCreekCroatianCrowCubanCypriotCzechCzechoslovakianDanishDelawareDominicanDutchDutch West IndianEastern EuropeanEcuadorianEgyptianEnglishEstonianEthiopianEuropeanFijianFilipinoFinnishFrenchFrench American IndianFrench CanadianGermanGerman RussianGhanaianGreekGuamanian/ChamorroGuatemalanGuyaneseHaitianHmongHonduranHopiHoumaHungarianIcelanderIndian (Asian)IndonesianInupiatIranianIraqiIrishIroquoisIsraeliItalianJamaicanJapaneseJordanianKenyanKiowaKoreanLaotianLatvianLebaneseLiberianLithuanianLumbeeLuxembourgerMacedonianMalaysianMalteseMarshalleseMenomineeMexicanMexican American IndianMongolianMoroccanNative HawaiianNavajoNepaleseNew ZealanderNicaraguanNigerianNorthern EuropeanNorwegianOkinawanOsageOttawaPaiutePakistaniPalestinianPanamanianParaguayanPennsylvania GermanPeruvianPimaPolishPortuguesePotawatomiPuebloPuerto RicanPuget Sound SalishRomanianRussianSalvadoranSamoanScandinavianScotch-IrishScottishSeminoleSenegaleseSerbianShoshoneSierra LeoneanSiouxSlavicSlovakSloveneSomaliSouth AfricanSouth AmericanSouth American IndianSoviet UnionSpaniardSpanishSpanish AmericanSpanish American IndianSri LankanSubsaharan AfricanSudaneseSwedishSwissSyrianTaiwaneseThaiTlingit-HaidaTohono O'OdhamTonganTrinidadian and TobagonianTsimshianTurkishU.S. Virgin IslanderUgandanUkrainianUruguayanUteVenezuelanVietnameseWelshWest IndianYakamaYaquiYugoslavianYumanYup'ikZimbabwean
Immigration
NonimmigrantsImmigrantsAfghanistanAfricaAlbaniaArgentinaArmeniaAsiaAustraliaAustriaBahamasBangladeshBarbadosBelarusBelgiumBelizeBoliviaBosnia and HerzegovinaBrazilBulgariaBurma/MyanmarCabo VerdeCambodiaCameroonCanadaCaribbeanCentral AmericaChileChinaColombiaCongoCosta RicaCroatiaCubaCzechoslovakiaDenmarkDominicaDominican RepublicEastern AfricaEastern AsiaEastern EuropeEcuadorEgyptEl SalvadorEnglandEritreaEthiopiaEuropeFijiFranceGermanyGhanaGreeceGrenadaGuatemalaGuyanaHaitiHondurasHong KongHungaryIndiaIndonesiaIranIraqIrelandIsraelItalyJamaicaJapanJordanKazakhstanKenyaKoreaKuwaitLaosLatin AmericaLatviaLebanonLiberiaLithuaniaMalaysiaMexicoMicronesiaMiddle AfricaMoldovaMoroccoNepalNetherlandsNicaraguaNigeriaNorth AmericaNorth MacedoniaNorthern AfricaNorthern EuropeNorwayOceaniaPakistanPanamaPeruPhilippinesPolandPortugalRomaniaRussiaSaudi ArabiaScotlandSenegalSerbiaSierra LeoneSingaporeSomaliaSouth AfricaSouth AmericaSouth Central AsiaSouth Eastern AsiaSouthern EuropeSpainSri LankaSt. Vincent and the GrenadinesSudanSwitzerlandSyriaTaiwanThailandTrinidad and TobagoTurkeyUgandaUkraineUruguayUzbekistanVenezuelaVietnamWest IndiesWestern AfricaWestern AsiaWestern EuropeYemenZaireZimbabweAzores
Immigrants from Sweden
Race
Ancestry
AfghanAfricanAlaska NativeAlaskan AthabascanAlbanianAleutAlsatianAmericanApacheArabArapahoArgentineanArmenianAssyrian/Chaldean/SyriacAustralianAustrianBahamianBangladeshiBarbadianBasqueBelgianBelizeanBermudanBhutaneseBlackfeetBolivianBrazilianBritishBritish West IndianBulgarianBurmeseCajunCambodianCanadianCape VerdeanCarpatho RusynCelticCentral AmericanCentral American IndianCherokeeCheyenneChickasawChileanChineseChippewaChoctawColombianColvilleComancheCosta RicanCreeCreekCroatianCrowCubanCypriotCzechCzechoslovakianDanishDelawareDominicanDutchDutch West IndianEastern EuropeanEcuadorianEgyptianEnglishEstonianEthiopianEuropeanFijianFilipinoFinnishFrenchFrench American IndianFrench CanadianGermanGerman RussianGhanaianGreekGuamanian/ChamorroGuatemalanGuyaneseHaitianHmongHonduranHopiHoumaHungarianIcelanderIndian (Asian)IndonesianInupiatIranianIraqiIrishIroquoisIsraeliItalianJamaicanJapaneseJordanianKenyanKiowaKoreanLaotianLatvianLebaneseLiberianLithuanianLumbeeLuxembourgerMacedonianMalaysianMalteseMarshalleseMenomineeMexicanMexican American IndianMongolianMoroccanNative HawaiianNavajoNepaleseNew ZealanderNicaraguanNigerianNorthern EuropeanNorwegianOkinawanOsageOttawaPaiutePakistaniPalestinianPanamanianParaguayanPennsylvania GermanPeruvianPimaPolishPortuguesePotawatomiPuebloPuerto RicanPuget Sound SalishRomanianRussianSalvadoranSamoanScandinavianScotch-IrishScottishSeminoleSenegaleseSerbianShoshoneSierra LeoneanSiouxSlavicSlovakSloveneSomaliSouth AfricanSouth AmericanSouth American IndianSoviet UnionSpaniardSpanishSpanish AmericanSpanish American IndianSri LankanSubsaharan AfricanSudaneseSwedishSwissSyrianTaiwaneseThaiTlingit-HaidaTohono O'OdhamTonganTrinidadian and TobagonianTsimshianTurkishUgandanUkrainianUruguayanUteVenezuelanVietnameseWelshWest IndianYakamaYaquiYugoslavianYumanYup'ikZimbabwean
Immigration
NonimmigrantsImmigrantsAfghanistanAfricaAlbaniaArgentinaArmeniaAsiaAustraliaAustriaBahamasBangladeshBarbadosBelarusBelgiumBelizeBoliviaBosnia and HerzegovinaBrazilBulgariaBurma/MyanmarCabo VerdeCambodiaCameroonCanadaCaribbeanCentral AmericaChileChinaColombiaCongoCosta RicaCroatiaCubaCzechoslovakiaDenmarkDominicaDominican RepublicEastern AfricaEastern AsiaEastern EuropeEcuadorEgyptEl SalvadorEnglandEritreaEthiopiaEuropeFijiFranceGermanyGhanaGreeceGrenadaGuatemalaGuyanaHaitiHondurasHong KongHungaryIndiaIndonesiaIranIraqIrelandIsraelItalyJamaicaJapanJordanKazakhstanKenyaKoreaKuwaitLaosLatin AmericaLatviaLebanonLiberiaLithuaniaMalaysiaMexicoMicronesiaMiddle AfricaMoldovaMoroccoNepalNetherlandsNicaraguaNigeriaNorth AmericaNorth MacedoniaNorthern AfricaNorthern EuropeNorwayOceaniaPakistanPanamaPeruPhilippinesPolandPortugalRomaniaRussiaSaudi ArabiaScotlandSenegalSerbiaSierra LeoneSingaporeSomaliaSouth AfricaSouth AmericaSouth Central AsiaSouth Eastern AsiaSouthern EuropeSpainSri LankaSt. Vincent and the GrenadinesSudanSwedenSwitzerlandSyriaTaiwanThailandTrinidad and TobagoTurkeyUgandaUkraineUruguayUzbekistanVenezuelaVietnamWest IndiesWestern AfricaWestern AsiaWestern EuropeYemenZaireZimbabweAzores
Single Male Poverty
Income
Poverty
Unemployment
Labor Participation
Family Structure
Vehicle Availability
Education Level
Disability

Single Male Poverty Comparison

U.S. Virgin Islanders

Immigrants from Sweden

Tragic
Exceptional
14.5%
SINGLE MALE POVERTY
0.0/ 100
METRIC RATING
290th/ 347
METRIC RANK
12.2%
SINGLE MALE POVERTY
97.5/ 100
METRIC RATING
96th/ 347
METRIC RANK

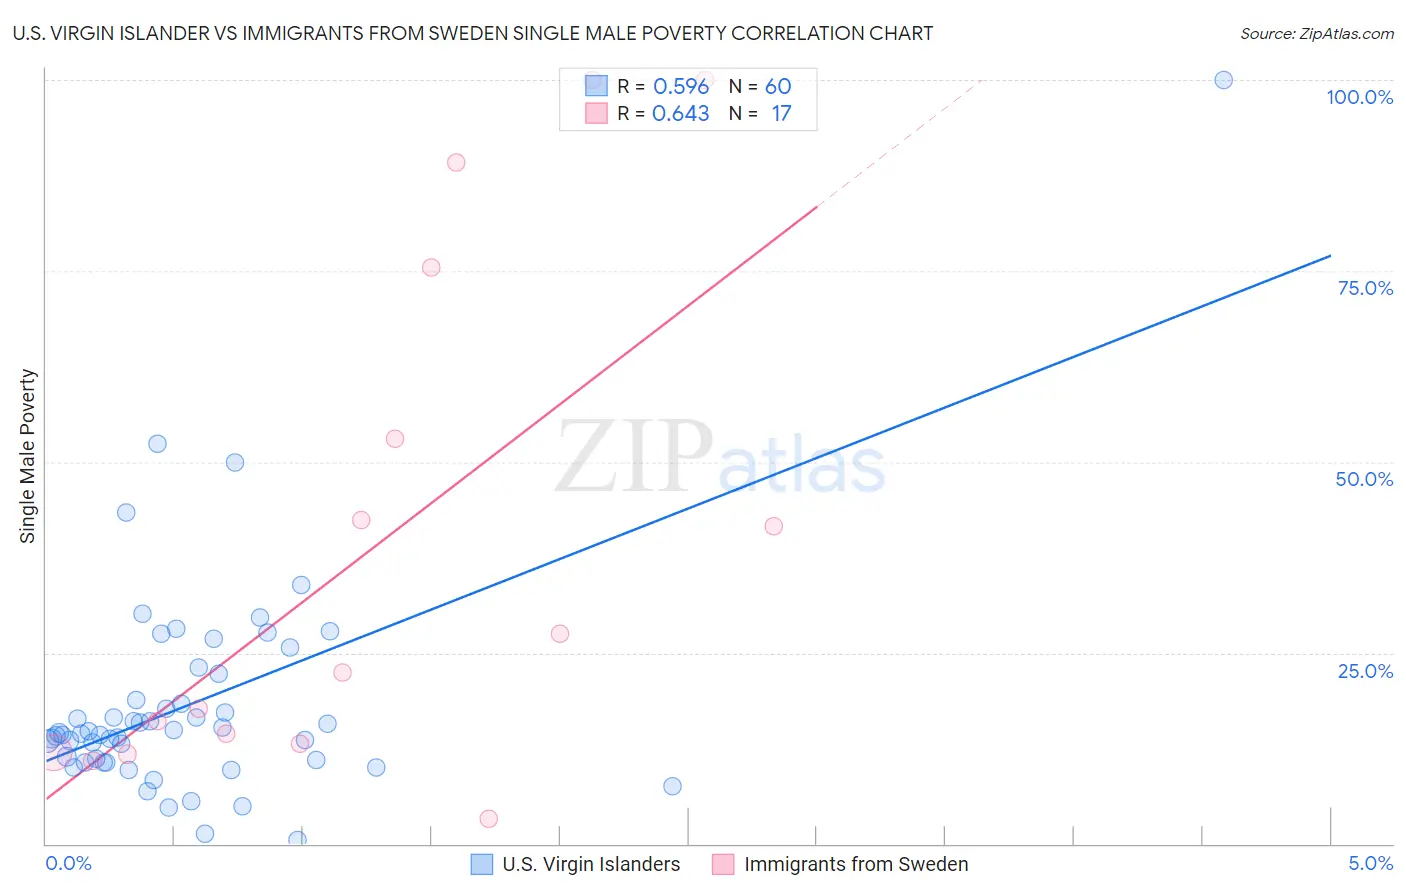
U.S. Virgin Islander vs Immigrants from Sweden Single Male Poverty Correlation Chart

The statistical analysis conducted on geographies consisting of 85,320,269 people shows a substantial positive correlation between the proportion of U.S. Virgin Islanders and poverty level among single males in the United States with a correlation coefficient (R) of 0.596 and weighted average of 14.5%. Similarly, the statistical analysis conducted on geographies consisting of 151,415,814 people shows a significant positive correlation between the proportion of Immigrants from Sweden and poverty level among single males in the United States with a correlation coefficient (R) of 0.643 and weighted average of 12.2%, a difference of 19.3%.
U.S. Virgin Islander vs Immigrants from Sweden Single Male Poverty

Single Male Poverty Correlation Summary

MeasurementU.S. Virgin IslanderImmigrants from Sweden
Minimum0.45%3.3%
Maximum100.0%100.0%
Range99.5%96.7%
Mean18.4%38.3%
Median14.5%22.4%
Interquartile 25% (IQ1)10.8%12.5%
Interquartile 75% (IQ3)20.5%64.3%
Interquartile Range (IQR)9.7%51.7%
Standard Deviation (Sample)14.8%33.3%
Standard Deviation (Population)14.7%32.3%

Similar Demographics by Single Male Poverty

Demographics Similar to U.S. Virgin Islanders by Single Male Poverty

In terms of single male poverty, the demographic groups most similar to U.S. Virgin Islanders are Bahamian (14.6%, a difference of 0.15%), Immigrants from Dominica (14.5%, a difference of 0.23%), Nonimmigrants (14.6%, a difference of 0.28%), White/Caucasian (14.5%, a difference of 0.31%), and Iroquois (14.5%, a difference of 0.32%).
DemographicsRating | RankSingle Male Poverty
Yaqui
0.0
/100
|
#283
Tragic
14.2%
Immigrants | Bahamas
0.0
/100
|
#284
Tragic
14.4%
French
0.0
/100
|
#285
Tragic
14.4%
Celtics
0.0
/100
|
#286
Tragic
14.5%
Iroquois
0.0
/100
|
#287
Tragic
14.5%
Whites/Caucasians
0.0
/100
|
#288
Tragic
14.5%
Immigrants | Dominica
0.0
/100
|
#289
Tragic
14.5%
U.S. Virgin Islanders
0.0
/100
|
#290
Tragic
14.5%
Bahamians
0.0
/100
|
#291
Tragic
14.6%
Immigrants | Nonimmigrants
0.0
/100
|
#292
Tragic
14.6%
French Canadians
0.0
/100
|
#293
Tragic
14.6%
Ottawa
0.0
/100
|
#294
Tragic
14.6%
Scotch-Irish
0.0
/100
|
#295
Tragic
14.7%
Africans
0.0
/100
|
#296
Tragic
14.7%
Immigrants | Dominican Republic
0.0
/100
|
#297
Tragic
14.8%

Demographics Similar to Immigrants from Sweden by Single Male Poverty

In terms of single male poverty, the demographic groups most similar to Immigrants from Sweden are Immigrants from Italy (12.2%, a difference of 0.050%), Guamanian/Chamorro (12.2%, a difference of 0.050%), Immigrants from Cuba (12.2%, a difference of 0.090%), Mongolian (12.2%, a difference of 0.15%), and Colombian (12.2%, a difference of 0.16%).
DemographicsRating | RankSingle Male Poverty
Immigrants | Ireland
98.3
/100
|
#89
Exceptional
12.1%
South American Indians
98.3
/100
|
#90
Exceptional
12.1%
Immigrants | Turkey
98.2
/100
|
#91
Exceptional
12.1%
Spanish American Indians
98.0
/100
|
#92
Exceptional
12.1%
Immigrants | Bosnia and Herzegovina
97.9
/100
|
#93
Exceptional
12.1%
Colombians
97.8
/100
|
#94
Exceptional
12.2%
Mongolians
97.7
/100
|
#95
Exceptional
12.2%
Immigrants | Sweden
97.5
/100
|
#96
Exceptional
12.2%
Immigrants | Italy
97.4
/100
|
#97
Exceptional
12.2%
Guamanians/Chamorros
97.4
/100
|
#98
Exceptional
12.2%
Immigrants | Cuba
97.3
/100
|
#99
Exceptional
12.2%
Immigrants | Australia
97.1
/100
|
#100
Exceptional
12.2%
Immigrants | Latvia
97.0
/100
|
#101
Exceptional
12.2%
Immigrants | Europe
97.0
/100
|
#102
Exceptional
12.2%
Immigrants | Armenia
96.7
/100
|
#103
Exceptional
12.2%