Uruguayan vs Immigrants from Thailand Female Poverty Among 18-24 Year Olds

COMPARE

Uruguayan
Race
Ancestry
AfghanAfricanAlaska NativeAlaskan AthabascanAlbanianAleutAlsatianAmericanApacheArabArapahoArgentineanArmenianAssyrian/Chaldean/SyriacAustralianAustrianBahamianBangladeshiBarbadianBasqueBelgianBelizeanBermudanBhutaneseBlackfeetBolivianBrazilianBritishBritish West IndianBulgarianBurmeseCajunCambodianCanadianCape VerdeanCarpatho RusynCelticCentral AmericanCentral American IndianCherokeeCheyenneChickasawChileanChineseChippewaChoctawColombianColvilleComancheCosta RicanCreeCreekCroatianCrowCubanCypriotCzechCzechoslovakianDanishDelawareDominicanDutchDutch West IndianEastern EuropeanEcuadorianEgyptianEnglishEstonianEthiopianEuropeanFijianFilipinoFinnishFrenchFrench American IndianFrench CanadianGermanGerman RussianGhanaianGreekGuamanian/ChamorroGuatemalanGuyaneseHaitianHmongHonduranHopiHoumaHungarianIcelanderIndian (Asian)IndonesianInupiatIranianIraqiIrishIroquoisIsraeliItalianJamaicanJapaneseJordanianKenyanKiowaKoreanLaotianLatvianLebaneseLiberianLithuanianLumbeeLuxembourgerMacedonianMalaysianMalteseMarshalleseMenomineeMexicanMexican American IndianMongolianMoroccanNative HawaiianNavajoNepaleseNew ZealanderNicaraguanNigerianNorthern EuropeanNorwegianOkinawanOsageOttawaPaiutePakistaniPalestinianPanamanianParaguayanPennsylvania GermanPeruvianPimaPolishPortuguesePotawatomiPuebloPuerto RicanPuget Sound SalishRomanianRussianSalvadoranSamoanScandinavianScotch-IrishScottishSeminoleSenegaleseSerbianShoshoneSierra LeoneanSiouxSlavicSlovakSloveneSomaliSouth AfricanSouth AmericanSouth American IndianSoviet UnionSpaniardSpanishSpanish AmericanSpanish American IndianSri LankanSubsaharan AfricanSudaneseSwedishSwissSyrianTaiwaneseThaiTlingit-HaidaTohono O'OdhamTonganTrinidadian and TobagonianTsimshianTurkishU.S. Virgin IslanderUgandanUkrainianUruguayanUteVenezuelanVietnameseWelshWest IndianYakamaYaquiYugoslavianYumanYup'ikZimbabwean
Immigration
NonimmigrantsImmigrantsAfghanistanAfricaAlbaniaArgentinaArmeniaAsiaAustraliaAustriaBahamasBangladeshBarbadosBelarusBelgiumBelizeBoliviaBosnia and HerzegovinaBrazilBulgariaBurma/MyanmarCabo VerdeCambodiaCameroonCanadaCaribbeanCentral AmericaChileChinaColombiaCongoCosta RicaCroatiaCubaCzechoslovakiaDenmarkDominicaDominican RepublicEastern AfricaEastern AsiaEastern EuropeEcuadorEgyptEl SalvadorEnglandEritreaEthiopiaEuropeFijiFranceGermanyGhanaGreeceGrenadaGuatemalaGuyanaHaitiHondurasHong KongHungaryIndiaIndonesiaIranIraqIrelandIsraelItalyJamaicaJapanJordanKazakhstanKenyaKoreaKuwaitLaosLatin AmericaLatviaLebanonLiberiaLithuaniaMalaysiaMexicoMicronesiaMiddle AfricaMoldovaMoroccoNepalNetherlandsNicaraguaNigeriaNorth AmericaNorth MacedoniaNorthern AfricaNorthern EuropeNorwayOceaniaPakistanPanamaPeruPhilippinesPolandPortugalRomaniaRussiaSaudi ArabiaScotlandSenegalSerbiaSierra LeoneSingaporeSomaliaSouth AfricaSouth AmericaSouth Central AsiaSouth Eastern AsiaSouthern EuropeSpainSri LankaSt. Vincent and the GrenadinesSudanSwedenSwitzerlandSyriaTaiwanTrinidad and TobagoTurkeyUgandaUkraineUruguayUzbekistanVenezuelaVietnamWest IndiesWestern AfricaWestern AsiaWestern EuropeYemenZaireZimbabweAzores
Immigrants from Thailand
Race
Ancestry
AfghanAfricanAlaska NativeAlaskan AthabascanAlbanianAleutAlsatianAmericanApacheArabArapahoArgentineanArmenianAssyrian/Chaldean/SyriacAustralianAustrianBahamianBangladeshiBarbadianBasqueBelgianBelizeanBermudanBhutaneseBlackfeetBolivianBrazilianBritishBritish West IndianBulgarianBurmeseCajunCambodianCanadianCape VerdeanCarpatho RusynCelticCentral AmericanCentral American IndianCherokeeCheyenneChickasawChileanChineseChippewaChoctawColombianColvilleComancheCosta RicanCreeCreekCroatianCrowCubanCypriotCzechCzechoslovakianDanishDelawareDominicanDutchDutch West IndianEastern EuropeanEcuadorianEgyptianEnglishEstonianEthiopianEuropeanFijianFilipinoFinnishFrenchFrench American IndianFrench CanadianGermanGerman RussianGhanaianGreekGuamanian/ChamorroGuatemalanGuyaneseHaitianHmongHonduranHopiHoumaHungarianIcelanderIndian (Asian)IndonesianInupiatIranianIraqiIrishIroquoisIsraeliItalianJamaicanJapaneseJordanianKenyanKiowaKoreanLaotianLatvianLebaneseLiberianLithuanianLumbeeLuxembourgerMacedonianMalaysianMalteseMarshalleseMenomineeMexicanMexican American IndianMongolianMoroccanNative HawaiianNavajoNepaleseNew ZealanderNicaraguanNigerianNorthern EuropeanNorwegianOkinawanOsageOttawaPaiutePakistaniPalestinianPanamanianParaguayanPennsylvania GermanPeruvianPimaPolishPortuguesePotawatomiPuebloPuerto RicanPuget Sound SalishRomanianRussianSalvadoranSamoanScandinavianScotch-IrishScottishSeminoleSenegaleseSerbianShoshoneSierra LeoneanSiouxSlavicSlovakSloveneSomaliSouth AfricanSouth AmericanSouth American IndianSoviet UnionSpaniardSpanishSpanish AmericanSpanish American IndianSri LankanSubsaharan AfricanSudaneseSwedishSwissSyrianTaiwaneseThaiTlingit-HaidaTohono O'OdhamTonganTrinidadian and TobagonianTsimshianTurkishU.S. Virgin IslanderUgandanUkrainianUteVenezuelanVietnameseWelshWest IndianYakamaYaquiYugoslavianYumanYup'ikZimbabwean
Immigration
NonimmigrantsImmigrantsAfghanistanAfricaAlbaniaArgentinaArmeniaAsiaAustraliaAustriaBahamasBangladeshBarbadosBelarusBelgiumBelizeBoliviaBosnia and HerzegovinaBrazilBulgariaBurma/MyanmarCabo VerdeCambodiaCameroonCanadaCaribbeanCentral AmericaChileChinaColombiaCongoCosta RicaCroatiaCubaCzechoslovakiaDenmarkDominicaDominican RepublicEastern AfricaEastern AsiaEastern EuropeEcuadorEgyptEl SalvadorEnglandEritreaEthiopiaEuropeFijiFranceGermanyGhanaGreeceGrenadaGuatemalaGuyanaHaitiHondurasHong KongHungaryIndiaIndonesiaIranIraqIrelandIsraelItalyJamaicaJapanJordanKazakhstanKenyaKoreaKuwaitLaosLatin AmericaLatviaLebanonLiberiaLithuaniaMalaysiaMexicoMicronesiaMiddle AfricaMoldovaMoroccoNepalNetherlandsNicaraguaNigeriaNorth AmericaNorth MacedoniaNorthern AfricaNorthern EuropeNorwayOceaniaPakistanPanamaPeruPhilippinesPolandPortugalRomaniaRussiaSaudi ArabiaScotlandSenegalSerbiaSierra LeoneSingaporeSomaliaSouth AfricaSouth AmericaSouth Central AsiaSouth Eastern AsiaSouthern EuropeSpainSri LankaSt. Vincent and the GrenadinesSudanSwedenSwitzerlandSyriaTaiwanThailandTrinidad and TobagoTurkeyUgandaUkraineUruguayUzbekistanVenezuelaVietnamWest IndiesWestern AfricaWestern AsiaWestern EuropeYemenZaireZimbabweAzores
Female Poverty Among 18-24 Year Olds
Income
Poverty
Unemployment
Labor Participation
Family Structure
Vehicle Availability
Education Level
Disability

Female Poverty Among 18-24 Year Olds Comparison

Uruguayans

Immigrants from Thailand

Exceptional
Tragic
18.8%
FEMALE POVERTY AMONG 18-24 YEAR OLDS
99.5/ 100
METRIC RATING
79th/ 347
METRIC RANK
20.9%
FEMALE POVERTY AMONG 18-24 YEAR OLDS
3.4/ 100
METRIC RATING
244th/ 347
METRIC RANK

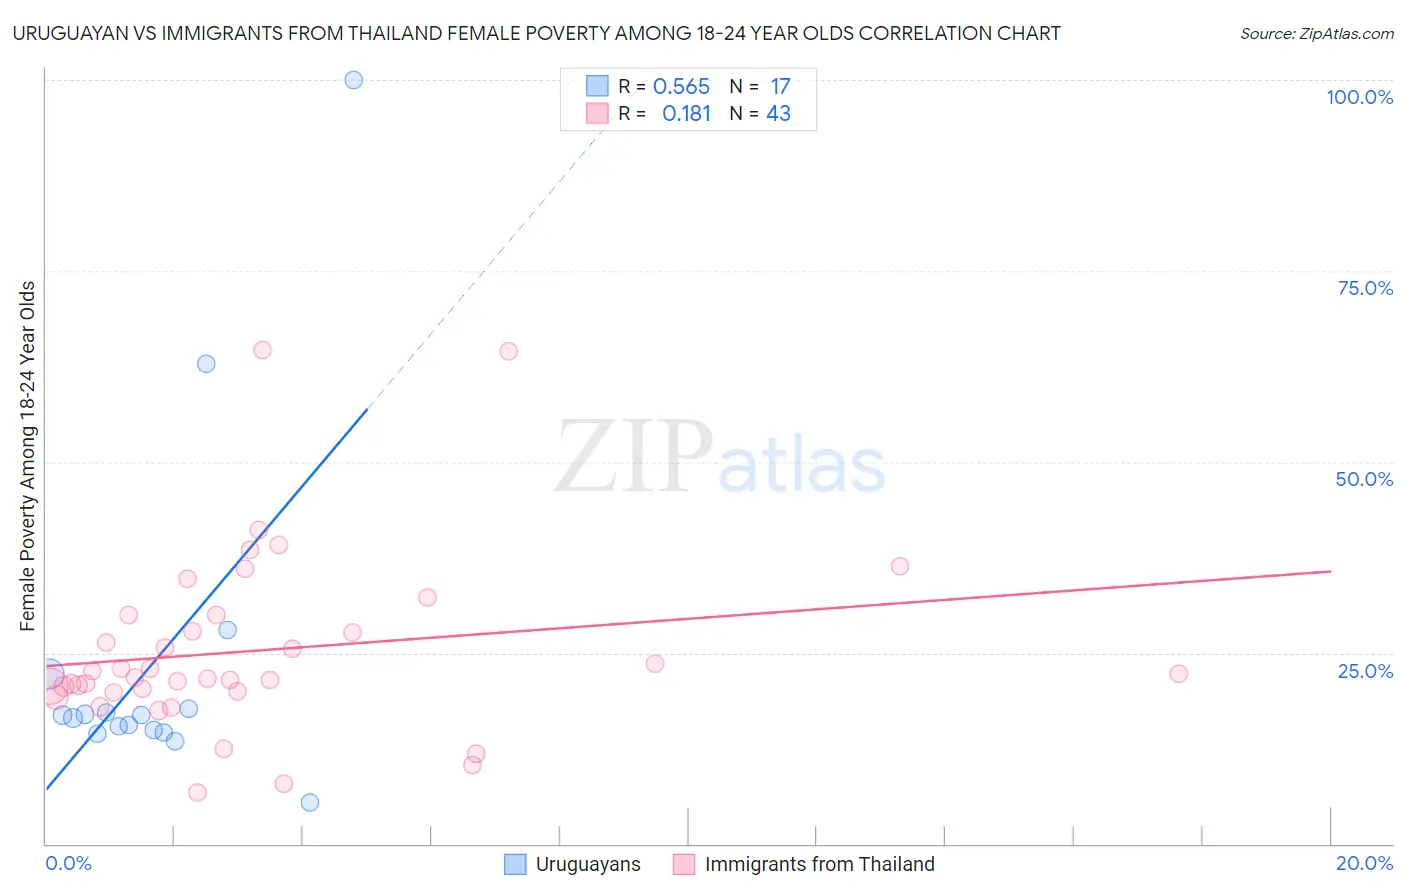
Uruguayan vs Immigrants from Thailand Female Poverty Among 18-24 Year Olds Correlation Chart

The statistical analysis conducted on geographies consisting of 143,433,790 people shows a substantial positive correlation between the proportion of Uruguayans and poverty level among females between the ages 18 and 24 in the United States with a correlation coefficient (R) of 0.565 and weighted average of 18.8%. Similarly, the statistical analysis conducted on geographies consisting of 312,185,716 people shows a poor positive correlation between the proportion of Immigrants from Thailand and poverty level among females between the ages 18 and 24 in the United States with a correlation coefficient (R) of 0.181 and weighted average of 20.9%, a difference of 11.3%.
Uruguayan vs Immigrants from Thailand Female Poverty Among 18-24 Year Olds

Female Poverty Among 18-24 Year Olds Correlation Summary

MeasurementUruguayanImmigrants from Thailand
Minimum5.4%6.8%
Maximum100.0%64.6%
Range94.6%57.9%
Mean24.0%25.3%
Median16.9%21.8%
Interquartile 25% (IQ1)14.7%19.9%
Interquartile 75% (IQ3)19.9%29.9%
Interquartile Range (IQR)5.2%10.0%
Standard Deviation (Sample)23.0%11.8%
Standard Deviation (Population)22.3%11.7%

Similar Demographics by Female Poverty Among 18-24 Year Olds

Demographics Similar to Uruguayans by Female Poverty Among 18-24 Year Olds

In terms of female poverty among 18-24 year olds, the demographic groups most similar to Uruguayans are Immigrants from Europe (18.8%, a difference of 0.0%), Costa Rican (18.8%, a difference of 0.010%), Palestinian (18.8%, a difference of 0.080%), Japanese (18.8%, a difference of 0.080%), and Immigrants from Cambodia (18.8%, a difference of 0.11%).
DemographicsRating | RankFemale Poverty Among 18-24 Year Olds
Armenians
99.7
/100
|
#72
Exceptional
18.7%
Lithuanians
99.7
/100
|
#73
Exceptional
18.7%
Hawaiians
99.6
/100
|
#74
Exceptional
18.7%
Poles
99.6
/100
|
#75
Exceptional
18.8%
Immigrants | Cambodia
99.5
/100
|
#76
Exceptional
18.8%
Costa Ricans
99.5
/100
|
#77
Exceptional
18.8%
Immigrants | Europe
99.5
/100
|
#78
Exceptional
18.8%
Uruguayans
99.5
/100
|
#79
Exceptional
18.8%
Palestinians
99.5
/100
|
#80
Exceptional
18.8%
Japanese
99.5
/100
|
#81
Exceptional
18.8%
Immigrants | Uruguay
99.4
/100
|
#82
Exceptional
18.8%
Immigrants | Indonesia
99.4
/100
|
#83
Exceptional
18.9%
Burmese
99.2
/100
|
#84
Exceptional
18.9%
Immigrants | Armenia
99.2
/100
|
#85
Exceptional
18.9%
Immigrants | Iraq
99.2
/100
|
#86
Exceptional
18.9%

Demographics Similar to Immigrants from Thailand by Female Poverty Among 18-24 Year Olds

In terms of female poverty among 18-24 year olds, the demographic groups most similar to Immigrants from Thailand are Marshallese (20.9%, a difference of 0.010%), Aleut (20.9%, a difference of 0.030%), Immigrants from Australia (20.9%, a difference of 0.11%), Immigrants from Africa (21.0%, a difference of 0.17%), and Israeli (20.9%, a difference of 0.24%).
DemographicsRating | RankFemale Poverty Among 18-24 Year Olds
Scottish
4.5
/100
|
#237
Tragic
20.9%
Immigrants | Singapore
4.4
/100
|
#238
Tragic
20.9%
Immigrants | Guatemala
4.3
/100
|
#239
Tragic
20.9%
Luxembourgers
4.2
/100
|
#240
Tragic
20.9%
Immigrants | Eritrea
4.2
/100
|
#241
Tragic
20.9%
Israelis
4.1
/100
|
#242
Tragic
20.9%
Marshallese
3.4
/100
|
#243
Tragic
20.9%
Immigrants | Thailand
3.4
/100
|
#244
Tragic
20.9%
Aleuts
3.3
/100
|
#245
Tragic
20.9%
Immigrants | Australia
3.1
/100
|
#246
Tragic
20.9%
Immigrants | Africa
3.0
/100
|
#247
Tragic
21.0%
Immigrants | Kenya
2.5
/100
|
#248
Tragic
21.0%
Carpatho Rusyns
2.5
/100
|
#249
Tragic
21.0%
Immigrants | West Indies
2.2
/100
|
#250
Tragic
21.0%
West Indians
1.9
/100
|
#251
Tragic
21.1%