Ukrainian vs Dutch Female Poverty Among 25-34 Year Olds
COMPARE
Ukrainian
Dutch
Female Poverty Among 25-34 Year Olds
Female Poverty Among 25-34 Year Olds Comparison
Ukrainians
Dutch
12.6%
FEMALE POVERTY AMONG 25-34 YEAR OLDS
96.7/ 100
METRIC RATING
95th/ 347
METRIC RANK
13.8%
FEMALE POVERTY AMONG 25-34 YEAR OLDS
29.7/ 100
METRIC RATING
190th/ 347
METRIC RANK
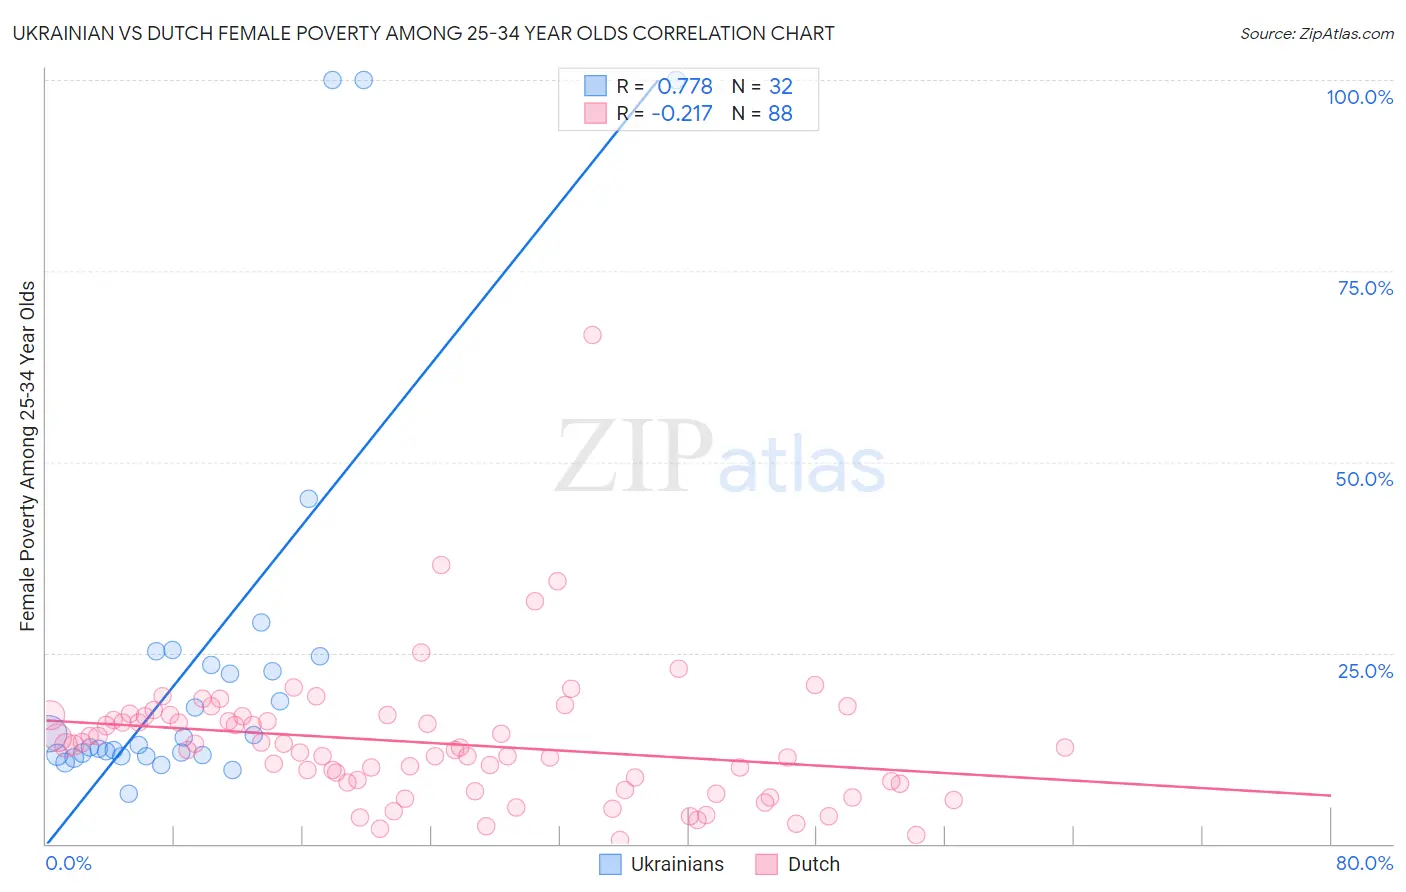
Ukrainian vs Dutch Female Poverty Among 25-34 Year Olds Correlation Chart
The statistical analysis conducted on geographies consisting of 437,000,334 people shows a strong positive correlation between the proportion of Ukrainians and poverty level among females between the ages 25 and 34 in the United States with a correlation coefficient (R) of 0.778 and weighted average of 12.6%. Similarly, the statistical analysis conducted on geographies consisting of 534,381,928 people shows a weak negative correlation between the proportion of Dutch and poverty level among females between the ages 25 and 34 in the United States with a correlation coefficient (R) of -0.217 and weighted average of 13.8%, a difference of 9.5%.
Female Poverty Among 25-34 Year Olds Correlation Summary
| Measurement | Ukrainian | Dutch |
| Minimum | 6.6% | 0.50% |
| Maximum | 100.0% | 66.7% |
| Range | 93.4% | 66.2% |
| Mean | 24.3% | 13.2% |
| Median | 13.4% | 12.7% |
| Interquartile 25% (IQ1) | 11.6% | 7.9% |
| Interquartile 75% (IQ3) | 24.0% | 16.7% |
| Interquartile Range (IQR) | 12.3% | 8.8% |
| Standard Deviation (Sample) | 25.9% | 8.9% |
| Standard Deviation (Population) | 25.5% | 8.9% |
Similar Demographics by Female Poverty Among 25-34 Year Olds
Demographics Similar to Ukrainians by Female Poverty Among 25-34 Year Olds
In terms of female poverty among 25-34 year olds, the demographic groups most similar to Ukrainians are Immigrants from Zimbabwe (12.6%, a difference of 0.010%), Immigrants from France (12.6%, a difference of 0.040%), Palestinian (12.6%, a difference of 0.090%), Immigrants from Armenia (12.6%, a difference of 0.12%), and Norwegian (12.6%, a difference of 0.13%).
| Demographics | Rating | Rank | Female Poverty Among 25-34 Year Olds |
| Immigrants | Austria | 97.4 /100 | #88 | Exceptional 12.5% |
| Italians | 97.2 /100 | #89 | Exceptional 12.5% |
| Immigrants | Albania | 97.1 /100 | #90 | Exceptional 12.5% |
| Norwegians | 96.9 /100 | #91 | Exceptional 12.6% |
| Immigrants | Armenia | 96.9 /100 | #92 | Exceptional 12.6% |
| Palestinians | 96.9 /100 | #93 | Exceptional 12.6% |
| Immigrants | France | 96.8 /100 | #94 | Exceptional 12.6% |
| Ukrainians | 96.7 /100 | #95 | Exceptional 12.6% |
| Immigrants | Zimbabwe | 96.7 /100 | #96 | Exceptional 12.6% |
| Immigrants | Northern Africa | 96.6 /100 | #97 | Exceptional 12.6% |
| Immigrants | Ethiopia | 96.5 /100 | #98 | Exceptional 12.6% |
| Immigrants | Argentina | 96.4 /100 | #99 | Exceptional 12.6% |
| Immigrants | Denmark | 95.7 /100 | #100 | Exceptional 12.7% |
| Immigrants | Switzerland | 95.7 /100 | #101 | Exceptional 12.7% |
| Peruvians | 95.6 /100 | #102 | Exceptional 12.7% |
Demographics Similar to Dutch by Female Poverty Among 25-34 Year Olds
In terms of female poverty among 25-34 year olds, the demographic groups most similar to Dutch are Immigrants from St. Vincent and the Grenadines (13.8%, a difference of 0.040%), Tlingit-Haida (13.8%, a difference of 0.16%), Immigrants from Kenya (13.8%, a difference of 0.17%), Finnish (13.7%, a difference of 0.26%), and Immigrants from Eritrea (13.7%, a difference of 0.28%).
| Demographics | Rating | Rank | Female Poverty Among 25-34 Year Olds |
| Portuguese | 40.3 /100 | #183 | Average 13.6% |
| Czechoslovakians | 36.8 /100 | #184 | Fair 13.7% |
| Irish | 35.3 /100 | #185 | Fair 13.7% |
| Immigrants | Uruguay | 34.1 /100 | #186 | Fair 13.7% |
| Slovaks | 34.1 /100 | #187 | Fair 13.7% |
| Immigrants | Eritrea | 32.7 /100 | #188 | Fair 13.7% |
| Finns | 32.5 /100 | #189 | Fair 13.7% |
| Dutch | 29.7 /100 | #190 | Fair 13.8% |
| Immigrants | St. Vincent and the Grenadines | 29.3 /100 | #191 | Fair 13.8% |
| Tlingit-Haida | 28.1 /100 | #192 | Fair 13.8% |
| Immigrants | Kenya | 28.0 /100 | #193 | Fair 13.8% |
| Moroccans | 25.1 /100 | #194 | Fair 13.8% |
| Immigrants | Cambodia | 24.0 /100 | #195 | Fair 13.9% |
| Scottish | 23.6 /100 | #196 | Fair 13.9% |
| Immigrants | Saudi Arabia | 21.9 /100 | #197 | Fair 13.9% |