Ukrainian vs Cajun Female Poverty Among 25-34 Year Olds
COMPARE
Ukrainian
Cajun
Female Poverty Among 25-34 Year Olds
Female Poverty Among 25-34 Year Olds Comparison
Ukrainians
Cajuns
12.6%
FEMALE POVERTY AMONG 25-34 YEAR OLDS
96.7/ 100
METRIC RATING
95th/ 347
METRIC RANK
19.9%
FEMALE POVERTY AMONG 25-34 YEAR OLDS
0.0/ 100
METRIC RATING
333rd/ 347
METRIC RANK
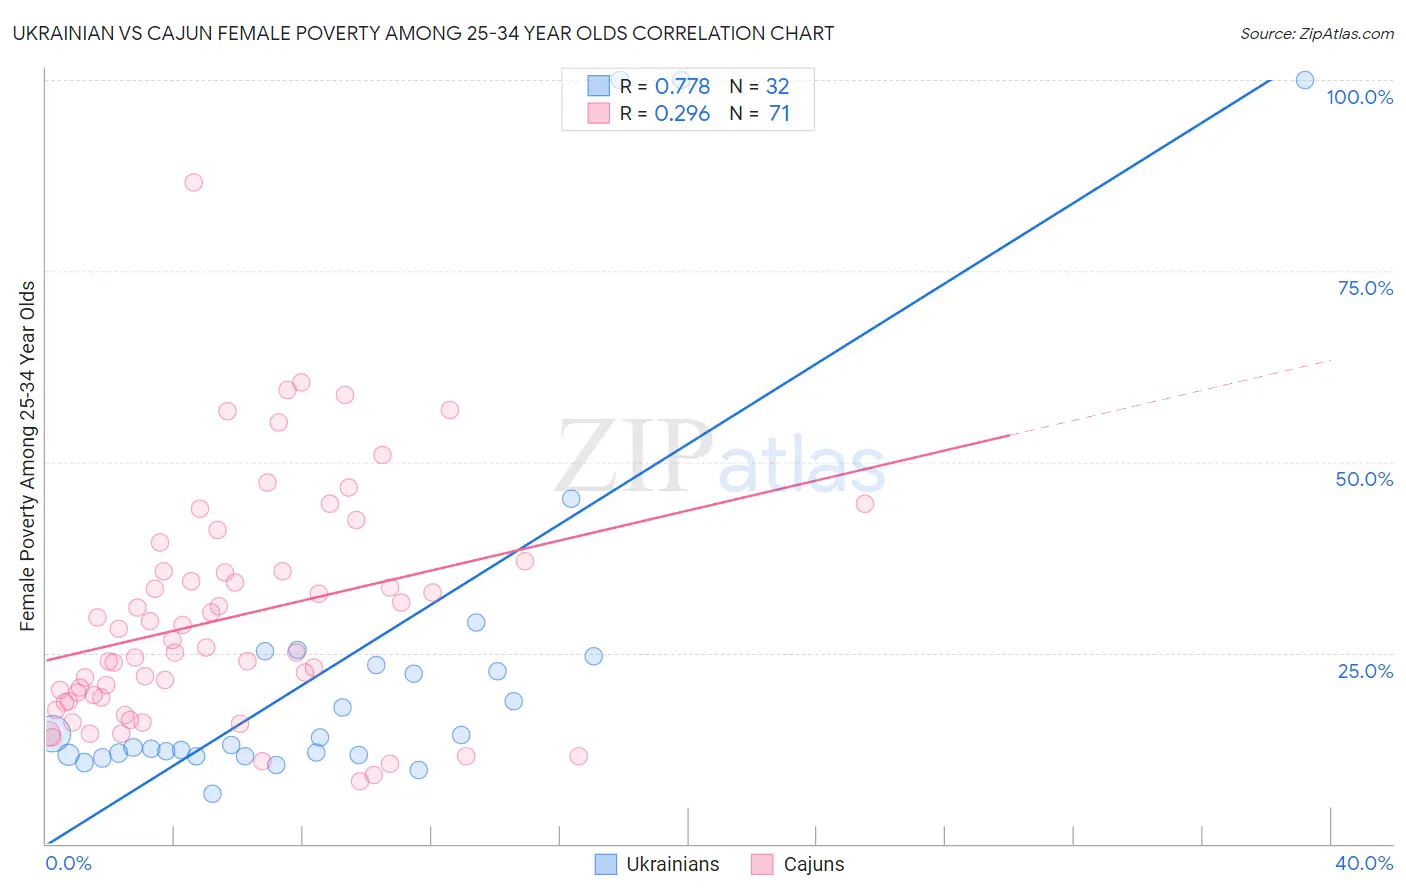
Ukrainian vs Cajun Female Poverty Among 25-34 Year Olds Correlation Chart
The statistical analysis conducted on geographies consisting of 437,000,334 people shows a strong positive correlation between the proportion of Ukrainians and poverty level among females between the ages 25 and 34 in the United States with a correlation coefficient (R) of 0.778 and weighted average of 12.6%. Similarly, the statistical analysis conducted on geographies consisting of 148,590,525 people shows a weak positive correlation between the proportion of Cajuns and poverty level among females between the ages 25 and 34 in the United States with a correlation coefficient (R) of 0.296 and weighted average of 19.9%, a difference of 58.5%.
Female Poverty Among 25-34 Year Olds Correlation Summary
| Measurement | Ukrainian | Cajun |
| Minimum | 6.6% | 8.2% |
| Maximum | 100.0% | 86.6% |
| Range | 93.4% | 78.4% |
| Mean | 24.3% | 29.6% |
| Median | 13.4% | 25.7% |
| Interquartile 25% (IQ1) | 11.6% | 18.6% |
| Interquartile 75% (IQ3) | 24.0% | 35.7% |
| Interquartile Range (IQR) | 12.3% | 17.1% |
| Standard Deviation (Sample) | 25.9% | 15.1% |
| Standard Deviation (Population) | 25.5% | 15.0% |
Similar Demographics by Female Poverty Among 25-34 Year Olds
Demographics Similar to Ukrainians by Female Poverty Among 25-34 Year Olds
In terms of female poverty among 25-34 year olds, the demographic groups most similar to Ukrainians are Immigrants from Zimbabwe (12.6%, a difference of 0.010%), Immigrants from France (12.6%, a difference of 0.040%), Palestinian (12.6%, a difference of 0.090%), Immigrants from Armenia (12.6%, a difference of 0.12%), and Norwegian (12.6%, a difference of 0.13%).
| Demographics | Rating | Rank | Female Poverty Among 25-34 Year Olds |
| Immigrants | Austria | 97.4 /100 | #88 | Exceptional 12.5% |
| Italians | 97.2 /100 | #89 | Exceptional 12.5% |
| Immigrants | Albania | 97.1 /100 | #90 | Exceptional 12.5% |
| Norwegians | 96.9 /100 | #91 | Exceptional 12.6% |
| Immigrants | Armenia | 96.9 /100 | #92 | Exceptional 12.6% |
| Palestinians | 96.9 /100 | #93 | Exceptional 12.6% |
| Immigrants | France | 96.8 /100 | #94 | Exceptional 12.6% |
| Ukrainians | 96.7 /100 | #95 | Exceptional 12.6% |
| Immigrants | Zimbabwe | 96.7 /100 | #96 | Exceptional 12.6% |
| Immigrants | Northern Africa | 96.6 /100 | #97 | Exceptional 12.6% |
| Immigrants | Ethiopia | 96.5 /100 | #98 | Exceptional 12.6% |
| Immigrants | Argentina | 96.4 /100 | #99 | Exceptional 12.6% |
| Immigrants | Denmark | 95.7 /100 | #100 | Exceptional 12.7% |
| Immigrants | Switzerland | 95.7 /100 | #101 | Exceptional 12.7% |
| Peruvians | 95.6 /100 | #102 | Exceptional 12.7% |
Demographics Similar to Cajuns by Female Poverty Among 25-34 Year Olds
In terms of female poverty among 25-34 year olds, the demographic groups most similar to Cajuns are Apache (20.1%, a difference of 0.68%), Immigrants from Yemen (19.8%, a difference of 0.80%), Kiowa (19.7%, a difference of 1.4%), Native/Alaskan (20.3%, a difference of 1.8%), and Paiute (19.6%, a difference of 1.8%).
| Demographics | Rating | Rank | Female Poverty Among 25-34 Year Olds |
| Blacks/African Americans | 0.0 /100 | #326 | Tragic 18.9% |
| Cheyenne | 0.0 /100 | #327 | Tragic 19.1% |
| Alaskan Athabascans | 0.0 /100 | #328 | Tragic 19.1% |
| Creek | 0.0 /100 | #329 | Tragic 19.2% |
| Paiute | 0.0 /100 | #330 | Tragic 19.6% |
| Kiowa | 0.0 /100 | #331 | Tragic 19.7% |
| Immigrants | Yemen | 0.0 /100 | #332 | Tragic 19.8% |
| Cajuns | 0.0 /100 | #333 | Tragic 19.9% |
| Apache | 0.0 /100 | #334 | Tragic 20.1% |
| Natives/Alaskans | 0.0 /100 | #335 | Tragic 20.3% |
| Pueblo | 0.0 /100 | #336 | Tragic 22.2% |
| Crow | 0.0 /100 | #337 | Tragic 22.7% |
| Houma | 0.0 /100 | #338 | Tragic 22.7% |
| Yuman | 0.0 /100 | #339 | Tragic 22.9% |
| Sioux | 0.0 /100 | #340 | Tragic 23.0% |