Ugandan vs Immigrants from Venezuela Female Poverty
COMPARE
Ugandan
Immigrants from Venezuela
Female Poverty
Female Poverty Comparison
Ugandans
Immigrants from Venezuela
14.0%
FEMALE POVERTY
15.4/ 100
METRIC RATING
205th/ 347
METRIC RANK
13.6%
FEMALE POVERTY
41.0/ 100
METRIC RATING
187th/ 347
METRIC RANK
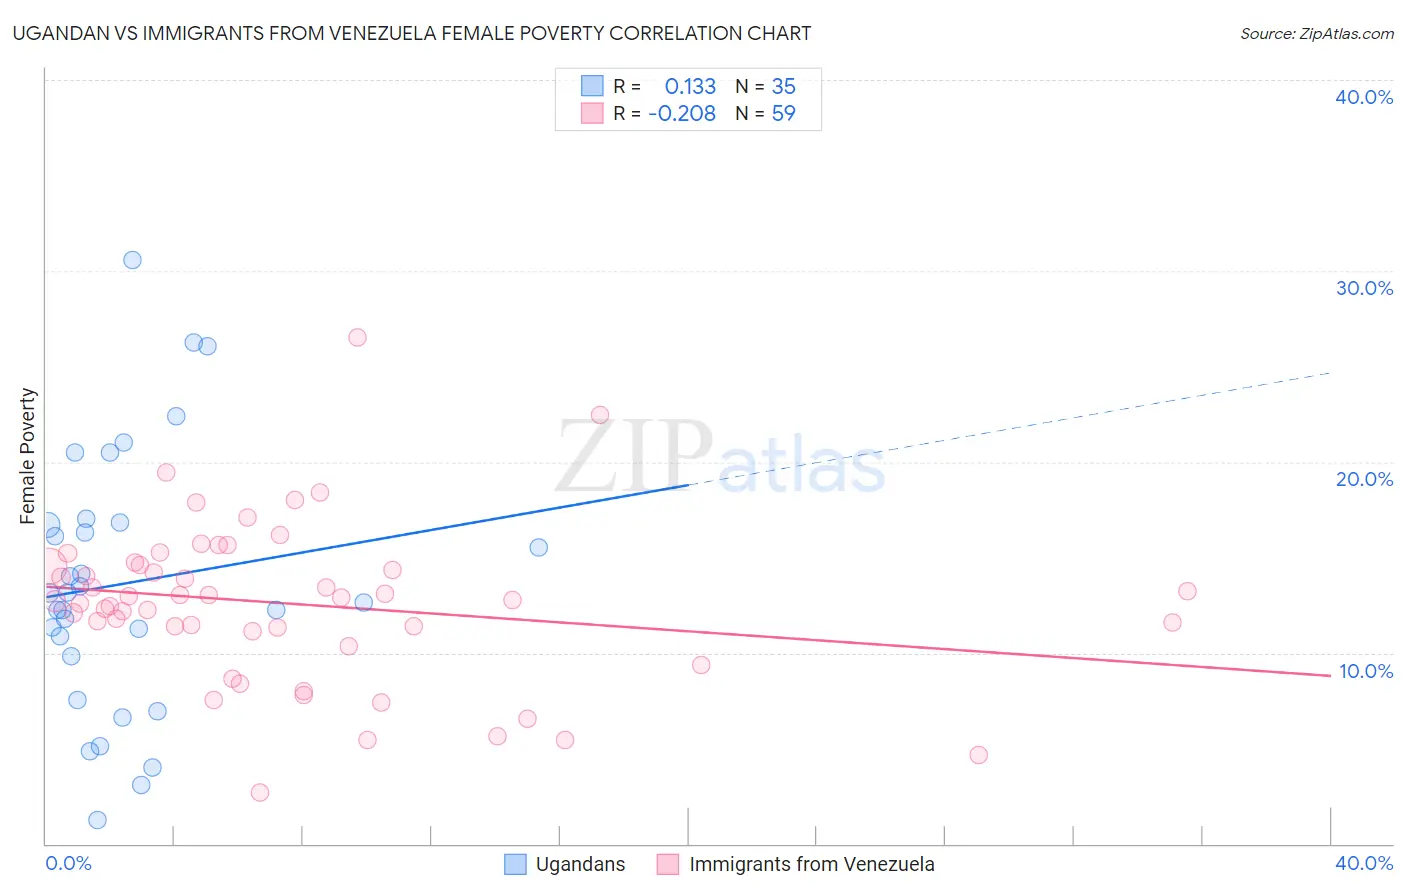
Ugandan vs Immigrants from Venezuela Female Poverty Correlation Chart
The statistical analysis conducted on geographies consisting of 93,995,237 people shows a poor positive correlation between the proportion of Ugandans and poverty level among females in the United States with a correlation coefficient (R) of 0.133 and weighted average of 14.0%. Similarly, the statistical analysis conducted on geographies consisting of 287,717,051 people shows a weak negative correlation between the proportion of Immigrants from Venezuela and poverty level among females in the United States with a correlation coefficient (R) of -0.208 and weighted average of 13.6%, a difference of 3.2%.
Female Poverty Correlation Summary
| Measurement | Ugandan | Immigrants from Venezuela |
| Minimum | 1.3% | 2.7% |
| Maximum | 30.6% | 26.5% |
| Range | 29.3% | 23.8% |
| Mean | 13.6% | 12.6% |
| Median | 13.1% | 12.8% |
| Interquartile 25% (IQ1) | 9.8% | 11.2% |
| Interquartile 75% (IQ3) | 16.8% | 14.6% |
| Interquartile Range (IQR) | 7.0% | 3.5% |
| Standard Deviation (Sample) | 6.8% | 4.2% |
| Standard Deviation (Population) | 6.7% | 4.2% |
Demographics Similar to Ugandans and Immigrants from Venezuela by Female Poverty
In terms of female poverty, the demographic groups most similar to Ugandans are Immigrants from Uruguay (14.0%, a difference of 0.27%), Spaniard (13.9%, a difference of 0.56%), Immigrants from Western Asia (13.9%, a difference of 0.84%), Hmong (13.9%, a difference of 0.89%), and Immigrants from Kenya (13.9%, a difference of 0.90%). Similarly, the demographic groups most similar to Immigrants from Venezuela are Immigrants from Portugal (13.6%, a difference of 0.050%), Hawaiian (13.6%, a difference of 0.11%), Uruguayan (13.6%, a difference of 0.11%), Sierra Leonean (13.7%, a difference of 0.81%), and Immigrants from Kuwait (13.7%, a difference of 0.85%).
| Demographics | Rating | Rank | Female Poverty |
| Immigrants | Portugal | 41.5 /100 | #186 | Average 13.6% |
| Immigrants | Venezuela | 41.0 /100 | #187 | Average 13.6% |
| Hawaiians | 39.9 /100 | #188 | Fair 13.6% |
| Uruguayans | 39.8 /100 | #189 | Fair 13.6% |
| Sierra Leoneans | 33.1 /100 | #190 | Fair 13.7% |
| Immigrants | Kuwait | 32.7 /100 | #191 | Fair 13.7% |
| Immigrants | Costa Rica | 31.9 /100 | #192 | Fair 13.7% |
| Iraqis | 31.8 /100 | #193 | Fair 13.7% |
| Delaware | 31.1 /100 | #194 | Fair 13.7% |
| Immigrants | South America | 30.6 /100 | #195 | Fair 13.7% |
| South American Indians | 28.9 /100 | #196 | Fair 13.7% |
| Arabs | 28.6 /100 | #197 | Fair 13.7% |
| Immigrants | Uganda | 28.5 /100 | #198 | Fair 13.7% |
| Immigrants | Lebanon | 25.6 /100 | #199 | Fair 13.8% |
| Spanish | 21.4 /100 | #200 | Fair 13.9% |
| Immigrants | Kenya | 21.1 /100 | #201 | Fair 13.9% |
| Hmong | 21.1 /100 | #202 | Fair 13.9% |
| Immigrants | Western Asia | 20.7 /100 | #203 | Fair 13.9% |
| Spaniards | 18.9 /100 | #204 | Poor 13.9% |
| Ugandans | 15.4 /100 | #205 | Poor 14.0% |
| Immigrants | Uruguay | 14.0 /100 | #206 | Poor 14.0% |