Turkish vs Chippewa Family Poverty
COMPARE
Turkish
Chippewa
Family Poverty
Family Poverty Comparison
Turks
Chippewa
7.5%
FAMILY POVERTY
99.4/ 100
METRIC RATING
36th/ 347
METRIC RANK
11.2%
FAMILY POVERTY
0.1/ 100
METRIC RATING
277th/ 347
METRIC RANK
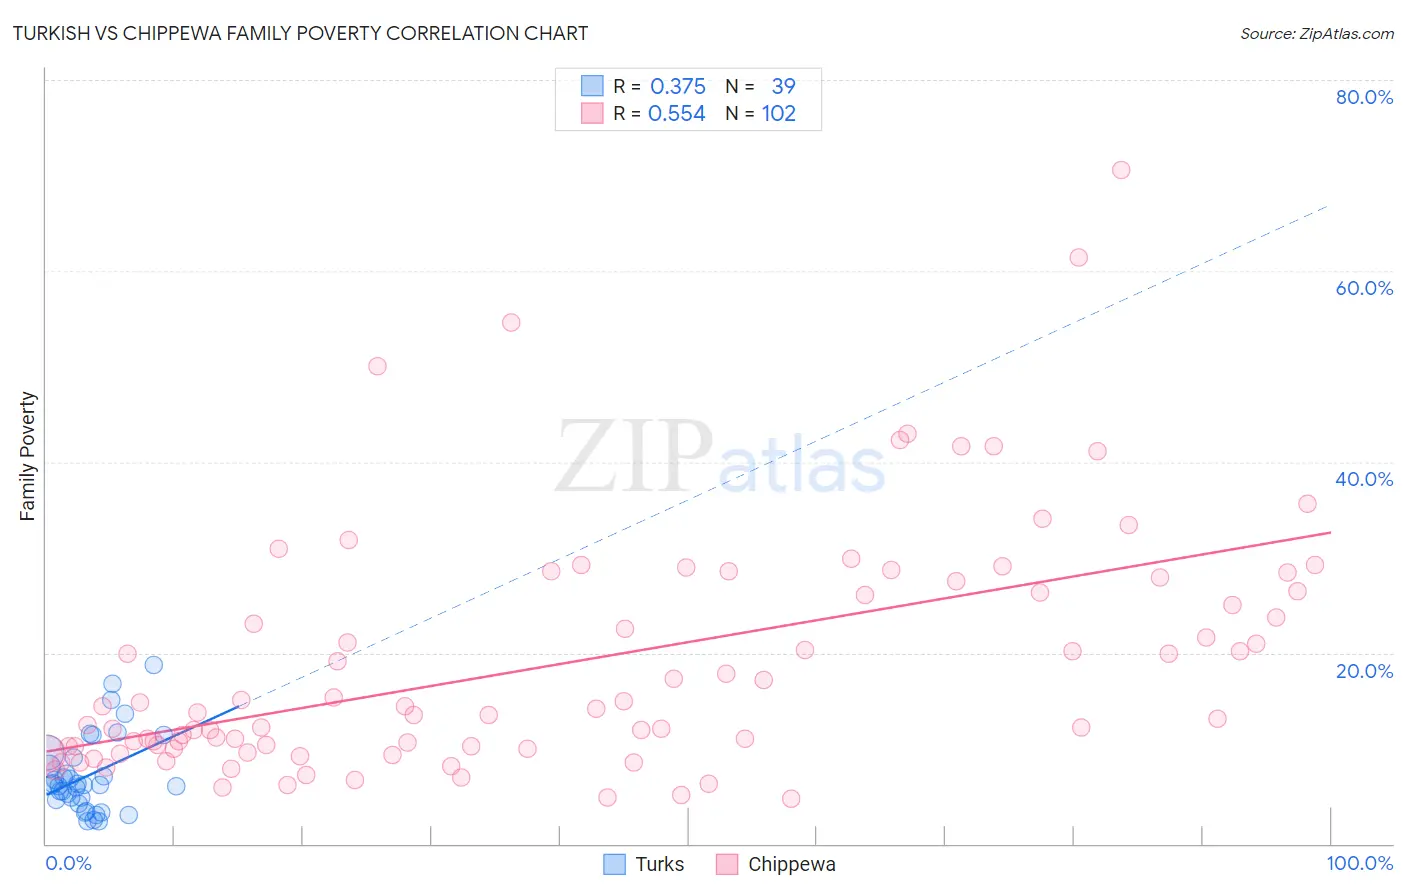
Turkish vs Chippewa Family Poverty Correlation Chart
The statistical analysis conducted on geographies consisting of 271,236,955 people shows a mild positive correlation between the proportion of Turks and poverty level among families in the United States with a correlation coefficient (R) of 0.375 and weighted average of 7.5%. Similarly, the statistical analysis conducted on geographies consisting of 214,735,331 people shows a substantial positive correlation between the proportion of Chippewa and poverty level among families in the United States with a correlation coefficient (R) of 0.554 and weighted average of 11.2%, a difference of 49.7%.
Family Poverty Correlation Summary
| Measurement | Turkish | Chippewa |
| Minimum | 2.4% | 4.7% |
| Maximum | 18.7% | 70.6% |
| Range | 16.3% | 65.9% |
| Mean | 7.1% | 19.0% |
| Median | 6.1% | 14.0% |
| Interquartile 25% (IQ1) | 4.5% | 10.2% |
| Interquartile 75% (IQ3) | 9.0% | 26.5% |
| Interquartile Range (IQR) | 4.4% | 16.3% |
| Standard Deviation (Sample) | 4.0% | 12.8% |
| Standard Deviation (Population) | 3.9% | 12.7% |
Similar Demographics by Family Poverty
Demographics Similar to Turks by Family Poverty
In terms of family poverty, the demographic groups most similar to Turks are Greek (7.5%, a difference of 0.010%), Estonian (7.5%, a difference of 0.17%), Bolivian (7.5%, a difference of 0.41%), Carpatho Rusyn (7.5%, a difference of 0.47%), and Slovene (7.5%, a difference of 0.51%).
| Demographics | Rating | Rank | Family Poverty |
| Immigrants | Northern Europe | 99.6 /100 | #29 | Exceptional 7.4% |
| Italians | 99.6 /100 | #30 | Exceptional 7.4% |
| Czechs | 99.6 /100 | #31 | Exceptional 7.4% |
| Poles | 99.5 /100 | #32 | Exceptional 7.4% |
| Immigrants | Japan | 99.5 /100 | #33 | Exceptional 7.4% |
| Russians | 99.5 /100 | #34 | Exceptional 7.5% |
| Greeks | 99.4 /100 | #35 | Exceptional 7.5% |
| Turks | 99.4 /100 | #36 | Exceptional 7.5% |
| Estonians | 99.4 /100 | #37 | Exceptional 7.5% |
| Bolivians | 99.3 /100 | #38 | Exceptional 7.5% |
| Carpatho Rusyns | 99.3 /100 | #39 | Exceptional 7.5% |
| Slovenes | 99.3 /100 | #40 | Exceptional 7.5% |
| Immigrants | Australia | 99.2 /100 | #41 | Exceptional 7.6% |
| Scandinavians | 99.1 /100 | #42 | Exceptional 7.6% |
| Immigrants | Austria | 99.1 /100 | #43 | Exceptional 7.6% |
Demographics Similar to Chippewa by Family Poverty
In terms of family poverty, the demographic groups most similar to Chippewa are Guyanese (11.2%, a difference of 0.030%), Immigrants from Guyana (11.2%, a difference of 0.090%), Central American (11.2%, a difference of 0.11%), Spanish American (11.2%, a difference of 0.16%), and Blackfeet (11.3%, a difference of 0.16%).
| Demographics | Rating | Rank | Family Poverty |
| Immigrants | Nicaragua | 0.1 /100 | #270 | Tragic 11.1% |
| Immigrants | Bahamas | 0.1 /100 | #271 | Tragic 11.1% |
| Immigrants | Jamaica | 0.1 /100 | #272 | Tragic 11.2% |
| Somalis | 0.1 /100 | #273 | Tragic 11.2% |
| Spanish Americans | 0.1 /100 | #274 | Tragic 11.2% |
| Central Americans | 0.1 /100 | #275 | Tragic 11.2% |
| Immigrants | Guyana | 0.1 /100 | #276 | Tragic 11.2% |
| Chippewa | 0.1 /100 | #277 | Tragic 11.2% |
| Guyanese | 0.1 /100 | #278 | Tragic 11.2% |
| Blackfeet | 0.0 /100 | #279 | Tragic 11.3% |
| Belizeans | 0.0 /100 | #280 | Tragic 11.3% |
| Immigrants | West Indies | 0.0 /100 | #281 | Tragic 11.3% |
| Immigrants | Cuba | 0.0 /100 | #282 | Tragic 11.3% |
| Indonesians | 0.0 /100 | #283 | Tragic 11.3% |
| Yaqui | 0.0 /100 | #284 | Tragic 11.3% |