Tsimshian vs French Child Poverty Among Boys Under 16

COMPARE

Tsimshian
Race
Ancestry
AfghanAfricanAlaska NativeAlaskan AthabascanAlbanianAleutAlsatianAmericanApacheArabArapahoArgentineanArmenianAssyrian/Chaldean/SyriacAustralianAustrianBahamianBangladeshiBarbadianBasqueBelgianBelizeanBermudanBhutaneseBlackfeetBolivianBrazilianBritishBritish West IndianBulgarianBurmeseCajunCambodianCanadianCape VerdeanCarpatho RusynCelticCentral AmericanCentral American IndianCherokeeCheyenneChickasawChileanChineseChippewaChoctawColombianColvilleComancheCosta RicanCreeCreekCroatianCrowCubanCypriotCzechCzechoslovakianDanishDelawareDominicanDutchDutch West IndianEastern EuropeanEcuadorianEgyptianEnglishEstonianEthiopianEuropeanFijianFilipinoFinnishFrench American IndianFrench CanadianGermanGerman RussianGhanaianGreekGuamanian/ChamorroGuatemalanGuyaneseHaitianHmongHonduranHopiHoumaHungarianIcelanderIndian (Asian)IndonesianInupiatIranianIraqiIrishIroquoisIsraeliItalianJamaicanJapaneseJordanianKenyanKiowaKoreanLaotianLatvianLebaneseLiberianLithuanianLumbeeLuxembourgerMacedonianMalaysianMalteseMarshalleseMenomineeMexicanMexican American IndianMongolianMoroccanNative HawaiianNavajoNepaleseNew ZealanderNicaraguanNigerianNorthern EuropeanNorwegianOkinawanOsageOttawaPaiutePakistaniPalestinianPanamanianParaguayanPennsylvania GermanPeruvianPimaPolishPortuguesePotawatomiPuebloPuerto RicanPuget Sound SalishRomanianRussianSalvadoranSamoanScandinavianScotch-IrishScottishSeminoleSenegaleseSerbianShoshoneSierra LeoneanSiouxSlavicSlovakSloveneSomaliSouth AfricanSouth AmericanSouth American IndianSoviet UnionSpaniardSpanishSpanish AmericanSpanish American IndianSri LankanSubsaharan AfricanSudaneseSwedishSwissSyrianTaiwaneseThaiTlingit-HaidaTohono O'OdhamTonganTrinidadian and TobagonianTsimshianTurkishU.S. Virgin IslanderUgandanUkrainianUruguayanUteVenezuelanVietnameseWelshWest IndianYakamaYaquiYugoslavianYumanYup'ikZimbabwean
Immigration
NonimmigrantsImmigrantsAfghanistanAfricaAlbaniaArgentinaArmeniaAsiaAustraliaAustriaBahamasBangladeshBarbadosBelarusBelgiumBelizeBoliviaBosnia and HerzegovinaBrazilBulgariaBurma/MyanmarCabo VerdeCambodiaCameroonCanadaCaribbeanCentral AmericaChileChinaColombiaCongoCosta RicaCroatiaCubaCzechoslovakiaDenmarkDominicaDominican RepublicEastern AfricaEastern AsiaEastern EuropeEcuadorEgyptEl SalvadorEnglandEritreaEthiopiaEuropeFijiFranceGermanyGhanaGreeceGrenadaGuatemalaGuyanaHaitiHondurasHong KongHungaryIndiaIndonesiaIranIraqIrelandIsraelItalyJamaicaJapanJordanKazakhstanKenyaKoreaKuwaitLaosLatin AmericaLatviaLebanonLiberiaLithuaniaMalaysiaMexicoMicronesiaMiddle AfricaMoldovaMoroccoNepalNetherlandsNicaraguaNigeriaNorth AmericaNorth MacedoniaNorthern AfricaNorthern EuropeNorwayOceaniaPakistanPanamaPeruPhilippinesPolandPortugalRomaniaRussiaSaudi ArabiaScotlandSenegalSerbiaSierra LeoneSingaporeSomaliaSouth AfricaSouth AmericaSouth Central AsiaSouth Eastern AsiaSouthern EuropeSpainSri LankaSt. Vincent and the GrenadinesSudanSwedenSwitzerlandSyriaTaiwanThailandTrinidad and TobagoTurkeyUgandaUkraineUruguayUzbekistanVenezuelaVietnamWest IndiesWestern AfricaWestern AsiaWestern EuropeYemenZaireZimbabweAzores
French
Race
Ancestry
AfghanAfricanAlaska NativeAlaskan AthabascanAlbanianAleutAlsatianAmericanApacheArabArapahoArgentineanArmenianAssyrian/Chaldean/SyriacAustralianAustrianBahamianBangladeshiBarbadianBasqueBelgianBelizeanBermudanBhutaneseBlackfeetBolivianBrazilianBritishBritish West IndianBulgarianBurmeseCajunCambodianCanadianCape VerdeanCarpatho RusynCelticCentral AmericanCentral American IndianCherokeeCheyenneChickasawChileanChineseChippewaChoctawColombianColvilleComancheCosta RicanCreeCreekCroatianCrowCubanCypriotCzechCzechoslovakianDanishDelawareDominicanDutchDutch West IndianEastern EuropeanEcuadorianEgyptianEnglishEstonianEthiopianEuropeanFijianFilipinoFinnishFrenchFrench American IndianFrench CanadianGermanGerman RussianGhanaianGreekGuamanian/ChamorroGuatemalanGuyaneseHaitianHmongHonduranHopiHoumaHungarianIcelanderIndian (Asian)IndonesianInupiatIranianIraqiIrishIroquoisIsraeliItalianJamaicanJapaneseJordanianKenyanKiowaKoreanLaotianLatvianLebaneseLiberianLithuanianLumbeeLuxembourgerMacedonianMalaysianMalteseMarshalleseMenomineeMexicanMexican American IndianMongolianMoroccanNative HawaiianNavajoNepaleseNew ZealanderNicaraguanNigerianNorthern EuropeanNorwegianOkinawanOsageOttawaPaiutePakistaniPalestinianPanamanianParaguayanPennsylvania GermanPeruvianPimaPolishPortuguesePotawatomiPuebloPuerto RicanPuget Sound SalishRomanianRussianSalvadoranSamoanScandinavianScotch-IrishScottishSeminoleSenegaleseSerbianShoshoneSierra LeoneanSiouxSlavicSlovakSloveneSomaliSouth AfricanSouth AmericanSouth American IndianSoviet UnionSpaniardSpanishSpanish AmericanSpanish American IndianSri LankanSubsaharan AfricanSudaneseSwedishSwissSyrianTaiwaneseThaiTlingit-HaidaTohono O'OdhamTonganTrinidadian and TobagonianTurkishU.S. Virgin IslanderUgandanUkrainianUruguayanUteVenezuelanVietnameseWelshWest IndianYakamaYaquiYugoslavianYumanYup'ikZimbabwean
Immigration
NonimmigrantsImmigrantsAfghanistanAfricaAlbaniaArgentinaArmeniaAsiaAustraliaAustriaBahamasBangladeshBarbadosBelarusBelgiumBelizeBoliviaBosnia and HerzegovinaBrazilBulgariaBurma/MyanmarCabo VerdeCambodiaCameroonCanadaCaribbeanCentral AmericaChileChinaColombiaCongoCosta RicaCroatiaCubaCzechoslovakiaDenmarkDominicaDominican RepublicEastern AfricaEastern AsiaEastern EuropeEcuadorEgyptEl SalvadorEnglandEritreaEthiopiaEuropeFijiFranceGermanyGhanaGreeceGrenadaGuatemalaGuyanaHaitiHondurasHong KongHungaryIndiaIndonesiaIranIraqIrelandIsraelItalyJamaicaJapanJordanKazakhstanKenyaKoreaKuwaitLaosLatin AmericaLatviaLebanonLiberiaLithuaniaMalaysiaMexicoMicronesiaMiddle AfricaMoldovaMoroccoNepalNetherlandsNicaraguaNigeriaNorth AmericaNorth MacedoniaNorthern AfricaNorthern EuropeNorwayOceaniaPakistanPanamaPeruPhilippinesPolandPortugalRomaniaRussiaSaudi ArabiaScotlandSenegalSerbiaSierra LeoneSingaporeSomaliaSouth AfricaSouth AmericaSouth Central AsiaSouth Eastern AsiaSouthern EuropeSpainSri LankaSt. Vincent and the GrenadinesSudanSwedenSwitzerlandSyriaTaiwanThailandTrinidad and TobagoTurkeyUgandaUkraineUruguayUzbekistanVenezuelaVietnamWest IndiesWestern AfricaWestern AsiaWestern EuropeYemenZaireZimbabweAzores
Child Poverty Among Boys Under 16
Income
Poverty
Unemployment
Labor Participation
Family Structure
Vehicle Availability
Education Level
Disability

Child Poverty Among Boys Under 16 Comparison

Tsimshian

French

Average
Good
16.4%
CHILD POVERTY AMONG BOYS UNDER 16
50.5/ 100
METRIC RATING
173rd/ 347
METRIC RANK
15.8%
CHILD POVERTY AMONG BOYS UNDER 16
78.7/ 100
METRIC RATING
153rd/ 347
METRIC RANK

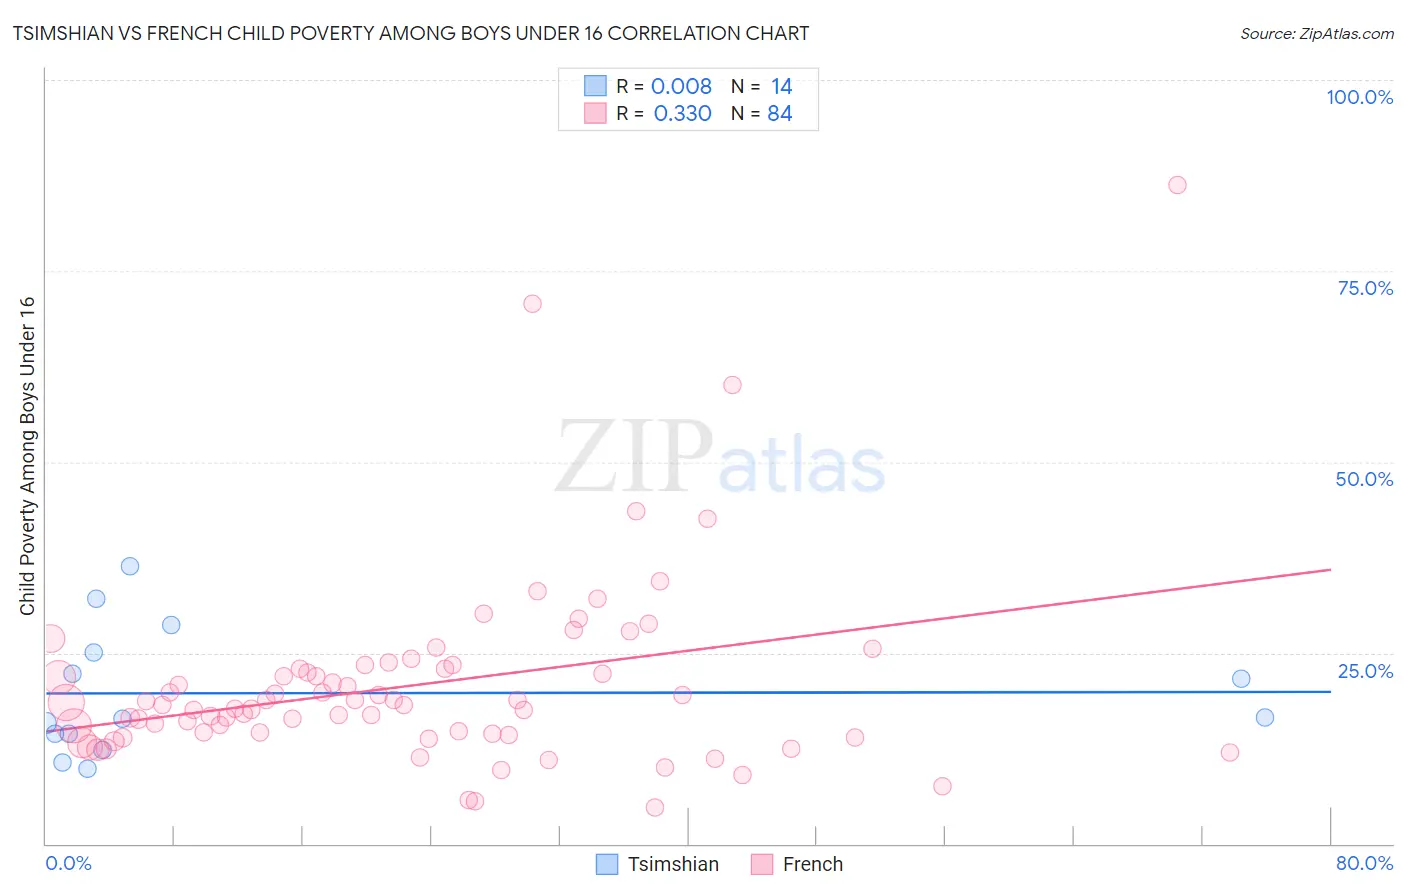
Tsimshian vs French Child Poverty Among Boys Under 16 Correlation Chart

The statistical analysis conducted on geographies consisting of 15,622,353 people shows no correlation between the proportion of Tsimshian and poverty level among boys under the age of 16 in the United States with a correlation coefficient (R) of 0.008 and weighted average of 16.4%. Similarly, the statistical analysis conducted on geographies consisting of 551,366,964 people shows a mild positive correlation between the proportion of French and poverty level among boys under the age of 16 in the United States with a correlation coefficient (R) of 0.330 and weighted average of 15.8%, a difference of 3.7%.
Tsimshian vs French Child Poverty Among Boys Under 16

Child Poverty Among Boys Under 16 Correlation Summary

MeasurementTsimshianFrench
Minimum9.9%4.7%
Maximum36.4%86.3%
Range26.5%81.6%
Mean19.7%20.7%
Median16.5%18.2%
Interquartile 25% (IQ1)14.3%14.3%
Interquartile 75% (IQ3)25.0%22.9%
Interquartile Range (IQR)10.7%8.6%
Standard Deviation (Sample)8.2%12.5%
Standard Deviation (Population)7.9%12.4%

Demographics Similar to Tsimshian and French by Child Poverty Among Boys Under 16

In terms of child poverty among boys under 16, the demographic groups most similar to Tsimshian are Immigrants from Colombia (16.4%, a difference of 0.030%), Immigrants from Ethiopia (16.4%, a difference of 0.080%), Immigrants from Bosnia and Herzegovina (16.4%, a difference of 0.14%), Immigrants from Saudi Arabia (16.4%, a difference of 0.35%), and South American (16.3%, a difference of 0.54%). Similarly, the demographic groups most similar to French are Syrian (15.9%, a difference of 0.20%), French Canadian (15.9%, a difference of 0.35%), Israeli (15.9%, a difference of 0.36%), Immigrants from Nepal (15.9%, a difference of 0.45%), and Yugoslavian (15.9%, a difference of 0.46%).
DemographicsRating | RankChild Poverty Among Boys Under 16
French
78.7
/100
|
#153
Good
15.8%
Syrians
77.5
/100
|
#154
Good
15.9%
French Canadians
76.6
/100
|
#155
Good
15.9%
Israelis
76.5
/100
|
#156
Good
15.9%
Immigrants | Nepal
76.0
/100
|
#157
Good
15.9%
Yugoslavians
75.9
/100
|
#158
Good
15.9%
Immigrants | Chile
74.8
/100
|
#159
Good
15.9%
Immigrants | Northern Africa
71.3
/100
|
#160
Good
16.0%
Immigrants | Oceania
71.3
/100
|
#161
Good
16.0%
Guamanians/Chamorros
69.6
/100
|
#162
Good
16.1%
Costa Ricans
68.1
/100
|
#163
Good
16.1%
Immigrants | Albania
67.9
/100
|
#164
Good
16.1%
Colombians
65.2
/100
|
#165
Good
16.1%
Immigrants | Germany
63.6
/100
|
#166
Good
16.2%
Afghans
55.4
/100
|
#167
Average
16.3%
South Americans
55.3
/100
|
#168
Average
16.3%
Immigrants | Saudi Arabia
53.6
/100
|
#169
Average
16.4%
Immigrants | Bosnia and Herzegovina
51.7
/100
|
#170
Average
16.4%
Immigrants | Ethiopia
51.3
/100
|
#171
Average
16.4%
Immigrants | Colombia
50.8
/100
|
#172
Average
16.4%
Tsimshian
50.5
/100
|
#173
Average
16.4%