Trinidadian and Tobagonian vs Immigrants from Ecuador Female Poverty Among 25-34 Year Olds
COMPARE
Trinidadian and Tobagonian
Immigrants from Ecuador
Female Poverty Among 25-34 Year Olds
Female Poverty Among 25-34 Year Olds Comparison
Trinidadians and Tobagonians
Immigrants from Ecuador
14.2%
FEMALE POVERTY AMONG 25-34 YEAR OLDS
8.2/ 100
METRIC RATING
211th/ 347
METRIC RANK
14.6%
FEMALE POVERTY AMONG 25-34 YEAR OLDS
1.9/ 100
METRIC RATING
232nd/ 347
METRIC RANK
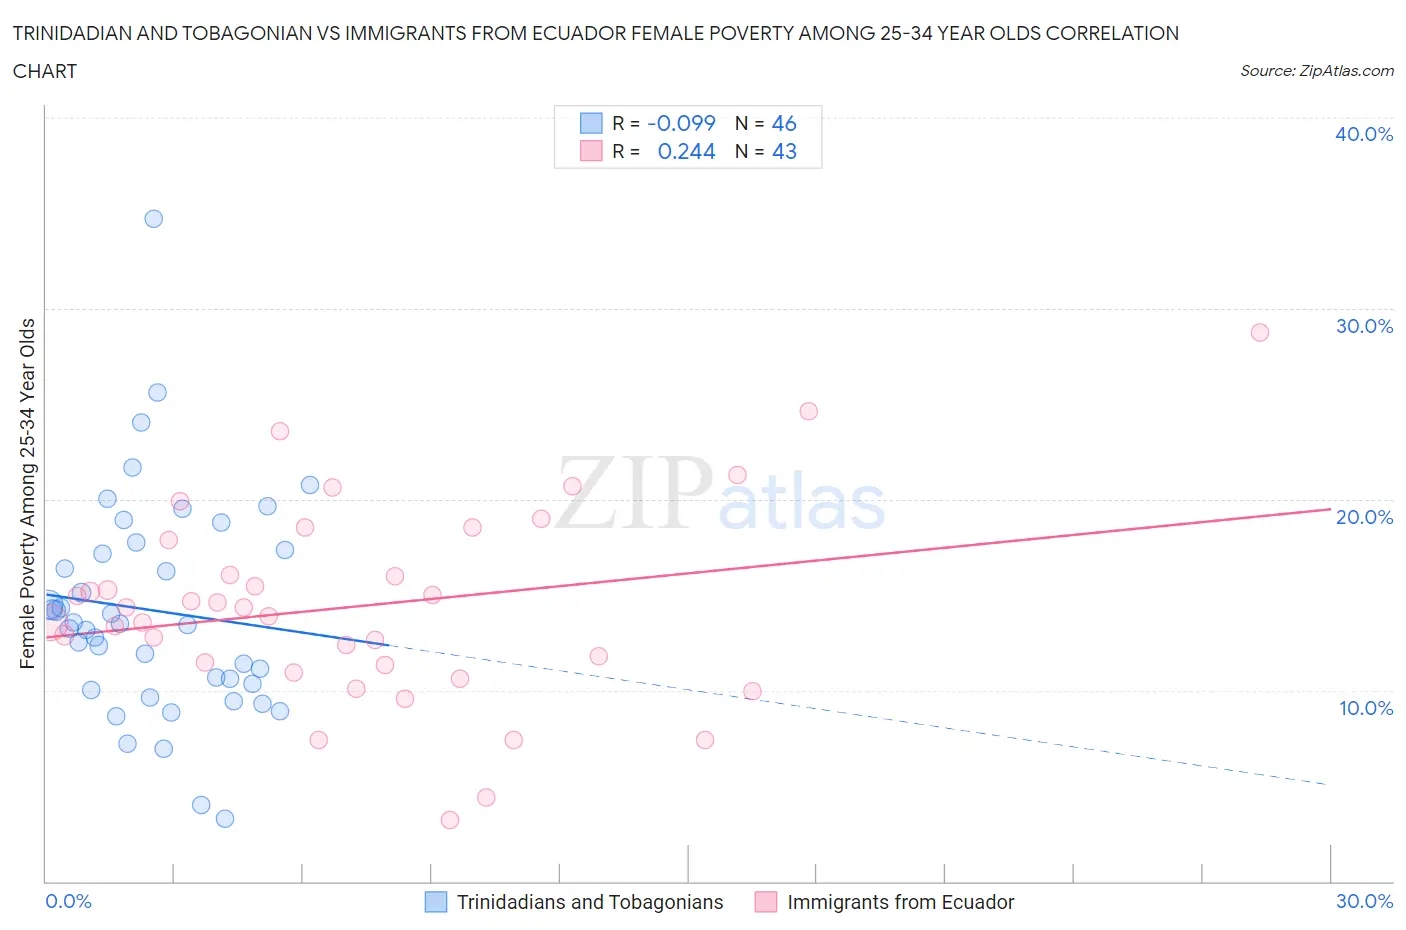
Trinidadian and Tobagonian vs Immigrants from Ecuador Female Poverty Among 25-34 Year Olds Correlation Chart
The statistical analysis conducted on geographies consisting of 217,790,288 people shows a slight negative correlation between the proportion of Trinidadians and Tobagonians and poverty level among females between the ages 25 and 34 in the United States with a correlation coefficient (R) of -0.099 and weighted average of 14.2%. Similarly, the statistical analysis conducted on geographies consisting of 268,011,049 people shows a weak positive correlation between the proportion of Immigrants from Ecuador and poverty level among females between the ages 25 and 34 in the United States with a correlation coefficient (R) of 0.244 and weighted average of 14.6%, a difference of 3.0%.
Female Poverty Among 25-34 Year Olds Correlation Summary
| Measurement | Trinidadian and Tobagonian | Immigrants from Ecuador |
| Minimum | 3.3% | 3.2% |
| Maximum | 34.7% | 28.8% |
| Range | 31.4% | 25.6% |
| Mean | 14.2% | 14.4% |
| Median | 13.5% | 14.3% |
| Interquartile 25% (IQ1) | 10.3% | 11.3% |
| Interquartile 75% (IQ3) | 17.3% | 17.9% |
| Interquartile Range (IQR) | 7.0% | 6.5% |
| Standard Deviation (Sample) | 5.8% | 5.2% |
| Standard Deviation (Population) | 5.7% | 5.1% |
Similar Demographics by Female Poverty Among 25-34 Year Olds
Demographics Similar to Trinidadians and Tobagonians by Female Poverty Among 25-34 Year Olds
In terms of female poverty among 25-34 year olds, the demographic groups most similar to Trinidadians and Tobagonians are Guyanese (14.2%, a difference of 0.12%), Panamanian (14.2%, a difference of 0.12%), Immigrants from Guyana (14.3%, a difference of 0.45%), Puget Sound Salish (14.3%, a difference of 0.48%), and French (14.3%, a difference of 0.58%).
| Demographics | Rating | Rank | Female Poverty Among 25-34 Year Olds |
| Hawaiians | 13.6 /100 | #204 | Poor 14.1% |
| Immigrants | Africa | 13.4 /100 | #205 | Poor 14.1% |
| Hungarians | 11.8 /100 | #206 | Poor 14.1% |
| Japanese | 11.7 /100 | #207 | Poor 14.1% |
| Immigrants | Panama | 11.6 /100 | #208 | Poor 14.1% |
| Guyanese | 8.6 /100 | #209 | Tragic 14.2% |
| Panamanians | 8.6 /100 | #210 | Tragic 14.2% |
| Trinidadians and Tobagonians | 8.2 /100 | #211 | Tragic 14.2% |
| Immigrants | Guyana | 6.6 /100 | #212 | Tragic 14.3% |
| Puget Sound Salish | 6.5 /100 | #213 | Tragic 14.3% |
| French | 6.2 /100 | #214 | Tragic 14.3% |
| Immigrants | Nigeria | 6.2 /100 | #215 | Tragic 14.3% |
| French Canadians | 5.5 /100 | #216 | Tragic 14.3% |
| Spanish American Indians | 5.5 /100 | #217 | Tragic 14.3% |
| Immigrants | Thailand | 5.2 /100 | #218 | Tragic 14.3% |
Demographics Similar to Immigrants from Ecuador by Female Poverty Among 25-34 Year Olds
In terms of female poverty among 25-34 year olds, the demographic groups most similar to Immigrants from Ecuador are White/Caucasian (14.7%, a difference of 0.18%), Delaware (14.6%, a difference of 0.31%), Spaniard (14.6%, a difference of 0.36%), Cuban (14.7%, a difference of 0.41%), and Spanish (14.6%, a difference of 0.49%).
| Demographics | Rating | Rank | Female Poverty Among 25-34 Year Olds |
| Immigrants | Barbados | 3.4 /100 | #225 | Tragic 14.5% |
| Nicaraguans | 3.3 /100 | #226 | Tragic 14.5% |
| Celtics | 2.8 /100 | #227 | Tragic 14.5% |
| Vietnamese | 2.6 /100 | #228 | Tragic 14.6% |
| Spanish | 2.5 /100 | #229 | Tragic 14.6% |
| Spaniards | 2.3 /100 | #230 | Tragic 14.6% |
| Delaware | 2.3 /100 | #231 | Tragic 14.6% |
| Immigrants | Ecuador | 1.9 /100 | #232 | Tragic 14.6% |
| Whites/Caucasians | 1.8 /100 | #233 | Tragic 14.7% |
| Cubans | 1.6 /100 | #234 | Tragic 14.7% |
| Immigrants | Jamaica | 1.4 /100 | #235 | Tragic 14.7% |
| Salvadorans | 1.4 /100 | #236 | Tragic 14.7% |
| Immigrants | Ghana | 1.4 /100 | #237 | Tragic 14.7% |
| Alsatians | 1.4 /100 | #238 | Tragic 14.7% |
| Malaysians | 1.4 /100 | #239 | Tragic 14.7% |