Immigrants from Sweden vs Immigrants from Ecuador Female Poverty Among 25-34 Year Olds
COMPARE
Immigrants from Sweden
Immigrants from Ecuador
Female Poverty Among 25-34 Year Olds
Female Poverty Among 25-34 Year Olds Comparison
Immigrants from Sweden
Immigrants from Ecuador
12.3%
FEMALE POVERTY AMONG 25-34 YEAR OLDS
98.9/ 100
METRIC RATING
74th/ 347
METRIC RANK
14.6%
FEMALE POVERTY AMONG 25-34 YEAR OLDS
1.9/ 100
METRIC RATING
232nd/ 347
METRIC RANK
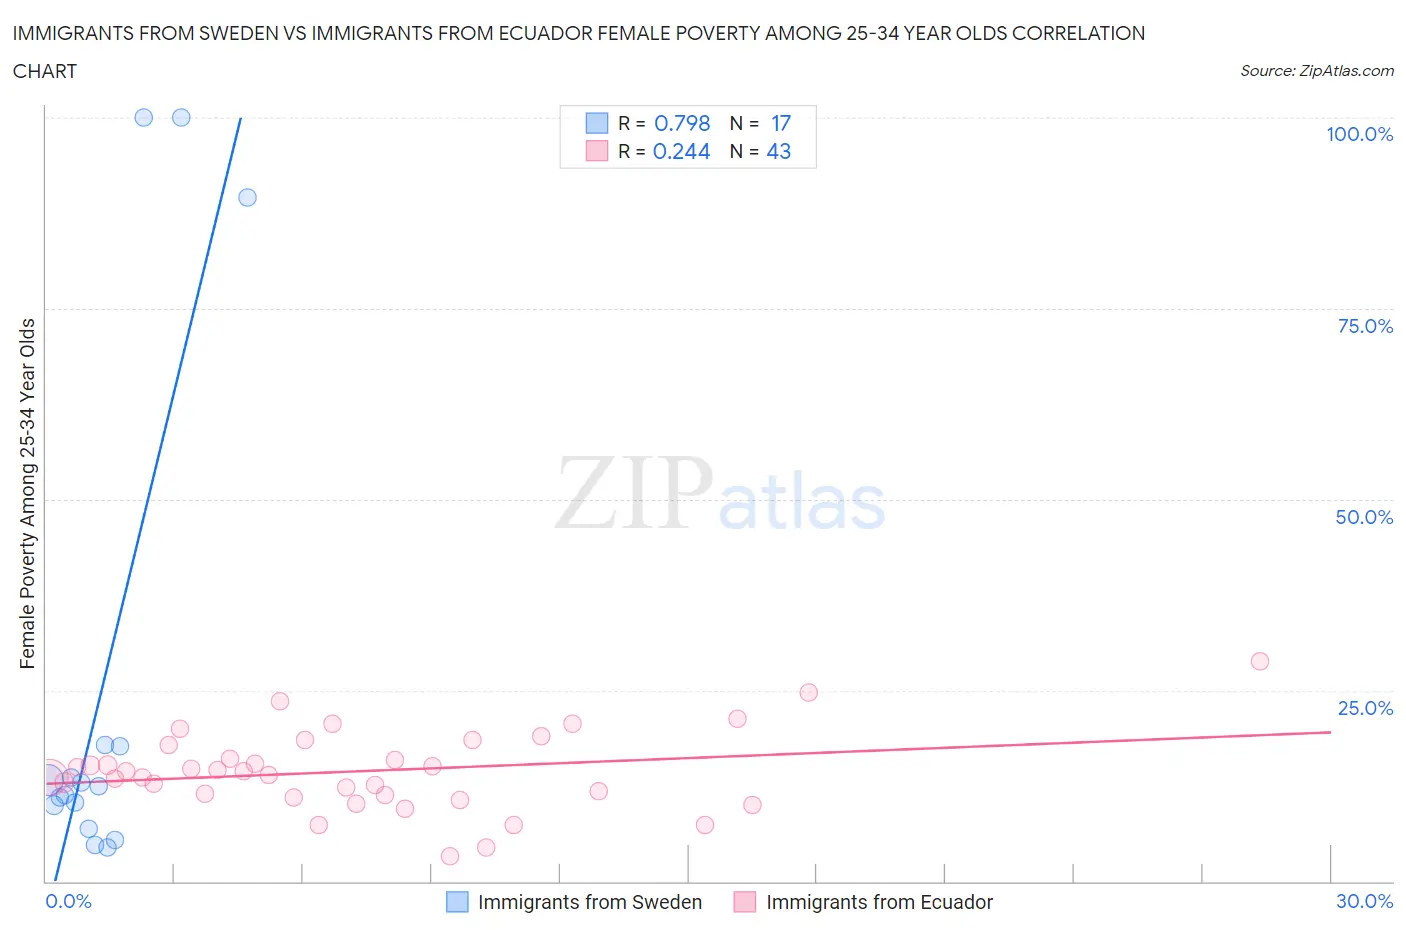
Immigrants from Sweden vs Immigrants from Ecuador Female Poverty Among 25-34 Year Olds Correlation Chart
The statistical analysis conducted on geographies consisting of 162,771,885 people shows a strong positive correlation between the proportion of Immigrants from Sweden and poverty level among females between the ages 25 and 34 in the United States with a correlation coefficient (R) of 0.798 and weighted average of 12.3%. Similarly, the statistical analysis conducted on geographies consisting of 268,011,049 people shows a weak positive correlation between the proportion of Immigrants from Ecuador and poverty level among females between the ages 25 and 34 in the United States with a correlation coefficient (R) of 0.244 and weighted average of 14.6%, a difference of 19.3%.
Female Poverty Among 25-34 Year Olds Correlation Summary
| Measurement | Immigrants from Sweden | Immigrants from Ecuador |
| Minimum | 4.3% | 3.2% |
| Maximum | 100.0% | 28.8% |
| Range | 95.7% | 25.6% |
| Mean | 25.9% | 14.4% |
| Median | 12.4% | 14.3% |
| Interquartile 25% (IQ1) | 8.4% | 11.3% |
| Interquartile 75% (IQ3) | 17.8% | 17.9% |
| Interquartile Range (IQR) | 9.4% | 6.5% |
| Standard Deviation (Sample) | 34.0% | 5.2% |
| Standard Deviation (Population) | 32.9% | 5.1% |
Similar Demographics by Female Poverty Among 25-34 Year Olds
Demographics Similar to Immigrants from Sweden by Female Poverty Among 25-34 Year Olds
In terms of female poverty among 25-34 year olds, the demographic groups most similar to Immigrants from Sweden are Immigrants from Vietnam (12.3%, a difference of 0.030%), Estonian (12.3%, a difference of 0.050%), Greek (12.3%, a difference of 0.11%), Immigrants from Italy (12.3%, a difference of 0.27%), and Lithuanian (12.2%, a difference of 0.34%).
| Demographics | Rating | Rank | Female Poverty Among 25-34 Year Olds |
| Laotians | 99.2 /100 | #67 | Exceptional 12.2% |
| Sri Lankans | 99.1 /100 | #68 | Exceptional 12.2% |
| Immigrants | Lebanon | 99.1 /100 | #69 | Exceptional 12.2% |
| Immigrants | Belgium | 99.1 /100 | #70 | Exceptional 12.2% |
| Immigrants | Scotland | 99.1 /100 | #71 | Exceptional 12.2% |
| Lithuanians | 99.1 /100 | #72 | Exceptional 12.2% |
| Immigrants | Vietnam | 98.9 /100 | #73 | Exceptional 12.3% |
| Immigrants | Sweden | 98.9 /100 | #74 | Exceptional 12.3% |
| Estonians | 98.9 /100 | #75 | Exceptional 12.3% |
| Greeks | 98.9 /100 | #76 | Exceptional 12.3% |
| Immigrants | Italy | 98.8 /100 | #77 | Exceptional 12.3% |
| Immigrants | Ukraine | 98.6 /100 | #78 | Exceptional 12.3% |
| Immigrants | Jordan | 98.5 /100 | #79 | Exceptional 12.4% |
| Immigrants | Malaysia | 98.3 /100 | #80 | Exceptional 12.4% |
| Immigrants | Kazakhstan | 98.1 /100 | #81 | Exceptional 12.4% |
Demographics Similar to Immigrants from Ecuador by Female Poverty Among 25-34 Year Olds
In terms of female poverty among 25-34 year olds, the demographic groups most similar to Immigrants from Ecuador are White/Caucasian (14.7%, a difference of 0.18%), Delaware (14.6%, a difference of 0.31%), Spaniard (14.6%, a difference of 0.36%), Cuban (14.7%, a difference of 0.41%), and Spanish (14.6%, a difference of 0.49%).
| Demographics | Rating | Rank | Female Poverty Among 25-34 Year Olds |
| Immigrants | Barbados | 3.4 /100 | #225 | Tragic 14.5% |
| Nicaraguans | 3.3 /100 | #226 | Tragic 14.5% |
| Celtics | 2.8 /100 | #227 | Tragic 14.5% |
| Vietnamese | 2.6 /100 | #228 | Tragic 14.6% |
| Spanish | 2.5 /100 | #229 | Tragic 14.6% |
| Spaniards | 2.3 /100 | #230 | Tragic 14.6% |
| Delaware | 2.3 /100 | #231 | Tragic 14.6% |
| Immigrants | Ecuador | 1.9 /100 | #232 | Tragic 14.6% |
| Whites/Caucasians | 1.8 /100 | #233 | Tragic 14.7% |
| Cubans | 1.6 /100 | #234 | Tragic 14.7% |
| Immigrants | Jamaica | 1.4 /100 | #235 | Tragic 14.7% |
| Salvadorans | 1.4 /100 | #236 | Tragic 14.7% |
| Immigrants | Ghana | 1.4 /100 | #237 | Tragic 14.7% |
| Alsatians | 1.4 /100 | #238 | Tragic 14.7% |
| Malaysians | 1.4 /100 | #239 | Tragic 14.7% |