Tohono O'odham vs Argentinean Single Mother Poverty

COMPARE

Tohono O'odham
Race
Ancestry
AfghanAfricanAlaska NativeAlaskan AthabascanAlbanianAleutAlsatianAmericanApacheArabArapahoArmenianAssyrian/Chaldean/SyriacAustralianAustrianBahamianBangladeshiBarbadianBasqueBelgianBelizeanBermudanBhutaneseBlackfeetBolivianBrazilianBritishBritish West IndianBulgarianBurmeseCajunCambodianCanadianCape VerdeanCarpatho RusynCelticCentral AmericanCentral American IndianCherokeeCheyenneChickasawChileanChineseChippewaChoctawColombianColvilleComancheCosta RicanCreeCreekCroatianCrowCubanCypriotCzechCzechoslovakianDanishDelawareDominicanDutchDutch West IndianEastern EuropeanEcuadorianEgyptianEnglishEstonianEthiopianEuropeanFijianFilipinoFinnishFrenchFrench American IndianFrench CanadianGermanGerman RussianGhanaianGreekGuamanian/ChamorroGuatemalanGuyaneseHaitianHmongHonduranHopiHoumaHungarianIcelanderIndian (Asian)IndonesianInupiatIranianIraqiIrishIroquoisIsraeliItalianJamaicanJapaneseJordanianKenyanKiowaKoreanLaotianLatvianLebaneseLiberianLithuanianLumbeeLuxembourgerMacedonianMalaysianMalteseMarshalleseMenomineeMexicanMexican American IndianMongolianMoroccanNative HawaiianNavajoNepaleseNew ZealanderNicaraguanNigerianNorthern EuropeanNorwegianOkinawanOsageOttawaPaiutePakistaniPalestinianPanamanianParaguayanPennsylvania GermanPeruvianPimaPolishPortuguesePotawatomiPuebloPuerto RicanPuget Sound SalishRomanianRussianSalvadoranSamoanScandinavianScotch-IrishScottishSeminoleSenegaleseSerbianShoshoneSierra LeoneanSiouxSlavicSlovakSloveneSomaliSouth AfricanSouth AmericanSouth American IndianSoviet UnionSpaniardSpanishSpanish AmericanSpanish American IndianSri LankanSubsaharan AfricanSudaneseSwedishSwissSyrianTaiwaneseThaiTlingit-HaidaTohono O'OdhamTonganTrinidadian and TobagonianTsimshianTurkishU.S. Virgin IslanderUgandanUkrainianUruguayanUteVenezuelanVietnameseWelshWest IndianYakamaYaquiYugoslavianYumanYup'ikZimbabwean
Immigration
NonimmigrantsImmigrantsAfghanistanAfricaAlbaniaArgentinaArmeniaAsiaAustraliaAustriaBahamasBangladeshBarbadosBelarusBelgiumBelizeBoliviaBosnia and HerzegovinaBrazilBulgariaBurma/MyanmarCabo VerdeCambodiaCameroonCanadaCaribbeanCentral AmericaChileChinaColombiaCongoCosta RicaCroatiaCubaCzechoslovakiaDenmarkDominicaDominican RepublicEastern AfricaEastern AsiaEastern EuropeEcuadorEgyptEl SalvadorEnglandEritreaEthiopiaEuropeFijiFranceGermanyGhanaGreeceGrenadaGuatemalaGuyanaHaitiHondurasHong KongHungaryIndiaIndonesiaIranIraqIrelandIsraelItalyJamaicaJapanJordanKazakhstanKenyaKoreaKuwaitLaosLatin AmericaLatviaLebanonLiberiaLithuaniaMalaysiaMexicoMicronesiaMiddle AfricaMoldovaMoroccoNepalNetherlandsNicaraguaNigeriaNorth AmericaNorth MacedoniaNorthern AfricaNorthern EuropeNorwayOceaniaPakistanPanamaPeruPhilippinesPolandPortugalRomaniaRussiaSaudi ArabiaScotlandSenegalSerbiaSierra LeoneSingaporeSomaliaSouth AfricaSouth AmericaSouth Central AsiaSouth Eastern AsiaSouthern EuropeSpainSri LankaSt. Vincent and the GrenadinesSudanSwedenSwitzerlandSyriaTaiwanThailandTrinidad and TobagoTurkeyUgandaUkraineUruguayUzbekistanVenezuelaVietnamWest IndiesWestern AfricaWestern AsiaWestern EuropeYemenZaireZimbabweAzores
Argentinean
Race
Ancestry
AfghanAfricanAlaska NativeAlaskan AthabascanAlbanianAleutAlsatianAmericanApacheArabArapahoArgentineanArmenianAssyrian/Chaldean/SyriacAustralianAustrianBahamianBangladeshiBarbadianBasqueBelgianBelizeanBermudanBhutaneseBlackfeetBolivianBrazilianBritishBritish West IndianBulgarianBurmeseCajunCambodianCanadianCape VerdeanCarpatho RusynCelticCentral AmericanCentral American IndianCherokeeCheyenneChickasawChileanChineseChippewaChoctawColombianColvilleComancheCosta RicanCreeCreekCroatianCrowCubanCypriotCzechCzechoslovakianDanishDelawareDominicanDutchDutch West IndianEastern EuropeanEcuadorianEgyptianEnglishEstonianEthiopianEuropeanFijianFilipinoFinnishFrenchFrench American IndianFrench CanadianGermanGerman RussianGhanaianGreekGuamanian/ChamorroGuatemalanGuyaneseHaitianHmongHonduranHopiHoumaHungarianIcelanderIndian (Asian)IndonesianInupiatIranianIraqiIrishIroquoisIsraeliItalianJamaicanJapaneseJordanianKenyanKiowaKoreanLaotianLatvianLebaneseLiberianLithuanianLumbeeLuxembourgerMacedonianMalaysianMalteseMarshalleseMenomineeMexicanMexican American IndianMongolianMoroccanNative HawaiianNavajoNepaleseNew ZealanderNicaraguanNigerianNorthern EuropeanNorwegianOkinawanOsageOttawaPaiutePakistaniPalestinianPanamanianParaguayanPennsylvania GermanPeruvianPimaPolishPortuguesePotawatomiPuebloPuerto RicanPuget Sound SalishRomanianRussianSalvadoranSamoanScandinavianScotch-IrishScottishSeminoleSenegaleseSerbianShoshoneSierra LeoneanSiouxSlavicSlovakSloveneSomaliSouth AfricanSouth AmericanSouth American IndianSoviet UnionSpaniardSpanishSpanish AmericanSpanish American IndianSri LankanSubsaharan AfricanSudaneseSwedishSwissSyrianTaiwaneseThaiTlingit-HaidaTonganTrinidadian and TobagonianTsimshianTurkishU.S. Virgin IslanderUgandanUkrainianUruguayanUteVenezuelanVietnameseWelshWest IndianYakamaYaquiYugoslavianYumanYup'ikZimbabwean
Immigration
NonimmigrantsImmigrantsAfghanistanAfricaAlbaniaArgentinaArmeniaAsiaAustraliaAustriaBahamasBangladeshBarbadosBelarusBelgiumBelizeBoliviaBosnia and HerzegovinaBrazilBulgariaBurma/MyanmarCabo VerdeCambodiaCameroonCanadaCaribbeanCentral AmericaChileChinaColombiaCongoCosta RicaCroatiaCubaCzechoslovakiaDenmarkDominicaDominican RepublicEastern AfricaEastern AsiaEastern EuropeEcuadorEgyptEl SalvadorEnglandEritreaEthiopiaEuropeFijiFranceGermanyGhanaGreeceGrenadaGuatemalaGuyanaHaitiHondurasHong KongHungaryIndiaIndonesiaIranIraqIrelandIsraelItalyJamaicaJapanJordanKazakhstanKenyaKoreaKuwaitLaosLatin AmericaLatviaLebanonLiberiaLithuaniaMalaysiaMexicoMicronesiaMiddle AfricaMoldovaMoroccoNepalNetherlandsNicaraguaNigeriaNorth AmericaNorth MacedoniaNorthern AfricaNorthern EuropeNorwayOceaniaPakistanPanamaPeruPhilippinesPolandPortugalRomaniaRussiaSaudi ArabiaScotlandSenegalSerbiaSierra LeoneSingaporeSomaliaSouth AfricaSouth AmericaSouth Central AsiaSouth Eastern AsiaSouthern EuropeSpainSri LankaSt. Vincent and the GrenadinesSudanSwedenSwitzerlandSyriaTaiwanThailandTrinidad and TobagoTurkeyUgandaUkraineUruguayUzbekistanVenezuelaVietnamWest IndiesWestern AfricaWestern AsiaWestern EuropeYemenZaireZimbabweAzores
Single Mother Poverty
Income
Poverty
Unemployment
Labor Participation
Family Structure
Vehicle Availability
Education Level
Disability

Single Mother Poverty Comparison

Tohono O'odham

Argentineans

Tragic
Exceptional
43.0%
SINGLE MOTHER POVERTY
0.0/ 100
METRIC RATING
344th/ 347
METRIC RANK
27.2%
SINGLE MOTHER POVERTY
99.6/ 100
METRIC RATING
58th/ 347
METRIC RANK

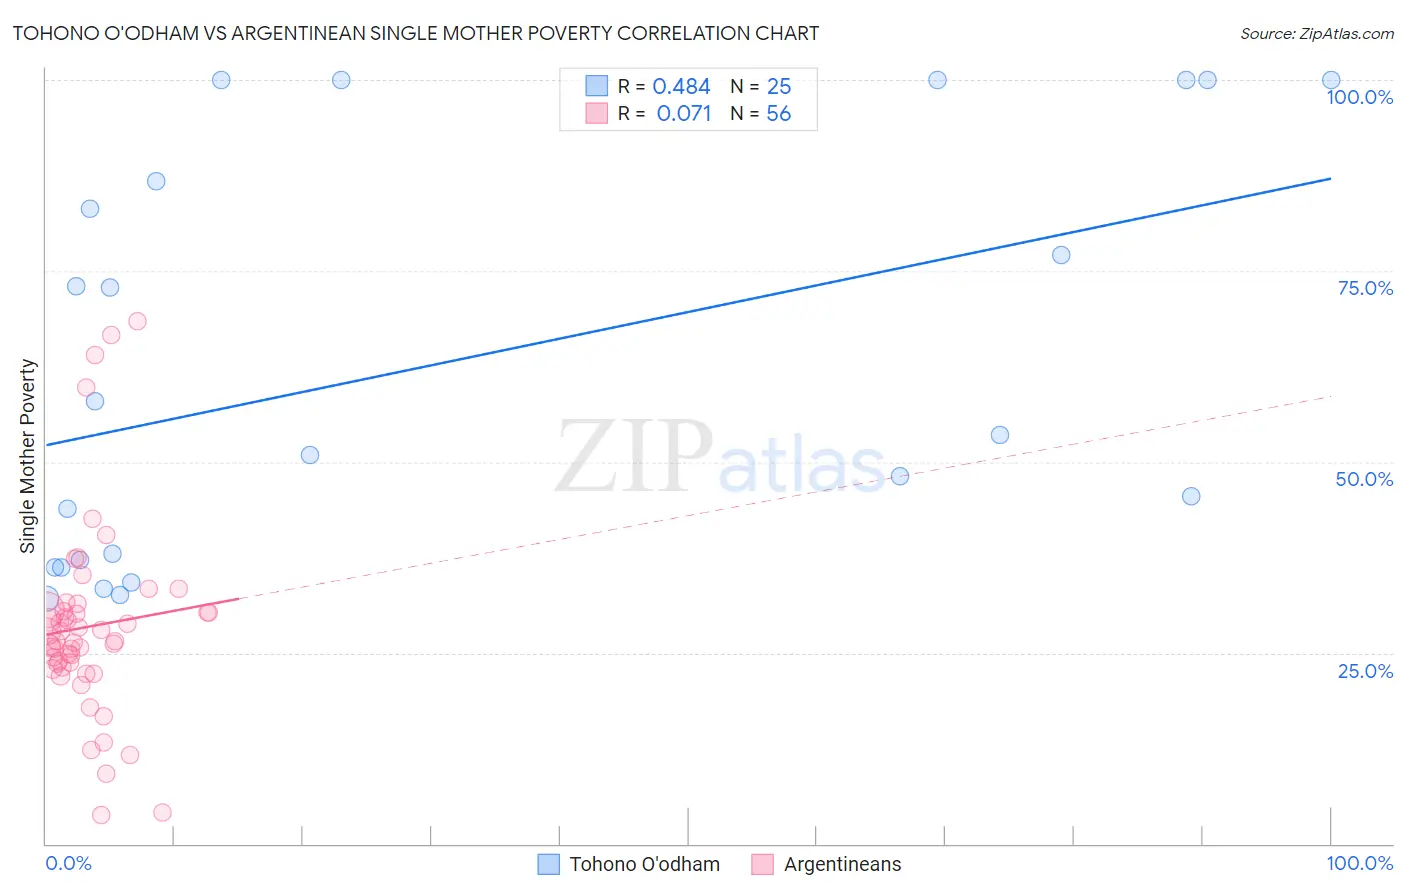
Tohono O'odham vs Argentinean Single Mother Poverty Correlation Chart

The statistical analysis conducted on geographies consisting of 58,556,531 people shows a moderate positive correlation between the proportion of Tohono O'odham and poverty level among single mothers in the United States with a correlation coefficient (R) of 0.484 and weighted average of 43.0%. Similarly, the statistical analysis conducted on geographies consisting of 291,528,298 people shows a slight positive correlation between the proportion of Argentineans and poverty level among single mothers in the United States with a correlation coefficient (R) of 0.071 and weighted average of 27.2%, a difference of 58.2%.
Tohono O'odham vs Argentinean Single Mother Poverty

Single Mother Poverty Correlation Summary

MeasurementTohono O'odhamArgentinean
Minimum32.1%3.7%
Maximum100.0%68.3%
Range67.9%64.6%
Mean62.9%28.4%
Median53.5%26.5%
Interquartile 25% (IQ1)36.6%23.3%
Interquartile 75% (IQ3)93.4%30.6%
Interquartile Range (IQR)56.8%7.3%
Standard Deviation (Sample)26.7%12.7%
Standard Deviation (Population)26.1%12.6%

Similar Demographics by Single Mother Poverty

Demographics Similar to Tohono O'odham by Single Mother Poverty

In terms of single mother poverty, the demographic groups most similar to Tohono O'odham are Lumbee (43.2%, a difference of 0.49%), Houma (43.5%, a difference of 1.1%), Puerto Rican (44.5%, a difference of 3.5%), Cajun (40.3%, a difference of 6.7%), and Navajo (40.2%, a difference of 7.0%).
DemographicsRating | RankSingle Mother Poverty
Menominee
0.0
/100
|
#333
Tragic
37.1%
Pueblo
0.0
/100
|
#334
Tragic
37.2%
Yuman
0.0
/100
|
#335
Tragic
37.8%
Cheyenne
0.0
/100
|
#336
Tragic
38.5%
Immigrants | Yemen
0.0
/100
|
#337
Tragic
38.5%
Pima
0.0
/100
|
#338
Tragic
38.6%
Crow
0.0
/100
|
#339
Tragic
38.6%
Sioux
0.0
/100
|
#340
Tragic
38.8%
Colville
0.0
/100
|
#341
Tragic
39.3%
Navajo
0.0
/100
|
#342
Tragic
40.2%
Cajuns
0.0
/100
|
#343
Tragic
40.3%
Tohono O'odham
0.0
/100
|
#344
Tragic
43.0%
Lumbee
0.0
/100
|
#345
Tragic
43.2%
Houma
0.0
/100
|
#346
Tragic
43.5%
Puerto Ricans
0.0
/100
|
#347
Tragic
44.5%

Demographics Similar to Argentineans by Single Mother Poverty

In terms of single mother poverty, the demographic groups most similar to Argentineans are Paraguayan (27.2%, a difference of 0.010%), Eastern European (27.2%, a difference of 0.050%), Palestinian (27.2%, a difference of 0.15%), Immigrants from Eastern Europe (27.2%, a difference of 0.16%), and Immigrants from Romania (27.2%, a difference of 0.18%).
DemographicsRating | RankSingle Mother Poverty
Immigrants | Argentina
99.7
/100
|
#51
Exceptional
27.1%
Immigrants | South Eastern Asia
99.7
/100
|
#52
Exceptional
27.1%
Immigrants | Jordan
99.7
/100
|
#53
Exceptional
27.1%
Immigrants | Bulgaria
99.7
/100
|
#54
Exceptional
27.1%
Immigrants | Egypt
99.7
/100
|
#55
Exceptional
27.1%
Immigrants | Romania
99.7
/100
|
#56
Exceptional
27.2%
Palestinians
99.7
/100
|
#57
Exceptional
27.2%
Argentineans
99.6
/100
|
#58
Exceptional
27.2%
Paraguayans
99.6
/100
|
#59
Exceptional
27.2%
Eastern Europeans
99.6
/100
|
#60
Exceptional
27.2%
Immigrants | Eastern Europe
99.6
/100
|
#61
Exceptional
27.2%
Immigrants | Malaysia
99.5
/100
|
#62
Exceptional
27.3%
Immigrants | Northern Europe
99.5
/100
|
#63
Exceptional
27.3%
Russians
99.5
/100
|
#64
Exceptional
27.3%
Immigrants | Turkey
99.5
/100
|
#65
Exceptional
27.3%