Tlingit-Haida vs Scottish Child Poverty Among Boys Under 16
COMPARE
Tlingit-Haida
Scottish
Child Poverty Among Boys Under 16
Child Poverty Among Boys Under 16 Comparison
Tlingit-Haida
Scottish
15.3%
CHILD POVERTY AMONG BOYS UNDER 16
92.2/ 100
METRIC RATING
124th/ 347
METRIC RANK
15.2%
CHILD POVERTY AMONG BOYS UNDER 16
93.0/ 100
METRIC RATING
121st/ 347
METRIC RANK
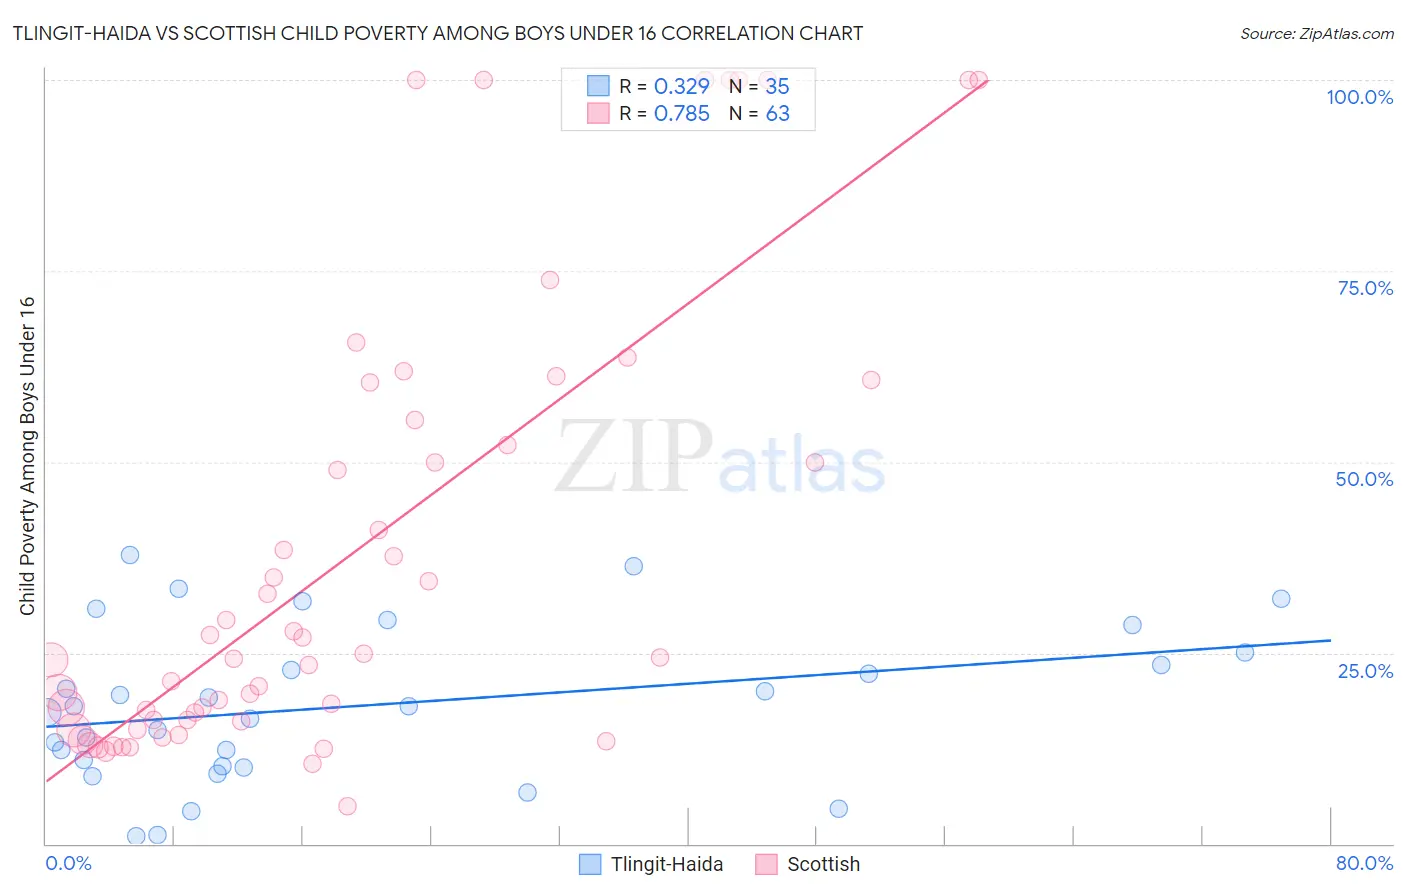
Tlingit-Haida vs Scottish Child Poverty Among Boys Under 16 Correlation Chart
The statistical analysis conducted on geographies consisting of 60,443,448 people shows a mild positive correlation between the proportion of Tlingit-Haida and poverty level among boys under the age of 16 in the United States with a correlation coefficient (R) of 0.329 and weighted average of 15.3%. Similarly, the statistical analysis conducted on geographies consisting of 546,371,305 people shows a strong positive correlation between the proportion of Scottish and poverty level among boys under the age of 16 in the United States with a correlation coefficient (R) of 0.785 and weighted average of 15.2%, a difference of 0.33%.
Child Poverty Among Boys Under 16 Correlation Summary
| Measurement | Tlingit-Haida | Scottish |
| Minimum | 0.92% | 5.0% |
| Maximum | 37.8% | 100.0% |
| Range | 36.9% | 95.0% |
| Mean | 18.1% | 37.8% |
| Median | 18.0% | 24.3% |
| Interquartile 25% (IQ1) | 10.2% | 16.0% |
| Interquartile 75% (IQ3) | 25.0% | 55.6% |
| Interquartile Range (IQR) | 14.8% | 39.5% |
| Standard Deviation (Sample) | 10.0% | 29.2% |
| Standard Deviation (Population) | 9.9% | 29.0% |
Demographics Similar to Tlingit-Haida and Scottish by Child Poverty Among Boys Under 16
In terms of child poverty among boys under 16, the demographic groups most similar to Tlingit-Haida are Immigrants from Norway (15.3%, a difference of 0.010%), Czechoslovakian (15.3%, a difference of 0.070%), Immigrants from Malaysia (15.3%, a difference of 0.23%), South African (15.2%, a difference of 0.34%), and Belgian (15.2%, a difference of 0.39%). Similarly, the demographic groups most similar to Scottish are South African (15.2%, a difference of 0.010%), Belgian (15.2%, a difference of 0.060%), Immigrants from Malaysia (15.3%, a difference of 0.10%), Native Hawaiian (15.2%, a difference of 0.18%), and Immigrants from Vietnam (15.2%, a difference of 0.24%).
| Demographics | Rating | Rank | Child Poverty Among Boys Under 16 |
| Basques | 93.8 /100 | #112 | Exceptional 15.2% |
| Irish | 93.8 /100 | #113 | Exceptional 15.2% |
| Immigrants | Ukraine | 93.6 /100 | #114 | Exceptional 15.2% |
| Armenians | 93.6 /100 | #115 | Exceptional 15.2% |
| Immigrants | South Eastern Asia | 93.5 /100 | #116 | Exceptional 15.2% |
| Immigrants | Vietnam | 93.5 /100 | #117 | Exceptional 15.2% |
| Native Hawaiians | 93.4 /100 | #118 | Exceptional 15.2% |
| Belgians | 93.1 /100 | #119 | Exceptional 15.2% |
| South Africans | 93.0 /100 | #120 | Exceptional 15.2% |
| Scottish | 93.0 /100 | #121 | Exceptional 15.2% |
| Immigrants | Malaysia | 92.8 /100 | #122 | Exceptional 15.3% |
| Immigrants | Norway | 92.3 /100 | #123 | Exceptional 15.3% |
| Tlingit-Haida | 92.2 /100 | #124 | Exceptional 15.3% |
| Czechoslovakians | 92.1 /100 | #125 | Exceptional 15.3% |
| Palestinians | 91.3 /100 | #126 | Exceptional 15.4% |
| Carpatho Rusyns | 91.1 /100 | #127 | Exceptional 15.4% |
| Canadians | 90.6 /100 | #128 | Exceptional 15.4% |
| Immigrants | Brazil | 90.3 /100 | #129 | Exceptional 15.4% |
| Mongolians | 90.2 /100 | #130 | Exceptional 15.4% |
| Immigrants | Western Europe | 90.0 /100 | #131 | Exceptional 15.4% |
| Immigrants | Kazakhstan | 88.7 /100 | #132 | Excellent 15.5% |