Tlingit-Haida vs Bangladeshi Single Male Poverty
COMPARE
Tlingit-Haida
Bangladeshi
Single Male Poverty
Single Male Poverty Comparison
Tlingit-Haida
Bangladeshis
11.6%
SINGLE MALE POVERTY
99.9/ 100
METRIC RATING
49th/ 347
METRIC RANK
13.3%
SINGLE MALE POVERTY
3.7/ 100
METRIC RATING
235th/ 347
METRIC RANK
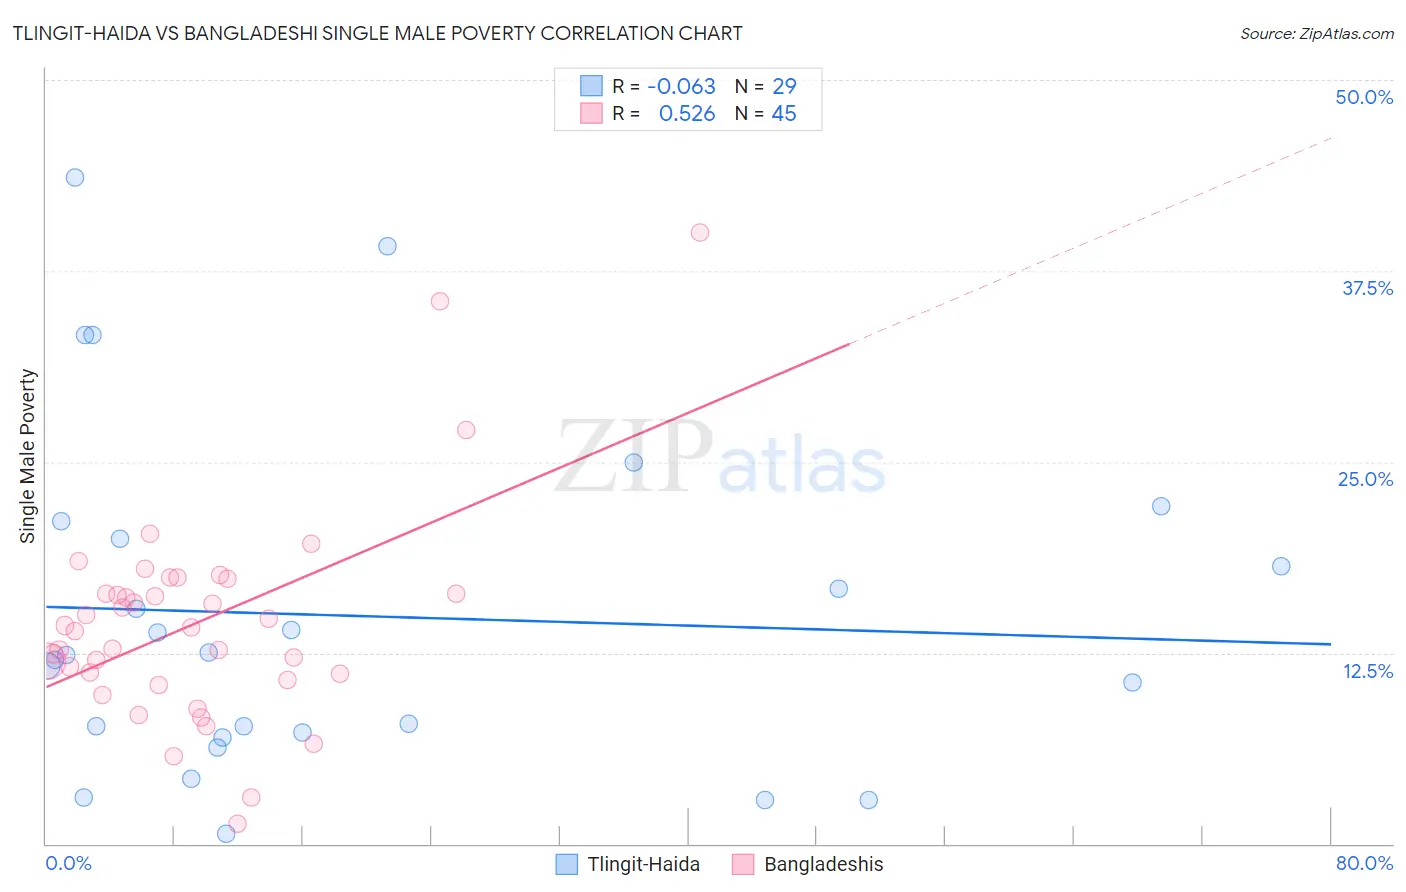
Tlingit-Haida vs Bangladeshi Single Male Poverty Correlation Chart
The statistical analysis conducted on geographies consisting of 58,517,751 people shows a slight negative correlation between the proportion of Tlingit-Haida and poverty level among single males in the United States with a correlation coefficient (R) of -0.063 and weighted average of 11.6%. Similarly, the statistical analysis conducted on geographies consisting of 134,113,248 people shows a substantial positive correlation between the proportion of Bangladeshis and poverty level among single males in the United States with a correlation coefficient (R) of 0.526 and weighted average of 13.3%, a difference of 15.1%.
Single Male Poverty Correlation Summary
| Measurement | Tlingit-Haida | Bangladeshi |
| Minimum | 0.66% | 1.3% |
| Maximum | 43.6% | 40.0% |
| Range | 43.0% | 38.7% |
| Mean | 14.9% | 14.5% |
| Median | 12.4% | 14.1% |
| Interquartile 25% (IQ1) | 7.1% | 10.9% |
| Interquartile 75% (IQ3) | 20.6% | 16.9% |
| Interquartile Range (IQR) | 13.5% | 5.9% |
| Standard Deviation (Sample) | 11.1% | 6.9% |
| Standard Deviation (Population) | 10.9% | 6.8% |
Similar Demographics by Single Male Poverty
Demographics Similar to Tlingit-Haida by Single Male Poverty
In terms of single male poverty, the demographic groups most similar to Tlingit-Haida are Immigrants from Indonesia (11.6%, a difference of 0.020%), Immigrants from Lithuania (11.6%, a difference of 0.060%), Nepalese (11.6%, a difference of 0.10%), Paraguayan (11.6%, a difference of 0.17%), and Immigrants from Bulgaria (11.6%, a difference of 0.29%).
| Demographics | Rating | Rank | Single Male Poverty |
| Egyptians | 99.9 /100 | #42 | Exceptional 11.5% |
| Immigrants | Peru | 99.9 /100 | #43 | Exceptional 11.5% |
| Immigrants | Cameroon | 99.9 /100 | #44 | Exceptional 11.5% |
| Immigrants | Poland | 99.9 /100 | #45 | Exceptional 11.5% |
| Immigrants | Bulgaria | 99.9 /100 | #46 | Exceptional 11.6% |
| Nepalese | 99.9 /100 | #47 | Exceptional 11.6% |
| Immigrants | Indonesia | 99.9 /100 | #48 | Exceptional 11.6% |
| Tlingit-Haida | 99.9 /100 | #49 | Exceptional 11.6% |
| Immigrants | Lithuania | 99.9 /100 | #50 | Exceptional 11.6% |
| Paraguayans | 99.9 /100 | #51 | Exceptional 11.6% |
| Samoans | 99.9 /100 | #52 | Exceptional 11.7% |
| Bulgarians | 99.9 /100 | #53 | Exceptional 11.7% |
| Immigrants | Uzbekistan | 99.9 /100 | #54 | Exceptional 11.7% |
| Cypriots | 99.9 /100 | #55 | Exceptional 11.7% |
| Burmese | 99.8 /100 | #56 | Exceptional 11.7% |
Demographics Similar to Bangladeshis by Single Male Poverty
In terms of single male poverty, the demographic groups most similar to Bangladeshis are Luxembourger (13.4%, a difference of 0.050%), British (13.3%, a difference of 0.10%), Canadian (13.3%, a difference of 0.10%), British West Indian (13.4%, a difference of 0.11%), and Immigrants from Ghana (13.4%, a difference of 0.21%).
| Demographics | Rating | Rank | Single Male Poverty |
| Lebanese | 6.6 /100 | #228 | Tragic 13.2% |
| Europeans | 6.2 /100 | #229 | Tragic 13.3% |
| Ghanaians | 6.1 /100 | #230 | Tragic 13.3% |
| Slavs | 5.3 /100 | #231 | Tragic 13.3% |
| Immigrants | Caribbean | 5.0 /100 | #232 | Tragic 13.3% |
| British | 4.0 /100 | #233 | Tragic 13.3% |
| Canadians | 4.0 /100 | #234 | Tragic 13.3% |
| Bangladeshis | 3.7 /100 | #235 | Tragic 13.3% |
| Luxembourgers | 3.6 /100 | #236 | Tragic 13.4% |
| British West Indians | 3.4 /100 | #237 | Tragic 13.4% |
| Immigrants | Ghana | 3.2 /100 | #238 | Tragic 13.4% |
| Czechoslovakians | 3.0 /100 | #239 | Tragic 13.4% |
| Belizeans | 2.3 /100 | #240 | Tragic 13.4% |
| Immigrants | Germany | 2.1 /100 | #241 | Tragic 13.4% |
| Carpatho Rusyns | 2.1 /100 | #242 | Tragic 13.4% |