Thai vs Immigrants from Vietnam Child Poverty Among Girls Under 16
COMPARE
Thai
Immigrants from Vietnam
Child Poverty Among Girls Under 16
Child Poverty Among Girls Under 16 Comparison
Thais
Immigrants from Vietnam
11.8%
CHILD POVERTY AMONG GIRLS UNDER 16
100.0/ 100
METRIC RATING
5th/ 347
METRIC RANK
15.5%
CHILD POVERTY AMONG GIRLS UNDER 16
88.2/ 100
METRIC RATING
138th/ 347
METRIC RANK
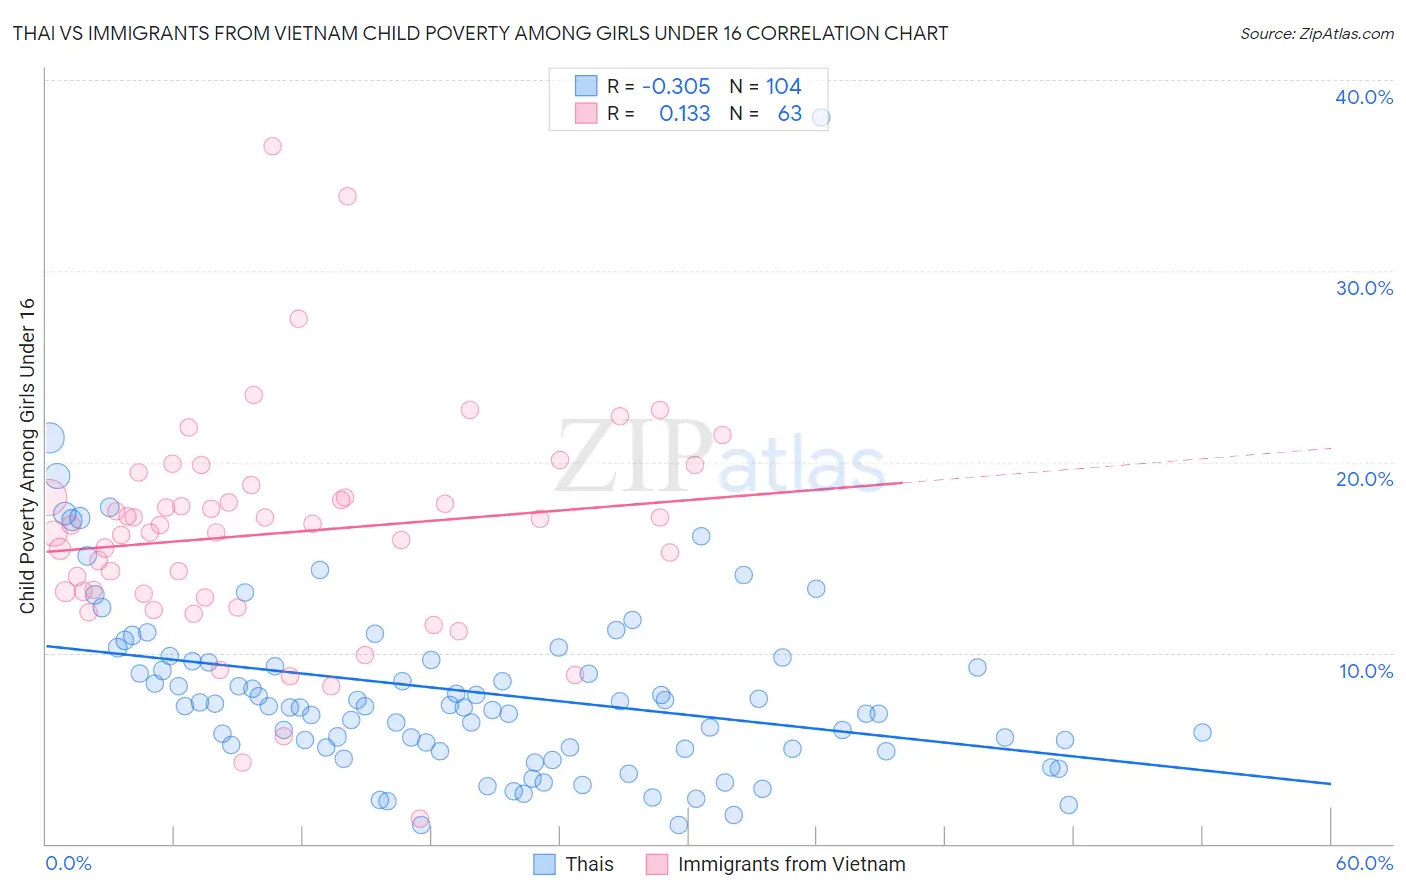
Thai vs Immigrants from Vietnam Child Poverty Among Girls Under 16 Correlation Chart
The statistical analysis conducted on geographies consisting of 464,276,547 people shows a mild negative correlation between the proportion of Thais and poverty level among girls under the age of 16 in the United States with a correlation coefficient (R) of -0.305 and weighted average of 11.8%. Similarly, the statistical analysis conducted on geographies consisting of 398,322,912 people shows a poor positive correlation between the proportion of Immigrants from Vietnam and poverty level among girls under the age of 16 in the United States with a correlation coefficient (R) of 0.133 and weighted average of 15.5%, a difference of 31.2%.
Child Poverty Among Girls Under 16 Correlation Summary
| Measurement | Thai | Immigrants from Vietnam |
| Minimum | 0.97% | 1.3% |
| Maximum | 38.0% | 36.6% |
| Range | 37.1% | 35.2% |
| Mean | 8.0% | 16.3% |
| Median | 7.2% | 16.7% |
| Interquartile 25% (IQ1) | 5.0% | 13.1% |
| Interquartile 75% (IQ3) | 9.6% | 18.2% |
| Interquartile Range (IQR) | 4.6% | 5.0% |
| Standard Deviation (Sample) | 5.1% | 5.8% |
| Standard Deviation (Population) | 5.1% | 5.8% |
Similar Demographics by Child Poverty Among Girls Under 16
Demographics Similar to Thais by Child Poverty Among Girls Under 16
In terms of child poverty among girls under 16, the demographic groups most similar to Thais are Tsimshian (11.5%, a difference of 3.0%), Filipino (11.4%, a difference of 3.6%), Immigrants from Hong Kong (12.3%, a difference of 4.3%), Chinese (12.3%, a difference of 4.4%), and Immigrants from Taiwan (11.3%, a difference of 4.5%).
| Demographics | Rating | Rank | Child Poverty Among Girls Under 16 |
| Immigrants | India | 100.0 /100 | #1 | Exceptional 11.0% |
| Immigrants | Taiwan | 100.0 /100 | #2 | Exceptional 11.3% |
| Filipinos | 100.0 /100 | #3 | Exceptional 11.4% |
| Tsimshian | 100.0 /100 | #4 | Exceptional 11.5% |
| Thais | 100.0 /100 | #5 | Exceptional 11.8% |
| Immigrants | Hong Kong | 100.0 /100 | #6 | Exceptional 12.3% |
| Chinese | 100.0 /100 | #7 | Exceptional 12.3% |
| Iranians | 100.0 /100 | #8 | Exceptional 12.4% |
| Immigrants | Singapore | 100.0 /100 | #9 | Exceptional 12.5% |
| Immigrants | Iran | 100.0 /100 | #10 | Exceptional 12.6% |
| Immigrants | South Central Asia | 100.0 /100 | #11 | Exceptional 12.7% |
| Bhutanese | 100.0 /100 | #12 | Exceptional 12.7% |
| Immigrants | Ireland | 99.9 /100 | #13 | Exceptional 12.9% |
| Burmese | 99.9 /100 | #14 | Exceptional 13.0% |
| Okinawans | 99.9 /100 | #15 | Exceptional 13.0% |
Demographics Similar to Immigrants from Vietnam by Child Poverty Among Girls Under 16
In terms of child poverty among girls under 16, the demographic groups most similar to Immigrants from Vietnam are Armenian (15.5%, a difference of 0.10%), South African (15.5%, a difference of 0.13%), Native Hawaiian (15.5%, a difference of 0.22%), Czechoslovakian (15.5%, a difference of 0.24%), and Immigrants from Spain (15.5%, a difference of 0.27%).
| Demographics | Rating | Rank | Child Poverty Among Girls Under 16 |
| Immigrants | Western Europe | 90.0 /100 | #131 | Exceptional 15.4% |
| Mongolians | 89.7 /100 | #132 | Excellent 15.4% |
| Brazilians | 89.6 /100 | #133 | Excellent 15.4% |
| Immigrants | Spain | 89.1 /100 | #134 | Excellent 15.5% |
| Czechoslovakians | 89.0 /100 | #135 | Excellent 15.5% |
| Native Hawaiians | 89.0 /100 | #136 | Excellent 15.5% |
| South Africans | 88.7 /100 | #137 | Excellent 15.5% |
| Immigrants | Vietnam | 88.2 /100 | #138 | Excellent 15.5% |
| Armenians | 87.9 /100 | #139 | Excellent 15.5% |
| New Zealanders | 87.2 /100 | #140 | Excellent 15.6% |
| Immigrants | Jordan | 87.2 /100 | #141 | Excellent 15.6% |
| Canadians | 87.1 /100 | #142 | Excellent 15.6% |
| Immigrants | Peru | 86.6 /100 | #143 | Excellent 15.6% |
| Israelis | 86.3 /100 | #144 | Excellent 15.6% |
| Welsh | 85.4 /100 | #145 | Excellent 15.6% |